Abstract
A businesses with a green label is associated with resources that are sustainable. This business is linked to the green economy, which can be described as a form of economy that is responsible in relation to the environment and economic growth, and thus complementary. In this type of economy, viable products are created, but also solutions and practices that take the environment into account. It is well known that eco-innovation activities are closely linked to the development of an eco-business. The research sample consisted of 10 countries, namely the Slovak Republic, the Czech Republic, Poland, Hungary, Austria, Germany, France, Italy, Sweden, and Finland, which were selected by purposive sampling. In this article, we look at eco innovations in selected countries, specifically ranking them, where we have divided countries into different levels, from countries that are at the super eco-innovation level, to countries that are in the middle zone, to countries that are significantly lagging in this trend. To classify countries into each level, we looked at the following variables: eco-innovation inputs, eco-innovation activities, environmental outcomes, socio-economic outcomes, and the eco-innovation index itself. Taking these sub-results into account, we determined where countries are, in other words, which level they have reached. We found that there are significant differences between countries. As we conclude, there are several reasons for this, but one of them is the lack of communication, coordination, and synergy between institutions, government, and SMEs, which are the drivers of eco-innovation. The supporting quantitative data collection method was data collection and structured observation, which is more precise and therefore provides more detailed information about the reality under study. For the purpose of this thesis, data were obtained from the Statistical Office of the European Union, that is, Eurostat, which is responsible for publishing pan-European statistics and indicators that allowed us to compare countries. In the survey, we compared the five most recent years for which Eurostat data were available, namely 2017, 2018, 2019, 2020, and 2021. The overall score of a European Union member state is calculated as the unweighted average of 16 sub-indicators. It shows how well each Member State performs in terms of eco-innovation compared to the European Union average of 100.
1. Introduction
The sustainable development of regions in the EU is now a frequently discussed topic, particularly due to the evolution of the current global situation. The world economy is, to a significant extent based, on heavy industry, which is not friendly to the environment or to the people who are part of it [1]. The environmental sustainability status of businesses in Slovakia is below the European average. Solving problems related to environmental protection, preserving biodiversity, limiting pollution, and saving natural resources is a very complex and lengthy process. The fact that the environment is marginalized in the economy is the main cause of the variety of critical situations we face, including financial, economic, and environmental. Our lifestyles are conditioned to use resources through their constant processing, which causes inefficiency, waste, and disposal. Products produced today are often not reusable, and only a small number are recycled through chemical, mechanical, or biological processes. The question then arises, how to achieve sustainability of products and production for the future?
The concept of eco-innovation was first proposed by Fussler and James [2]. It refers to the so-called a double effect aimed at reducing the negative impact on the environment on the one hand, and bringing business value to enterprises on the other hand. This definition applies not only to technology, but also to knowledge-based services and innovations or organizational approaches [3]. The term “eco-innovation” refers to innovative products, processes, or organizational innovations that reduce environmental costs, increase social acceptance, and contribute to sustainable development [4]. The concept of EI is often replaced by other terms: environmental innovation, ecological innovation, or sustainable innovation [5]. The concept is considered interdisciplinary mainly due to the involvement in this field of economics or management [6].
As already mentioned, the research of SMEs’ eco-innovation (EI) has recently gained a lot of interest, although few studies provide a complete “research panorama” [7]. Research topics changed very quickly. Since 1998, when Kemp and Arundel [8] found that eco-innovations can be implemented in three aspects: technology, organization, and marketing, there has not been much research on the definition, comparison, and integration of the EI SME category. Only 2014 brought a breakthrough in the development of knowledge bases in this field. The research of Porter [9] and Klewitz [10] attracted so much attention that there was a sharp jump in the amount of literature by scientists from developing countries [7].
The literature on the subject includes, for example, studies on the bioeconomy area in selected highly and medium-developed countries [11], measuring EI efficiency of the organization for economic co-operation and development (OECD) countries, and tracking their changes with the Malmquist productivity index (MPI) [12]. However, they concern the period 2001–2018, which makes it impossible to make any comparisons. In other literature, you can find studies that take into account eco-design [13], green practices throughout the supply chain and cleaner production [14,15], application of product sustainability [16], or environmental management [17].
Eco-innovation is, according to O’Hare et al. the development and application of a business model that is shaped by a new business strategy that embraces sustainability in all life cycle-based business operations [18,19]. With the advent of Industry 4.0 and 5.0, the effect of which is the use of advanced digital solutions in technological and process areas [20], such as the Internet of Things (IoT) [21,22,23], cyber-physical systems [24,25,26], and artificial intelligence (AI) [27,28,29], businesses should now focus on the green economy and the Green Deal [30,31]. This should be the starting point for policy formulation and the springboard for planned measures implemented in different sectors of the economy or in the everyday life of businesses. The need to implement the Green Economy stems from the current state of the environment and social and economic trends. Current topics discussed by practitioners address the green economy in relation to key environmental issues such as climate change, biodiversity loss, irrational use of natural resources and ecosystem services, unsustainable production, and consumption [32,33]. The sustainability of businesses for the future is also an issue that needs to be addressed today. The European Union’s objective is to obtain transparent, credible, and comparable information on the state of the environmental impacts of manufacturing and non-manufacturing enterprises and the subsequent implementation of innovations and green technologies leading to the sustainable development of enterprises for the future. There are various prerequisites for a company to become green. These can be, for example, substitution of raw materials, changes in production processes, various innovations to introduce new products (eco-innovation), or management or governance of the entire value chain of a given service to minimize its external environmental impacts [34,35]. The green economy is most often perceived in connection with products that can be labelled as eco, organic, or green products. The green sector mainly touches on manufacturing, engineering, e-electro mobiles, textiles, food, and others that have an impact on our environment, but also on humans [36,37,38]. We must first think holistically and systematically and reach consensus on a common green vision based on mutual understanding and expert discussion with the participation of all sectors of society. Next, we need to create an appropriate framework for governance, economic incentives, and new eco-friendly business models. The goal should be to ensure that these policies and their implementation contribute to long-term sustainable economic, social, and environmental prosperity in line with international initiatives such as the UN Sustainable Development Agenda and the Paris Agreement [9,39]. In the current 4th programming period 2021–2027, the EU is beginning to talk very actively about the need to build a “green economy” and to introduce innovative measures and solutions which, compared to traditional ones, will result in better use of resources and a more significant elimination of negative impacts on the environment. The term eco-innovation is thus appearing more and more frequently in the international economy [40]. The European Commission assesses the environmental innovation performance of Member States through the Eco-Innovation Scoreboard. Countries are categorized into three groups: leaders such as Germany, Finland, and Denmark; average countries, including Slovakia, along with the Netherlands, the Czech Republic, and Italy; and catching-up countries, including Belgium, Poland, Romania, and Hungary. Slovakia’s eco-innovation theme is divided like the EUs in different sectors such as environment, economy, agriculture, and education. Eco-innovation themes are embedded in several documents, such as the Draft Energy Policy, the Waste Management Program, or the Slovak Environmental Strategy 2030 [41]. A large amount of funding has been allocated in the EU and at the national level to support eco-innovation, which can also be used by Slovak companies in cooperation with partners from the research or academic sectors.
Eco-innovation is also beginning to attract more attention in Slovakia, which, in terms of its location, economic structure, education, and available resources, has the prerequisites for an interesting development of eco-innovation in both the public and private sectors. In particular, the environment of small and medium-sized enterprises (SMEs) offers opportunities for various improvement projects or start-up solutions that can help SMEs to break through on the domestic, European, and global market [42]. Due to the European Commission, [30,31] small and medium-sized enterprises (SMEs) are seen as the “backbone” of the economy. About 25 million SMEs produce more than 50% of Europe’s GDP. They account for almost of all EU businesses (99%) and provide almost three quarters of all jobs [43]. Although becoming green is as easy for SMEs as it is for large companies, and only 25% of all SMEs provide green goods or services [30,31]. SMEs can be eco-innovators, eco-entrepreneurs, or eco-adopters [36]. Eco-innovators are small and newly established companies introducing ground-breaking innovations, eco-entrepreneurs realize certain opportunities, and eco-adopters only comply with environmental regulations [42]. For today’s entrepreneurs, being competitive means being innovative and being green [37,38]. The most important category of green SMEs is eco-innovative in forms of eco-product innovation, eco-process innovation, and eco-organizational innovation [44,45]. Green growth is a challenge for today’s entrepreneurs, because of the combination of economic and sustainable development goals concurrently. Eco-innovations inspire new business models [46], that is why there is a need for responsible and sustainable business models (offering green products or services). Innovative activity is undoubtedly related to the economic development of each country [38]. “Green entrepreneurs are fundamental pillars of the sustainable economic development” [40]. Starting a green business brings many benefits. We can talk about economic benefits, which are associated with benefits that contribute to achieving an impact on business development and growth. In green entrepreneurship, there is often an opportunity to create a competitive advantage and to secure beneficial relationships with different groups of the population. Hand in hand with these mentioned advantages, we must not overlook the various activities related to innovation, activities ensuring the development of human resources, and also the reputation of the company and its organizational structure, as green entrepreneurship provides an excellent opportunity for entrepreneurs to create a good reputation for the company when they are in a situation in which, on the basis of reputation, they are able to avoid certain penalties, as they are able to meet the activities related to regulation by the state. A prerequisite of this business is also to avoid negative advertisements and reviews. Since with goodwill and good advertising, there should be no media involvement in these businesses which can be considered as avoiding the occurrence of disputes or their resolution in connection with environmental damage [45,47,48].
An integral part of this is the regular acquisition of new working relationships, which are often associated specifically with business, where a big plus is the establishment of these relationships with partners who have the same or similar focus in business. A final feature is the activation of innovation which is seen as a driver. In companies preferring green business, a strategy is created that also encourages employees to initiate on various newly introduced innovation processes to be targeted in areas that are related to that business. These innovation processes must be played together with the interests that the company wants to fulfill [49]. The priority goal of green growth that has been adopted in the strategy through the OECS is to reconcile the growth of the economy together with the sustainability of the environment and the strengthening of the relationship between nature and economies [36,50]. Similar to the green economy, growth with a green label defines a track through which it is possible to avoid the lagging economic situation created by the 2009 recession. This pathway allows one to see methods in which growth in the economy is continuously ensured along with the environment [19,35].
The conducted research demonstrates the importance of environmental and eco-innovation factors that affect regional sustainable development. The aim of article is to present a comprehensive view of the status of eco-innovation in the world and in the European Union environment. Particular attention is paid to eco-innovation in Slovakia. It evaluates the eco-innovation index and the eco-innovation activities of selected countries. It includes a managerial summary of the key identified facts of innovation assessment. The presented research thus creates a comprehensive view of the issue of eco-innovation with a special focus on its emergence and application in the conditions of Slovakia and other EU countries.
Addressing the research gaps identified above, we analyze the development, changes, and reasons for changes in eco-innovation policy in selected European countries during the period under review. In addition, this study looks for significant differences between the countries of the European Union, traces the direction towards the convergence goals, evaluates the development of eco-innovation in comparison with other common characteristics of the countries, and suggests possible measures that could improve the situation in the EU. This paper primarily solves the following questions: Defining ranges and classifying countries into them. Use of comparative methods and analysis of indicators. Based on the above, we compared average indicator levels for each thematic area and country for the certain period. The ranking made it possible to assign the analyzed countries to one of the adopted ranking groups. It also showed which areas are very problematic for them.
This article is divided into four parts. In Section 1, we discuss the current state of the art of measuring eco-innovation, and the challenges in general. In Section 2, we described the methods used to measure eco-innovation and the subject of the research. A brief overview of the variables and data is also presented in Section 2. In Section 3, we present the results of eco-innovation activities, environmental data, and also socio-economic data. Individual results are presented in clear tables and graphs. Section 4 discusses the reasons and possibilities for differences in results, and suggests conclusions, policy implications, and future research opportunities. A custom color scale of the results is also provided.
2. Materials and Methods
The research sample consisted of 10 countries: the Slovak Republic, the Czech Republic, Poland, Hungary, Austria, Germany, France, Italy, Sweden, and Finland, which were selected by purposive sampling.
The supporting quantitative method for data accumulation was data collection and structured observation, which is more precise and therefore provides more detailed information about the reality under study. For the purpose of this thesis, data was obtained from the Statistical Office of the European Union, that is, Eurostat, which is responsible for publishing pan-European statistics and indicators that allowed us to make comparisons between countries. In the survey, we compared the five most recent years for which data were available on Eurostat, which were 2017, 2018, 2019, 2020, and 2021. The methodological framework of the conducted research included several stages of analysis presented in Figure 1.
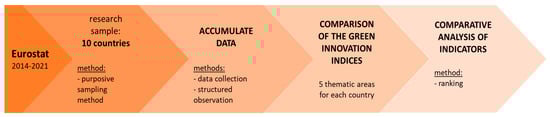
Figure 1.
Stages of activities undertaken in the study.
Based on the statistical data obtained, we compared the green innovation indices. The indicator is based on 16 sub-indicators in five thematic areas: eco-innovation inputs, eco-innovation activities, eco-innovation outputs, resource efficiency outcomes, and socio-economic outcomes. The overall score of a European Union Member State is calculated as an unweighted average of the 16 sub-indicators. It shows how well each Member State performs in eco-innovation compared to the European Union average of 100. The 10 countries under investigation were compared on the basis of the statistical data we collected on their eco-innovation indices. Innovation can play an important role in the transition towards a more resource-efficient economy. Innovation, especially eco-innovation, helps to develop new technologies, processes, products, services, and business models needed to change production and consumption patterns. Support for innovative projects relevant to resource efficiency and the circular economy is a key element of the Circular Economy Action Plan. An important indicator of environmental innovation, research, and development is the eco-innovation index, one of the thematic indicators in the European Union’s Resource Efficiency Scoreboard.
The level of indicators over the analyzed period did not change significantly, therefore it was decided to compare the average level for each country. This made it possible to show the structure and share of countries in each of the five thematic areas (components of the green innovation indicator). In addition, a comparative analysis of the average values of indicators (for the period 2014–2021) for countries in each of the thematic areas was carried out using the ranking method for this purpose. The obtained average values of the indicators for the analyzed 10 countries are arranged in a row. For the resulting ranking, appropriate assumptions were made for the positions occupied by the countries in the ranking. See the Table 1. Rank 1, 2, or 3 meant that the country ranks high and is doing well in the subject area, and we called it “super eco-innovation”. Countries whose positions in the ranking were between 4 and 7 were called “lightweight eco-innovation”, which means that they are average in these areas. They do not have the major problems of the third group, but they are also far from the countries with the highest ranking positions. The third group of countries is the so-called “grinding/desperate eco-innovation”, which occupy the last positions in the ranking, which means that they have huge problems in the thematic area. The ranking positions for this group are 8, 9, and 10. The joint ranking list showed in which and how many thematic areas related to innovation countries are doing well, and which are problematic for them and require improvement.

Table 1.
Assignment to a group depending on the occupied ranking position. (Own elaboration).
3. Results
As the data analysis shows, we looked at the following variables: eco-innovation inputs, eco-innovation activities, environmental results, socio-economic results, and eco-innovation index.
- Eco-innovation inputs
Eco-innovation inputs include government spending on environmental and energy science and research, people employed in science and research, and the amount of early-stage investment. Based on the data obtained, which can be seen in Table 2 and Figure 2. We can be conclude that Germany is the leader in science and research, scoring 154 points in 2021, an improvement of 1 point from the previous year. The years 2018 and 2019 followed a similar pattern for this country, with Germany scoring the same 153 points. In 2017, Germany scored 140 points in this category and improved by 14 points compared to 2021. Another country that pays significant attention to science and research is Finland, which scored 152 points in 2017. However, the following years were not so favorable for this country as it seems to have stopped investing funds in science and research, which is reflected in the score. In 2018, Finland scored 133 points in this category, in 2019 it scored only 132 points, in 2020 it scored 135 points, and in 2021 Finland started to pay attention to science and research again, bringing the score up to 143 points.
Table 2.
Eco-innovation inputs based on Eurostat.
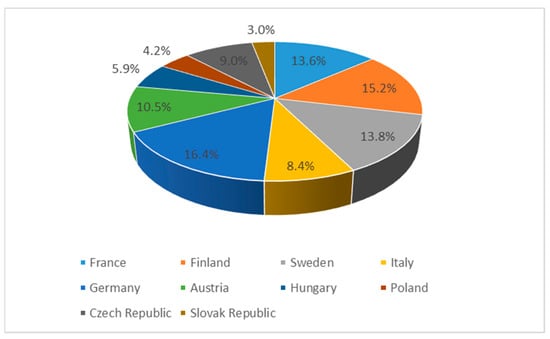
Figure 2.
Graphical interpretation of Average Eco-innovation inputs. (Own elaboration).
The top three are rounded off by Sweden, which has a significant level of support for science and research in its territory, which is reflected in its score of 139 for 2021, an improvement of up to 18 points on last year, which may be due to the fact that the country has employed more people in the science and research sector and has also been able to increase its government spending on this sector. If we look at other years, in 2017 this country scored 135 points, in 2018 it scored 122 points, and in 2019 it scored only 119 points. The worst scoring country is Poland, which scored at 30 points in 2021 and improved by 4 points compared to 2020. If we also look at past developments, Poland paid the most attention to science and research in 2017 and 2018, scoring 46 and 47 points respectively. Poland’s 2019 began to show a decline, with the country scoring 43 points. The second worst country in terms of science and research is the Slovak Republic, which scored 31 points in 2021, an improvement of just one point on last year. Looking at previous developments, Slovakia is investing in science and research, which is also reflected in the ranking. In 2017 and 2018, Slovakia scored the same 25 points in this category, with an increase of 1 point in 2019.
In the analyzed period, the highest level of average Eco-innovation inputs was achieved by Germany (150.6), see Table 3 and Figure 2. Considering the surveyed countries, this result is 16.4% in the structure of the average level of eco-innovation inputs. This result is more than 5 times higher than that achieved by the Slovak Republic (27.4), which has only 3% in the structure. Apart from Germany, only three other countries have an average score above 100 over a 5-year period. These are: Finland (139 or 15.2% in the structure), Sweden (127.2; 13.8% in the structure), and France (124.4; 13.6%). The average level of the eco-innovation inputs indicator for the entire period for the remaining five countries was between 38.4 for Poland and 96.4 for Austria. The sum of the 5-year average for the ten countries was 917.2.
Table 3.
Average Eco-innovation inputs.
- Eco-innovation activities
Eco-innovation activities include all enterprises that have introduced innovative activities aimed at reducing material inputs per unit of production; enterprises that have introduced innovative activities aimed at reducing energy consumption per unit of production as well as enterprises that have introduced an environmental management system. The data obtained can be seen in Table 4, and based on them it can be concluded that the largest number of enterprises that have introduced innovative activities in their business comes from the Czech Republic, which scored 152 points in 2021, an improvement of 2 points compared to the previous year. If we also look at previous developments, the Czech Republic has improved significantly. In 2017, it scored 141 points in this category, but in 2018 there was a drop, and the country scored 138 points. In 2019, there was again an increase and the Czech Republic scored 140 points. Sweden ranked second in the number of eco-innovation activities with a score of 143 points in 2021, with a drop of 10 points in this case compared to the previous year. This may be because companies that have introduced innovation activities may have gone out of business, losing points in the ranking. Compared to previous developments, Sweden has performed better in this category in the past period, as shown by the data in Table 2. In 2017 Sweden scored 148 points, in 2018 there was an increase of 5 points and in 2019 the country scored the highest in the whole 5 years, scoring 171 points.
Table 4.
Eco-innovation activities, based on Eurostat.
The top three are rounded off by France, which scored 116 points in 2021, an improvement of 1 point compared to 2020. Looking at previous developments, France scored 113 points in this category in 2017, improved by 16 points in 2018 and scored 128 points in 2019. At the tail end of the innovation activity rankings, Poland came in at 61 points in 2021, an improvement of 3 points compared to 2020. The previous development in this category for Poland was not exceptional, as the values in each year were 60, 61, and 60 points respectively. In 2021, the Slovak Republic ranked third from the bottom of the ranking with a value of 85 points, an improvement of 1 point compared to the previous year. The highest number of companies introducing innovative activities was in 2017, when Slovakia scored 146 points. In 2018, there was a drop and the country scored 18 points less. 2019 was no better, where there was a further drop when compared to the previous year, with Slovakia losing 24 points.
The sum of the average value of the Eco-innovation activities indicator in the analyzed period reached the level of 1042.2. As many as six countries had an average level above 100. The highest one belonged to Sweden (153.6), which translated into 14.7% in the structure of the analyzed countries. The second highest level of the indicator belonged to the Czech Republic with the level of 144.2 (13.8%). Four countries were below the EU average, in order of Italy (89% and 8.5%), Hungary (71.2 and 6.83%), Germany (70.4 and 6.75%), and Poland (60 and 5.8%). Poland also took last place in these components. The results can be seen in Table 4, Table 5, and Figure 3.
Table 5.
Average Eco-innovation activities.
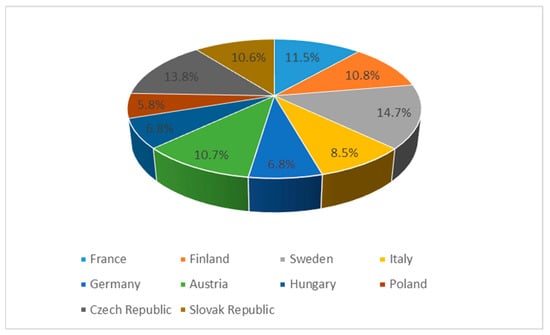
Figure 3.
Graphical interpretation of average eco-innovation activities (own elaboration).
- Environmental results
The next group focuses on environmental performance and includes material productivity, water productivity, energy productivity, and greenhouse gas emissions intensity. Based on the data in Table 6, the clear leader in this area is Italy, which has significantly crossed the threshold, scoring 268 points for 2019, 2020, and 2021. If we look at previous developments, Italy scored 250 points in 2017 and 13 points more in 2018, that is, 263. Germany is also above the 100-point threshold, scoring 157 points in 2021, an increase of 8 points compared to 2020. If we look at previous developments, scores have also increased over the years, with Germany scoring 134 points in this category in 2017. In the following year, i.e., 2018, the value rose again, and the country improved by 3 points. 2019 was also an optimistic year, with Germany scoring 141 points in this area.
Table 6.
Environmental results based on Eurostat.
France is also above the 100-point threshold, scoring 152 points in 2021, its highest score in five years. France received the lowest score in 2017, when it scored 136 points. In 2018, there was a slight increase and the country improved by 5 points. However, in 2019 there was a drop again and France scored 3 points worse. The surprise in this area was the Slovak Republic, which in 2021 scored a pleasing 148 points, which clearly indicates that this country pays very close attention to environmental performance and therefore cares about the environment. The lowest score in this area was for Slovakia in 2020, where there was a decline, and this country scored 136 points. Other countries that are not indifferent to the environment also scored above the 100-point threshold, namely the Czech Republic, which scored 144 points, Austria, which scored 134 points in 2021, and Sweden, which scored 117 points. Surprisingly, the worst country on environmental issues was Finland, which scored only 44 points in 2021. Given previous developments, it is clear that this country is working to improve in this area, which is also very visible in the five years of development. In 2017, Finland scored 35 points, while there was a decline in 2018 and 2019, with this country scoring 34 points in both cases. The decline in value continued in 2020, with Finland scoring only 33 points. Second place from the bottom of the rankings went to Hungary, with a value of 63 points in 2021, and third place went to Poland, which scored 79 points.
Of all the discussed components, these environmental results obtained the highest average value of the indicator for the analyzed period and countries with the level of 1233.8. See the Table 7 and Figure 4. Italy achieved an extremely high index value of 263.4, which is 21.3% in the structure. Six countries: Germany (143.6; 11.6%), Slovak Republic (142.2; 11.53%), France (142; 11.51%), Czech Republic (131.4; 10.6%), Austria (125.8; 10.2%), and Sweden (114.2; 9.3%) had an index above 100. Only three countries had a lower index. Hungary (67.8; 11.6%) and Poland (67.4; 11.5%) reached a comparable value. The lowest average in this thematic area was achieved by Finland at level 36, which is less than 3% of the total average environmental results.
Table 7.
Average environmental results.
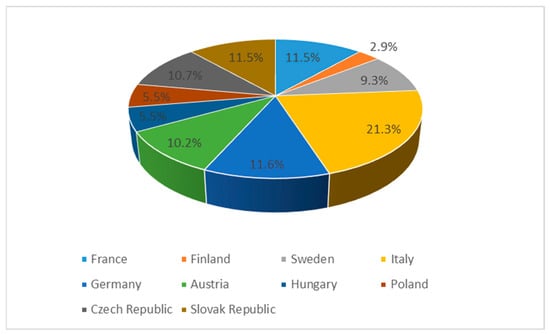
Figure 4.
Graphical interpretation of average environmental results (own elaboration).
- Socio-economic results
The next group we focus on is socio-economic performance, which focuses on exports of goods from eco-innovation industries, employment in eco-innovation industries, as well as sales in eco-innovation industries. The clear leader in this group in 2021 was Finland, which scored 234 points (Table 8). In the case of this country, it is very interesting to note that the scores have not changed over the last five years, with Finland scoring the same 234 points in 2017, 2018, 2019, and 2020. Another leader in this category with a value above 200 points is Austria, which scored 216 points in 2021, losing 1 point compared to 2020. The lowest value in this category this country received in 2017, when it was awarded 193 points. The Czech Republic also managed to get above 100 points, scoring 111 points in 2021.
Table 8.
Socio-economic results based on Eurostat.
The level of average socio-economic results for most countries was lower than in other thematic areas and ranged from 8.8 for Hungary (0.9% in structure) to 85.2 for Sweden (8.2%). Three countries achieved a level above the EU average. Among them were the Czech Republic (114.2 and 11%), Austria (206 and 19.9%), and Finland (234 and 22.6%). Four countries have a similar rate: Slovak Republic (76.6 and 7.5%), France (75.8 and 7.3%), Poland (74.6 and 7.21%), and Italy (74.4 and 7.20%). The sum of the average value of socio-economic results for the analyzed period was 1034. See the results in Table 9 and in Figure 5.
Table 9.
Average socio-economic results.
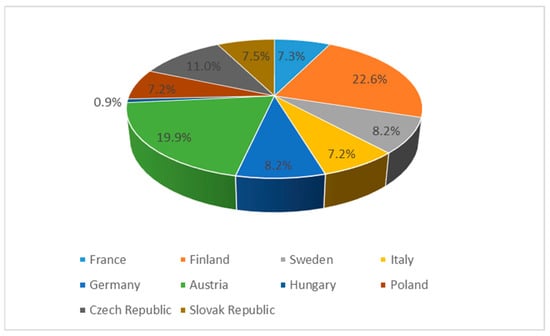
Figure 5.
Graphical interpretation of average socio-economic results (own elaboration).
- Eco-innovation index
Finally, we look at the eco-innovation index, which shows how well each member state performs on different dimensions of eco-innovation compared to the average and presents their strengths and weaknesses. Based on the data presented in Table 10, Finland is the clear leader in terms of eco-innovation, with an index value of 157 in 2021, an improvement of 3 points compared to 2020. If we look at past developments, this country reached the same value in 2017, when it also scored 157 points. There was a decrease in 2018, when Finland lost 3 points, and an increase in 2019, when this country scored 158 points, which was the highest score in the five-year period under review. The second leader in eco-innovation is Austria, which scored 150 points in 2021, the highest score over the 5-year period. Compared to the previous year, Austria improved by 2 points.
Table 10.
Eco-innovation index based on Eurostat.
The top three are rounded off by Sweden, which scored 142 points in 2021, an improvement of 1 point on the previous year. If we look at the past development of this country, it is interesting to note that in 2017, 2018, and 2020 Sweden achieved the same score, namely 141 points. The only exception was in 2019, when Sweden scored 145 points, its highest score in the last five years. In terms of the eco-innovation index, countries such as Germany, which scored 133 points, France, which scored 127 points, Italy, which scored 124 points, and the Czech Republic, which scored 111 points, also scored above 100 points in 2021. In contrast to these leaders, there are three countries on the other side that did not even reach 100 points in the assessment. The worst performer is the Republic of Poland, which scored 63 points in 2021, an improvement of three points in 2020. In terms of the eco-innovation index, Poland fared worst in 2017, scoring only 59 points. The second worst country is Hungary, which scored 60.
The worst results in this area were recorded for Hungary, which scored no points in this area in 2021 and 2020. If we look at the past development in Table 5 and Figure 5, it can be clearly seen that in 2017 this country scored 24 points. In the following years, that is, 2018 and 2019, there was a decrease of 14 points, and thus Hungary scored 10 points. The second worst scoring country is the Republic of Poland, which scored 73 points, a decrease of 1 point compared to last year. Regarding the past development in this category, Poland’s score the score has always remained between 71 and 79 points. In this case, attention can also be paid to the Slovak Republic, which scored the same 80 points in the socio-economic area in 2021 and 2020. If we look at the development in the past years, the lowest rating this country received in 2017. 2018 was a year of growth, when Slovakia improved by 4 points. The best performing year was 2019, when the Slovak Republic scored 81 points, an improvement of 3 points compared to the previous year. Over the whole monitoring period, Hungary maintains a score between 60 and 69 points. The third country with the lowest score for innovation is the Slovak Republic, which scored 82 points in 2021, an improvement of 4 points compared to the previous year. Slovakia’s worst score was already in 2020, when it scored 78 points. Slovakia’s best year in eco-innovation was 2017, when it scored 86 points.
The eco-innovation index reached the second highest average level of indicators from thematic areas, a score of 1116. The lowest value was once again for Poland (61.6, which is only 5.5% in the structure of the analyzed countries for the years 2017–2021). Also in this area, six countries reached the average eco-Innovation index above 100: Czech Republic (104.4 and 9.3% in the structure), Italy (112.8 and 10.1%), Germany (122.4 and 11%), France (124.4 and 11.1% in structure). Among the two countries with the highest average values of the indicator were Sweden (142) with 12.7% in the structure and Finland (156) which accounted for 14% in the structure. Results can be seen in Table 11 and Figure 6.
Table 11.
Average eco-innovation index.
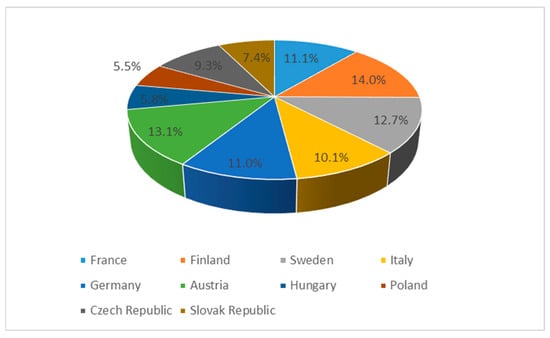
Figure 6.
Graphical interpretation of average eco-innovation index (own elaboration).
4. Discussion and Conclusions
An additional element of the conducted research was a comparative analysis of the average values of indicators for each country in each thematic area: eco-innovation inputs, eco-innovation activities, environmental results, socio-economic results, and eco-innovation index. The mean values are shown in Table 12. In the first area, four countries have an average index value higher than the EU = 100 average (France, Finland, Sweden, and Germany), Austria is slightly below (96.4). In the thematic area related to eco-innovative activity there were as many as six countries (France, Finland, Sweden, Austria, the Czech Republic, and the Slovak Republic) above the EU average. The environmental results area is probably the best in terms of the level of averages for countries. As many as 7 out of 10 countries achieved an average above 100, and the average level of the indicator for Italy reached an incredibly high value of 263.4. Another area of socio-economic results brought the countries rather average results for the years 2014–2021, only two countries had average values above 100: Finland (234) and Czech Republic (114.2). The lowest average was recorded for Hungary with a score of 8.8. In the last compared thematic area of the eco-innovation index, the average of seven countries was also higher than the EU average. Lower values were achieved by three countries: Hungary, Poland, and Slovak Republic. The average results showed by each indicator, can be seen in Figure 2, Figure 3, Figure 4, Figure 5 and Figure 6.
Table 12.
Comparison of average indicator levels for each thematic area and country for the 2014–2021 period. (Based on own elaboration).
For each thematic area and the average level of indicators, the ranking method was used. The rankings of countries in each area are shown in Table 13. The first ranking places (1) belong to:
Table 13.
Ranking of average level of index for each thematic area and country in 2014–2021 period. (Based on own elaboration).
- -
- Germany (eco-innovation inputs);
- -
- Sweden (eco-innovation activities);
- -
- Italy (environmental results);
- -
- Finland (both in the area of socio-economic results and eco-innovation index).
The last place (10) in two areas of eco-innovation activities and eco-innovation index was taken by Poland, Hungary (socio-economic results), Finland (environmental results), and Slovak Republic (eco-innovation inputs).
Classification into one of the three groups (Table 14), adopted and described in the assumptions of the Section 2, was based on the largest number of thematic areas from a specific ranking position.
Table 14.
Assignment of countries to eco-innovation groups. (Based on own elaboration).
The above ranking made it possible to assign the analyzed countries to one of the adopted ranking groups. It also showed which areas are very problematic for them. Certainly, in these wrong thematic areas, countries should improve their activities. In the “super eco-innovation” group, two countries were identified, which are Finland and Sweden. They achieved the highest rankings in three out of five areas. Three countries were identified as “lightweight eco-innovation”. For most areas, they were ranked 4–6 in the ranking, and these are France, Italy, and the Slovak Republic. However, in the case of two countries, Hungary and Poland, the ranking showed that both countries in all five thematic areas were at the end of the ranking, actually occupying positions 8–10. They have considerable problems in obtaining average values of indicators closer to the EU average, and therefore they have been classified into the “grinding/desperate eco-innovation” group.
Nowadays, entrepreneurs face difficulties in developing green products and services in less developed countries as described and analyzed in this article. Many entrepreneurs in these countries are creative, well-educated, and innovative people capable of running responsible and sustainable business models, but they need the capital. That is why there is a need of programs to support building green entrepreneurship, for example, subsidies include EU funds available for 2021–2027, Horizon Europe [51,52]. Mainly in countries that perform worse results on the observed indicators.
We hope that this general trend, new strategies, and programs in this area will allow for improvement in the condition of green businesses in the countries of EU.
In less developed countries, green entrepreneurship is less developed because of high development costs, lack of access to finance, development gaps [24], entrepreneurs’ attitude focused on profit, and an unstable economy. These are the most important barriers to green entrepreneurship in less developed countries. It would be useful to look at the problem countries in detail, to gain insight into where the bottlenecks are in the process of eco-innovation and green entrepreneurship, and to propose and find solutions that would be applicable and would increase the ranking of the countries mentioned.
We can observe that there is a lack of higher long-term motivation of enterprises and households to adopt an active approach to eco-innovation and a lack of better public awareness. Slovakia separates only about 10% of municipal waste, at the same time our SMEs have a relatively low overall innovation performance and therefore a relatively low performance in the field of eco-innovation creation and implementation. Despite the above, we are able to find positive examples in Slovakia, which include start-ups for the development and production of so-called eco-capsules for innovative eco-housing, which are entering mass production, or the emergence of eco-shops selling goods without packaging or in reusable eco-packaging (drugstores or groceries in Bratislava). Also interesting is the project of eco-packaging made of cotton and beeswax, which are antifungal and antibacterial. It is also worth mentioning furniture that grows with the child, saving costs for customers and reducing waste production.
Thus, there are many examples of eco-innovation in the world and in Slovakia that can help to ensure sustainable growth. Slovakia is rich in renewable and natural resources such as wood, mineral waters, water resources and thermal springs, selected agricultural products, and others, which can be actively used in eco-innovations at the business environment level. Also, it should not be forgotten that countries that perform well in the ranking should be an example and the individual case studies could be helpful for application in countries that are not yet able to achieve the desired values. Of course, the problems need to be covered by increased funding, but this should be targeted, not melt into the system, and hit those sectors where their location would directly impact on eco-innovation and the application of green business. Green entrepreneurship is an opportunity for many creative and innovative companies, especially young or newly established ones. These companies have more environmentally conscious people who work in it and that is why they are more likely to adopt a green behavior. It seems that eco-innovations will determine the competitiveness of economies in the coming years.
The main limitation of our work was the measurement and evaluation of innovations. It is a continuous process in the dynamic environment of individual countries, it must be carried out regularly, and there is a lack of a comprehensive evaluation of the EU’s eco-innovation systems. However, we treated this study as preliminary research. Compared to previous studies [11] presenting, for example, a synthetic indicator of the differential level of economic development in the EU countries from the period 2001–2018, it can be stated that data analysis in that paper (showing such variables as eco-innovation inputs, eco-innovation activities, environmental results, socio-economic results, and eco-innovation index), showed that, until 2021, not much has changed when it comes to countries such as Poland, the Slovak Republic, Hungary, and the Czech Republic. All the more, the results of our study encouraged us to continue research into a more detailed analysis of underdeveloped countries at the bottom of our ranking, as well as research into the forms and areas where eco-innovations and new technologies could contribute to improving the situation of these countries.
The results of the study may be helpful for the management of SMEs, who will draw conclusions in which direction to reorganize their activities and redefine their strategy. Certainly, one of the potentially valuable research directions could be the expansion of cooperation between institutions (companies, industry, and research units) in the field of eco-innovation. Research could focus not at the company level but at the industry and government level. Future research could also include measuring other innovation indicators using individual clusters, which could help describe differences more thoroughly. This could help the scientific sphere and the creators of standard cohesion policies in individual countries. Research in low-ranked countries will be particularly valuable to broaden their vision. This topic will be one of the future directions of our research.
Author Contributions
Conceptualization, L.D. and A.S.; methodology, D.K. and L.D.; software, L.D. and D.K.; validation, L.D. and D.K.; formal analysis, A.S.; investigation, L.D.; resources, L.D.; data curation, A.S. and L.D.; writing—original draft preparation, L.D. and A.S.; writing—review and editing, L.D. and A.S.; visualization, D.K.; supervision, L.D.; project administration, A.S. and D.K.; funding acquisition, D.K. All authors have read and agreed to the published version of the manuscript.
Funding
This research was funded by the Faculty of Management of AGH University of Science and Technology—subsidy for the maintenance and development of research potential under number: 16.16.200.396.
Data Availability Statement
Not applicable.
Conflicts of Interest
The authors declare no conflict of interest.
References
- Taušová, M.; Domaracká, L.; Čulková, K.; Matušková, S.; Pena, N.; Mikita, M. European Climatic and Energy Strategy and its Goal Achieving in V4 Countries. Acta Montan. Slovaca 2021, 26, 825–833. [Google Scholar] [CrossRef]
- Fussler, C.; James, P. Eco-Innovation: A Breakthrough Discipline for Innovation and Sustainability; Pitman Publishing: London, UK, 1996. [Google Scholar]
- Antonioli, D.; Mancinelli, S.; Mazzanti, M. Is environmental innovation embedded within high-performance organisational changes? The role of human resource management and complementarity in green business strategies. Res. Policy 2013, 42, 975–988. [Google Scholar] [CrossRef]
- Paparoidamis, N.G.; Tran TT, H.; Leonidou, L.C.; Zeriti, A. Being Innovative While Being Green: An Experimental Inquiry into How Consumers Respond to Eco-Innovative Product Designs. J. Prod. Innov. Manag. 2019, 36, 824–847. [Google Scholar] [CrossRef]
- Bossle, M.B.; Dutra de Barcellos, M.; Vieira, L.M.; Sauvée, L. The drivers for adoption of eco-innovation. J. Clean. Prod. 2016, 113, 861–872. [Google Scholar] [CrossRef]
- He, F.; Miao, X.; Wong, C.W.Y.; Lee, S. Contemporary corporate eco-innovation research: A systematic review. J. Clean. Prod. 2018, 174, 502–526. [Google Scholar] [CrossRef]
- Yan, Y.; Chen, Y.; Miao, J. Eco-innovation in SMEs: A scientometric review. Environ. Sci. Pollut. Res. 2022, 29, 48105–48125. [Google Scholar] [CrossRef] [PubMed]
- Kemp, R.; Arundel, A. Survey Indicators for Environmental Innovation. IDEA (Indicators and Data for European Analysis) Paper Series 8. 1998. Available online: https://nifu.brage.unit.no/nifu-xmlui/bitstream/handle/11250/226478/Idea8.pdf?sequence=1 (accessed on 13 January 2023).
- Porter, M.; van der Linde, C. Green and competitive: Ending the stalemate. Long Range Plan. 1995, 28, 128–129. [Google Scholar]
- Klewitz, J.; Hansen, E.G. Sustainability-oriented innovation of SMEs: A systematic review. J. Clean. Prod. 2014, 65, 57–75. [Google Scholar] [CrossRef]
- Czyżewski, A.; Grzyb, A.; Matuszczak, A.; Michałowska, M. Factors for Bioeconomy Development in EU Countries with Different Overall Levels of Economic Development. Energies 2021, 14, 3182. [Google Scholar] [CrossRef]
- Mavi, R.K.; Mavi, N.K.; Saen, R.F.; Goh, M. Eco-innovation analysis of OECD countries with common weight analysis in data envelopment analysis. Supply Chain. Manag. 2021, 27, 62–181. [Google Scholar]
- Santolaria, M.; Oliver-Solà, J.; Gasol, C.M.; Morales-Pinzón, T.; Rieradevall, J. Eco-design in innovation driven companies: Perception, predictions and the main drivers of integration. The Spanish example. J. Clean. Prod. 2011, 19, 1315–1323. [Google Scholar] [CrossRef]
- Van Hoof, B.; Lyon, T.P. Cleaner production in small firms taking part in Mexico’s sustainable supplier program. J. Clean. Prod. 2013, 41, 270–282. [Google Scholar] [CrossRef]
- Gupta, H.; Barua, M.K. Supplier selection among SMEs on the basis of their green innovation ability using BWM and fuzzy TOPSIS. J. Clean. Prod. 2017, 152, 242–258. [Google Scholar] [CrossRef]
- Bocken, N.M.P.; Short, S.W.; Rana, P.; Evans, S. A literature and practice review to develop sustainable business model archetypes. J. Clean. Prod. 2014, 65, 42–56. [Google Scholar] [CrossRef]
- Gonzalez-Moreno, A.; Diaz-Garcia, C.; Jose Saez-Martinez, F. Environmental responsibility among smes in the hospitality industry: Performance implications. Environ. Eng. Manag. J. 2016, 15, 1527–1532. [Google Scholar] [CrossRef]
- O’Hare, J.A.; McCaloone, T.C. Eco-innovation: The opportunities for engineering design research. In Proceedings of the 13th International Design Conference—DESIGN, Dubrovnik, Croatia, 19–22 May 2014; pp. 1631–1640. [Google Scholar]
- O’Hare, J.A.; McCaloone, T.C.; Pigosso, D.C.A.; Howard, T.J. Eco-Innovation Manual: Working Version for Pilot Application; United Nations Environment Programme: Nairobi, Kenya, 2014; p. 119. [Google Scholar]
- Kowal, B.; Włodarz, D.; Brzychczy, E.; Klepka, A. Analysis of Employees’ Competencies in the Context of Industry 4.0. Energies 2022, 15, 7142. [Google Scholar] [CrossRef]
- Popov, V.V.; Kudryavtseva, E.V.; Katiyar, N.K.; Shishkin, A.; Stepanov, S.I.; Goel, S. Industry 4.0 and Digitalisation in Healthcare. Materials 2022, 15, 2140. [Google Scholar] [CrossRef]
- Wójcicki, K.; Biegańska, M.; Paliwoda, B.; Górna, J. Internet of Things in Industry: Research Profiling, Application, Challenges and Opportunities—A Review. Energies 2022, 15, 1806. [Google Scholar] [CrossRef]
- Stoyanova, M.; Nikoloudakis, Y.; Panagiotakis, S.; Pallis, E.; Markakis, E.K. A Survey on the Internet of Things (IoT) Forensics: Challenges, Approaches and Open Issues. IEEE Commun. Surv. Tutor. 2020, 22, 1191–1221. [Google Scholar] [CrossRef]
- Wittbrodt, P.; Łapuńka, I. Industry 4.0—A Challenge for Modern Production Companies. Available online: http://ptzp.org.pl/files/konferencje/kzz/artyk_pdf_2017/T2/t2_793.pdf (accessed on 28 December 2022).
- Ma, S.; Zhang, Y.; Lv, J.; Yang, H.; Wu, J. Energy-cyber-physical system enabled management for energy-intensive manufacturing industries. J. Clean. Prod. 2019, 226, 892–903. [Google Scholar] [CrossRef]
- Broy, M. Cyber-Phisical Systems. In Innovation Durch Software-Intensive Eingebettete Systeme; Springer: Berlin/Heidelberg, Germany, 2010; ISBN 978-3-642-14498-1. Available online: https://link.springer.com/book/10.1007/978-3-642-14901-6 (accessed on 28 December 2022).
- Strusani, D.; Houngbonon, G.V. The Role of Artificial Intelligence in Supporting Development in Emerging Markets. 2019. Available online: https://openknowledge.worldbank.org/handle/10986/32365 (accessed on 28 December 2022).
- Goralski, M.A.; Tan, T.K. Artificial intelligence and sustainable development. Int. J. Manag. Educ. 2020, 18, 100330. [Google Scholar] [CrossRef]
- Doroshuk, H. Prospects and efficiency measurement of artificial intelligence in the management of enterprises in the energy sector in the era of Industry 4.0. Energy Policy J. 2021, 24, 61–76. [Google Scholar] [CrossRef]
- European Commission. Available online: https://ec.europa.eu/info/strategy/priorities-2019-2024/european-green-deal_sk (accessed on 19 November 2022).
- European Commision. EU Approach to Sustainable Development. Available online: https://commission.europa.eu/strategy-and-policy/international-strategies/sustainable-development-goals/eu-holistic-approach-sustainable-development_en (accessed on 25 November 2022).
- De Jong, E.; Vijge, M.J. From Millennium to Sustainable Development Goals: Evolving discourses and their reflection in policy coherence for development. Electron. J. Earth Syst. Gov. 2020, 7, 100087. [Google Scholar] [CrossRef]
- Demirel, P.; Li, Q.C.; Rentocchini, F.; Tamvada, J.P. Born to be green: New insights into the economics and management of green entrepreneurship. Small Bus. Econ. 2019, 52, 759–771. [Google Scholar] [CrossRef]
- Roosa, S.A. Sustainable Development Handbook; The Fairmont Press: Lilburn, GA, USA, 2010; ISBN 978-1-4398-5048-0. [Google Scholar]
- Vasilescu, M.D.; Dimian, G.C.; Gradinarua, G.I. Green entrepreneurship in challenging times: A quantitative approach for European countries. Econ. Res. Ekon. Istraživanja 2022, 35. [Google Scholar] [CrossRef]
- Koirala, S. SMEs: Key Drivers of Green and Inclusive Growth, OECD Green Growth Papers No. 2019/03; OECD Publishing: Paris, France, 2019. [Google Scholar] [CrossRef]
- Ranosz, R.; Bluszcz, A.; Kowal, D. Conditions for the Innovation Activities of Energy Sector Enterprises Shown on the Example of Mining Companies. J. Pol. Miner. Eng. Soc. 2020, 1, 249–256. [Google Scholar] [CrossRef]
- Kowal, B.; Domaracká, L.; Tobór-Osadnik, K. Innovative activity of companies in the raw material Industry on the example of Poland and Slovakia—Selected aspects. J. Pol. Miner. Eng. Soc. 2020, 2, 71–77. [Google Scholar] [CrossRef]
- European Commission. Unleashing the Full Potential of European SMEs. 2020. Available online: https://ec.europa.eu/commission/presscorner/detail/en/fs_20_426 (accessed on 13 December 2022).
- International Labour Organization (ILO). Green Entrepreneurship: Creating Green Jobs through Sustainable Enterprise Development. 2020. Available online: https://www.ilo.org/wcmsp5/groups/public/---ed_emp/---emp_ent/documents/publication/wcms_250688.pdf (accessed on 13 January 2023).
- Zelený Akčný Plan. 2021. Available online: http://www.sbagency.sk/sites/default/files/zeleny_akcny_plan_pre_msp_a_podpora_zeleneho_podnikania_v_sr.pdf (accessed on 13 January 2023).
- Bielikova, A.; Mazanec, J. Small and Medium-sized Enterprises in the Global Economy. Int. J. Sci. Eng. Res. 2016, 7, 364–367. [Google Scholar]
- Friedl-Schafferhans, S. Pracovné Miesta Budúcnosti Sú Zelené? Green Jobs—New Jobs Regional Cooperation Management. 2011. Available online: https://docplayer.org/41867538-Pracovne-miesta-buducnosti-su-zelene-green-jobs-new-jobs-regional-cooperation-management-multilateralne-sietove-stretnutie-at-hu-sk-cz.html (accessed on 13 January 2023).
- Cai, W.; Li, G. The drivers of eco-innovation and its impact on performance: Evidence from China. J. Clean. Prod. 2018, 176, 110–118. [Google Scholar] [CrossRef]
- Saari, U.A.; Joensuu-Salo, S. Green entrepreneurship. In Responsible Consumption and Production. Encyclopedia of The UN Sustainable Development Goals; Leal Filho, W., Azul, A., Brandli, L., Özuyar, P., Wall, T., Eds.; Springer: Cham, Switzerland, 2019; Available online: http://doi-org-443.webvpn.fjmu.edu.cn/101007/978-3-319-71062-4_6-1 (accessed on 13 January 2023).
- My, A. Regionalny Eko-Indeks Innowacyjności Polski. 2022. Available online: https://ecoekonomia.pl/2022/10/06/regionalny-eko-indeks-innowacyjnosci-polski/ (accessed on 13 January 2023).
- Kowal, D.; Kowal, B. Finansowanie przedsiębiorczości innowacyjnej w Polsce. In Innowacyjność w Działalności Gospodarczej; Iwaszczuk, N., Ed.; Wydawnictwo IGSMiE PAN: Kraków, Poland, 2019. (In Polish) [Google Scholar]
- Carroll, A.B.; Shabana, K.M. The Business Case for Corporate Social Responsibility: A Review of Concepts, Research and Practice. Int. J. Manag. Rev. 2010, 12, 85–105. [Google Scholar] [CrossRef]
- Batrancea, L.; Pop, M.C.; Rathnaswamy, M.M.; Batrancea, I.; Rus, M.I. An empirical investigation on the transition process toward a green economy. Sustainability 2021, 13, 13151. [Google Scholar] [CrossRef]
- Majerník, M.; Bednárová, L.; Naščáková, J.; Drábik, P.; Malindžáková, M. Comprehensive management of natural resources: A holistic vision. In Sustainable Resource Management: Modern Approaches and Contexts; Elsevier: Amsterdam, The Netherlands, 2021; pp. 221–240. [Google Scholar] [CrossRef]
- Green Deal (Europejski Zielony Ład). 2021. Available online: https://www2.deloitte.com/pl/pl/pages/tax/articles/strefa-ulg-i-dotacji/Europejski-Zielony-Lad-neutralnosc-klimatyczna-Europy-do-2050-r.html (accessed on 5 December 2022).
- Nowa Perspektywa Finansowa 2021–2027. Available online: https://www.parp.gov.pl/component/site/site/nowa-perspektywa-finansowa-2021-2027 (accessed on 5 December 2022).


Disclaimer/Publisher’s Note: The statements, opinions and data contained in all publications are solely those of the individual author(s) and contributor(s) and not of MDPI and/or the editor(s). MDPI and/or the editor(s) disclaim responsibility for any injury to people or property resulting from any ideas, methods, instructions or products referred to in the content. |
© 2023 by the authors. Licensee MDPI, Basel, Switzerland. This article is an open access article distributed under the terms and conditions of the Creative Commons Attribution (CC BY) license (https://creativecommons.org/licenses/by/4.0/).