Abstract
Gas hydrates have been considered as a new energy that could replace conventional fossil resources in the future because of their high energy density, environmental friendliness, and enormous reserves. To further analyze the potential distribution of gas hydrate stability zones (GHSZ) and the formation of a gas hydrate system in the Shenhu area of the South China Sea (SCS), a 3D petroleum simulation model (PSM) was built from 3D seismic interpretations and all available geological data. Based on the thermal calibration of the 3D model, the evolution of the GHSZ, hydrocarbon generation and migration, and the formation and accumulation of gas hydrates were simulated for the first time in the area. Thermal simulation shows that the methane source of gas hydrate originated from shallow biogenic gas and deep thermogenic gas. Most areas are dominated by shallow biogenic gas, while, only about 3% of the deep thermogenic gas derived from Enping Formation source rock and contributed to the gas hydrate formation within a few areas in the southeast. The thermogenic gas migrated vertically into the GHSZ through connecting faults, mud diapir, and/or gas chimney to form gas hydrate. The source rocks of the Wenchang Formation, a deep thermogenic gas source, began to enter the main hydrocarbon generation window at 28.4 Ma. The Enping source rock began to generate oil from 25 Ma on and gas from 16 Ma on. Since 5.3 Ma, most areas of the source rocks have generated a gas window, and only the shallower parts in the east still in the oil window, which had lasted until now. The shallow biogenic gas source rocks from the Hanjiang, Yuehai, and Wanshan formations generated gas in different periods, respectively. The Qionghai Formation began to generate hydrocarbon from 0.3 Ma and until now. Other results show that the GHSZ developed mainly during the Quaternary and Neogene (Wanshan Formation) and the GHSZ is thicker in the southern area and thinner in the northern part with a positive correlation with water depth. Starting at 11.6 Ma, the GHSZ developed in the Hanjiang Formation in the south of the Shenhu area and gradually expanded to the north to cover most of the study area at 5.3 Ma during the Yuehai Formation. From 1.8 Ma on, the GHSZ covered the entire study area. At the same time, the GHSZ in the Hanjiang Formation disappeared because of the change in temperature and pressure. At present, the GHSZ in the Yuehai Formation has disappeared, while the Quaternary and Wanshan are the two main formations for GHSZ development. The formation and distribution of gas hydrates are fundamentally controlled by the space-time coupling between the hydrocarbon generation and expulsion time and distribution of the GHSZ. The simulation results of gas hydrate accumulation and distribution were verified by drilling results and the matching rate is 84%. This is the first time that 3D simulation was successfully conducted with PSM technology in the Shenhu area and it provides important guidance for gas hydrate study in other areas of the SCS.
1. Introduction
Natural gas hydrates, commonly known as “fire ice”, will be a new hope for replacing fossil energy in the future [1,2,3]. The organic carbon in gas hydrates is twice that of all known fossil-fuel hydrocarbons, and it could be consumed by humans for more than 1000 years. Different from conventional petroleum accumulations, the “trap” for gas hydrates is a gas hydrate stability zone (GHSZ), which is controlled by temperature and pressure. Traditional investigations of the gas hydrate system are based on geophysical methods, such as bottom-simulating reflector (BSR) tracking and inversion, petrophysical interpretation, drilling, logging, and core analysis [4,5,6,7,8,9,10,11,12,13,14], which focus on the present static descriptions and are difficult for characterizing the evolution of temperature and pressure and the dynamic hydrocarbon generation, migration and associated accumulation of gas hydrates. Then it is impossible to accurately predict the potential distribution of gas hydrates and evaluate resources in submarine basins based on the traditional approaches only.
Traditional studies mostly focus on static characterizations of gas hydrate systems and only provide qualitative descriptions, while petroleum system modeling (PSM) considers all the geologic elements, processes of burial history and thermal evolution, hydrocarbon generation, migration, and gas hydrate accumulation. Therefore, PSM has an advantage of enabling the study of dynamic GHSZ evolution and the main controls of the dynamic evolution through geological history. A petroleum system consists of an active source rock and the hydrocarbons derived from it as established by geochemical correlation. The concept embodies all the geologic elements and processes needed for oil and gas accumulation [15,16]. PSM is widely applied in both conventional hydrocarbon exploration [17] and unconventional hydrocarbon research such as into shale oil/gas [18,19], tight oil/gas [20], and gas hydrates [21]. In recent years, studies have mainly focused on the numerical simulation of gas hydrates using PSM and have achieved considerable progress in the GHSZ and gas hydrate system characterization [22,23,24,25,26,27,28].
Three-dimensional (3D) basin modeling has been widely used in the study of conventional petroleum and gas hydrates [22,23,26,29,30,31,32,33,34]. By reproducing the paleo and modern heat flow and temperature field, the maturity of source rocks and hydrocarbon generation with time can be simulated. Oil and gas migration is treated as a three-dimensional process to simulate the process of oil and gas trapping and leakage. Schenk et al. (2012) established a three-dimensional oil system model for northern Alaska, based on seismic data and a database of more than 400 wells, and reconstructed the complex dynamic interaction of sedimentation and erosion history; the authors also evaluated the change of migration behavior and predicted present day oil distribution [32]. They proposed that 3D petroleum system modeling research provided a unique geological framework, which helped to reduce exploration risks and evaluate potential oil and gas resources. Emmanuel et al. (2013) conducted a 3D basin modeling of the Hammerfest Basin (southwest of Barents Sea) to solve the problems of oil generation, accumulation, and dissipation during basin evolution [33]. They quantified the amount and time of liquid and gaseous hydrocarbon generation in the basin, reconstructed possible migration paths and quantified the retention volume in the reservoir, and evaluated the possible oil and gas leakage in the reservoir in a geological period. They argued that although there were uncertainties in the simulation method, this method might help to improve the understanding of the impact of thermal fluid leakage dynamics in reservoirs within petroliferous basins.
Within the German gas hydrate initiative SUGAR, a new 2D/3D module has been developed to simulate the formation of biogenic methane from organic matter and gas hydrate accumulation. Through the implementation of algorithms describing the physical, thermodynamic, and dynamic characteristics of a gas hydrate system, the accumulations of gas hydrates in marine and permafrost environments have been simulated. In addition, microbial mediated low-temperature degradation kinetics of particulate organic carbon in sediments could be coupled in the simulator [22]. In terms of applications, many scholars, combined with the geological background and hydrocarbon generation and storage conditions of different basins, constructed oil and gas system models with regional characteristics and simulated and discussed the laws of oil and gas generation, migration, accumulation, and storage in different regions. Kroeger et al. (2013 and 2017) conducted two PetroMod simulations on the Taranaki Basin, New Zealand [24,35]. In the first simulation, they obtained the evidence of the existence of methane hydrate in the basin and believed that the occurrence of gas hydrate might be sporadic, which might be controlled by the centralized leakage of thermogenic gas, and the gas hydrate in the slope sediments of the basin might affect the stability of the edge of the Tarana base shelf. In the second simulation, the 3D crustal scale heat flow of the active edge of the Taranaki Basin was simulated, and the surface heat flow and the evolution process of the basin was obtained. Fujii et al. (2016) conducted oil and gas system simulation for a gas hydrate study in the Pleistocene turbidite sedimentary sequence in the Daini Atsumi area in the east of Nankai Trough, Japan [27]. Based on the biomarker analysis of core samples, a new biogenic methane generation model was established. It was considered that the distribution of sandy sediments and the direction of formation dip are important controlling factors of gas hydrate accumulation. They mainly focused on basin-scale oil and gas system modeling to evaluate the gas hydrate accumulation mechanism on a geological time scale.
From April to June 2007, the Guangzhou Marine Geological Survey (GMGS) carried out a gas hydrate drilling (GMGS1) expedition in the Shenhu area on the northern slope of the South China Sea (SCS) for the first time, and gas hydrate samples with high methane concentrations were successively drilled and cored at three sites [36]. In 2013, the GMGS2 gas hydrate drilling expedition was deployed again, and massive amounts of gas hydrate with high saturation was drilled for the first time in the Dongsha area in the east of the Pearl River Mouth Basin (PRMB). Gas hydrates with various occurrences including layered, massive, tuberculous, and veins were identified by the naked eyes [37]. The distribution of gas hydrate reservoirs in this area reach to ~55 km2, with an about a 100–150 billion m3 reserve (converted into natural gas) [38], which is equivalent to a reserve of the large offshore high-abundance conventional natural gas fields. From June to September 2015, the GMGS3 expedition was carried out and 19 sites were drilled successively in the Shenhu area, and high-saturation gas hydrate was recovered by pressure cores, with a drilling success rate of 100% [39]. In 2017 and 2020, two trial production of gas hydrates have been successfully implemented in the Shenhu area, both making great breakthroughs in terms of testing time span, production per day, and total production amount compared with other testing productions in the world [40,41,42].
Due to limitations in seismic data, previous study in the Shenhu area focused on the 1D (well-based) and 2D modeling using well data and 2D seismic interpretations [21], which are not sufficient for characterizing the spatial distribution of gas hydrate and the hydrocarbon migration and accumulation of gas hydrates in the area. Sun et al. (2020) used 2D PetroMod software to simulate the formation temperature field, organic matter maturity, hydrocarbon (biogenic and thermogenic gases) generation of source rocks, as well as the proportion of these gases in each well, fluid migration pathways, and gas hydrate saturation and explored the distribution of gas hydrate in the Shenhu area [43]. Compared with the gas hydrate saturation calculated by logging, the simulation method cannot only calculate different gas source percentages but also numerically simulate hydrate hydrocarbon generation, and the hydrate saturation, and its distributions. However, the simulation results have not been accurately verified by drilling and cores. Although a large amount of gas hydrate has been discovered in the Shenhu area, and many drillings and trial exploitations have been carried out, only some of the characteristics of gas hydrate have been revealed so far, and the overall distribution, formation process, and controlling mechanism of gas hydrate in the area have not been revealed. In addition, the source of methane is a long-term controversial issue [19,36,44,45]. Which formation does the methane gas come from below the GHSZ? By which way? They are all problems that need to be addressed.
The 3D seismic survey acquired in the Shenhu area in 2018 makes it possible to build a 3D PSM model to simulate temperature and pressure evolution and then study the dynamic variation of the GHSZ, hydrocarbon generation and migration, and gas hydrate accumulation through geological history in three dimensions. On the one hand, it provides a low-cost evaluation methodology; on the other hand, it is helpful to understand the mechanism of fluid flow and heat transfer, which makes it possible to study the occurrence of gas hydrates through semi-quantitative calculation [46,47]. The research on the geomechanical characteristics of the gas hydrate reservoir in the Shenhu area is also a scientific topic and the adaptability of various mining methods should be evaluated. In addition, the first successful 3D GHSZ and gas hydrate accumulation simulation with PSM technology in the Shenhu area by our study will provide important guidance for gas hydrate studies in other areas of the SCS.
2. Geological Background
The Shenhu area is located within the Baiyun Sag in the Zhu II depression of the PRMB, which is developed in the middle of the northern continental slope of the SCS (Figure 1a) [48]. The structural history of the PRMB in the Pliocene is composed of two stages, including the rift Paleogene and thermal subsidence Neogene. Tectonic movement events including Zhuqiong I, Zhuqiong II, and Baiyun have occurred since the Paleogene. The basin underwent continental, continental–marine transitional, and marine sedimentary settings. More than 10 km of sediments were deposited in the center of the sag (Figure 2a) [49].
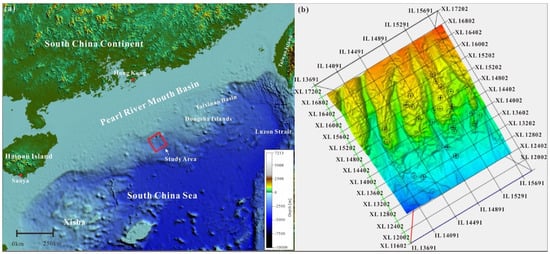
Figure 1.
(a) Location map of the study area, which is located within the Shenhua area in the Baiyun Sag of the Pearl River Mouth Basin, northern South China Sea. (b) Geomorphology of the study area and the location of the drilling wells within the 3D seismic survey. A series of submarine channels and ridges are developed in the study area.
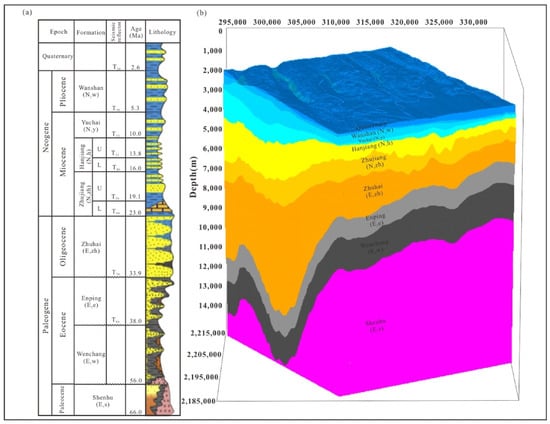
Figure 2.
(a) Stratigraphic column of the Baiyun Sag in the Pearl River Mouth Basin (PRMB). (b) 3D model framework for the study area. Different colors represent formations interpreted from 3D seismic data. The vertical scale indicates depth converted from time domain.
In the early Cretaceous, the Pacific plate subducted to the NW direction and the SCS extended for the first time to form the primitive SCS. During the rifting period, under the background of complex tectonic stress fields that was due to Indian plate movement and Pacific plate subduction, the basin experienced three episodes of riftings, forming a series of near EW, NNE-NE, and NW faults. At about 47.8 Ma, the area experienced the Zhuqiong movement and deposited lacustrine sediments and deltaic fan sediments of the Eocene Wenchang Formation, which were divided into upper and lower segments at 41 Ma. Under the influence of the second episode of Zhuqiong movement, the Enping Formation of Lower Oligocene was formed as the Cenozoic main source rocks of the PRMB at 38 Ma. From 33.9 Ma on, affected by the Indian plate collision and the South China Sea movement, the basin changed from the rift phase to the post-rift thermal subsidence stage and entered the sedimentary period of the Zhuhai Formation, and continental sedimentation gradually changed to marine sedimentation. The subsidence rate decreased, and the tectonic activity weakened. Since the Baiyun movement (23 Ma), the area has developed extremely thick Cenozoic strata (about 10 km), and locally developed residual Mesozoic strata [50].
The basin has the characteristics of rapid subsidence and rapid sedimentary filling. During the sedimentary period of the Zhujiang Formation (23.03–15.97 Ma), the sea level rose rapidly, and the shelf slope migrated rapidly from the south to the north of the basin. The basin generally entered the marine environment, dominated by platform carbonate depositions and other shallow sea depositions. During the sedimentary period of the Hanjiang Formation (15.97–10.0 Ma), the sea level changed frequently, and the continental shelf and deep-water slope environment dominated. The sediments are the superposition of multi-stage deep-water fans. The continental shelf is also accompanied by the advance and retreat of the multi-stage Pearl River Delta sedimentary system. Subsequently, affected by the Dongsha movement, the basin was characterized by rapid subsidence and rapid sedimentary filling. It enters the sedimentary period of the Yuehai Formation at 10.0 Ma, the Wanshan Formation at 5.33 Ma, and the Quaternary at 2.6 Ma. The sedimentary facies are mainly neritic and semi-neritic sediments [51].
The basin mainly develops three sets of hydrocarbon source rocks with good hydrocarbon generation potential: the Zhuhai Formation of the Upper Oligocene, the Enping Formation of the Lower Oligocene, and the Wenchang Formation of the Eocene [52]. The hydrocarbon gas source is mainly from the mixed lacustrine source rocks of the Wenchang Formation and coal and lacustrine source rocks of the Enping Formation. The marine source rocks of the Zhuhai Formation also make certain contributions [53]. Deep lacustrine shale in the Wenchang Formation of the Eocene is the main source rock in the region [54]. The main characteristics of the source rocks are that they are rich in low biomarker C304-methylsterane, with less input from higher terrestrial plants, indicating type I–II organic matter. The average value of TOC is 2.94%, and the average value of chloroform asphalt A is 0.225%. The Lower Oligocene Enping Formation source rocks have been drilled. According to the geochemical information obtained [55,56,57], the Enping Formation source rocks have the characteristics of coals, rich in terrigenous higher plants—resin compounds (W, T double dussonne) and coal, and the content of low biomarker C304-methylsterane is very small, with an average TOC of 2.19%. The average value of chloroform asphalt A is 0.1976%, and the atomic ratio of kerogen H/C is mostly between 1.2 and 0.7, indicating that the type of organic matter is mainly type II–III. The source rocks of the Enping Formation have high maturity. They mainly contribute gas for the area. The marine source rock of the Zhuhai Formation of the Upper Oligocene has been drilled in well LW3-1-1 in the deep-water area in the southeast of the Baiyun Sag. Geochemical analysis shows that its organic matter abundance is relatively high, the TOC value is between 1.0–1.5%, and most of them belong to organic material type II. The thermal evolution degree of the source rocks is low (Ro = 0.43–0.53%), which has certain hydrocarbon generation potential [57]. In addition, the source rocks developed in the sediments overlying the Zhuhai Formation are in the stage of low maturity to immaturity, which could be biogenic gas source rocks and generating large amounts of biogenic gas in the Baiyun Sag at present. Drilling and coring have confirmed that biogenic gas derived from the source rocks of the Late Miocene have proved hydrocarbon sources for the formation and accumulation of gas hydrates in the Shenhu area [19,21].
In the study area, neotectonic movement has been frequent since the Late Miocene, forming some faults and/or fissures or diapirs and gas chimneys, which could be vertical oil and gas migration pathways, for the oil and gas generated from the deep Paleogene source rocks and overlying Miocene, Pliocene, and even Quaternary shallow source rocks. According to the drilling results, the gas hydrate in the Shenhu area is mainly enriched in the shallow marine sediments interval since the Late Miocene, which are mostly distributed in the depth range of 100–230 m below sea level (900–1600 m), and the sedimentary environment is continental slope deep-water facies [58]. Through the analysis of paleontology in the cores from drillings, the drilled gas hydrate is mainly distributed in the upper part of the Miocene and the lower part of the Pliocene. The gas hydrate reservoir, which is located around ~200 mbsf (meters below the seafloor), is mainly developed in the channel-levee system. Overall, the thickness of gas-hydrate-bearing sediments is uneven, showing a lenticular shape, and the average thickness can reach 50–60 m. It is mainly concentrated in the middle northwest of the study area, developed along the submarine ridge.
3. Data and Methods
The 3D seismic surveys cover most of the Shenhu area and 25 shallow wells drilled for gas hydrates, of which 19 were drilled in 2015 and 2016 (Figure 1b). The gas hydrate PSM model had been built using the PetroMod from the present structural framework (horizons in depth domain) interpreted from 3D seismic volume. The PetroMod is a petroleum system simulation software originated by the German IES Company. The software provides users with a classic Darcy’s law simulator (fluid potential driving) and streamline method simulator (buoyancy driving). It also innovatively develops a combined simulator with the advantages of Darcy’s law and the streamline method, which improves the simulation accuracy and calculation speed of oil and gas migration [16]. It can obtain more accurate prediction results of oil production, hydrocarbon expulsion, and the time and location of migration processes [34]. The simulation results can be visualized by the superposition of multiple elements, including oil saturation and the in situ quality of each component. It can also establish the geological model required for the simulation of a three-dimensional gas hydrate system through more flexible visualization functions.
The populated properties such as lithology and source rock parameters, including total organic carbon (TOC), hydrogen index (HI), and kinetics of the source rock, are from the available geological study base on the available data from seismic and drilling data. Then, geological ages were assigned for each formation. Last, boundary conditions, including heat flow (HF), paleo water depth (PWD), and sedimentary water interface temperature (SWIT), were set up according to previous study results from public papers [21,59,60,61]. In terms of model results calibration, the maturity of the deep source rock (Ro data) is used for thermal calibration and depth boundary between free gas and gas-hydrate-bearing zone and is used for the GHSZ verification.
The 3D fluid flow simulation in the PetroMod considers a three-phase flow (oil, gas, and water) with mass balance as the formulation base (Hantschel and Kauerauf, 2010).
where subscript p represents fluid phases (water, oil, and gas) and = fluid density, ϕ = rock porosity, S = fluid saturation, μ = fluid mobility, u = fluid pressure potential, C = rock compressibility, ul = lithostatic pressure, and qp describes the generation or loss of phase p.
3.1. Structure Model
Horizons from seismic interpretations were used for structure framework modeling. Nine horizons from seabed (T0) to basement (Tg) were interpreted based on the newly processed 3D seismic data. Lithology, free gas, and gas hydrate saturations are obtained from petrophysical interpretation for all wells. The structural model was initially built in time with the surface grid resolution of 50 × 50 m and then converted into depth through depth conversion process with the following time-depth conversion equation [21]:
where Z is the depth (m) and t is the seismic two-way travel time (s).
Z = 26.51 t3 + 346.03 t2 + 690.86 t
The age for each horizon is assigned according to the stratigraphic column (Figure 2a), and four types of lithology, including sandstone (yellow), shale (gray for deep or blue for shallow), limestone (green), and granite (basement, purple), had been used in the model. The final model is showing in Figure 2b.
3.2. Vertical Gas Migration Pathway
Based on the interpretation results of the 3D seismic data, this study focuses on the 3D hydrocarbon migration pathways, perhaps via faults and mud diapirs. To model the 3D hydrocarbon migration process, the PSM model needs to set up the active period of fault and mud diapir, and then it will be coupled with the simulator with possible migration of deep thermogenic gas (Figure 3). Fault and mud diapir are the main pathways for vertical migration of oil and gas, and their opening has important influences on oil and gas migration. In this study, the main tectonic movements of the PRMB are referred to for building the PSM model; the Baiyun Movement (23 Ma) activated the fault and made it open for fluids, which became the main vertical migration pathway for thermogenic gas from the deep buried formations. Therefore, the fault opening period is set to be from 23 Ma to present. For the mud diapir, the investigation shows that the Dongsha Movement had a great influence on its development, so the vertical permeability of the mud diapir increased at 11.6 Ma and became one of the vertical migration pathways for deep hydrocarbons.
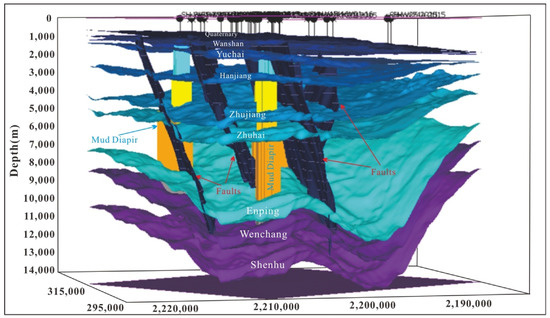
Figure 3.
Structure 3D model composed of the nine main formations, main faults, and mud diapirs. Borehole information is also imbedded in the model.
3.3. Lithology and Lithofacies Setting
Lithologic properties are very important parameters, which not only affect gas migration but also affect the amount of gas accumulation. Gas hydrates in the study area are mainly developed in siltstone-dominated shallow buried strata with minor differences in lithologies and associated properties. According to the difference of clay content derived from logging interpretation, three lithologies can be defined as following: (1) siltstone (clay content <15%), (2) shaly siltstone (clay content: 15–30%), and (3) clayey silt (clay content >30%). Based on the lithology definition, the measured well data and lithologies from seismic data, the lithofacies maps of the upper and lower layers of the Quaternary and the Wanshan Formation are respectively established (Figure 4). For the non-hydrate-bearing strata (below the Yuehai Formation), lithology was set according to the stratigraphic column of the PRMB shown in Figure. 2.
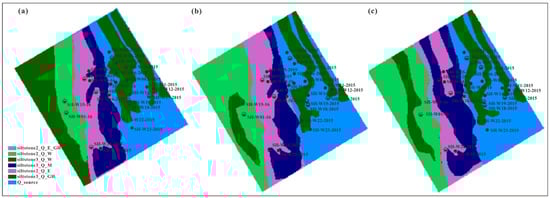
Figure 4.
Distribution map of lithology of different gas-hydrate-bearing layers: the upper (a), the Lower Quaternary, (b) and the Wanshan Formation (c).
3.4. Source Rock Setting
The parameters of the source rocks are mainly based on previous research results [21,59,61]. Core data from Shenhu area show that the shallow depositions in this area have high organic matter abundance and could be effective biogenic gas source rocks. The results showed that the mean values of total organic carbon in the SH1B, SH2B, SH5C, and SH7B boreholes showed little difference, ranging from 0.64 to 0.97%, with a maximum of 1.73% and a minimum of 0.29% [59]. According to the research results of Fu et al. (2007), the average TOC and HI of the Enping Formation are 2.19% and 157.4 mg/g, respectively [60]. TOC and HI in the Wenchang Formation are 2.94% and 483.4 mg/g, respectively [61].
For the hydrocarbon generation model, the deep thermal hydrocarbon generation model was selected from the software, which shows similar organic features to the source rock parameters of the Wenchang and Enping formations in the PRMB. The Wenchang Formation was selected as the Type II kerogen model, and the Enping Formation as the Type III kerogen model. For the shallow biogenic gas hydrocarbon generation model, it is related to temperature. According to the analysis data of our research, the main peak temperature of hydrocarbon generation is 34 °C [21].
3.5. Boundary Conditions
PSM boundary conditions are parameters assigned to the model for the top and bottom of the model. The boundary condition for the bottom is base heat flow, the transient rate of heat from mantle to surface through the sedimentary layers. The top boundary condition includes sediment–water interface temperature (SWIT) and paleo-water depth (PWD). Boundary condition parameters are mainly from previous studies about thermal evolution and sedimentary environments. The literature on the thermal evolution of the Baiyun Sag show HF curves from 50 Ma to the present from 17 wells [62], which show the same trend, e.g., HF higher at 25 Ma and lower at 50 Ma and present. Among all data, three curves from wells PY33, LY91, and LY13 representing high, intermediate, and low trends were chosen as input HF options for gas hydrate PSM modeling (Table 1). Water depth not only controls the pressure of gas hydrate layers but also has an impact on SWIT. So, it has influence on both temperature and pressure in the model, which are two key factors for the formation of the GHSZ. Paleo-water depth can be inferred through sedimentary facies. Previous studies showed that water depth was shallow (0–100 m) from the Shenhu to Zhujiang period and became deeper from the Hanjiang to the present (more than 1000 m, Table 2) [63]. SWIT can be calculated from globe mean temperature at sea level (based on Wygrala, 1989) [64] and paleo-water depth of each geological time step. Choosing northern, eastern Asia and latitude 19 for the Shenhu area and temperature at sea level can be generated automatically based on the Wygrala model, which indicates temperature changed from 25 to 22 °C from 50 Ma to present (Figure 5). After correction with paleo-water depth from Table 2, final SWIT (temperature at seabed) will be calculated as below (Table 3).

Table 1.
Three heat flow (HF) evolution curves used in the PSM model (after Zhang et al., 2014).
Table 2.
Paleo-water depth of the Baiyun Sag in the Pearl River Mouth Basin (after Wu et al., 2013).
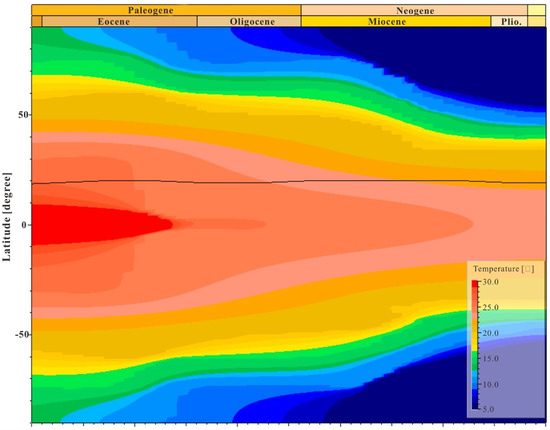
Figure 5.
Globe mean temperature at sea level in the Baiyun sag (after Wygrala, 1989).
Table 3.
Variation of sedimentary water interface temperature (SWIT) in the Shenhu area.
3.6. Simulation and Calibration
After structural model building, properties population, and boundary condition setting up, the first step is to run thermal simulations with three different HF evolution curves. Due to the missing data of Ro from deep source rock layers such as the Wenchang and Enping formations, maturity results from public papers are used as calibration standard [63].
As mentioned above, three HF trends (Table 1) were used to simulate thermal evolution for the same model and simulated maturity results of the Wenchang and Enping source rocks for different HF trends were displayed in Figure 6. Previous studies on source maturity showed that vitrinite reflectance of the source rock developed in the Wenchang Formation is above 2.0% in the over-matured and dry gas stage, and that of the Enping Formation is above 1.0% in the mature stage [63]. Calibration on simulation results of three HF trends showed that the model with a low HF trend matches with the publication data better. As can be seen from Figure 6, by using low HF, the vast majority of modeled Easy%Ro of source rocks of the Enping Formation and Wenchang Formation is higher than 1.0% and 2.0%, respectively, which is in line with the geochemical testing results conducted in the Baiyun Sag [64]. In addition, those source rock calibration results also demonstrated the validation of our PSM model.
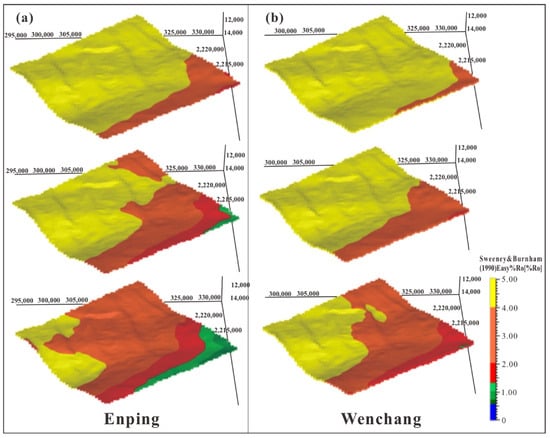
Figure 6.
Maturity maps of source rock developing in the Enping Formation (a) and Wenchang Formation (b) simulated with different HF trends (top: high HF; middle: intermediate HF; bottom: low HF).
The next step is to simulate GHSZ and to calibrate the model with well data after thermal calibration. GHSZ 3D distribution is obtained from the GHSZ simulation. 3D modeling results can be compared with petrophysical interpretation. The boundary between free gas and the gas-hydrate-bearing zone is considered as the base of the GHSZ (BGHSZ). After calibration with 25-well data, 3D modeling results only match 12 wells, a matching rate of 48% (modeled BGHSZ compared with the BGHSZ confirmed by drillings). The reason for the low matching rate is probably because a single HF value for each geological age is used for the 3D model, and the horizontal variation of HF had not been taken into account. To solve this problem, HF maps for critical ages are generated to make HF relatively higher in the north and lower in the south. The average value of the map for each age is about the same as the previous setting (Figure 7). After adjusting HF maps and the new simulation results, the match rate reaches 84%.
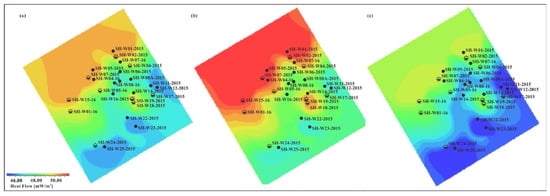
Figure 7.
Heat flow distribution and variation maps for different ages. (a): 0 Ma; (b): 25 Ma; (c): 50 Ma.
4. Results
4.1. GHSZ Distribution and Evolution
Calibrations of simulation results at well locations make it possible to predict the GHSZ lateral distribution and evolution during geological time. At present, the GHSZ covers the entire Shenhu area and was mainly developed at the Qionghai Formation, Quaternary, and partially at the Wanshan Formation vertically. The thickness of the GHSZ does not vary much from west to east, in the range of 150–200 m, and becomes thinner from the south toward the north, from 200 to 100 m. PSM not only simulates the GHSZ distribution at present but also restores its evolution through geological history. Simulation results showed that the GHSZ was formed first in the south of the Shenhu area in a relatively deep-water depth in the Hanjiang Formation at age 14.2 Ma (Figure 8a), and a tiny part of the GHSZ developed below the seabed with thin thickness in the Hanjiang Formation to the south with deep water (Figure 9a). At the age of 5.3 Ma (Figure 8c), the GHSZ in the Hanjiang Formation disappeared and a new GHSZ was formed in the overlaying Yuehai Formation instead, which expanded to the north and reached the center of the study area (Figure 8c) and become thicker than those developed in the Hanjiang Formation (Figure 9c). Up to 1.8 Ma, the GHSZ covered the whole Shenhu area and developed mainly in the Wanshan Formation (Figure 8d), and it became thinner from the south to north; meanwhile, the GHSZ in the Yuehai Formation disappeared (Figure 9d).
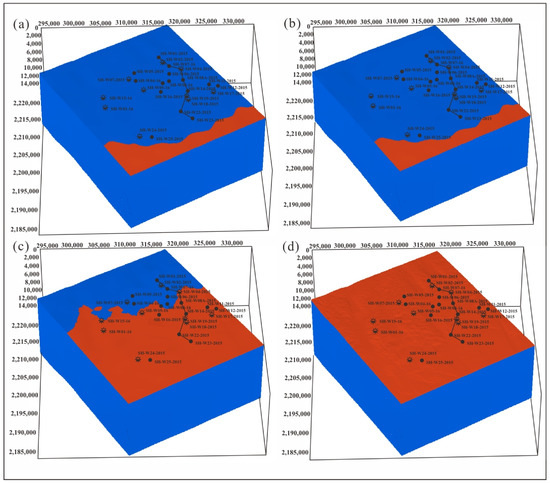
Figure 8.
3D view of gas hydrate stability zone (GHSZ, red area) evolution. (a): 14.2 Ma; (b):11.6 Ma; (c):5.3 Ma; (d): 1.8 Ma.
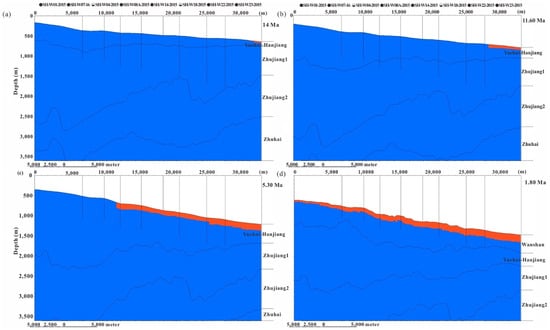
Figure 9.
Gas hydrate stability zone (GHSZ) evolution section along south–north 2D profile. (a): 14.3 Ma; (b): 11.6 Ma; (c):5.3 Ma; (d): 1.8 Ma.
4.2. Hydrocarbon Generating History
At present, the gas source for gas hydrate discovered in nature is mainly of organic origin, including deep thermogenic gas and shallow biogenic gas. In this study, the evolution history of deep thermogenic source rocks of the Wenchang Formation and Enping Formation and shallow biological source rocks are simulated, including the maturity, transformation rate, and hydrocarbon generation amount of the source rocks.
4.2.1. Maturity Evolution of Source Rocks
Most of the source rocks of the Wenchang Formation entered the oil generation window during the deposition period of the Zhuhai Formation at 23 Ma; the deepest part to the west is in the early gas generation window, while the eastern part is in the immature stage (Figure 10a). The eastern part of the Enping Formation is in the immature stage and partly enters the early stage of the oil generation window (Figure 10b).
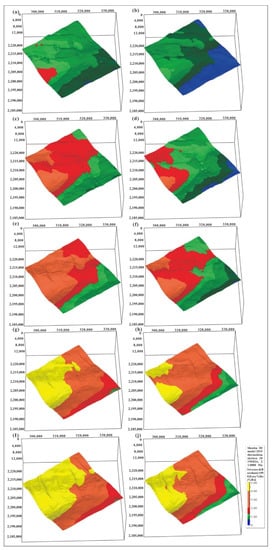
Figure 10.
Evolution of maturity of deep source rocks. (a): Wenchang Formation; (b): Enping Formation, 23 Ma. (c): Wenchang Formation; (d): Enping Formation, 18.5 Ma. (e): Wenchang Formation; (f): Enping Formation, 16 Ma. (g): Wenchang Formation; (h): Enping Formation, 5.3 Ma. (i): Wenchang Formation; (j): Enping Formation, 0 Ma.
Around 18.5 Ma, in the early stage of the Zhujiang Formation sedimentation, the deeper area in the northwest of the Wenchang Formation entered the main gas generation window, and the eastern and southern areas entered the late oil generation window (Figure 10c). The deep area in the west, the Enping Formation, entered the gas generation window, most areas in the center were in the oil generation window, and only some areas in the eastern structure high were in the immature stage (Figure 10d).
Around 16 Ma, in the late stage of the Zhujiang Formation sedimentation, most of the Wenchang Formation entered the gas generation window, and only the southeastern area was still in the oil generation window (Figure 10e). The western area of the Enping Formation entered the gas generation window, and the eastern and northern areas were still in the oil generation window (Figure 10f).
Around 5.3 Ma, during the deposition period of the Yuehai Formation, most areas of the Wenchang Formation were in the gas generation window, some areas in the west entered the over mature stage, and only some areas in the east were still in the late oil generation stage (Figure 10g). From east to west, the Enping Formation was in the main oil generation window, late oil generation window, and wet gas window, respectively. Most areas were in the dry gas stage and some areas in the west were in the over-mature stage (Figure 10h).
At present, the western region of the Wenchang Formation is in the over-mature stage, most of the central region is in the dry gas stage, and a small part of the eastern region is in the wet gas stage (Figure 10i). From east to west, the Enping Formation is in the main oil generation window, late oil generation window, and wet gas window, respectively. Most parts of the central and western regions are in the dry gas window, and the deeper parts of the western region are in the over-mature stage (Figure 10j).
4.2.2. Evolution of Transformation Rate of Source Rocks
The transformation rate is defined as the converted mass fraction of the initial kerogen (after Hantschel and Kauerauf, 2010). The simulation results show that the transformation rate of source rocks in the Wenchang Formation is close to 100%, indicating that most organic matter has been transformed into oil and gas (Figure 11a). The transformation rate of the Enping formation is more than 90% in most areas, and the transformation rate in the eastern area is relatively low, 60–70%, indicating this set of source rocks still has hydrocarbon generation potential and is still in the stage of hydrocarbon generation (Figure 11b). Coupled with the evolution simulation of deep source rocks, the source rocks of shallow biogenic gas are simulated, including the Hanjiang Formation, Yuehai Formation, Wanshan Formation, and Qionghai Formation. The transformation rate of the Qionghai Formation at the top is relatively low, and only the deep-water area in the southeast is reaching about 10% (Figure 12a). The transformation rate of source rocks in the lower Wanshan Formation increases. The transformation rate is inversely proportional to the structure, and the zone with a high transformation rate is 30–50% (Figure 12b). The transformation rate of source rocks of the Hanjiang Formation and Yuehai Formation is relatively high, reaching more than 90%, indicating most of organic matters has been transformed into biogenic gas (Figure 12c,d).
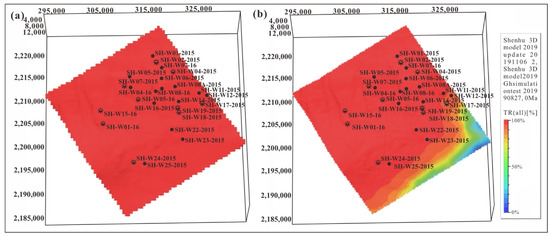
Figure 11.
Transformation rate of deep thermogenic gas source rocks. (a): Wenchang Formation; (b): Enping Formation.
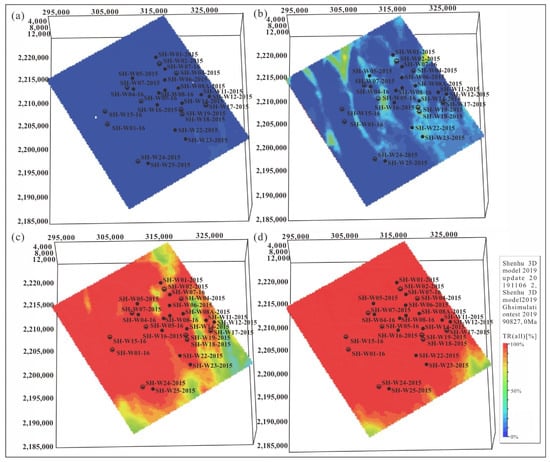
Figure 12.
Transformation rate of shallow biogenic gas source rocks. (a): Qionghai Formation; (b): Wanshan Formation; (c): Hanjiang Formation, and (d): Yuehai Formation.
In the 2D section (Figure 13), the evolution characteristics of deep and shallow source rocks both can be displayed. From the north–south section in the east, the Zhujiang Formation is in the early stage, the source rocks of the deep Wenchang Formation enter the oil generation window, and the overall transformation rate is more than 90%. The transformation rate in the deep part in the north of the Enping Formation was relatively high, and gradually decreases with the structure variation in the south (Figure 13).
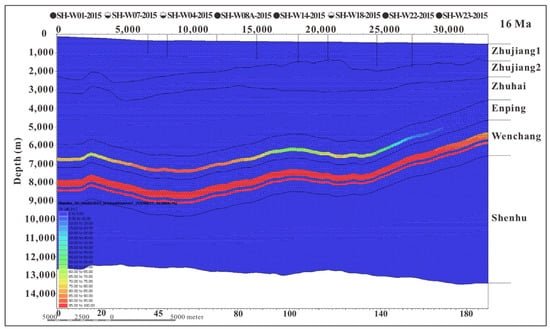
Figure 13.
2D evolution profile of hydrocarbon source rock transformation rate at 16 Ma.
Around 11.6 Ma, the sedimentary period of the Hanjiang Formation, the transformation rate of source rocks of the deep Wenchang Formation is close to 100%. In addition to the high parts in the south, the transformation rate of the Enping Formation is also more than 90%. The transformation rate of shallow biogenic gas source rock in the lower part of Hanjiang Formation is higher than 90%. The transformation rate of overlying source rock is gradually lower, 30 and 20%, respectively, and the transformation rate in the south is gradually lower (Figure 14).
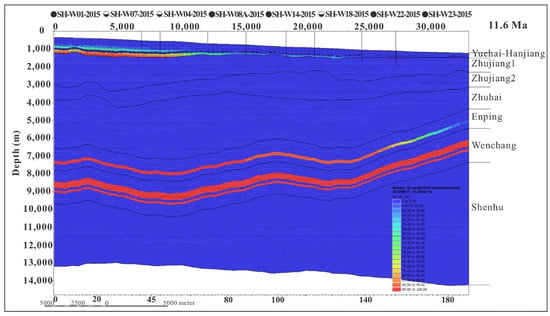
Figure 14.
2D evolution profile of transformation rate of source rock at 11.6 Ma.
Around 5.3 Ma, during the sedimentary period of the Yuehai Formation, the transformation rate in the south of the Enping Formation continues to increase with time, and the transformation rate in most areas is nearly 100%. The transformation rate of the shallow biogenic gas source rock Hanjiang Formation is 100%, and that of the Yuehai Formation is about 30% (Figure 15).
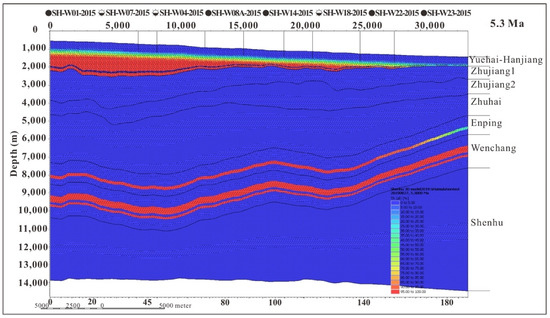
Figure 15.
2D evolution profile of transformation rate of source rock at 5.3 Ma.
Around 1.8 Ma, during the sedimentary period of the Wanshan Formation, the transformation rate of the Enping Formation is 100%. The transformation rates of shallow biogenic gas source rocks of the Hanjiang and Yuehai formations are both 100%, and that of the Wanshan Formation is about 50% (Figure 16). At present, the transformation rate of source rocks in the deep Wenchang Formation and Enping Formation is 100% in most of the area, and only the local structure high in the south is about 65%. The transformation rates of shallow biogenic gas source rocks of the Hanjiang, Yuehai, and Wanshan formations reached 100%, and the transformation rate of the Qionghai Formation decreased from base to top, ranging from 60 to 10% (Figure 17).
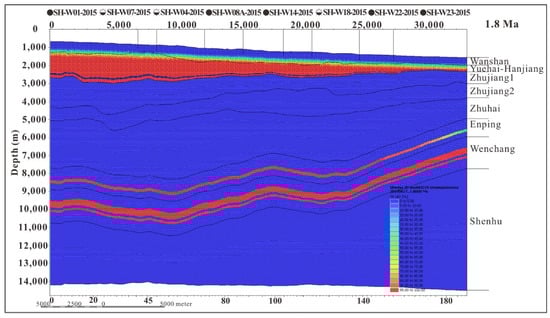
Figure 16.
2D evolution profile of transformation rate of source rock at 1.8 Ma.
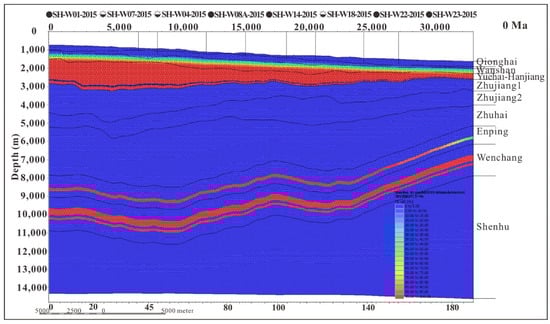
Figure 17.
2D evolution section of hydrocarbon source rock transformation rate at 0 Ma.
4.2.3. Hydrocarbon Generation
The gas source for hydrate gas in the Shenhu area includes deep thermogenic gas and shallower biogenic gas. The source rocks of deep thermogenic gas include the Enping Formation and Wenchang Formation. The thermal simulation shows (Figure 18) that the Enping source rocks began to generate oil at 25 Ma. 23 Ma and 11.6 Ma were the peaks of hydrocarbon generation and it began to generate gas at 16 Ma. Since 5.3 Ma, most of the areas have started to generate gas, and only the structures high in the east have been in the oil window until now. The source rock of the Wenchang Formation started hydrocarbon generation at 34 Ma and entered the main hydrocarbon generation period at 28.4 Ma, lasting to 18.5 Ma. After that, the amount of hydrocarbon generation decreased. Shallow biogenic gas source rocks include the Hanjiang, Yuehai, Wanshan, and Qionghai formations. The gas generation of the Hanjiang Formation began around 16 Ma and peaked in 11.6–5.3 Ma. The gas generation of the Yuehai Formation began at 11.6 Ma and peaked at 5.3–1.8 Ma. The Wanshan Formation and Yuehai Formation began to generate hydrocarbons at 5.3 Ma, and the Qionghai Formation contributed very limited hydrocarbons in the system.
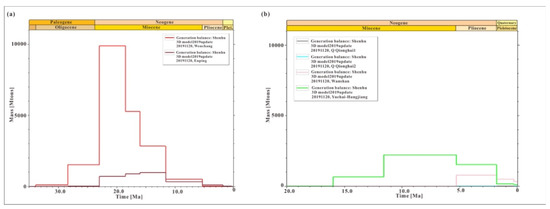
Figure 18.
Hydrocarbon generation evolution curve of source rocks in the Shenhu area. (a): deep thermogenic gas source layer; (b): shallow biogenic gas source layer.
4.3. History of Oil and Gas Migration and Accumulation
Based on the study of source rocks, the migration and accumulation of oil and gas are simulated. This simulation results show the main gas migration pathway and main formation period of gas hydrate in the study area.
With the overlap of transformation rates, the arrow of oil and gas migration are displayed (Figure 19). At 25 Ma, during the deposition of the Zhuhai Formation, the deep source rocks were dominated by oil generation, and the generated oil and gas migrated upward and accumulated in the upper Zhuhai Formation reservoir.
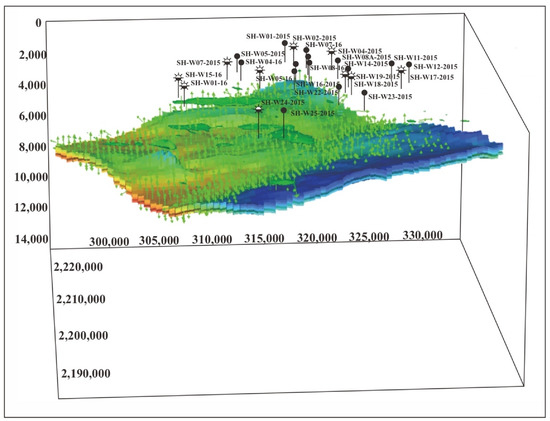
Figure 19.
Three-dimensional evolution diagram of oil and gas migration at 25 Ma. The direction of the arrow represents the direction of oil and gas migration and accumulation; green represents oil, red represents gas, and the patch represents oil and gas accumulations.
Around 16 Ma, during the deposition of the Zhujiang Formation, the source rocks in the deepest part of the west began to generate gas. However, in this period of time, oil generation was still dominant. In addition to vertical migration, there was also lateral migration from west to east (Figure 20). Around 11.6 Ma, the sedimentary period of the Hanjiang Formation, except for the structure highs in the southeast, the deep source rocks were in the gas window, mainly migrating vertically, and were accumulated in overlying reservoir layers. In the southeast, the deep thermogenic gas was transported to the shallow layer through mud diapir. The shallow biogenic gas source rock entered the hydrocarbon generation stage (Figure 21), and biogenic gas was generated (small red arrow in the upper part). Around 5.3 Ma, during the sedimentary period of the Yuehai Formation, with the increase in burial depth of shallow source rocks, they were generating more and more gas (Figure 22). Around 1.8 Ma, in the sedimentary period of the Wanshan Formation, the deep source rocks were in the gas window completely, but the amount of generated gas decreased. However, the gas generation of the shallow source rock continued to increase (Figure 23). At present, the amount of gas generated from deep source rocks continuously decreases; the gas source is mainly from shallow biogenic gas source rocks (Figure 24).
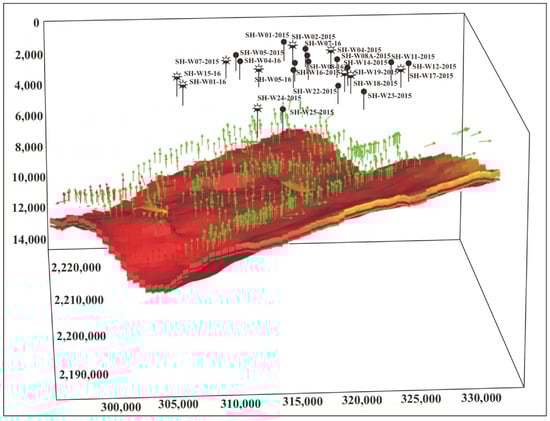
Figure 20.
Three-dimensional evolution diagram of oil and gas migration at 16 Ma. The directions of the arrows represent the directions of oil and gas migration and accumulation; green represents oil, red represents gas, and patch represents oil and gas accumulation.
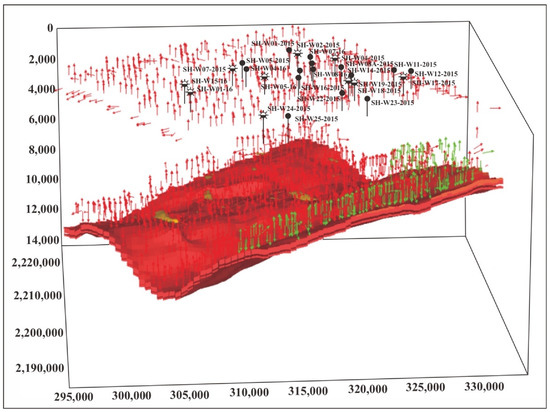
Figure 21.
Three-dimensional evolution of oil and gas migration at 11.6 Ma. The directions of the arrows represent the directions of oil and gas migration and accumulation; green represents oil, red represents gas, and patch represents oil and gas accumulation.
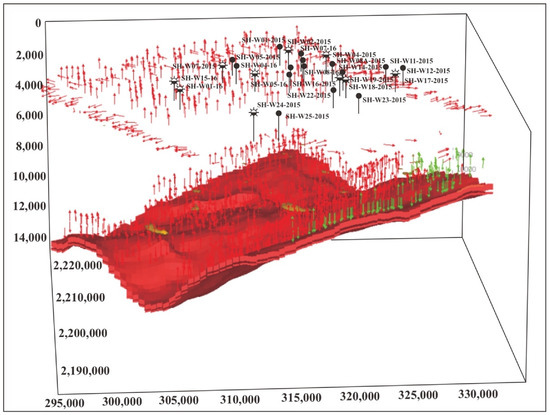
Figure 22.
Three-dimensional evolution of oil and gas migration at 5.3 Ma. The directions of the arrows represent the directions of oil and gas migration and accumulation; green represents oil, red represents gas, and patch represents oil and gas accumulation.
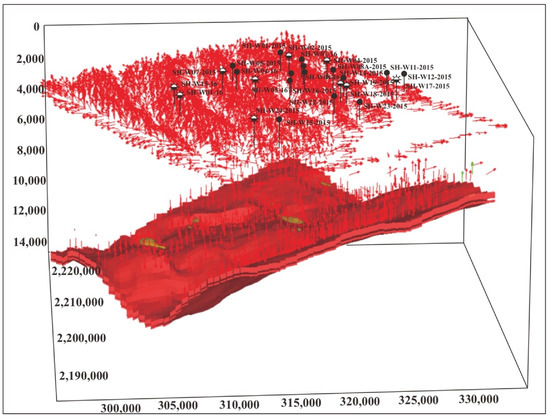
Figure 23.
Three-dimensional evolution of oil and gas migration at 1.8 Ma. The directions of the arrows represent the directions of oil and gas migration and accumulation; green represents oil, red represents gas, and patch represents oil and gas accumulation.
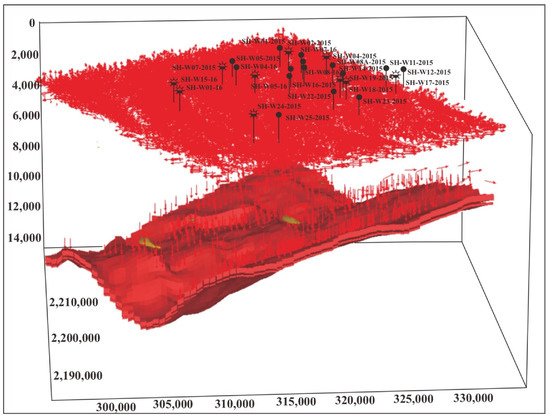
Figure 24.
Three-dimensional evolution of oil and gas migration at 0 Ma. The directions of the arrows represent the directions of oil and gas migration and accumulation; green represents oil, red represents gas, and patch represents oil and gas accumulation.
4.4. Gas Hydrate Formation and Distribution
After the simulations of temperature and pressure, variation of the GHSZ, hydrocarbon generation, migration, and accumulation (conventional oil and gas and gas hydrate) are carried out simultaneously, and the simulation results shed light on the evolution history of gas hydrate accumulation.
Around 11.6 Ma, during the sedimentary period of the Hanjiang Formation, gas hydrate began to form in the central region (Figure 25a). Around 5.3 Ma, during the deposition period of the Yuehai Formation, the gas hydrate range in the central region became smaller and migrated to the north, and sporadic gas hydrates were formed in the southern region (Figure 25b). At 1.8 Ma, during the deposition of the Wanshan Formation, gas hydrate was formed in the three structural ridges in the north, and two gas hydrate development areas were formed in the north and southeast of the study area (Figure 25c). In general, the gas hydrate distributions are roughly in line with the distribution of the submarine ridges (Figure 25d).
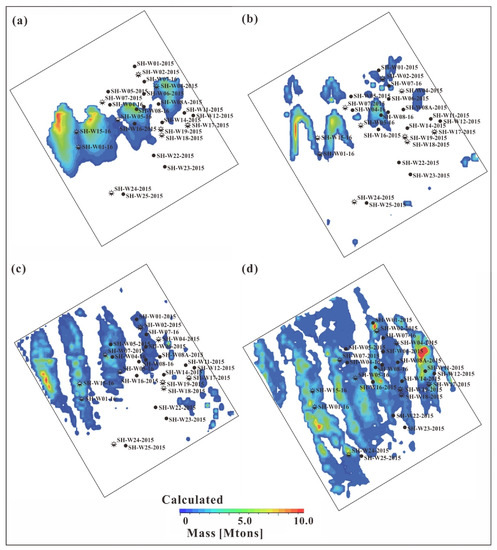
Figure 25.
Map view of distributions and evolution of gas hydrate accumulations at different ages in the Shenhu area. (a): 11.6 Ma; (b): 5.3 Ma; (c): 1.8 Ma; (d): 0 Ma.
5. Discussion
5.1. Hydrate Gas Source Analysis
In the PSM model, the shallow biogenic gas source and deep thermogenic gas source are defined respectively, and the methane generated by the Enping Formation source rock (Methane_EP) and Wenchang Formation source rock (Methane_WC) can be identified numerically. From the gas generation history of deep source rocks in Figure 18, it can be seen that the deep thermogenic gas source in the Wenchang Formation started to generate gas at 38.4 Ma. The main peak period of gas generation was between 23 to 11.6 Ma, and then the gas generation decreased to 5.3 Ma. Enping source rock began to generate gas at 23 Ma, and the gas peak was 23–5.3 Ma. After that, the gas volume decreased until 1.8 Ma. At present, the two sets of source rocks were in the late stage of hydrocarbon generation. Shallow biogenic gas source rocks include four sets of the Hanjiang, Yuehai, Wanshan and Qionghai formations. The Hanjiang–Yuehai formations began to generate gas at 16 Ma, peaked at 11.6–1.8 Ma, and is still in the late stage of gas generation. The Wanshan Formation began to generate hydrocarbon at 5.3 Ma and is now at the peak of gas generation. The Qionghai Formation began to generate gas from 5.3 Ma, but the total amount of gas is relatively small and is currently in the gas generation stage (Figure 18).
Based on the analysis of gas generation, the Wenchang Formation source rock is the largest gas contributor in the system, which is nine times that of Enping’s. The second gas contributor is the Hanjiang–Yuehai Formation, whose gas generation is twice of the Enping source rock. The gas generation of the Enping Formation and Wanshan Formation is relatively smaller, and that of the Qionghai Formation is the smallest. On the other hand, the gas generated by the source rock needs to be transported to the shallow GHSZ through the migration pathways to form gas hydrate. Therefore, the matching relationship between the hydrocarbon generation period, the active period of migration system, and the development period of the GHSZ determines gas hydrate formation and distributions.
5.2. Control of Migration Pathways on Gas Hydrate Formation
Based on the modeling results, methane in the gas hydrate mainly comes from biogenic sources, and there is no deep thermogenic gas (Figure 26). The main reason is that effective pathways connecting deep source rocks and shallow GHSZ controlled the formation and accumulation of gas hydrates in the study area. This phenomenon can be clearly seen from the 2D profile.
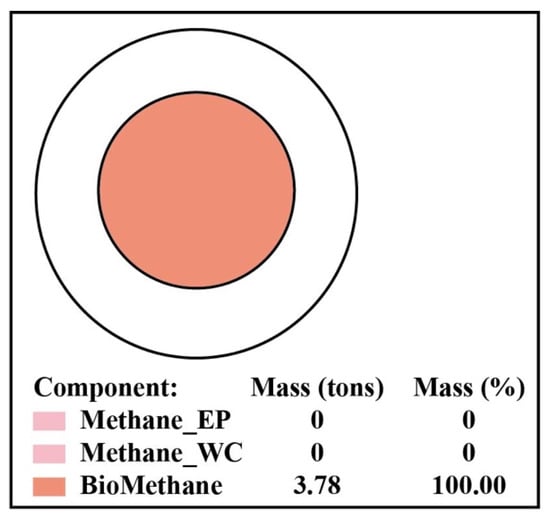
Figure 26.
Analysis of methane gas source in gas hydrate.
Around 11.6 Ma (Figure 27), the sedimentary period of the Hanjiang Formation, the source rocks from the deep Wenchang and Enping formations were mainly generating oil, which was migrating to the Zhujiang Formation and accumulating in the reservoir layers. The source rocks of the shallower Hanjiang Formation were generating biogenic gas. The most gas hydrates were sourced by shallow biogenic gas, and only some of them in the southeast was sourced by about 3% of the deep thermogenic gas. The thermogenic gas could migrate upward vertically into the GHSZ through faults, mud diapirs, and gas chimneys to form gas hydrates. In the central region, where faults and mud diapirs are developed, deep thermogenic gas can also migrate to shallow layers, but the migration timing was earlier and makes limited contribution to present day gas hydrate formation. This is also the reason why biogenic gas is the dominant gas source in the Shenhu area.
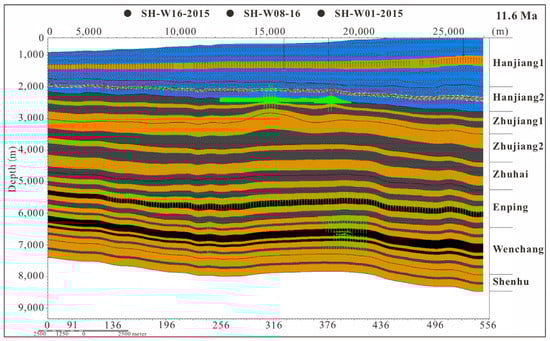
Figure 27.
2D section crossing W16, W08 and W01 shows the oil and gas migration and accumulation at 11.6 Ma. The green arrows represent the migration and accumulation of oil, and the red arrows indicate the migration and accumulation of gas.
Around 5.3 Ma (Figure 28), during the deposition of the Yuehai Formation, the source rocks of the deep Wenchang Formation began to generate gas, which migrated upward to the shallower sandstone and accumulated in the reservoir layers. The source rocks of the Enping Formation were oil prone at that time. The gas generation from the source rocks of the Hanjiang Formation were reducing.
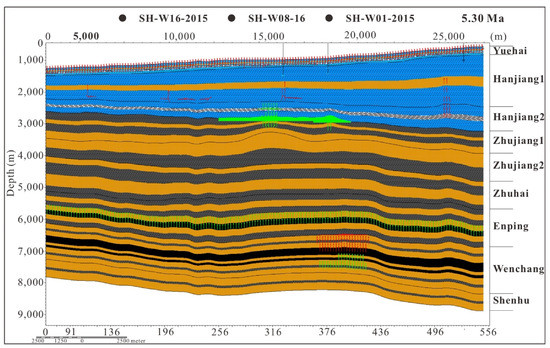
Figure 28.
2D section crossing W16, W08 and W01 shows the oil and gas migration and accumulation at 5.3 Ma. The green arrows represent the migration and accumulation of oil, and the red arrows indicate the migration and accumulation of gas.
Around 1.8 Ma (Figure 29), the sedimentary period of the Wanshan Formation, the source rocks of the deep Wenchang Formation were mainly generating gas, while the source rocks of the Enping Formation were mainly generating oil, and only a small amount of gas was generated by then.
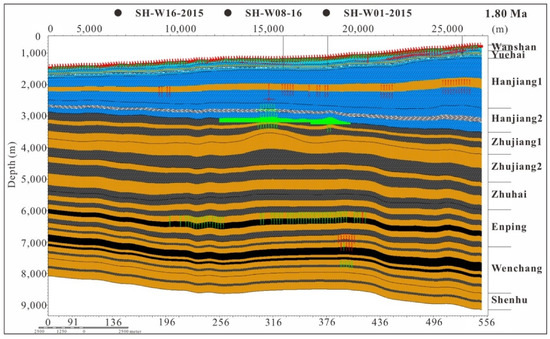
Figure 29.
2D section crossing W16, W08, and W01 shows the oil and gas migration and accumulation at 1.8 Ma. The green arrows represent the migration and accumulation of oil, and the red arrows indicate the migration and accumulation of gas.
At present (Figure 30), the source rocks of the deep Wenchang Formation and Enping Formation have entered the gas window. The shallow layers are charged by the gas generated from Qionghai source rock. This section in Figure 30 is a typical migration and accumulation profile in the study area. From the migration history, it can be concluded that the deep thermogenic gas is mainly accumulated in the deeper intervals if there is no effective pathway linking to the shallower GHSZ.
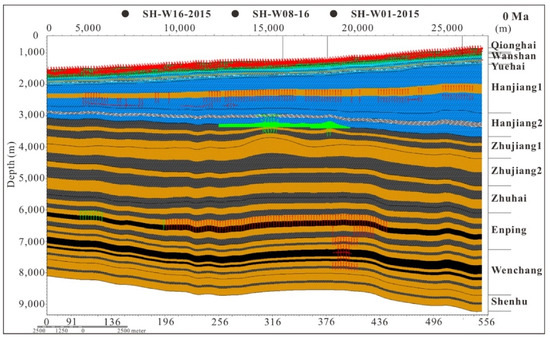
Figure 30.
2D section crossing W16, W08, and W01 shows the oil and gas migration and accumulation at 0 Ma. The green arrows represent the migration and accumulation of oil, and the red arrows indicate the migration and accumulation of gas.
Combined with the simulated evolution of gas hydrate distribution at each time period in the Shenhu area, it can be found that there is a coupling relationship between the gas hydrate distribution and the structural ridges in the north (Figure 25). It is speculated that the structural ridge may be used as a structural weak zone to reduce the formation pressure and favorable migration pathways, which is conducive to the gas from the deeper source rocks [28]. In other words, the widespread depressurization is perhaps the reason for the migration of deep hydrate gas to shallow GHSZ and gas hydrate accumulation [65]. However, some studies have pointed out that the neotectonic movements in the study area have been active since the late Miocene, and faults, fractures, diapirs, and gas chimneys developed in the area could be the vertical gas migration pathways, which were capable of transporting a large amount of oil and gas generated by deep Paleogene source rocks to the overlying Miocene, Pliocene, and even Quaternary hydrate reservoirs. Hydrocarbon migration simulation results show that the gas generated by the Wenchang Formation migrated upward to the seafloor along the fault during the deposition period of the lower Zhujiang Formation at 18.5 Ma (Figure 31a). At 11.6 Ma, during the sedimentary period of the Hanjiang Formation, the gas continued to migrate upward along the fault to the lower Zhujiang Formation (Figure 31b). The main active period of mud diapir is 11.6 Ma to the present. At 11.6 Ma, during the deposition of the Hanjiang Formation, gas began to migrate upward along the mud diapir to the Lower Zhujiang Formation (Figure 31c). By 1.8 Ma, gas continued to migrate upward along the mud diapir to the Upper Zhujiang Formation during the deposition of the Wanshan Formation (Figure 31d).
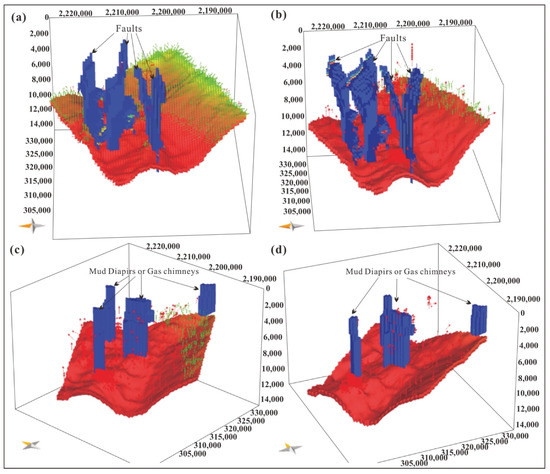
Figure 31.
Interpreted main faults (vertical extension blue patches) embedded in the 3D model and modeled vertical hydrocarbon migration of deep thermogenic gas through these faults in 18.5 Ma (a) and 11.6 Ma (b). Interpreted main mud diapirs and gas chimneys (vertical extension blue panels) embedded in the 3D model and modeled vertical hydrocarbon migration of deep thermogenic gas through them at 11.6 Ma (c) and 1.8 Ma (d). Red arrows and green arrows represent gas migration and oil migration, respectively.
The migration pathways in the study area are developed and connected the deep source rocks and shallow reservoirs. The pathway is not the only factor affecting the gas hydrate distribution in the study area, and the coupling relationship between gas generation, migration timing, and fault activation timing still needs to be considered. If the gas has already escaped before the pathway availability, it is not favorable to the accumulation of the deep thermogenic gas [66,67,68].
Based on simulation results, the development of gas hydrate is mainly controlled by water depth and lithofacies. Water depth mainly affects the depth of the GHSZ because of the temperature and pressure profile, while lithofacies controls the accumulation location of gas hydrates. The formation and distribution of gas hydrates are fundamentally controlled by the space-time matching between the hydrocarbon generation and expulsion time of oil and gas and the formation and distribution of the GHSZ.
5.3. Contribution of Gas Source to Hydrocarbon Generation and Gas Hydrate Accumulation
The simulation results show that the methane in the Wanshan Formation is 94.93% from shallow biogenic gas, 4.23% from the Enping Formation, and only 0.84% from the Wenchang Formation. The composition of methane from the Qionghai Formation is 92.15% from shallow biogenic gas, 6.90% from the Enping Formation, and 0.95% from the Wenchang Formation. It can be seen from Figure 32 that most of the methane in gas hydrate comes from a shallow biological gas source, and only a small part (~3%) of methane in gas hydrate in the southeast comes mainly from deep thermogenic gas. The thermogenic gas is mainly from the Enping Formation and Wenchang Formation.
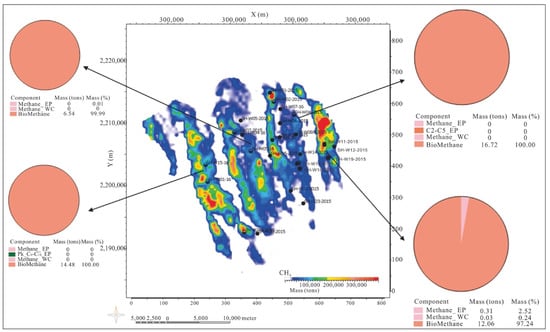
Figure 32.
Analysis of methane gas source in gas hydrate accumulations based on simulation results.
The analysis of hydrate gas sources in the trial production well in the Shenhu area needs to be combined with the simulation results. From the evolution of the GHSZ (Figure 9), it can be seen that the GHSZ was formed after 14 Ma and migrated from the south to the central region at 5.3 Ma. The hydrocarbon generation of the Wenchang Formation, a deep thermogenic source rock, basically ended around 5.3 Ma, and the source rock of the Enping Formation basically ended around 1.8 Ma. The main migration and accumulation time period of deep thermogenic gas did not match the formation time of shallow GHSZ, which is one of the main reasons why the main source of methane of gas hydrate in the area originated from the shallow biogenic gas. Although there are faults and mud diapir structures as vertical gas migration pathways, most of the migrated gas either accumulated in conventional gas reservoirs in the shallow layers or migrates to the seabed and leaked off. The deep source rock of the Enping Formation dip downward to the east. The gas generated in the late stage migrates laterally to the east, then migrates vertically to the shallow layers along the mud diapir in the southeast, and then migrates laterally from south to north along the stratum to form gas hydrate with the shallow biogenic gas (Figure 33). The hydrocarbon generation peak of shallow biogenic gas matches well with the formation time of the GHSZ and becomes the major gas source for gas hydrate in the study area.
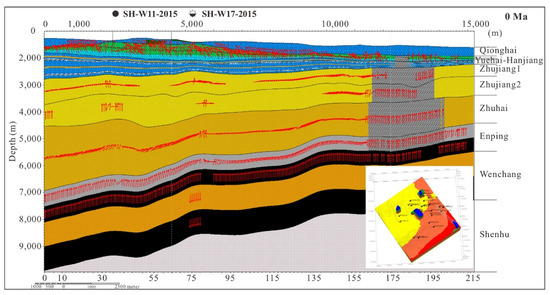
Figure 33.
2D cross-section of W11 and W17 shows the hydrocarbon migration and gas hydrate accumulation through the vertical migration pathway of mud diapir. The green arrows represent the migration and accumulation of oil, and the red arrows indicate the migration and accumulation of gas.
In terms of the gas hydrate saturation, the simulation results were calibrated with petrophysical interpretations of drilled wells. A 1D model is extracted from the 3D simulation results of typical well A, which displayed gas hydrate in around 50 m thickness with a saturation of about 19%, which was consistent with the petrophysical interpretation results from logging while drilling (Figure 34). In this way, it is proved that our simulation results are reliable and predictive to a certain extent.
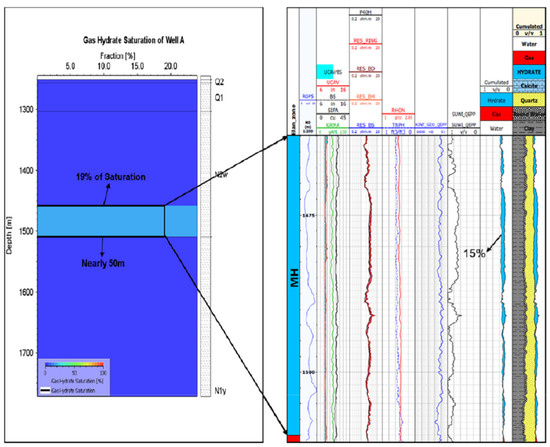
Figure 34.
Comparing the simulation results with the petrophysical interpretations from the logging while drilling data.
5.4. Limitations of This Model
Although this study was conducted based on seismic interpretations for structural framework modeling and carries out petrophysical interpretation of all logs to obtain the results of lithology, the PSM model may still be different with the actual geological situations. Moreover, the impacts of special geological events, local lithologic variation caused by special sedimentary events, are not considered. If the variation occurs in the gas-hydrate-bearing layer, it is most likely to have a profound impact on the simulation results. During the coring process, the change of the chemical, thermal, and physical surroundings of the core will also affect the measured parameters. The accuracy of lithology distribution needs to be taken into account, as it ultimately controls the gas hydrate accumulation location [69,70]. The basic input parameters and boundary conditions are speculated on based on the study of the overall physical properties of the basin, rather than measured directly, which also increases the uncertainty of the simulation. Because not all the field test results are available, the simulation results could not reflect the actual situation of the reservoir in situ, and most of the established mechanical models may not reflect the complex stress state of the reservoir.
Based on seismic analysis, drilling data, and simulations, there are abundant gas hydrate resources in the Shenhu area, but their distribution and exact quantity are still uncertain. This requires further study with all available data, otherwise it is difficult to accurately predict the resources scale and locations. Due to the lack of accuracy of reservoir data and the limitations of the evaluation methods, the uncertainty of resource quantification, gas hydrate layer characteristic description, and gas hydrate accumulation locations are inevitable. Gas hydrate phase behaviors under various P-T conditions, especially saturation of gas hydrate and the associated relative permeability of gas and water during the gas hydrate production process and/or geological burial history, is unclear by far. Therefore, the simulation still cannot provide reliable gas hydrate resources evaluations. The modeling works could be improved when more production testing data and reservoir data are available. In other gas hydrate prospects around the world (Nankai Trough offshore of Japan and the K.G. basin offshore India), it is found that there is a significant deviation between the prediction of the gas hydrate model and the actual response. Therefore, the gas hydrate model needs to be further improved to correct these uncertainties with further production trial testing and more data available [69,70,71].
6. Conclusions and Way Forward
A 3D gas hydrate PSM model of the Shenhu area was built and calibrated for thermal evolution and GHSZ distribution with source rock maturity and petrophysical interpretation from available wells of the Baiyun Sag, GHSZ evolution, hydrocarbon generation, and migration, and the gas hydrate formation and accumulation in 3D were modeled and discussed. The following conclusions can be made.
(1) Both shallow biogenic gas and deep thermogenic gas contribute to gas hydrate formation. Most areas are dominated by shallow biogenic gas, and only some areas in the southeast, about 3% of deep thermogenic gas, mainly from the source rocks of the Enping Formation, contributed to the gas hydrate based on the simulation results.
(2) Source rock of the Wenchang Formation, a deep thermogenic gas source, began hydrocarbon generation at 34 Ma, entered the main hydrocarbon generation period at 28.4 Ma, and continued to 18.5 Ma. Enping source rock began to generate oil at 25 Ma, peaked between 23 Ma–11.6 Ma, and began to generate gas at 16 Ma. Since 5.3 Ma, most of the source rock has entered the gas window, and only the structure highs in the east still in the oil window, which has lasted until now. The shallow biogenic gas source rock Hanjiang Formation began to generate gas at 16 Ma and reached its peak between 11.6–5.3 Ma. The gas generation of the Yuehai Formation began at 11.6 Ma and peaked during 5.3–1.8 Ma. The Wanshan Formation began hydrocarbon generation at 5.3 Ma, and the gas generation peaked during 5.3–1.8 Ma. The Qionghai Formation started hydrocarbon generation from 0.3 Ma and is still in the hydrocarbon generation stage.
(3) GHSZ covered the entire Shenhu area and mainly developed at the Qionghai Formation and partially at the Wanshan formation at present. The GHSZ was formed in the Hanjiang Formation at 14.2 Ma first. With water depth becoming deeper, GHSZ moved upward. Laterally, GHSZ developed in the south at the beginning and expanded to the north gradually and covered the whole Shenhu area in the Wanshan Formation at 1.8 Ma. At 1.8 Ma, during the deposition period of the Wanshan Formation, the GHSZ covered all over the region and kept unchanged until to present day. The thickness of the GHSZ from east to west was basically stable with a range of 150–200 m, while the thickness in the south is about 200 m and thinned to 100 m to the north.
(4) At 11.6 Ma, gas hydrate began to form in the central area during the sedimentary period of the Hanjiang Formation. At 5.3 Ma, during the deposition period of the Yuehai Formation, the gas hydrate distribution in the central area became smaller, and sporadic gas hydrates were formed in the southern area. Around 1.8 Ma, during the deposition period of the Wanshan Formation, gas hydrate was formed in the three structural ridges in the north, and two gas hydrate development areas were formed in the southwest and southeast to the south. At present, gas hydrate is distributed in most areas matching with the structural ridges, which is consistent with the drilling data.
(5) The development of gas hydrate is mainly controlled by water depth and lithofacies. Furthermore, water depth mainly controls the depth of the GHSZ, while shallow lithofacies control the accumulation locations of gas hydrates. The formation and distribution of gas hydrates are fundamentally controlled by the space-time matching between the hydrocarbon generation and expulsion time and the formation and distribution of the GHSZ. Thermogenic gas can migrate vertically through faults, mud diapir, and gas chimney into the GHSZ to form gas hydrates. In the area, faults and mud diapirs are developed in the central region, which conduct the deep thermogenic gas to the shallow layers. However, due to the early migration period of gas and the mismatch with the time of fault formation, deep thermogenic gas makes very limited contribution to gas hydrate formation.
Author Contributions
Conceptualization, P.S.; Formal analysis, W.Z.; Supervision, J.L. and H.Q.; Methodology, J.X. and F.M.; Visualization, J.X.; Investigation, T.L., X.W., J.Z., Z.W., and F.W.; Writing—original draft, P.S.; Writing—review & editing Y.L., and W.Z. All authors have read and agreed to the published version of the manuscript.
Funding
This work was supported by the Guangdong Province Marine Economic Development (Six Major Marine Industries) Special Fund Project, grant number [2021] No. 58; Foundation of Hubei Key Laboratory of Marine Geological Resources, grant number MGR202002; “The Fourteenth Five-Year Plan” Prospective Basic Major Scientific and Technological Projects of CNPC, grant number 2021DJ4901; China Geological Survey Project, grant number DD20190224, DD20221705 and DD20221725; and National Natural Science Foundation of China, grant number 41876069 and 92058208.
Acknowledgments
The authors wish to thank those who contributed to the success of the acquisition and process of 3D seismic data in the Shenhu area. We would like to thank all reviewers and editors for their helpful suggestions and constructive comments, which greatly improved this manuscript.
Conflicts of Interest
The authors declare no conflict of interest.
References
- Kvenvolden, K.A. A primer on the geological occurrence of gas hydrate. Geol. Soc. Spec. Publ. 1998, 137, 9–30. [Google Scholar] [CrossRef]
- Collett, T.S. Energy resource potential of natural gas hydrates. AAPG Bull. 2002, 86, 1971–1992. [Google Scholar]
- Boswell, R.; Hancock, S.; Yamamoto, K.; Collett, T.; Pratap, M.; Lee, S.-R. Natural gas hydrates: Status of potential as an energy resource. Future Energy 2020, 6, 111–131. [Google Scholar]
- Bohrmann, G.; Greinert, J.; Suess, E.; Torres, M. Authigenic carbonates from Cascadia subduction zone and their relation to gas hydrate stability. Geology 1998, 26, 647–650. [Google Scholar] [CrossRef]
- Suess, E.; Torres, M.E.; Bohrmann, G.; Collier, R.W.; Greinert, J.; Linke, P.; Rehder, G.; Trehu, A.; Wallmann, K.; Winckler, G.; et al. Gas hydrate destabilization: Enhanced dewatering, benthic material turnover, and larger methane plumes at the Cascadia convergent margin. Earth Planet. Sci. Lett. 1999, 170, 1–15. [Google Scholar] [CrossRef]
- Elvert, M.; Greinert, J.; Suess, E.; Whiticar, M.J. Carbon isotopes of biomarkers derived from methane-oxidizing at hydrate ridge, Cascadia convergent margin. In Natureal Gas Hydrates: Occurrence, Distribution, and Detection; Paull, C.K., Dillon, W.P., Eds.; American Geophysical Union: Washington, DC, USA, 2001; pp. 115–129. [Google Scholar]
- Greinert, J.; Bohrmann, G.; Suess, E. Gas hydrate-associated carbonates and methane-venting at Hydrate Ridge: Classification, distribution and origin of authigenic lithologies. In Natural Gas Hydrate: Ocurrence, Distribution and Detection; Puall, C.K., Dillon, P.W., Eds.; American Geophysical Union: Washington, DC, USA, 2001; Volume 124, pp. 99–113. [Google Scholar]
- Tishchenko, P.; Hensen, C.; Wallmann, K.; Wong, C.S. Calculation of the stability and solubility of methane hydrate in seawater. Chem. Geol. 2005, 219, 37–52. [Google Scholar] [CrossRef]
- Wallmann, K.; Aloisi, G.; Haeckel, M.; Obzhirov, A.; Pavlova, G.; Tishchenko, P. Kinetics of organic matter degradation, microbial methane generation and gas hydrate formation in anoxic marine sediments. Geochim. Cosmochim. Acta 2006, 70, 3905–3927. [Google Scholar] [CrossRef]
- Qian, B.Z.; Zhu, J.F. Gas Hydrate: Huge penitential energy. Nat. Gas Oil 2008, 26, 47–52. [Google Scholar]
- Hustoft, S.; Buenz, S.; Mienert, J.; Chand, S. Gas hydrate reservoir and active methane venting system in sediments on <20 Ma young oceanic crust in the Fram Strait, offshore NW-Svalbard. Earth Planet. Sci. Lett. 2009, 284, 12–24. [Google Scholar]
- Grassmann, S.; Cramer, B.; Delisle, G.; Hantschel, T.; Messner, J.; Winsemann, J. PT-effects of Pleistocene glacial periods on permafrost, gas hydrate zones and reservoir of the Mittelplate oil field, northern Germany. Mar. Pet. Geol. 2010, 27, 298–306. [Google Scholar] [CrossRef]
- Collett, T.; Lee, M.; Agena, W.; Miller, J.J.; Lewis, K.A.; Zyrianova, M.V.; Boswell, R.; Inks, T.L. Permafrost-associated natural gas hydrate occurrences on the Alaska North Slope. Mar. Pet. Geol. 2011, 28, 279–294. [Google Scholar] [CrossRef]
- Lorenson, T.D.; Collett, T.S. Gas Hydrate Prospecting Using Well Cuttings and Mud-Gas Geochemistry from 35 Wells, North Slope, Alaska; U.S. Geological Survey Scientific Investigations Report 2011-5195; U.S. Geological Survey: Reston, VA, USA, 2011; p. 27. [Google Scholar]
- Derks, J.; Fuchs, T.; Hantschel, T.; Kauerauf, A.; Neumaier, M.; Schenk, O.; Swientek, O.; Tessen, N.; Welte, D.; Wygrala, B. Basin and Petroleum System Modeling. Oilfield Rev. 2009, 21, 14–29. [Google Scholar]
- Hantschel, T.; Kauerauf, A. Fundamentals of Basin and Petroleum Systems Modeling; Springer: Berlin/Heidelberg, Germany, 2010. [Google Scholar]
- Luo, M.; XU, J.H.; Zhou, J.J.; Zhou, Y.H.; Liu, W.Y. 2D petroleum system modeling to reduce exploration well deployment risks: A case study from the Pearl River Mouth Basin, South China sea. AAAPG2019 IOP Conf. Ser. Earth Environ. Sci. 2019, 360, 012046. [Google Scholar] [CrossRef]
- Xu, J.H. Shale Gas Exploration Technology from Schlumberger. Pet. Equip. 2014, 86–88. [Google Scholar]
- Zhang, Y.; Xu, J.H.; Zhang, J.Q. Quantantative simulation on percentage of absorbed gas and free gas in shale—Case study on Longmaxi shale in Youyangdong area. In Proceedings of the 9th China Oil Migration Conference, Hefei, China, September 2019. [Google Scholar]
- Xu, J.H.; Yue, J.P.; Wang, H.; Wygrala, B. IPTC-19282-MS. Innovative Reservoir Classification with Natural Fracture Geometry to Guide Well Stimulation for Unconventional Tight Gas Field. In Proceeding of the International Petroleum Technology Conference, Beijing, China, 26–28 March 2019; pp. 26–28. [Google Scholar]
- Su, P.B.; Liang, J.Q.; Peng, J.; Zhang, W.; Xu, J.H. Petroleum systems modeling on gas hydrate of the first experimental exploitation region in the Shenhu area, northern South China sea. J. Asian Earth Sci. 2018, 168, 57–76. [Google Scholar] [CrossRef]
- Piñero, E.; Hensen, C.; Haeckel, M.; Rottke, W.; Fuchs, T.; Wallmann, K. 3-D numerical modelling of methane hydrate accumulations using PetroMod. Mar. Pet. Geol. 2016, 71, 288–295. [Google Scholar] [CrossRef]
- Haeckel, M.; Pińero, E.; Rottke, W.; Fuchs, T.; Hensen, C.; Wallmann, K. 3-D numerical modelling of gas hydrate accumulations at the Alaska North Slope. In Proceeding of the 75th EAGE Conference & Exhibition-Workshops, European Association of Geoscientists & Engineers, London, UK, 10–13 June 2013; p. cp–349. [Google Scholar]
- Kroeger, K.F.; Crutchley, G.J.; Hill, M.G.; Pecher, I.A. Potential for gas hydrate formation at the northwest New Zealand shelf margin-New insights from seismic reflection data and petroleum systems modelling. Mar. Pet. Geol. 2017, 83, 215–230. [Google Scholar] [CrossRef]
- Crutchley, G.J.; Kroeger, K.F.; Pecher, I.A.; Mountjoy, J.J.; Gorman, A.R. Gas hydrate formation amid submarine canyon incision: Investigations from New Zealand’s Hikurangi subduction margin. Geochem. Geophys. Geosystems 2017, 18, 4299–4316. [Google Scholar] [CrossRef]
- Kroeger, K.F.; Crutchley, G.J.; Kellett, R.; Barnes, P.M. A 3-D Model of Gas Generation, Migration, and Gas Hydrate Formation at a Young Convergent Margin (Hikurangi Margin, New Zealand). Geochem. Geophys. Geosystems 2019, 20, 5126–5147. [Google Scholar] [CrossRef]
- Fujii, T.; Tin Aung, T.; Wada, N.; Komatsu, Y.; Suzuki, K.; Ukita, T.; Wygrala, B.; Fuchs, T.; Rottke, W.; Egawa, K. Modeling gas hydrate petroleum systems of the Pleistocene turbiditic sedimentary sequences of the Daini-Atsumi area, eastern Nankai Trough, Japan. Interpretation 2016, 4, SA95–SA111. [Google Scholar] [CrossRef]
- Hillman, J.I.; Crutchley, G.J.; Kroeger, K.F. Investigating the role of faults in fluid migration and gas hydrate formation along the southern Hikurangi Margin, New Zealand. Mar. Geophys. Res. 2020, 41, 1–19. [Google Scholar] [CrossRef]
- Higley, D.K.; Lewan, M.; Roberts, L.N.; and Henry, M.E. Petroleum System Modeling Capabilities for Use in Oil and Gas Resource Assessments; US Geological Survey Open-File Report: Reston, VA, USA, 2006; Volume 1024, p. 18. [Google Scholar]
- Al-Ameri, T.K.; Pitman, J.; Naser, M.E.; Zumberge, J.; Al-Haydari, H.A. Programed oil generation of the Zubair Formation, Southern Iraq oil fields: Results from Petromod software modeling and geochemical analysis. Arab. J. Geosci. 2011, 4, 1239–1259. [Google Scholar] [CrossRef]
- Bruns, B.; Di Primio, R.; Berner, U.; Littke, R. Petroleum system evolution in the inverted Lower Saxony Basin, northwest Germany: A 3 D basin modeling study. Geofluids 2013, 13, 246–271. [Google Scholar] [CrossRef]
- Schenk, O.; Magoon, L.B.; Bird, K.J.; Peters, K.E. Petroleum System Modeling of Northern Alaska; AAPG: Tulsa, OK, USA, 2012. [Google Scholar]
- Enmanuel, R.D.; Rolando, D.P.; Zahie, A.; Stoddart, D.; Horsfield, B. Brian Horsfield 3D-basin modelling of the Hammerfest Basin (southwestern Barents Sea): A quantitative assessment of petroleum generation, migration and leakage. Mar. Pet. Geol. 2013, 45, 281–303. [Google Scholar]
- Kroeger, K.F.; Plaza-Faverola, A.; Barnes, P.M.; Pecher, I.A. Thermal evolution of the New Zealand Hikurangi subduction margin: Impact on natural gas generation and methane hydrate formation e a model study. Mar. Pet. Geol. 2015, 63, 97e114. [Google Scholar] [CrossRef]
- Kroeger, K.F.; Funnell, R.H.; Nicol, A.; Fohrmann, M.; Bland, K.J.; King, P.R. 3D crustal-scale heat-flow regimes at a developing active margin (Taranaki Basin, New Zealand). Tectonophysics 2013, 591, 175–193. [Google Scholar] [CrossRef]
- Wang, X.J.; Collett, T.S.; Lee, M.W.; Yang, S.X.; Guo, Y.Q.; Wu, S.G. Geological controls on the occurrence of gas hydrate from core, downhole log, and seismic data in the Shenhu area, South China Sea. Mar. Geol. 2014, 357, 272–292. [Google Scholar] [CrossRef]
- Zhang, G.X.; Liang, J.Q.; Lu, J.A.; Yang, S.X.; Zhang, M.; Holland, M.; Schultheiss, P.; Su, X.; Sha, Z.B.; Xu, H.N.; et al. Geological features, controlling factors and potential prospects of the gas hydrate occurrence in the east part of the Pearl River Mouth Basin, South China Sea. Mar. Pet. Geol. 2015, 67, 356–367. [Google Scholar] [CrossRef]
- Sha, Z.B.; Liang, J.Q.; Su, P.B.; Zhang, G.X.; Lu, J.A.; Wang, J.L. Natural gas hydrate accumulation elements and drilling results analysis in the eastern part of the Pearl River Mouth Basin. Earth Sci. Front. 2015, 22, 125–135. [Google Scholar]
- Zhang, W.; Liang, J.Q.; Wei, J.G.; Lu, J.A.; Su, P.B.; Lin, L.; Huang, W.; Guo, Y.Q.; Deng, W.; Yang, X.L.; et al. Geological and geophysical features of and controls on occurrence and accumulation of gas hydrates in the first offshore gas-hydrate production test region in the Shenhu area, Northern South China Sea. Mar. Pet. Geol. 2020, 114, 104191. [Google Scholar] [CrossRef]
- Li, J.F.; Ye, J.L.; Qin, X.W.; Qiu, H.J.; Wu, N.Y.; Lu, H.L.; Xie, W.W.; Lu, J.A.; Peng, F.; Xu, Z.Q.; et al. The first offshore natural gas hydrate production test in South China Sea. China Geol. 2018, 1, 5–16. [Google Scholar] [CrossRef]
- Ye, J.L.; Qin, X.W.; Xie, W.W.; Lu, H.L.; Ma, B.J.; Qiu, H.J.; Liang, J.Q.; Lu, J.A.; Kuang, Z.G.; Lu, C.; et al. Main progress of the second gas hydrate trial production in the South China Sea. Geol. China 2020, 47, 557–568. (In Chinese) [Google Scholar]
- He, J.X.; Zhong, C.M.; Yao, Y.J.; Yan, P.; Wang, Y.L.; Wan, Z.F.; Guan, J.; Zhang, J.F. The exploration and production test of gas hydrate and its research progress and exploration prospect in the northern South China Sea. Mar. Geol. Front. 2020, 36, 14. [Google Scholar]
- Sun, L.Y.; Zhang, G.X.; Wang, X.J.; Jin, J.P.; He, W.; Zhu, Z.Y. Numerical modeling of gas hydrate saturation for the Shenhu area, South China Sea. Mar. Geol. Quat. Geol. 2020, 41, 210–221. [Google Scholar]
- Liang, Q.Y.; Xiao, X.; Zhao, J.; Zhang, W.; Li, Y.; Wu, X.M.; Ye, J.L.; Qin, X.W.; Qiu, H.J.; Liang, J.Q.; et al. Geochemistry and sources of hydrate-bound gas in the Shenhu area, northern south China sea: Insights from drilling and gas hydrate production tests. J. Pet. Sci. Eng. 2022, 208, 10945. [Google Scholar] [CrossRef]
- Lai, H.F.; Fang, Y.X.; Kuang, Z.G.; Ren, J.F.; Liang, J.Q.; Lu, J.A.; Wang, G.L.; Xing, C.Z. Geochemistry, origin and accumulation of natural gas hydrates in the Qiongdongnan Basin, South China Sea: Implications from site GMGS5-W08. Mar. Pet. Geol. 2021, 123, 104774. [Google Scholar] [CrossRef]
- Beaudoin, Y.C.; Dallimore, S.R.; Boswell, R. Frozen Heat: A UNEP Global Outlook on Methane Gas Hydrates, Volume 2; UNEP: Nairobi, Republic of Kenya, 2014. [Google Scholar]
- Boswell, R.; Myshakin, E.; Moridis, G.; Konno, Y.; Collett, T.S.; Reagan, M.; Ajayi, T.; Seol, Y. India National Gas Hydrate Program Expedition 02 summary of scientific results: Numerical simulation of reservoir response to depressurization. Mar. Petrol. Geol. 2019, 108, 154–166. [Google Scholar] [CrossRef]
- Su, P.B.; Liang, J.Q.; Zhang, W.; Liu, F.; Li, T.W.; Wang, F.F.; Wang, X.X. Numerial simulation of gas hydrate migration-accumulation system and trial mining optimization of orebodies in the Shenhu area. Geol. Bull. China 2021, 40, 267–279. (In Chinese) [Google Scholar]
- He, L.; Wang, X.L.; Cai, N.B.; Qu, J.; Zhu, X.; Lin, D.M. Structural and Sedimentary Characteristics of Hydrocarbon-Rich Sags in Lacustrine Sub-Basin of Half Graben Type, Pearl River Mouth Basin, South China Sea. Open J. Yangtze Gas Oil 2019, 4, 194–211. [Google Scholar] [CrossRef][Green Version]
- Xie, Z.Y.; Wei, J.G.; Zheng, J.Y.; Sun, Z.; Zhang, K. A 3D basin modeling study of the factors controlling gas hydrate accumulation in the Shenhu Area of the South China Sea. China Geol. 2022, 5, 218–233. [Google Scholar] [CrossRef]
- Hu, J.; Long, Z.L.; Huang, Y.P.; Zhang, L.Y.; Hu, D.; Wang, Y.B.; Hu, S.B. Tectono-thermal modelling of Baiyun Sag, Pearl River Mouth Basin, since Cenozoic. Chin. J. Geophys. 2021, 64, 1654–1665. [Google Scholar]
- He, J.X.; Yao, Y.J.; Liu, H.L.; Wan, Z.F. Genetic types of natural gas and characteristic of the gas source composition in marginal basins of the northern South China Sea. Geol. China 2008, 5, 1007–1016. [Google Scholar]
- Cui, J.; He, J.X.; Zhou, Y.Z.; Cui, S.S. Origin of nature gas and resource potential of oil and gas in Baiyun Sag‚ Pearl River Mouth Basin. Nat. Gas Geosci. 2009, 20, 125–130. [Google Scholar]
- Chen, C.M. Petroleum geology and conditions for hydrocarbon accumulation in the eastern Pearl River Mouth Basin. China Offshore Oil Gas 2000, 14, 73–83. [Google Scholar]
- Mi, L.J.; Zhang, G.C.; Fu, N. An analysis of hydrocarbon source and accumulation in Panyu low-up lift and north slope of Baiyun Sag, Pearl River Mouth Basin. China Offshore Oil Gas 2006, 3, 161–168. [Google Scholar]
- Mi, L.J.; Zhang, G.C.; Shen, H.L.; Liu, Z.; Guo, R.; Zhong, K.; Tian, J.X. Eocene-Lower Oligocene sedimentation characteristics of Baiyun Sag in the deep-water area of Pearl River Mouth Basin. Acta Pet. Sin. 2008, 1, 29–34. [Google Scholar]
- Zhu, J.Z.; Shi, H.S.; Pang, X.; He, M.; Yang, S.K.; Li, Z.W. Zhuhai Formation source rock evaluation and reservoired hydrocarbon source analysis in the deepwater area of Baiyun sag, Pearl River Mouth basin. China Offshore Oil Gas 2008, 4, 223–227. (In Chinese) [Google Scholar]
- He, J.X.; Lu, Z.Q.; Su, P.B.; Zhang, W.; Feng, J.X. Source Supply System and reservoir forming model prediction of natural gas hydrate in the deep-water area of the northern South China Sea. J. Southwest Pet. Univ. Sci. Technol. Ed. 2016, 38, 8–24. [Google Scholar]
- Su, P.B.; Liang, J.Q.; Sha, Z.B.; Fu, S.Y. Gas Sources Condition of Gas Hydrate Formation in Shenhu Deep Water Sea Zone. J. Southwest Pet. Univ. Sci. Technol. Ed. 2014, 36, 1–8. [Google Scholar]
- Fu, N.; Mi, L.J.; Zhang, G.C. Source rocks and origin of oil and gas in the northern Baiyun Depression of Pearl River Mouth Basin. Acta Pet. Sin. 2007, 28, 32–38. [Google Scholar]
- Su, P.B.; Liang, J.Q.; Sha, Z.B.; Fu, S.Y.; Lei, H.Y.; Gong, Y.H. Dynamic simulation of gas hydrate reservoirs in the Shenhu area, the northern South China Sea. Acta Pet. Sin. 2011, 32, 226–233. [Google Scholar]
- Zhang, G.C.; Yang, H.Z.; Chen, Y.; Ji, M.; Wang, K.; Yang, D.S. The Baiyun sag: A giant rich gas-generation sag in the deep-water area of the Pearl River Mouth basin. Nat. Gas Ind. 2014, 34, 11–25. [Google Scholar]
- Wu, W.Z.; Xia, B.; Jiang, Z.L.; Luo, Z.P. Sedimentary evolution and hydrocarbon accumulation in the Baiyun depression, Zhujiangkou Basin. Sediment. Geol. Tethyan Geol. 2013, 33, 25–33. [Google Scholar]
- Wygrala, B.P. Integrated Study of an Oil Field in the Southern Po Basin, Northern Italy. Ph.D. Thesis, University of Cologne, Köln, Germany, 1989. [Google Scholar]
- Bohrmann, G.; Torres, M.E. Gas Hydrates in Marine Sediments; Springer: Berlin/Heidelberg, Germany, 2006. [Google Scholar]
- Zhang, W.; Liang, J.Q.; He, J.X.; Cong, X.R.; Su, P.B. Characteristics of mud diapir and gas chimney and their relationship with reservoir forming for petroleum and natural gas hydrate on northern slope of the South China Sea. Mar. Geol. Front. 2017, 33, 11–23. [Google Scholar]
- Liu, J.; Yang, R.; Zhang, J.H.; Wei, W.; Wu, D.D. Gas hydrate accumulation conditions in the Huaguang Depression of Qiongdongnan Basin and prediction of favorable zones. Mar. Geol. Quat. Geol. 2019, 39, 137–145. [Google Scholar]
- Su, M.; Sha, Z.B.; Zhang, C.M.; Wang, H.B.; Wu, N.Y.; Yang, R.; Liang, J.Q.; Qiao, S.H.; Cong, X.R.; Liu, J. Types, Characteristics and Significances of Migrating Pathways of Gas-bearing Fluids in the Shenhu Area, Northern Continental Slope of the South China Sea. Acta Geol. Sin. 2017, 91, 219–231. [Google Scholar] [CrossRef]
- Konno, Y.; Kato, A.; Yoneda, J.; Oshima, M.; Kida, M.; Jin, Y.; Nagao, J.; Tenma, N. Numerical analysis of gas production potential from a gas-hydrate reservoir at Site NGHP-02-16, the Krishna—Godavari Basin, offshore India—Feasibility of depressurization method for ultra-deepwater environment. Mar. Petrol. Geol. 2019, 108, 731–740. [Google Scholar] [CrossRef]
- Lin, J.S.; Uchida, S.; Myshakin, E.M.; Seol, Y.; Rutqvist, J.; Boswell, R. Assessing the geomechanical stability of interbedded hydrate-bearing sediments under gas production by depressurization at NGHP-02 Site 16. Mar. Petrol. Geol. 2019, 108, 648–659. [Google Scholar] [CrossRef]
- Singh, R.P.; Parashar, S.; Muralidhar, K.; Das, M.K. Recovery of methane from a gas hydrate reservoir using depressurization and N2 injection. Spec. Top. Rev. Porous Media 2021, 12, 53–71. [Google Scholar] [CrossRef]
Disclaimer/Publisher’s Note: The statements, opinions and data contained in all publications are solely those of the individual author(s) and contributor(s) and not of MDPI and/or the editor(s). MDPI and/or the editor(s) disclaim responsibility for any injury to people or property resulting from any ideas, methods, instructions or products referred to in the content. |
© 2022 by the authors. Licensee MDPI, Basel, Switzerland. This article is an open access article distributed under the terms and conditions of the Creative Commons Attribution (CC BY) license (https://creativecommons.org/licenses/by/4.0/).