
Economic Viability of Rooftop Photovoltaic Systems and Energy Storage Systems in Qatar


Abstract
:1. Introduction and Background
1.1. Viability Analysis of Photovoltaic (PV) Systems
1.2. Economic Analysis of PV Systems
2. Methodology
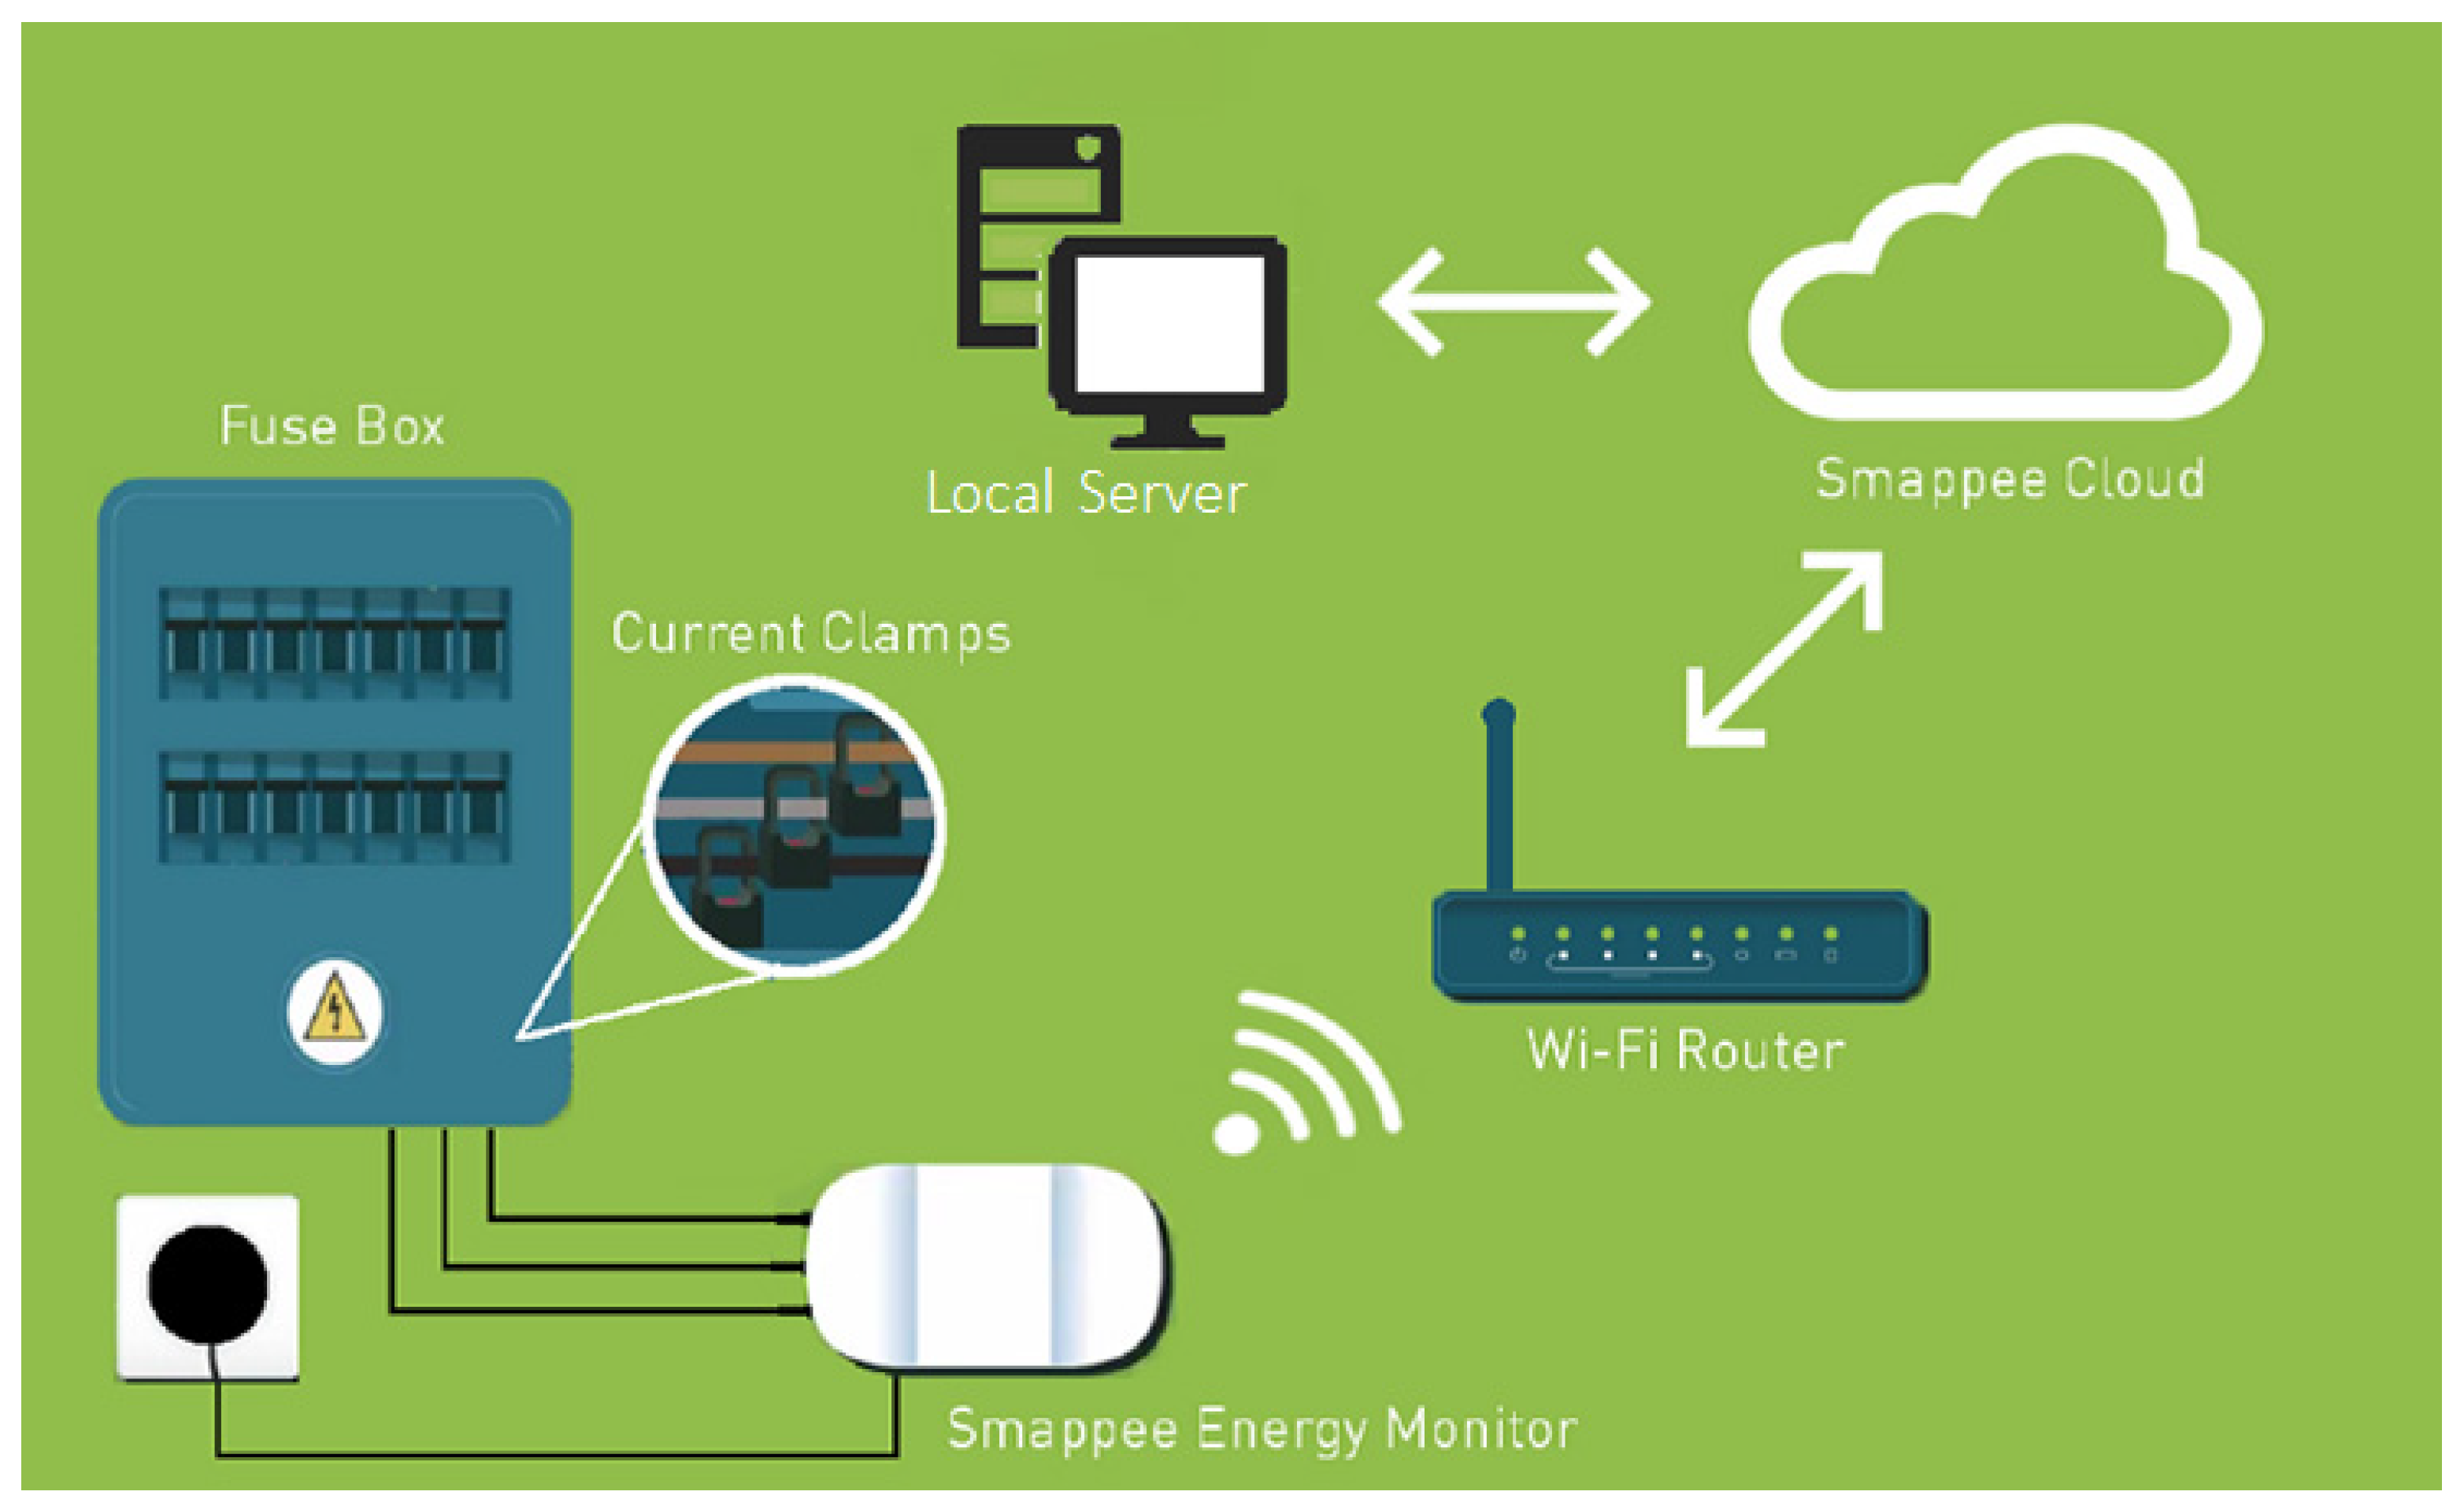
2.1. Energy Monitoring System Structure
2.2. Solar Energy Data
2.2.1. PV System Sizing
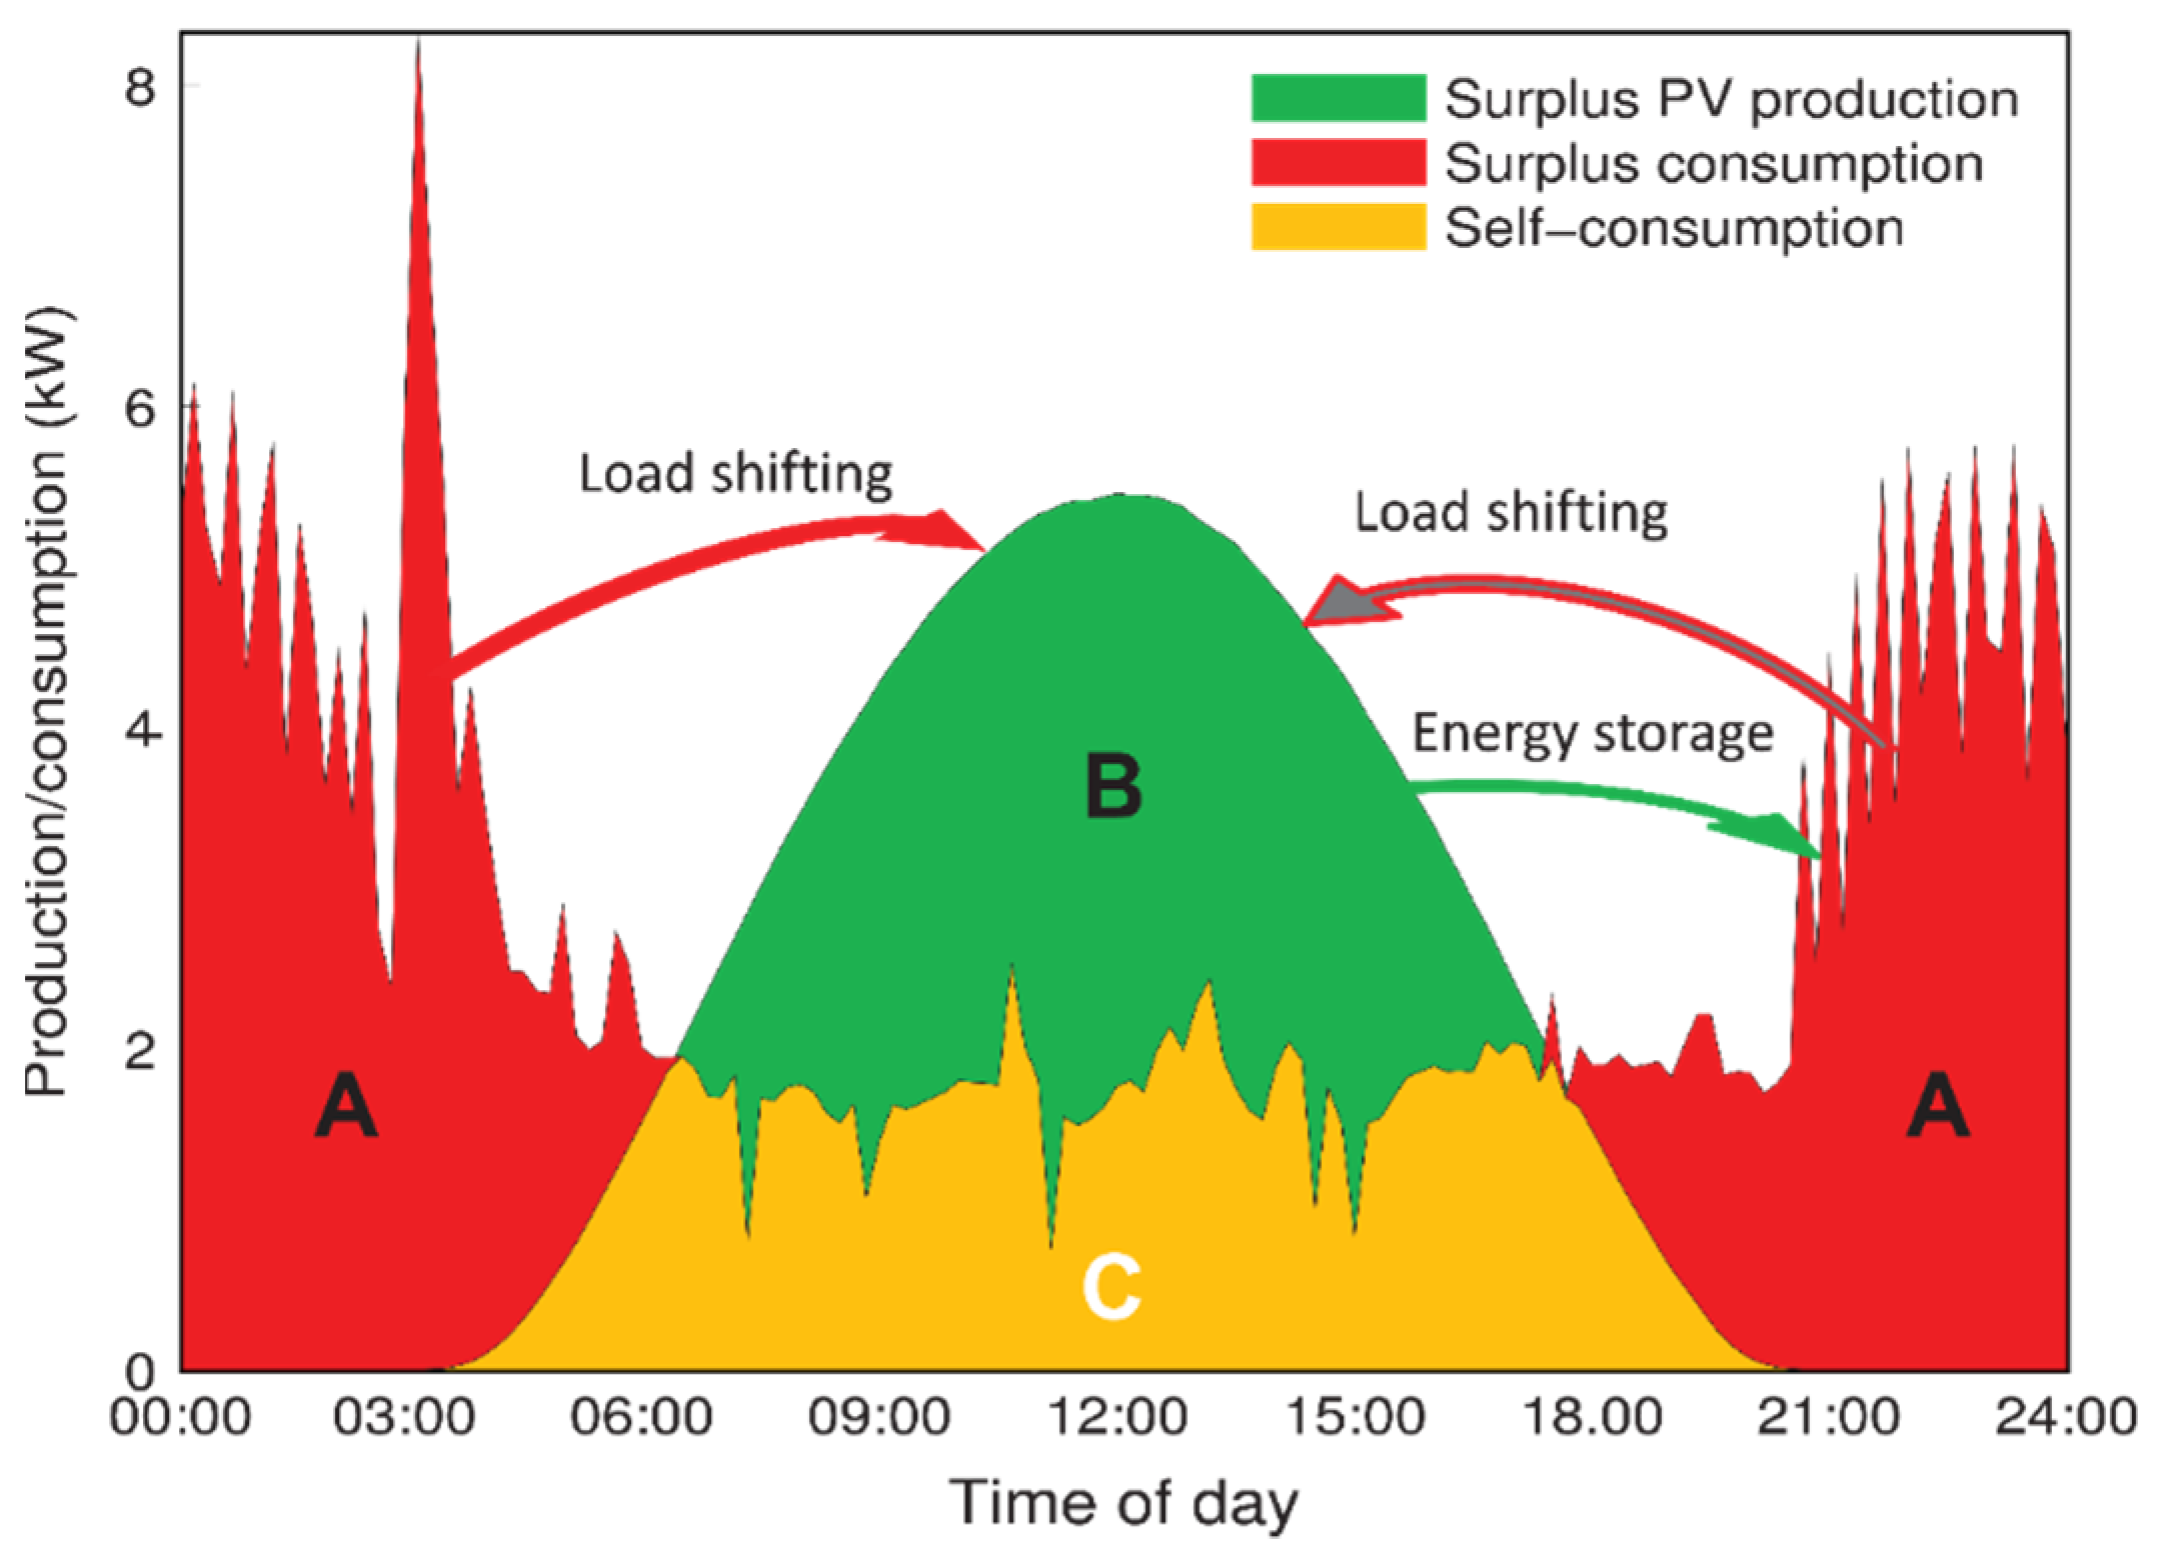
2.2.2. Self-Consumption
2.3. Methodology and Assumptions
3. Results and Discussion
3.1. Rooftop PV Power Generation Viability in Qatar
3.2. Results
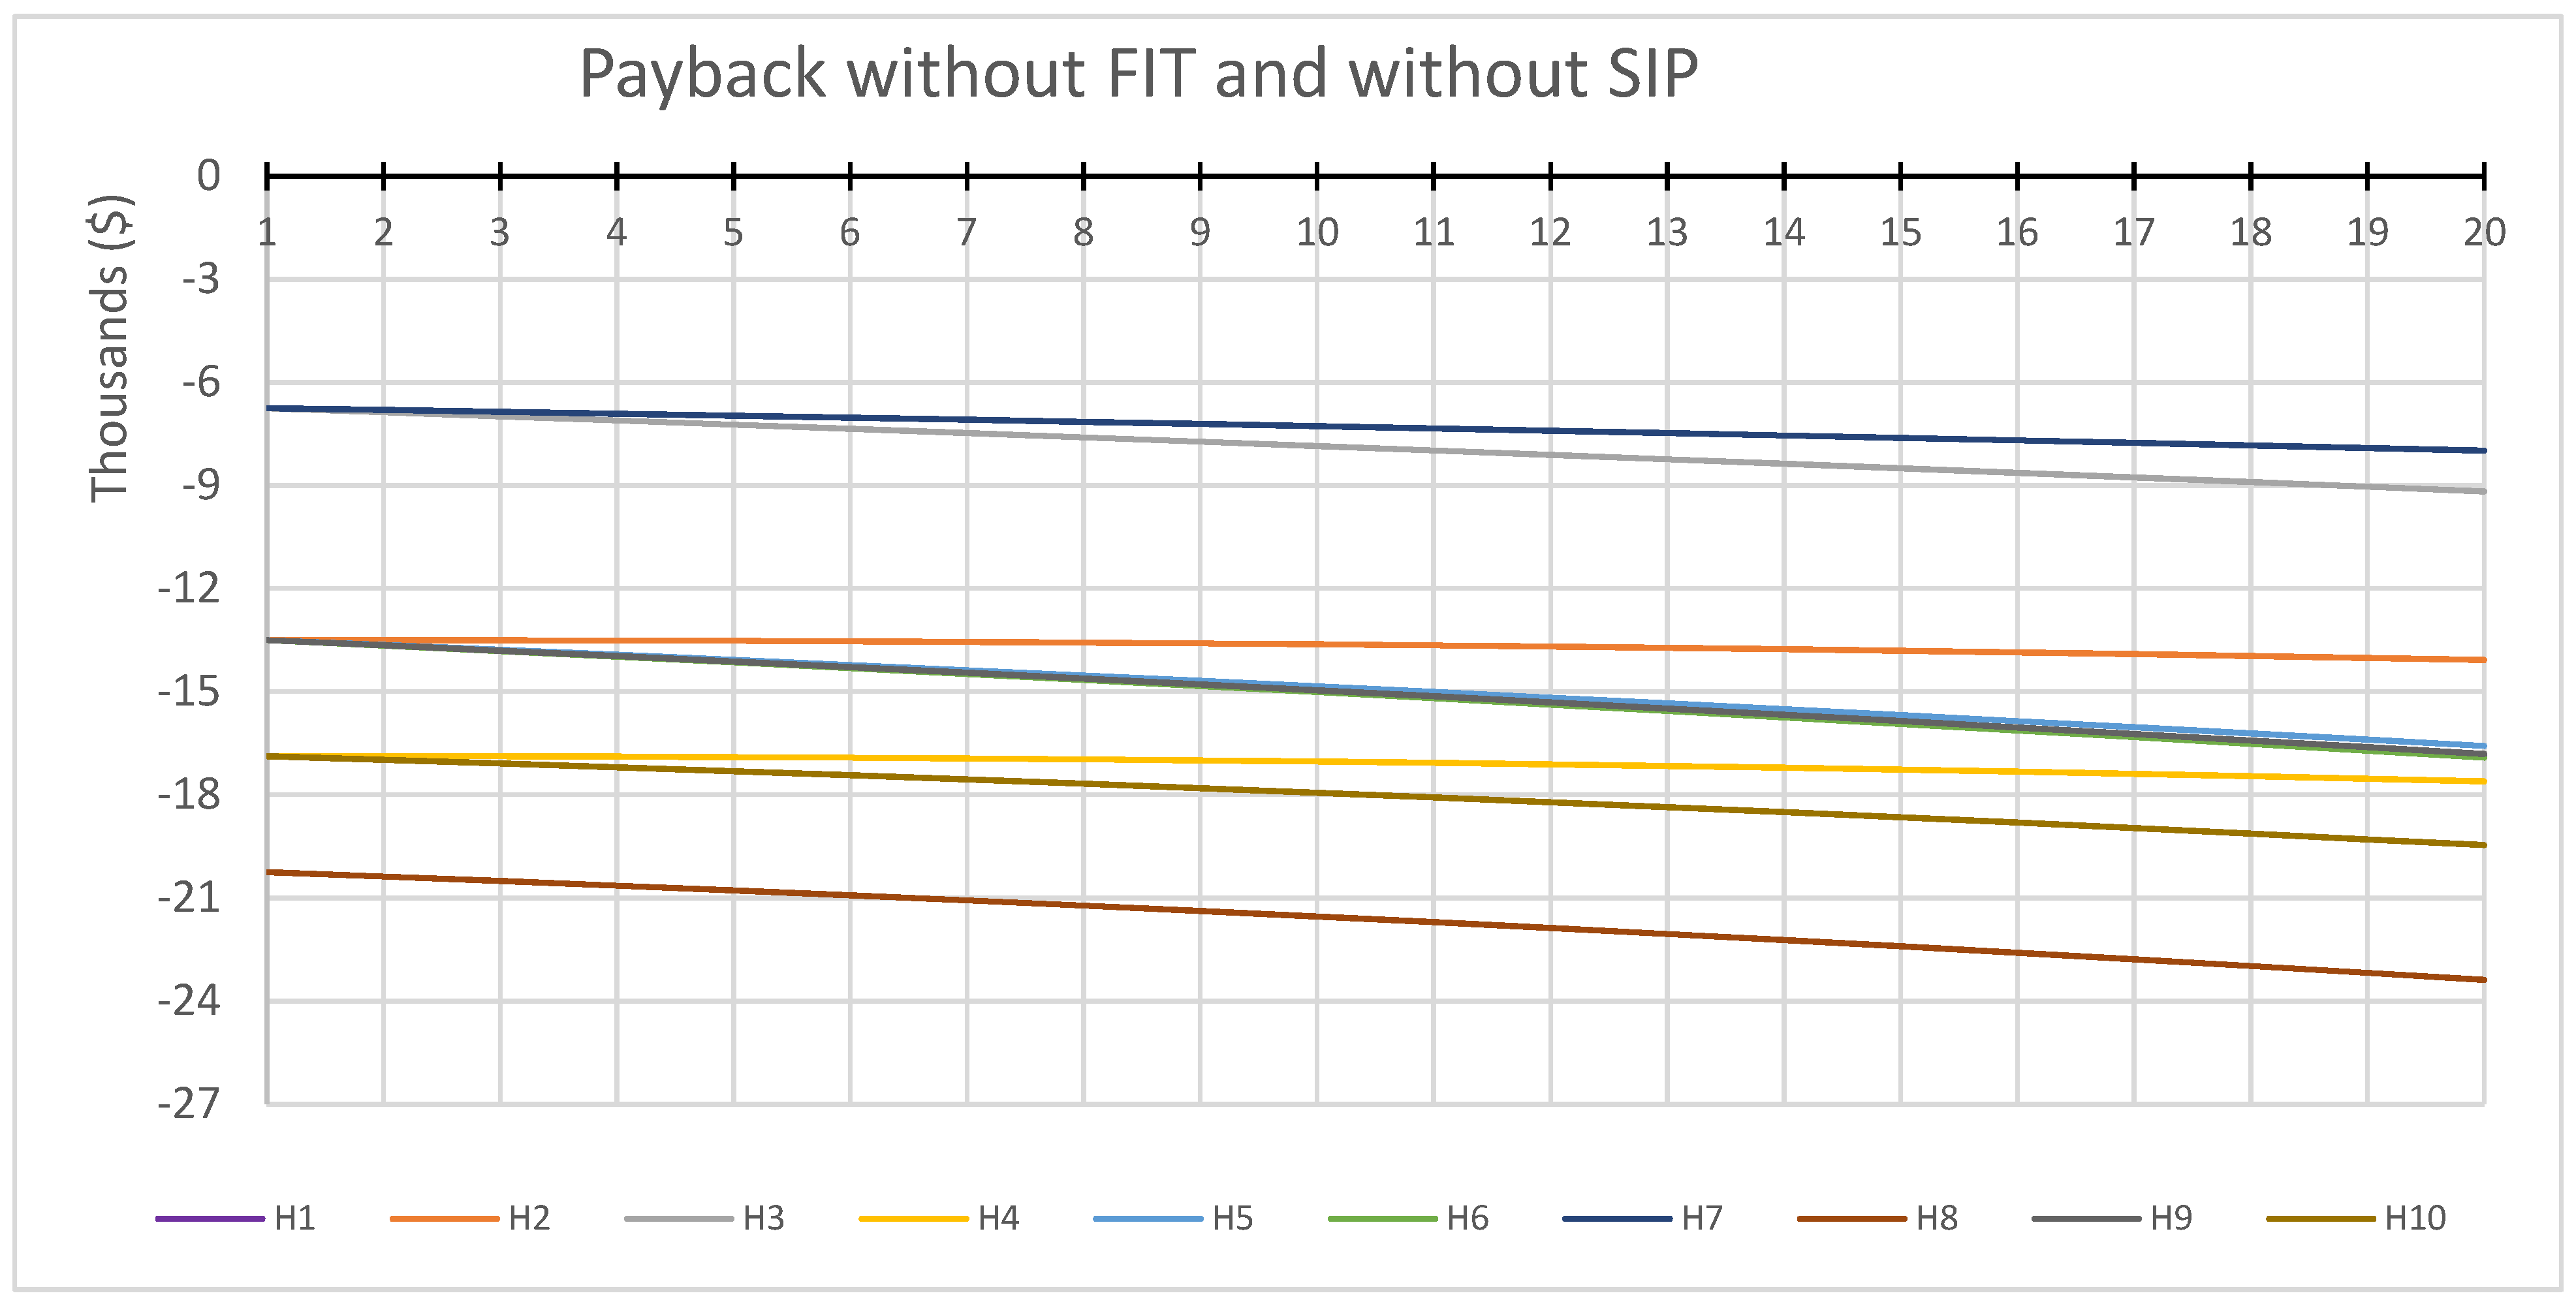
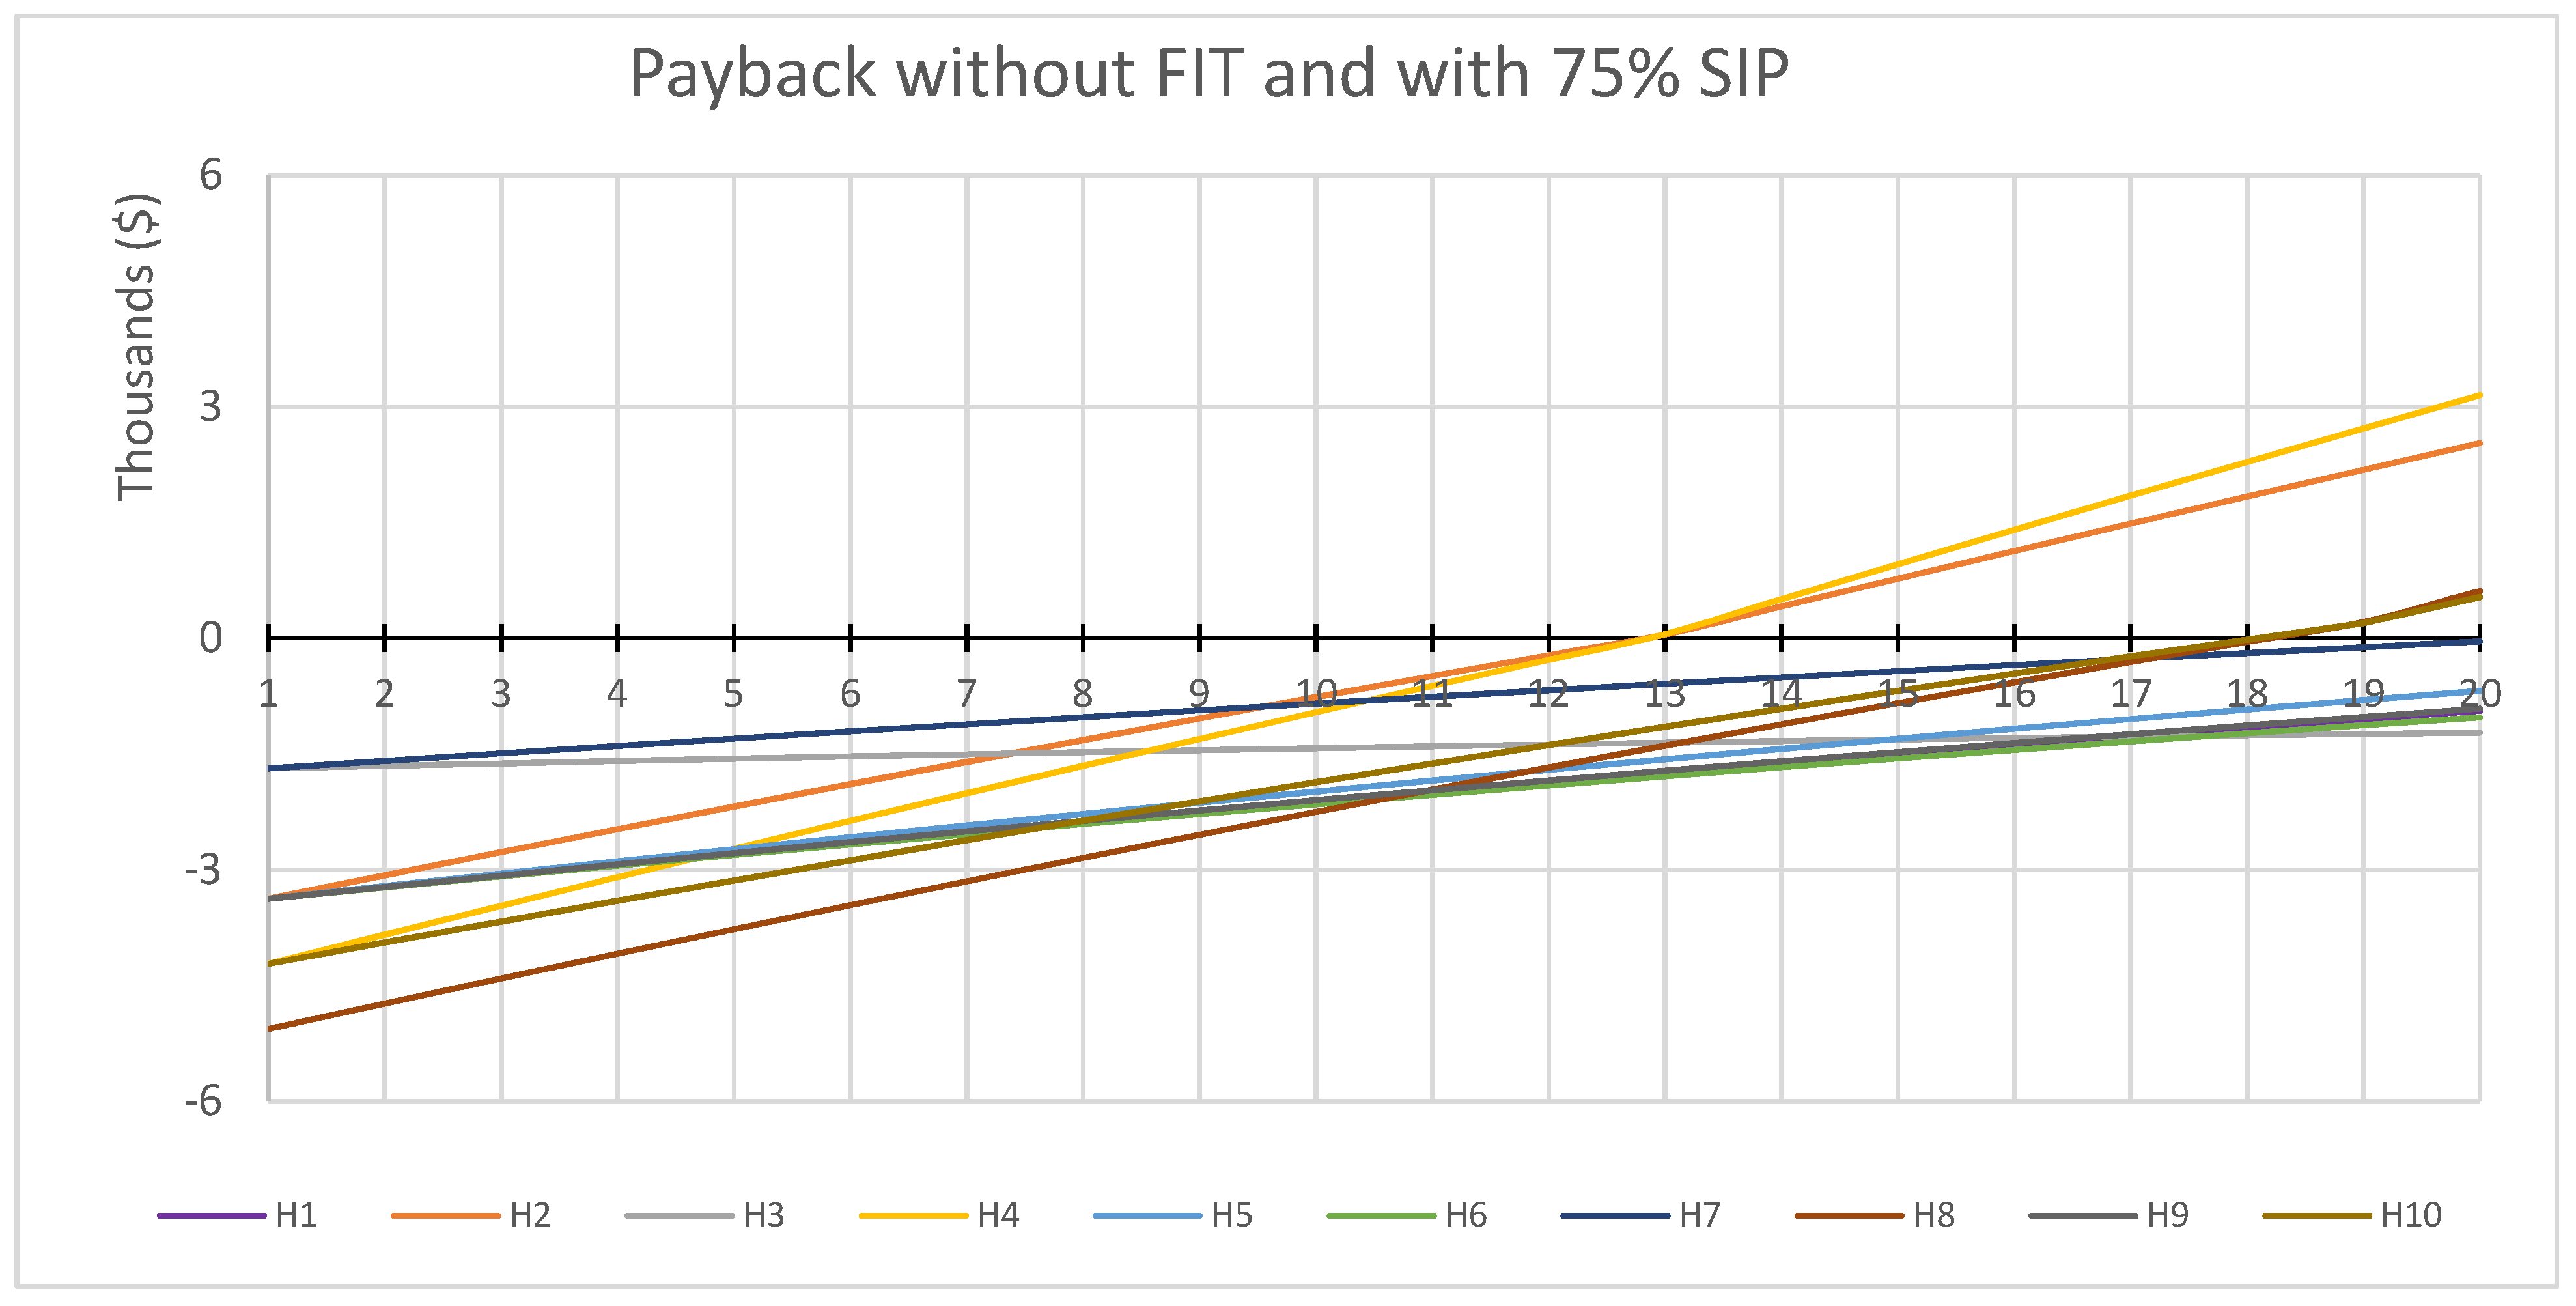
3.2.1. Economic Viability of Rooftop PV Systems without Energy Storage and Feed-In Tariff in Qatar
3.2.2. Economic Viability of Rooftop PV Systems without Energy Storage and Feed-In Tariff in Qatar
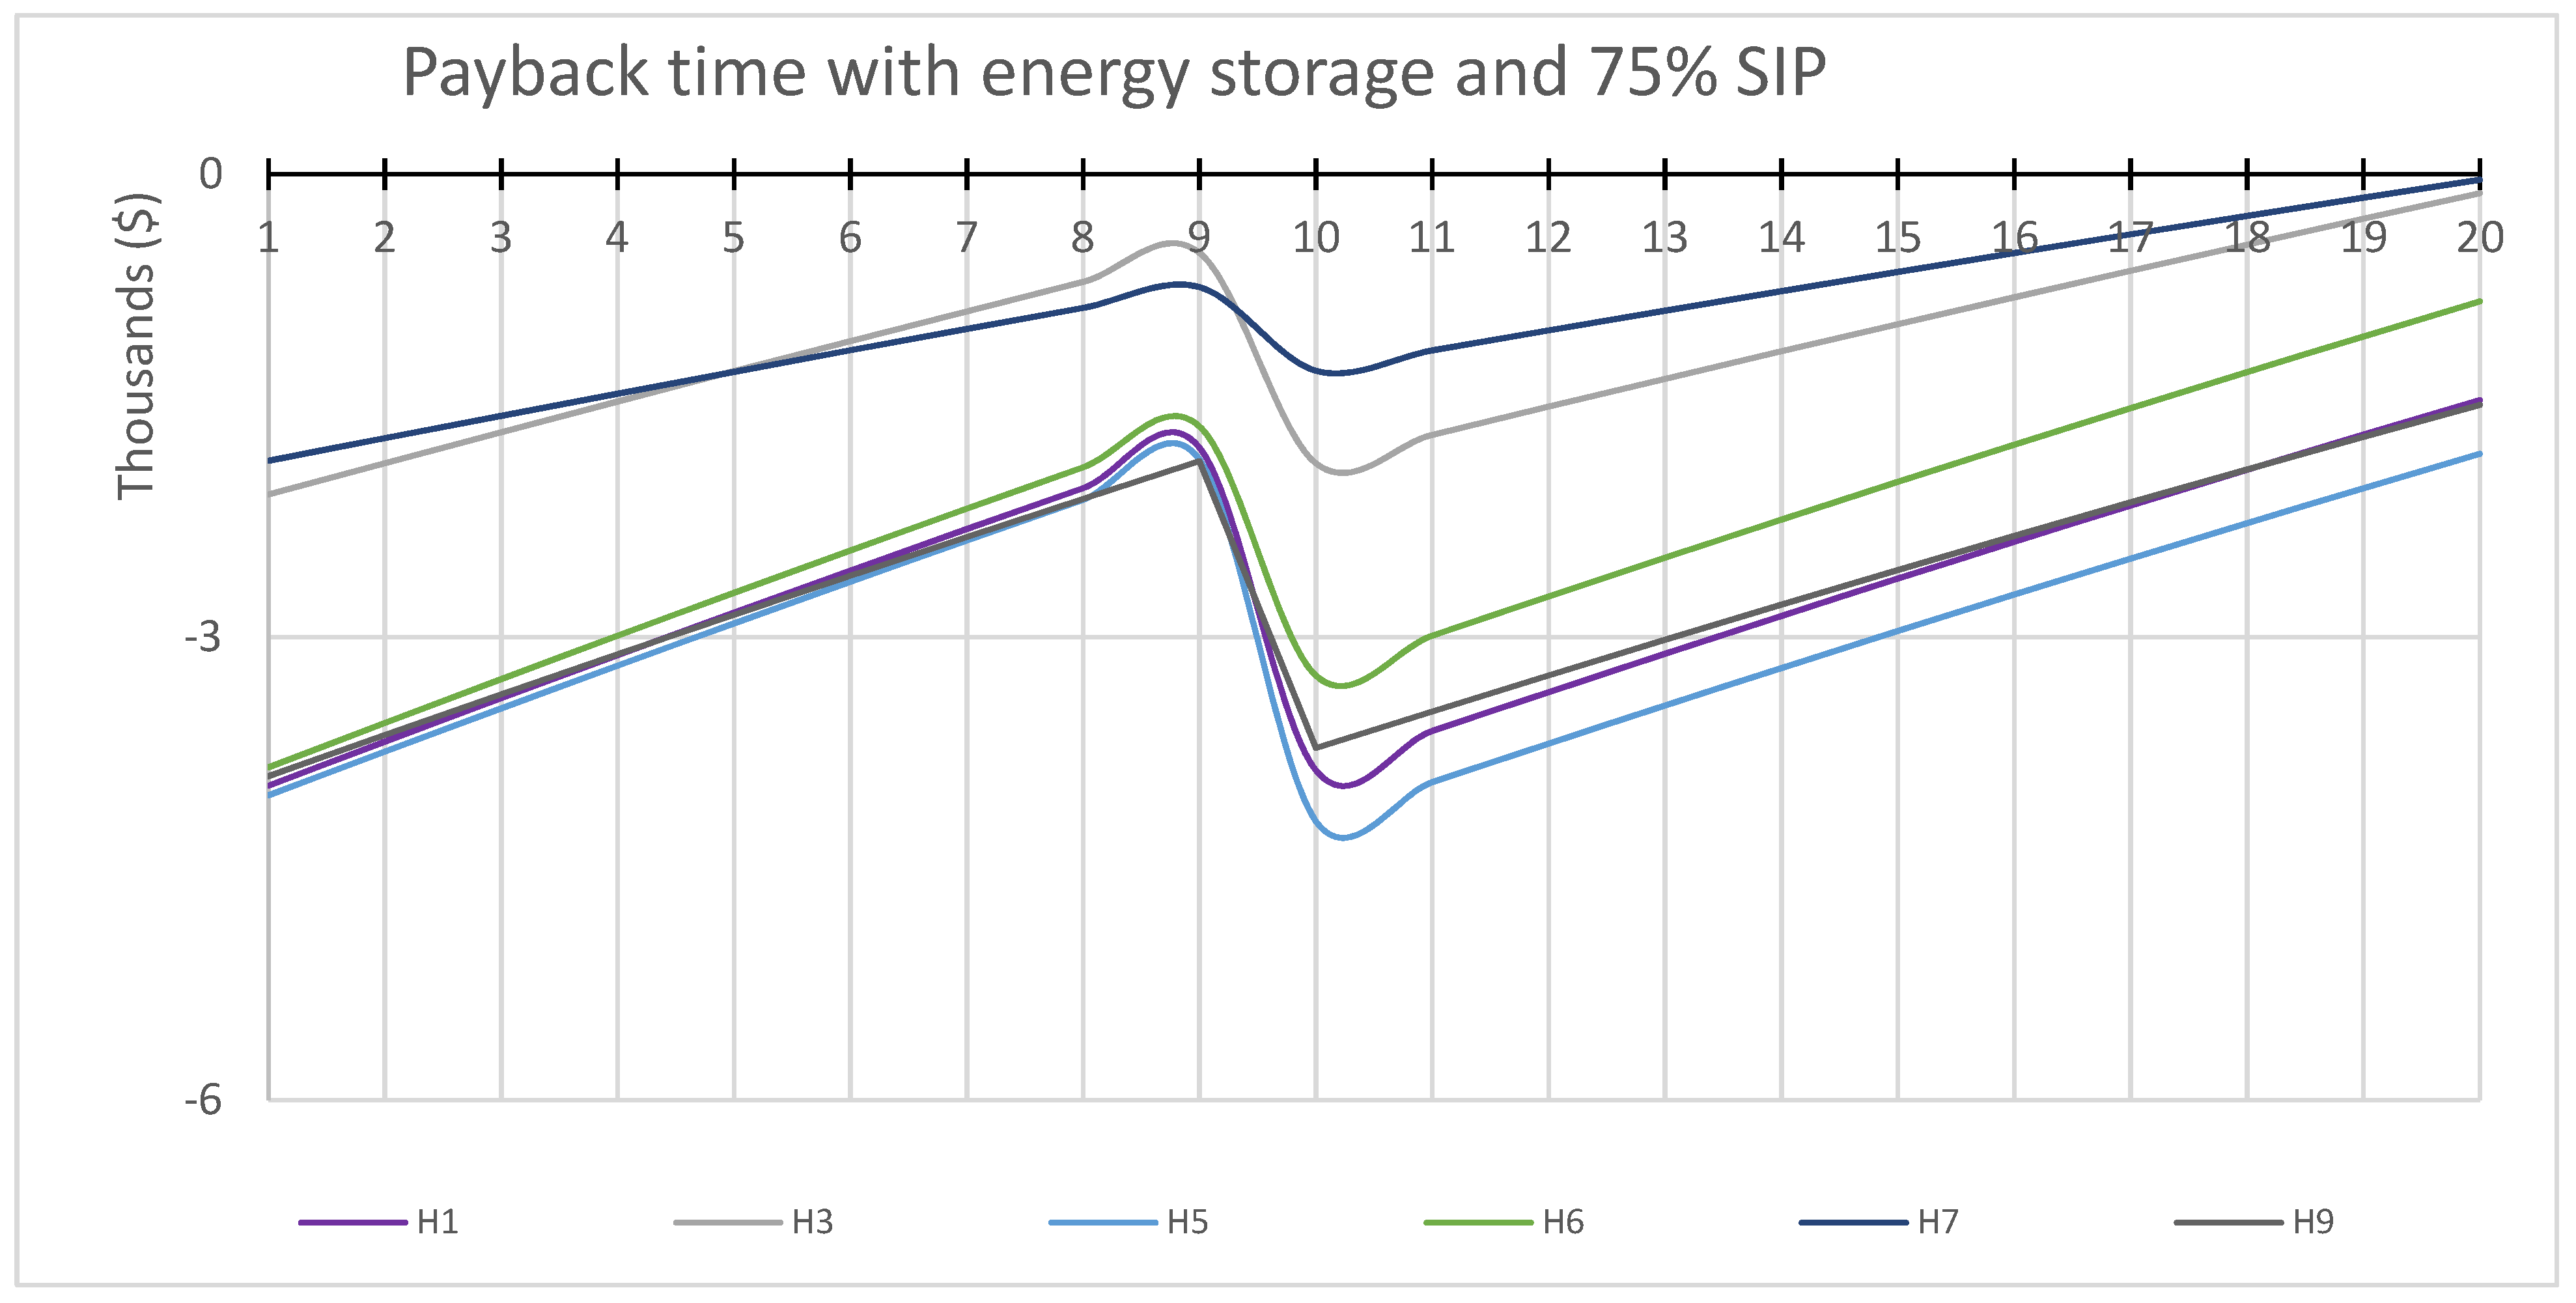
3.2.3. Economic Viability of Rooftop PV Systems with Energy Storage
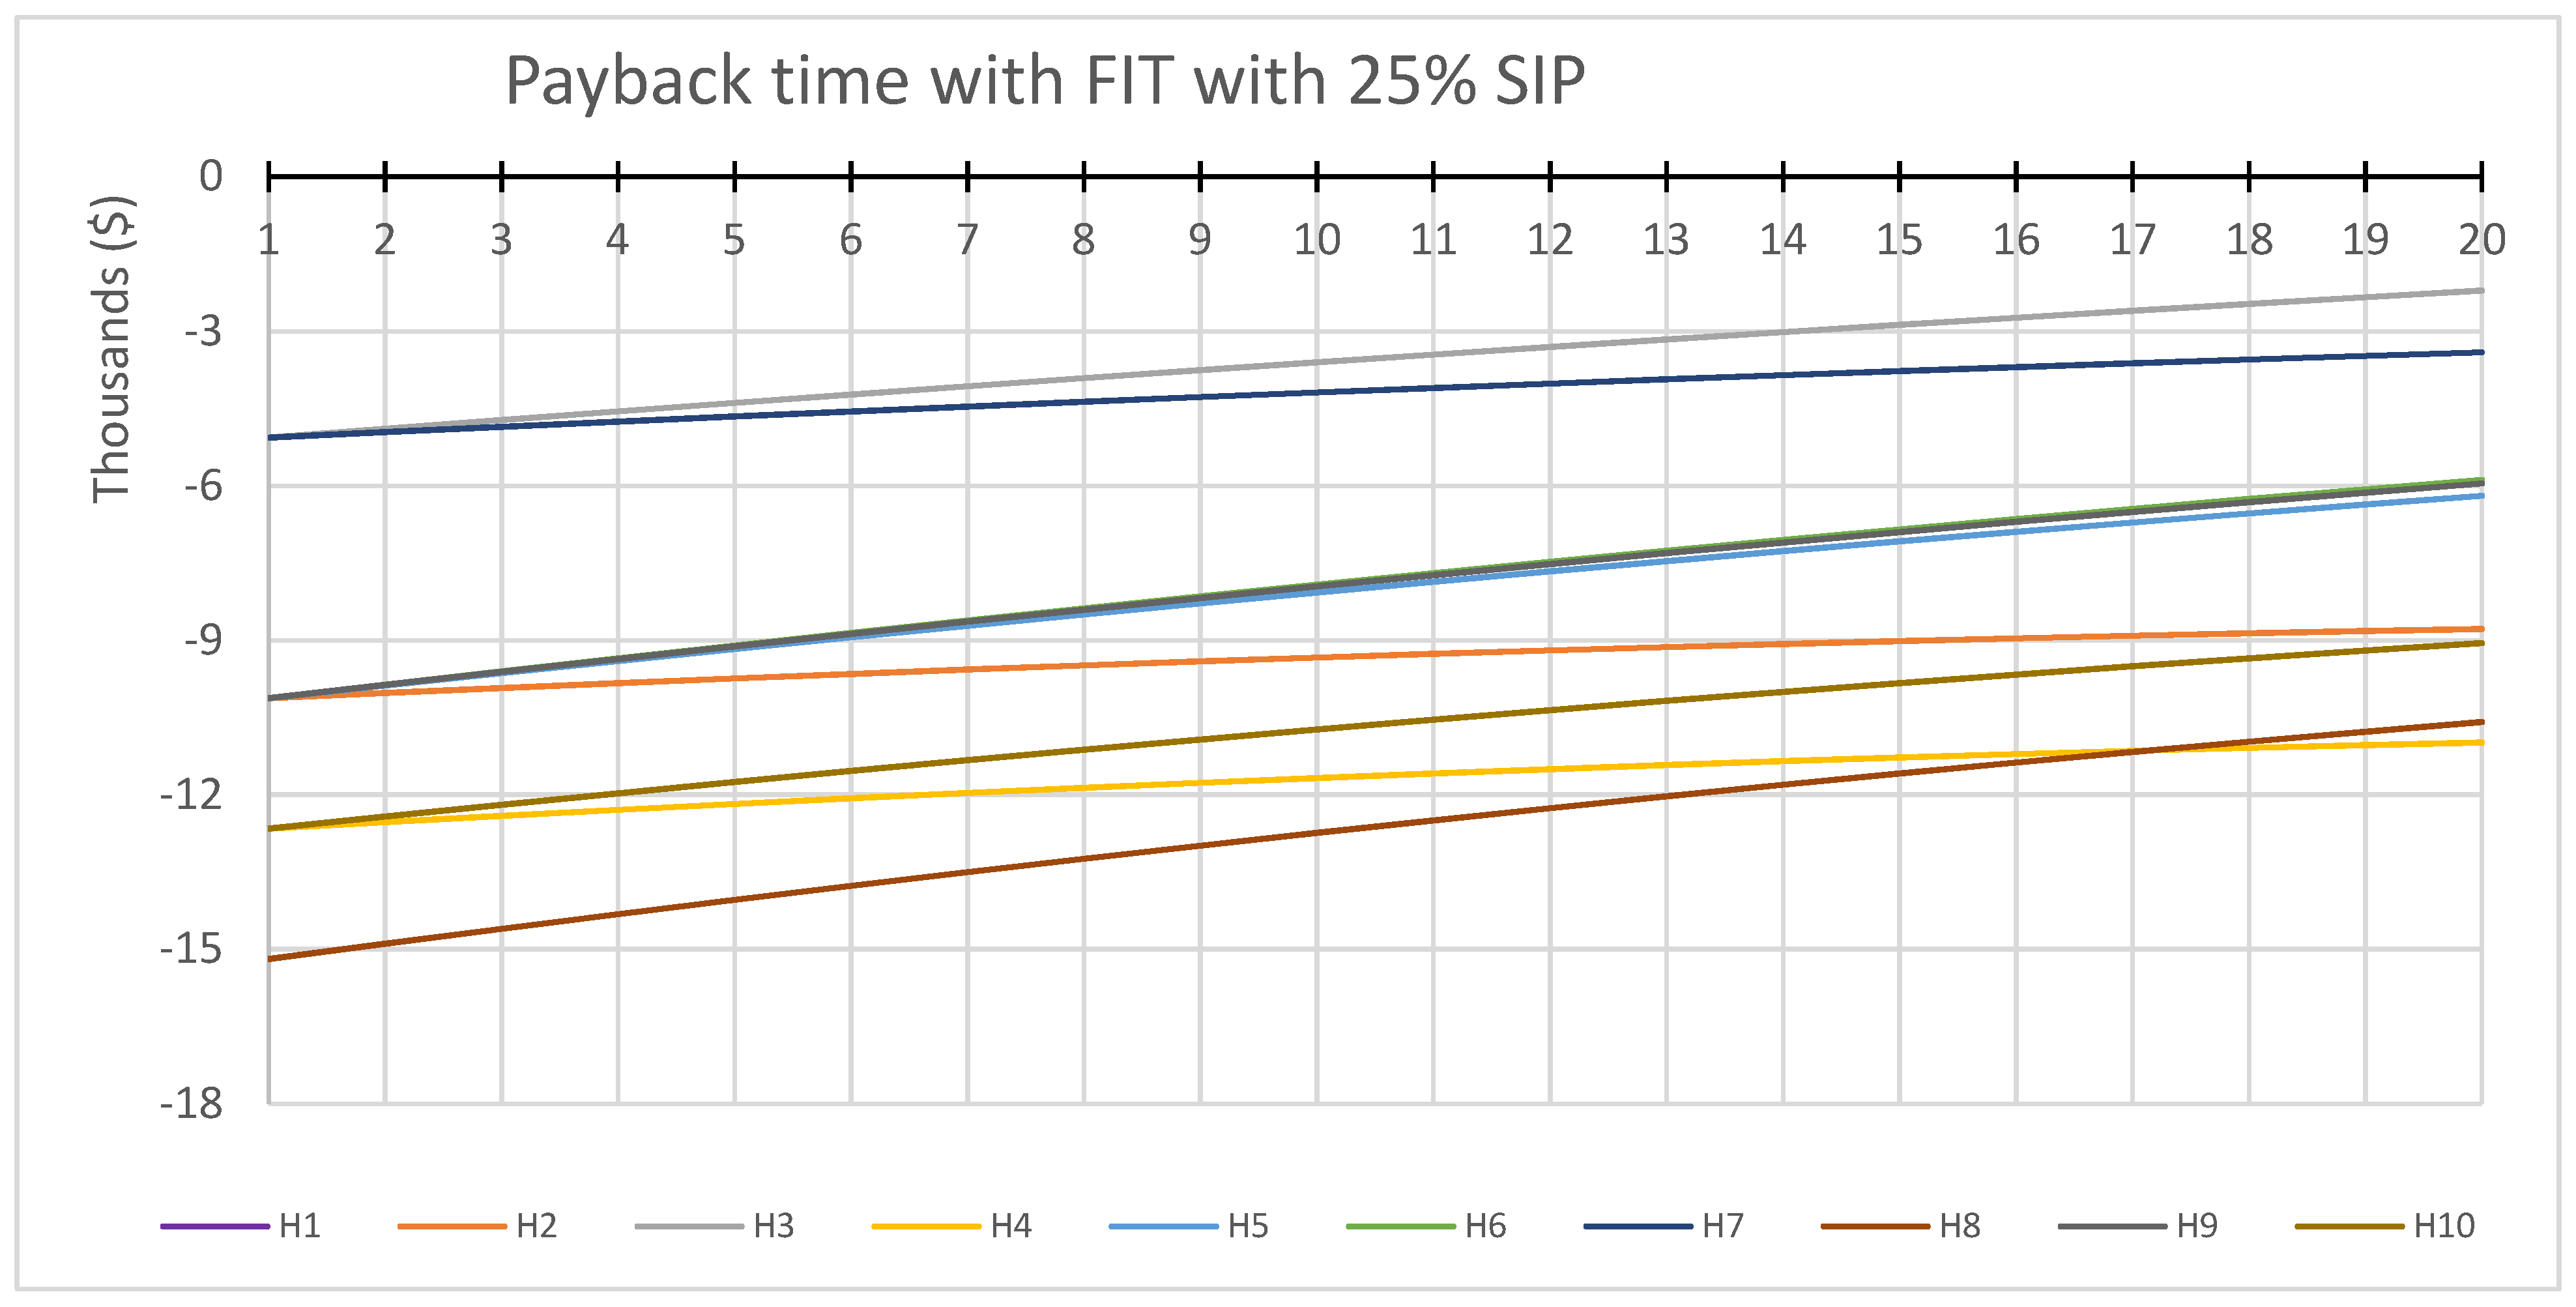
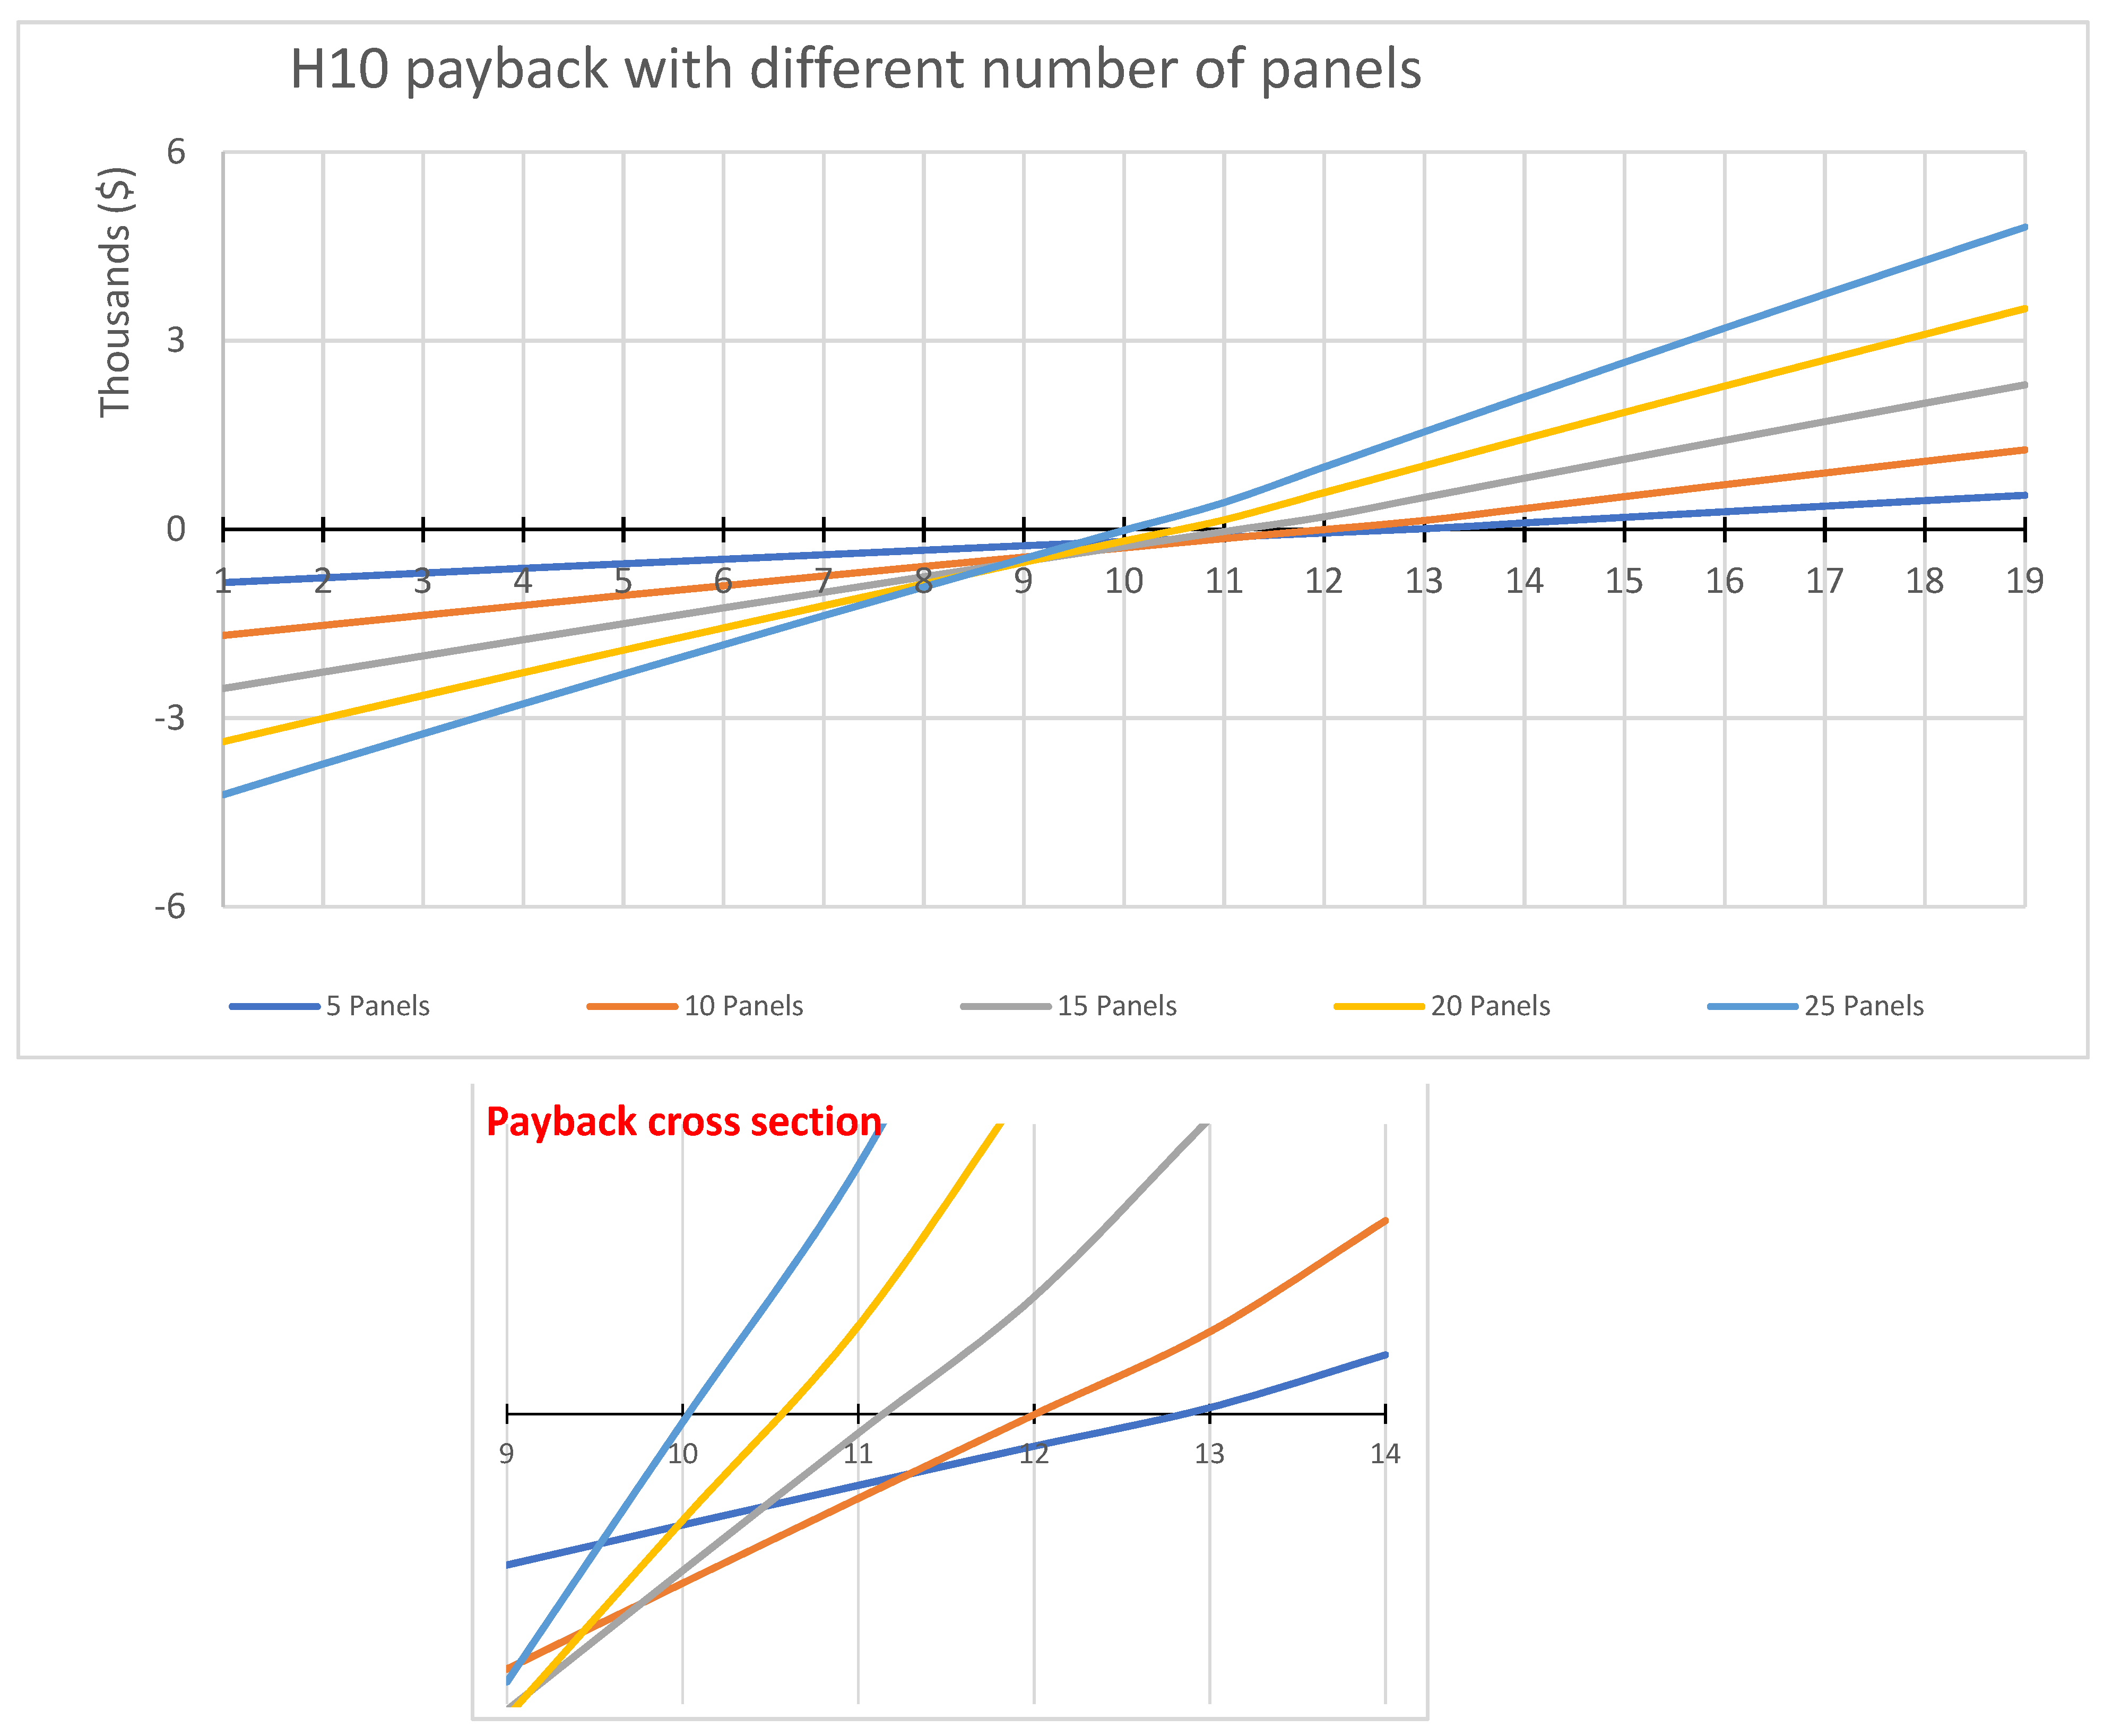
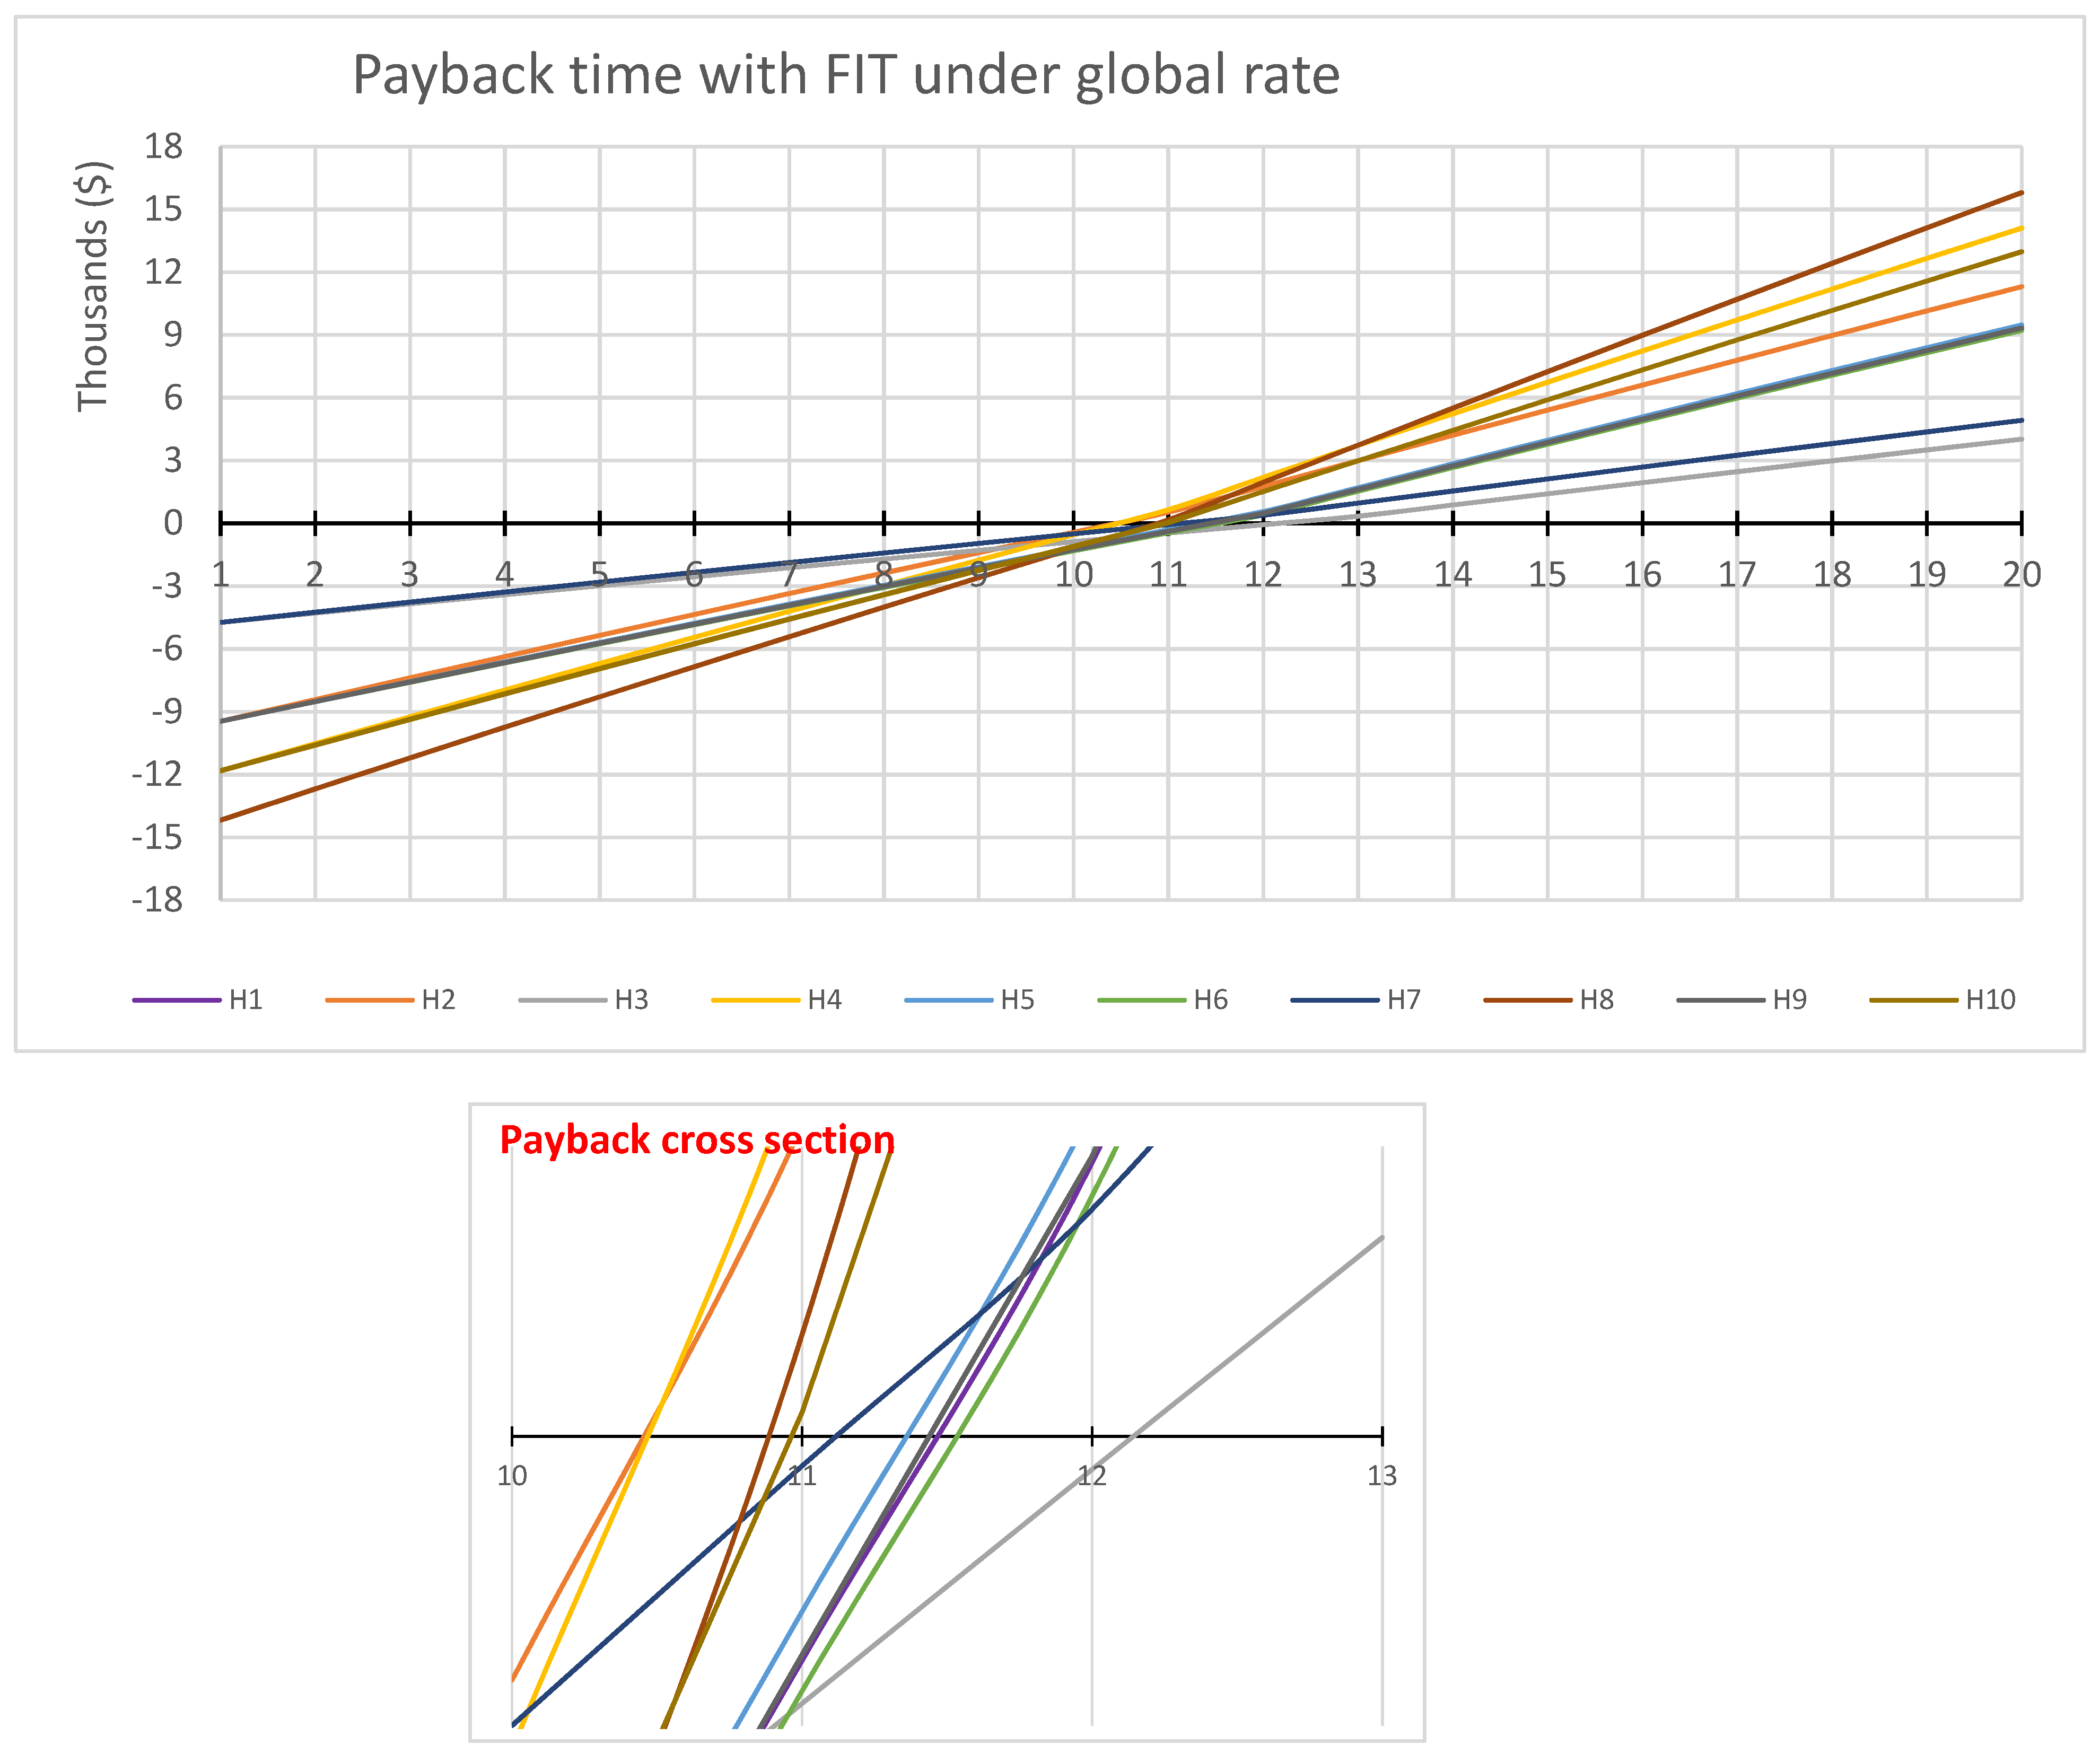
3.2.4. Economic Viability of Rooftop PV Systems with Feed-In Tariff in Qatar
3.3. Policy Implications
4. Conclusions
Author Contributions
Funding
Institutional Review Board Statement
Informed Consent Statement
Data Availability Statement
Conflicts of Interest
References
- Meltzer, J.; Hultman, N.E.; Langley, C. Low-Carbon Energy Transitions in Qatar and the Gulf Cooperation Council Region. SSRN Electron. J. 2014. [Google Scholar] [CrossRef]
- Sahin, E.S.; Bayram, I.S.; Koc, M. Demand side management opportunities, framework, and implications for sustainable development in resource-rich countries: Case study Qatar. J. Clean. Prod. 2019, 241, 118332. [Google Scholar] [CrossRef]
- Miller, R. Qatar, Energy Security, and Strategic Vision in a Small State. J. Arab. Stud. 2020, 10, 122–138. [Google Scholar] [CrossRef]
- Kahramaa. Sustainability Report 2016; Kahramaa: Doha, Qatar, 2016; Available online: https://www.km.com.qa/MediaCenter/Publications/Kahramaa_Sustainability_Report_2016.pdf (accessed on 25 September 2019).
- Crabtree, G.; Misewich, J.; Ambrosio, R.; Clay, K.; DeMartini, P.; James, R.; Lauby, M.; Mohta, V.; Moura, J.; Sauer, P.; et al. Integrating Renewable Electricity on the Grid. AIP Conf. Proc. 2011, 19, 387–405. [Google Scholar] [CrossRef] [Green Version]
- Wu, R.; Wolsink, M.; Bu, M.J. Social acceptance of renewable energy innovation: An introduction to the concept. Energy Policy 2007, 35, 2683–2691. [Google Scholar] [CrossRef] [Green Version]
- Alrawi, O.; Bayram, I.S.; Al-Ghamdi, S.G.; Koç, M. High-Resolution Household Load Profiling and Evaluation of Rooftop PV Systems in Selected Houses in Qatar. Energies 2019, 12, 3876. [Google Scholar] [CrossRef] [Green Version]
- Elbeheiry, N.; Amer, A.; Elgazar, S.; Shukri, S.; Metry, M.; Balog, R.S. A Techno-Economic Study of Rooftop Grid-Connected Photovoltaic-Energy Storage Systems in Qatar. In Proceedings of the 2020 47th IEEE Photovoltaic Specialists Conference (PVSC), Calgary, AB, Canada, 15 June–21 August 2020; pp. 2730–2736. [Google Scholar] [CrossRef]
- Mohandes, N.; Sanfilippo, A.; al Fakhri, M. Modeling residential adoption of solar energy in the Arabian Gulf Region. Renew. Energy 2019, 131, 381–389. [Google Scholar] [CrossRef]
- Wittenberg, I.; Blöbaum, A.; Matthies, E. Environmental motivations for energy use in PV households: Proposal of a modified norm activation model for the specific context of PV households. J. Environ. Psychol. 2018, 55, 110–120. [Google Scholar] [CrossRef]
- Lu, L.; Yang, H.X. Environmental payback time analysis of a roof-mounted building-integrated photovoltaic (BIPV) system in Hong Kong. Appl. Energy 2010, 87, 3625–3631. [Google Scholar] [CrossRef]
- Wilson, R.; Young, A. The Embodied Energy Payback Period of Photovoltaic Installations Applied to Buildings in the UK. Build. Environ. 1996, 31, 299–305. [Google Scholar] [CrossRef]
- Knapp, K.; Jester, T. Empirical investigation of the energy payback time for photovoltaic modules. Sol. Energy 2001, 71, 165–172. [Google Scholar] [CrossRef]
- IRENA. Power Generation Costs in 2017. 2018. Available online: https://www.irena.org/-/media/Files/IRENA/Agency/Publication/2018/Jan/IRENA_2017_Power_Costs_2018.pdf (accessed on 20 September 2019).
- IEA. World energy prices: An overview. 2019. Available online: https://webstore.iea.org/world-energy-prices-2019-an-overview%0AMore (accessed on 1 September 2019).
- Luthander, R.; Widén, J.; Nilsson, D.; Palm, J. Photovoltaic self-consumption in buildings: A review. Appl. Energy 2015, 142, 80–94. [Google Scholar] [CrossRef] [Green Version]
- Sunearthtools. Tools for Consumers and Designers of Solar. 2014. Available online: http://www.sunearthtools.com/dp/tools/pos_sun.php (accessed on 1 September 2019).
- Branker, K.; Pathak, M.J.M.; Pearce, J.M. A review of solar photovoltaic levelized cost of electricity. Renew. Sustain. Energy Rev. 2011, 15, 4470–4482. [Google Scholar] [CrossRef] [Green Version]
- Bank, Q.C. The Fortieth Annual Report Doha. 2016. Available online: http://www.qcb.gov.qa/English/Publications/ReportsAndStatements/AnnualReports/ (accessed on 1 September 2019).
- Investing.com. Qatar Government Bonds—Yields Curve. 2016. Available online: http://www.worldgovernmentbonds.com/country/qatar/ (accessed on 25 September 2019).
- Krane, J.; Hung, S.Y. Energy Subsidy Reform in the Persian Gulf: The End of the Big Oil Giveaway. 2016. Available online: https://www.bakerinstitute.org/media/files/research_document/0e7a6eb7/BI-Brief-042816-CES_GulfSubsidy.pdf (accessed on 1 September 2019).
- N.C. Clean Energy Technology. Database of State Incentives for Renewables and Efficiency (DSIRE). 2016. Available online: http://programs.dsireusa.org/system/program/tables (accessed on 1 September 2019).
- EnergySage. Choosing a battery: How to pick the best solar battery for you. 2009. Available online: https://www.energysage.com/energy-storage/how-to-get-storage/choosing-battery/ (accessed on 1 September 2019).
- Alrawi, O.; Bayram, I.S.; Koc, M. High-resolution electricity load profiles of selected houses in Qatar. In Proceedings of the 2018 IEEE 12th International Conference on Compatibility, Power Electronics and Power Engineering, CPE-POWERENG 2018, Doja, Qatar, 10–12 April 2018; pp. 1–6. [Google Scholar] [CrossRef]
- Zahedi, A. Developing a method to accurately estimate the grid-connected solar PV electricity cost in Hobart-Australia. In Proceedings of the 2013 Australasian Universities Power Engineering Conference, Hobart, Australia, 29 September–3 October 2013; pp. 1–4. [Google Scholar] [CrossRef]
- Alhammami, H.; An, H. Techno-economic analysis and policy implications for promoting residential rooftop solar photovoltaics in Abu Dhabi, UAE. Renew. Energy 2021, 167, 359–368. [Google Scholar] [CrossRef]
- Alsabbagh, M. Public perception toward residential solar panels in Bahrain. Energy Rep. 2019, 5, 253–261. [Google Scholar] [CrossRef]


| Metrics | H1 | H2 | H3 | H4 | H5 | H6 | H7 | H8 | H9 | H10 |
|---|---|---|---|---|---|---|---|---|---|---|
| Household Size (m2) | 150 | 220 | 0–50 | 420 | 101–150 | 250 | 300+ | 300+ | 201–250 | 201–250 |
| Type | Apart. | Villa | Apart. | Villa | Apart. | Apart. | Villa | Villa | Villa | Villa |
| Building Age (years) | 11–15 | 11–15 | 11–15 | 11–15 | 11–15 | 0–5 | 5–10 | 15+ | 5–10 | 11–15 |
| Education Level (Decision Maker) | Ph.D. | College | Ph.D. | Ph.D. | Ph.D. | Ph.D. | High school | College | College | Masters |
| Occupants | 3 | 2 | 1 | 7 | 6 | 2 | 9 | 6 | 13 | 5 |
| Occupants under 18 years old | 1 | None | None | 3 | 4 | None | 3 | None | 5 | None |
| Annual Household Income (USD) | 101–200k | 101–200k | 0–100k | 200k+ | 101–200k | 200k+ | 0–100k | 101–200k | 0–100k | 101–200k |
| Cooling Type | Central | Central | Split Unit | Central | Split Unit | District Cooling | Split Unit | Split Unit | Split Unit | Split Unit |
| House Number | H1 | H2 | H3 | H4 | H5 | H6 | H7 | H8 | H9 | H10 |
|---|---|---|---|---|---|---|---|---|---|---|
| Total Rooftop Space (m2) | 160 | 100 | 50 | 170 | 180 | 200 | 280 | 140 | 180 | 150 |
| Approximate Available Rooftop Space (m2) | 30 | 30.5 | 30 | 39.5 | 33 | 65 | 32 | 105 | 30 | 42 |
| Approximate Maximum Possible Number of Panels | 20 | 20 | 20 | 25 | 20 | 40 | 20 | 55 | 20 | 25 |
| Parameters | |
|---|---|
| 1 | Unit cost (USD/kWh) |
| 2 | Selling cost (USD/kWh) |
| 3 | Mortgage rate |
| 4 | Annual main. Cost (20P) |
| 5 | Balance of System (USD) (20P) |
| 6 | Inflation Rate |
| 7 | Discount rate |
| 8 | Decay rate |
| 9 | Solar Incentive program (SIP) |
| 10 | Panel Cost (USD) |
| H1 | H2 | H3 | H4 | H5 | H6 | H7 | H8 | H9 | H10 | |
|---|---|---|---|---|---|---|---|---|---|---|
| Number of Panels | 20 | 20 | 10 | 25 | 20 | 20 | 10 | 30 | 20 | 25 |
| Total self-consumed PV energy kWh/y | 8182 | 11,314 | 3235 | 14,131 | 8475 | 8087 | 4578 | 14,399 | 8214 | 12,025 |
| Total surplus PV production kWh/y | 3122 | 0 | 2399 | 0 | 2829 | 3191 | 1074 | 2697 | 3091 | 2105 |
| Parameters | Value | |
|---|---|---|
| 1 | Unit cost (USD/kWh) | 0.049 |
| 2 | Selling cost (USD/kWh) | 0.1 |
| 3 | Mortgage rate | 3% |
| 4 | Annual main. Cost (20P) | 150 |
| 5 | Balance of System (USD) (20P) | 3500 |
| 6 | Inflation Rate | 0.1 |
| 7 | Discount rate | 3.5% |
| 8 | Decay rate | 0.7 |
| 9 | Solar Incentive program (SIP) | 30% |
| 10 | Panel Cost (USD) | 500 |
| H1 | H2 | H3 | H4 | H5 | H6 | H7 | H8 | H9 | H10 | |
| NPV (USD) | 5737 | 3734 | 3396 | 4660 | 5547 | 5766 | 2555 | 7413 | 5717 | 6015 |
| TS (USD) | 9446 | 6592 | 5475 | 8229 | 9176 | 9487 | 4277 | 12,471 | 9417 | 10,160 |
| PBY | 8 | 12 | 7 | 12 | 8 | 8 | 9 | 9 | 8 | 10 |
| ROI (%) | 380 | 295 | 424 | 295 | 372 | 381 | 353 | 346 | 379 | 341 |
| IRR | 20% | 15% | 23% | 15% | 19% | 20% | 18% | 18% | 20% | 18% |
| 5 Panels | 10 Panels | 15 Panels | 20 Panels | 25 Panels | |
|---|---|---|---|---|---|
| SC | 99% | 96% | 91% | 88% | 85% |
| NPV (USD) | 932 | 1995 | 3233 | 4565 | 6015 |
| TS (USD) | 1647 | 3479 | 5560 | 7776 | 10,160 |
| PBY | 12 | 12 | 11 | 10 | 10 |
| ROI (%) | 295 | 306 | 320 | 330 | 341 |
| IRR | 15% | 15% | 16% | 17% | 18% |
| House | H1 | H2 | H3 | H4 | H5 | H6 | H7 | H8 | H9 | H10 |
|---|---|---|---|---|---|---|---|---|---|---|
| NPV (USD) | 8229 | 9427 | 3767 | 11,764 | 8339 | 8161 | 4299 | 13,324 | 8242 | 10,967 |
| TS (USD) | 15,286 | 16,993 | 7148 | 21,213 | 15,442 | 15,189 | 7906 | 24,326 | 15,304 | 20,077 |
| PBY | 11 | 10 | 12 | 10 | 11 | 11 | 11 | 10 | 11 | 10 |
| ROI (%) | 262 | 280 | 251 | 280 | 263 | 261 | 267 | 272 | 262 | 270 |
| IRR | 13% | 14% | 12% | 14% | 13% | 13% | 13% | 13% | 13% | 13% |
| H# | H1 | H3 | H5 | H6 | H7 | H9 | ||||||
|---|---|---|---|---|---|---|---|---|---|---|---|---|
| No. Panels | 20 | 10 | 20 | 20 | 10 | 20 | ||||||
| Value Type | C (kWh) | Ratio (%) | C (kWh) | Ratio (%) | C (kWh) | Ratio (%) | C (kWh) | Ratio (%) | C (kWh) | Ratio (%) | C (kWh) | Ratio (%) |
| Jan | 749 | 38 | 92 | 18 | NA | NA | 1087 | 61 | 1197 | 84 | 1163 | 67 |
| Feb | 757 | 39 | NA | NA | 729 | 41 | 1015 | 57 | 841 | 73 | 1016 | 52 |
| Mar | 1221 | 61 | NA | NA | 1518 | 68 | 1144 | 67 | 756 | 65 | 1141 | 54 |
| Apr | 1610 | 66 | 406 | 39 | 2093 | 88 | NA | NA | 802 | 67 | 807 | 60 |
| May | 2021 | 71 | 1451 | 96 | 3538 | 100 | NA | NA | 1215 | 81 | NA | NA |
| Jun | 3189 | 82 | 501 | NA | 3059 | 100 | 2006 | 83 | 1856 | 89 | NA | NA |
| Jul | 3460 | 99 | 2183 | 100 | 1651 | 69 | 1999 | 76 | 2061 | 98 | 997 | 97 |
| Aug | 3799 | 100 | 2400 | 100 | 3032 | 100 | 1619 | 67 | 1594 | 97 | 1565 | 100 |
| Sep | 2676 | 96 | 475 | 41 | 2988 | NA | 2031 | 76 | 1205 | 93 | NA | NA |
| Oct | 2153 | 85 | 841 | 55 | 2285 | 77 | 1908 | 75 | 1286 | 80 | NA | NA |
| Nov | 1316 | 75 | 228 | 29 | 1406 | 65 | 1483 | 73 | 677 | 59 | 1828 | 69 |
| Dec | 791 | 41 | 163 | 20 | 600 | 45 | 1202 | 63 | 933 | 76 | 1259 | 66 |
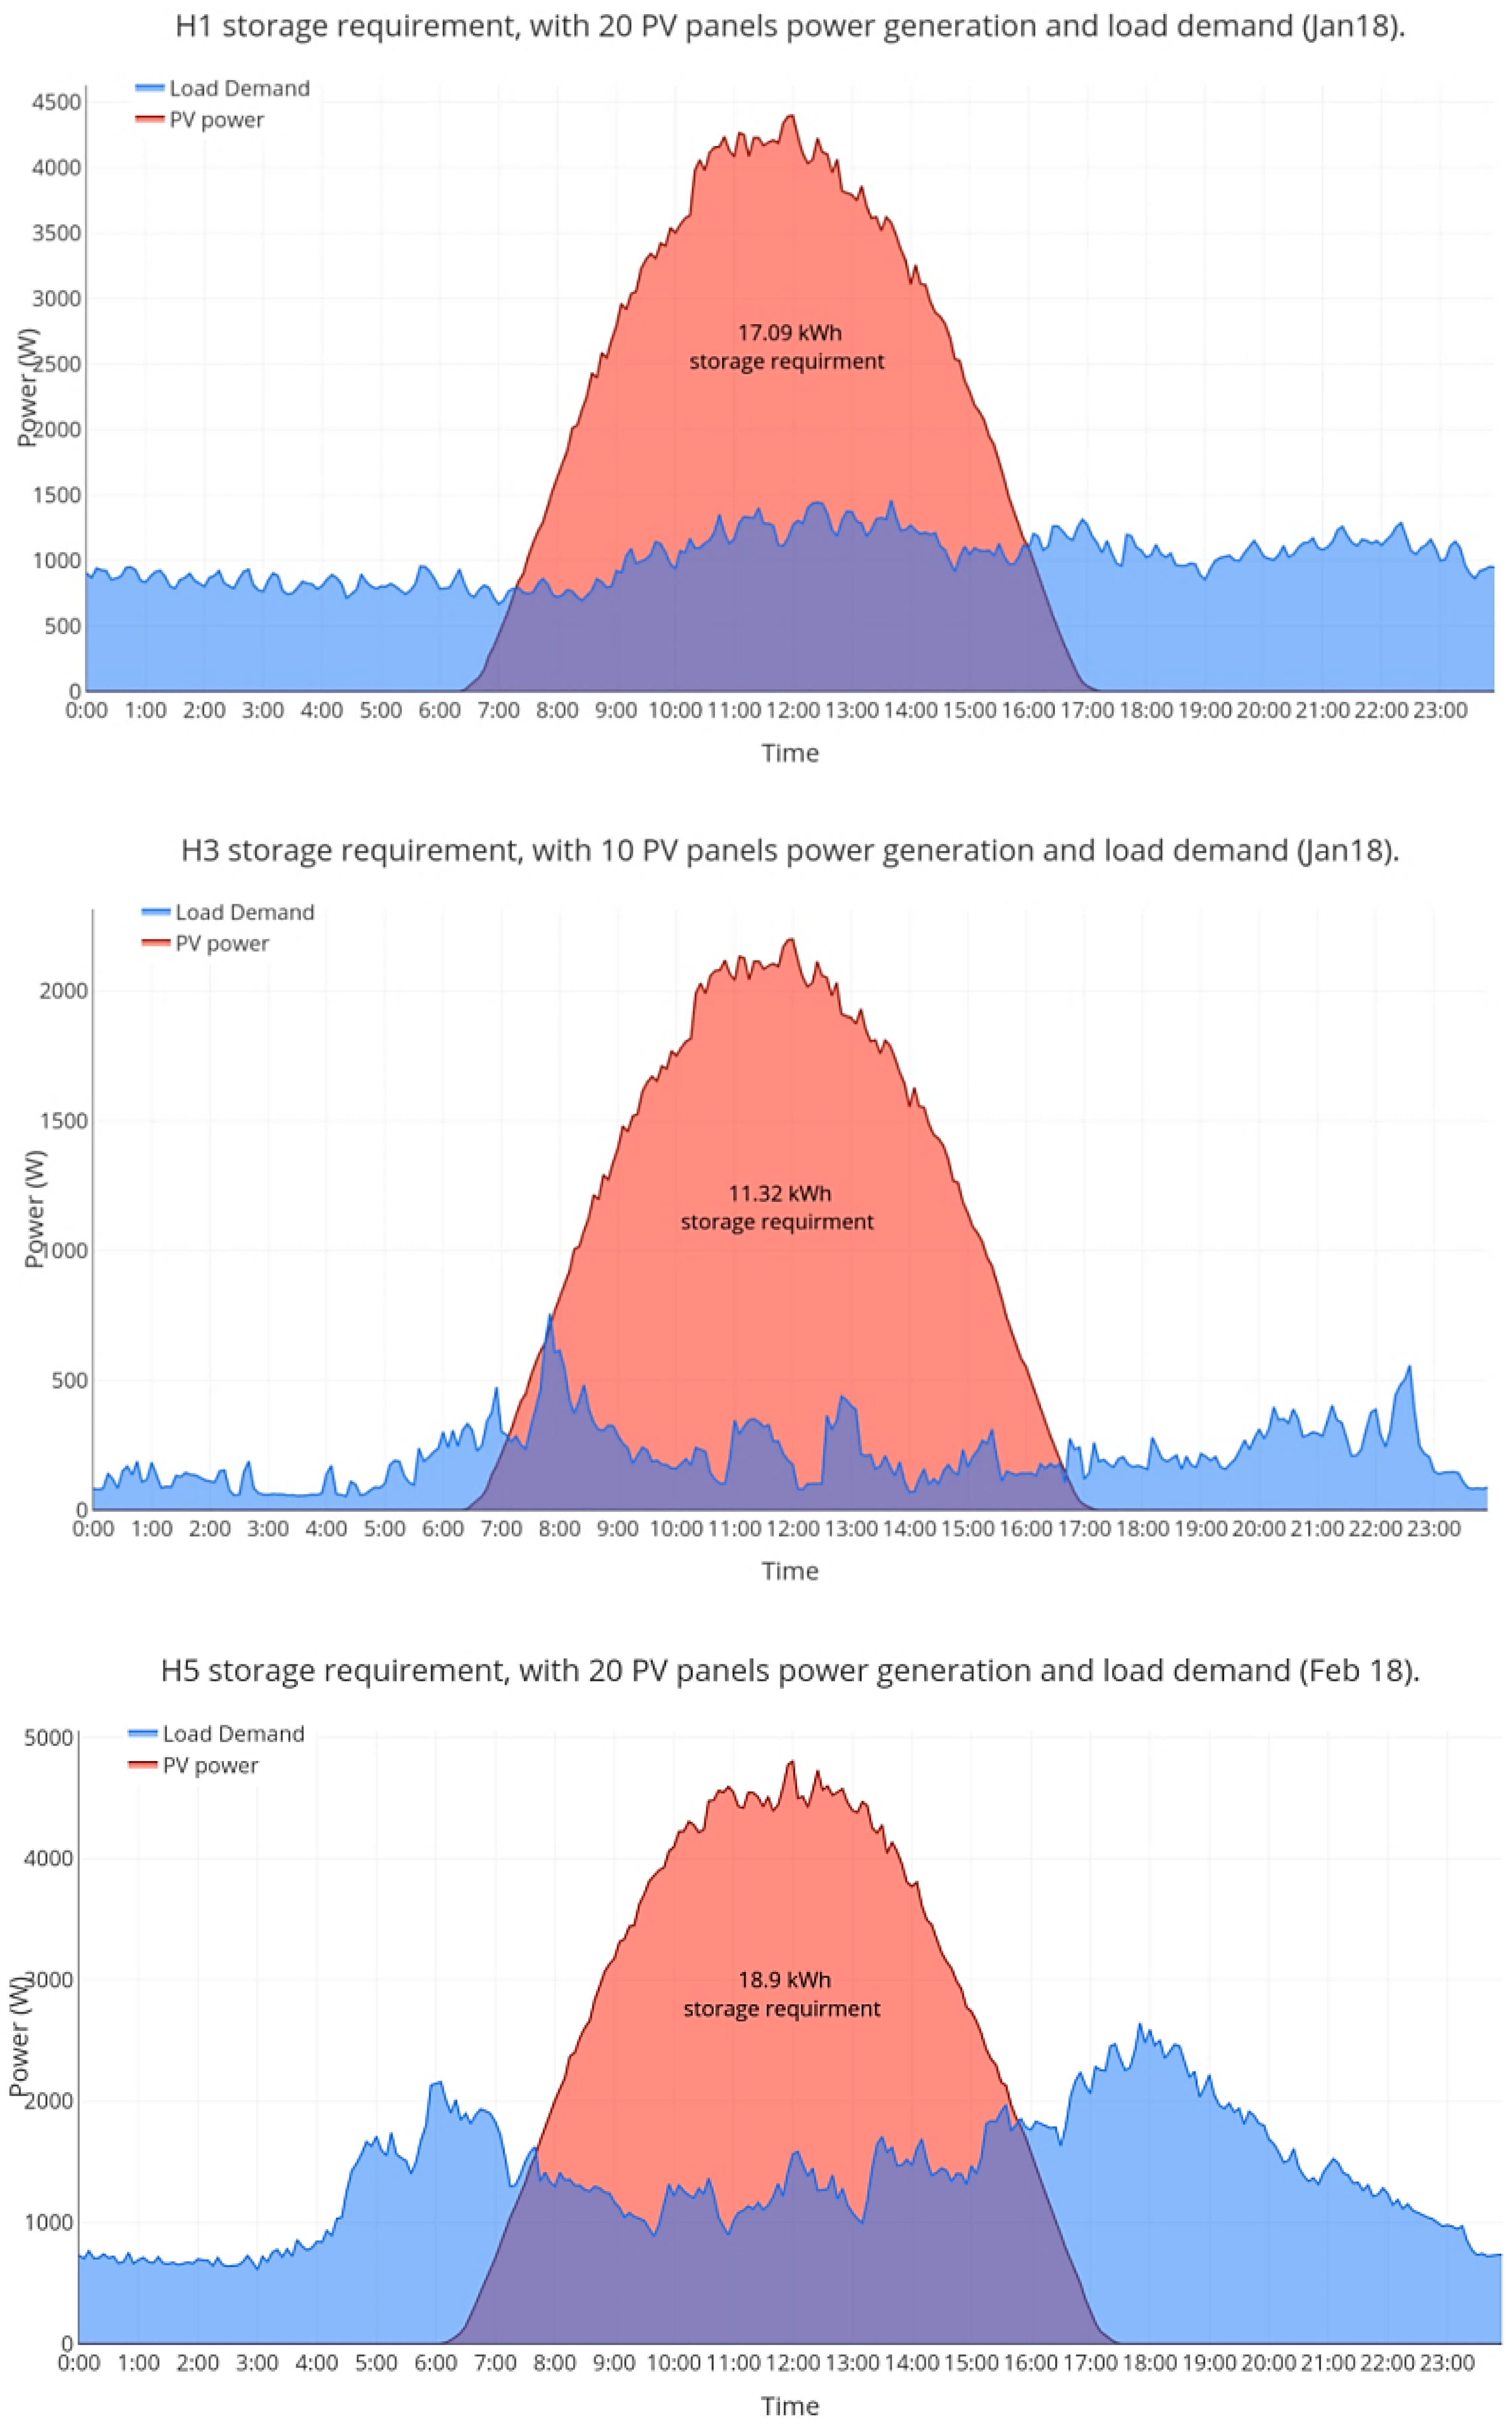
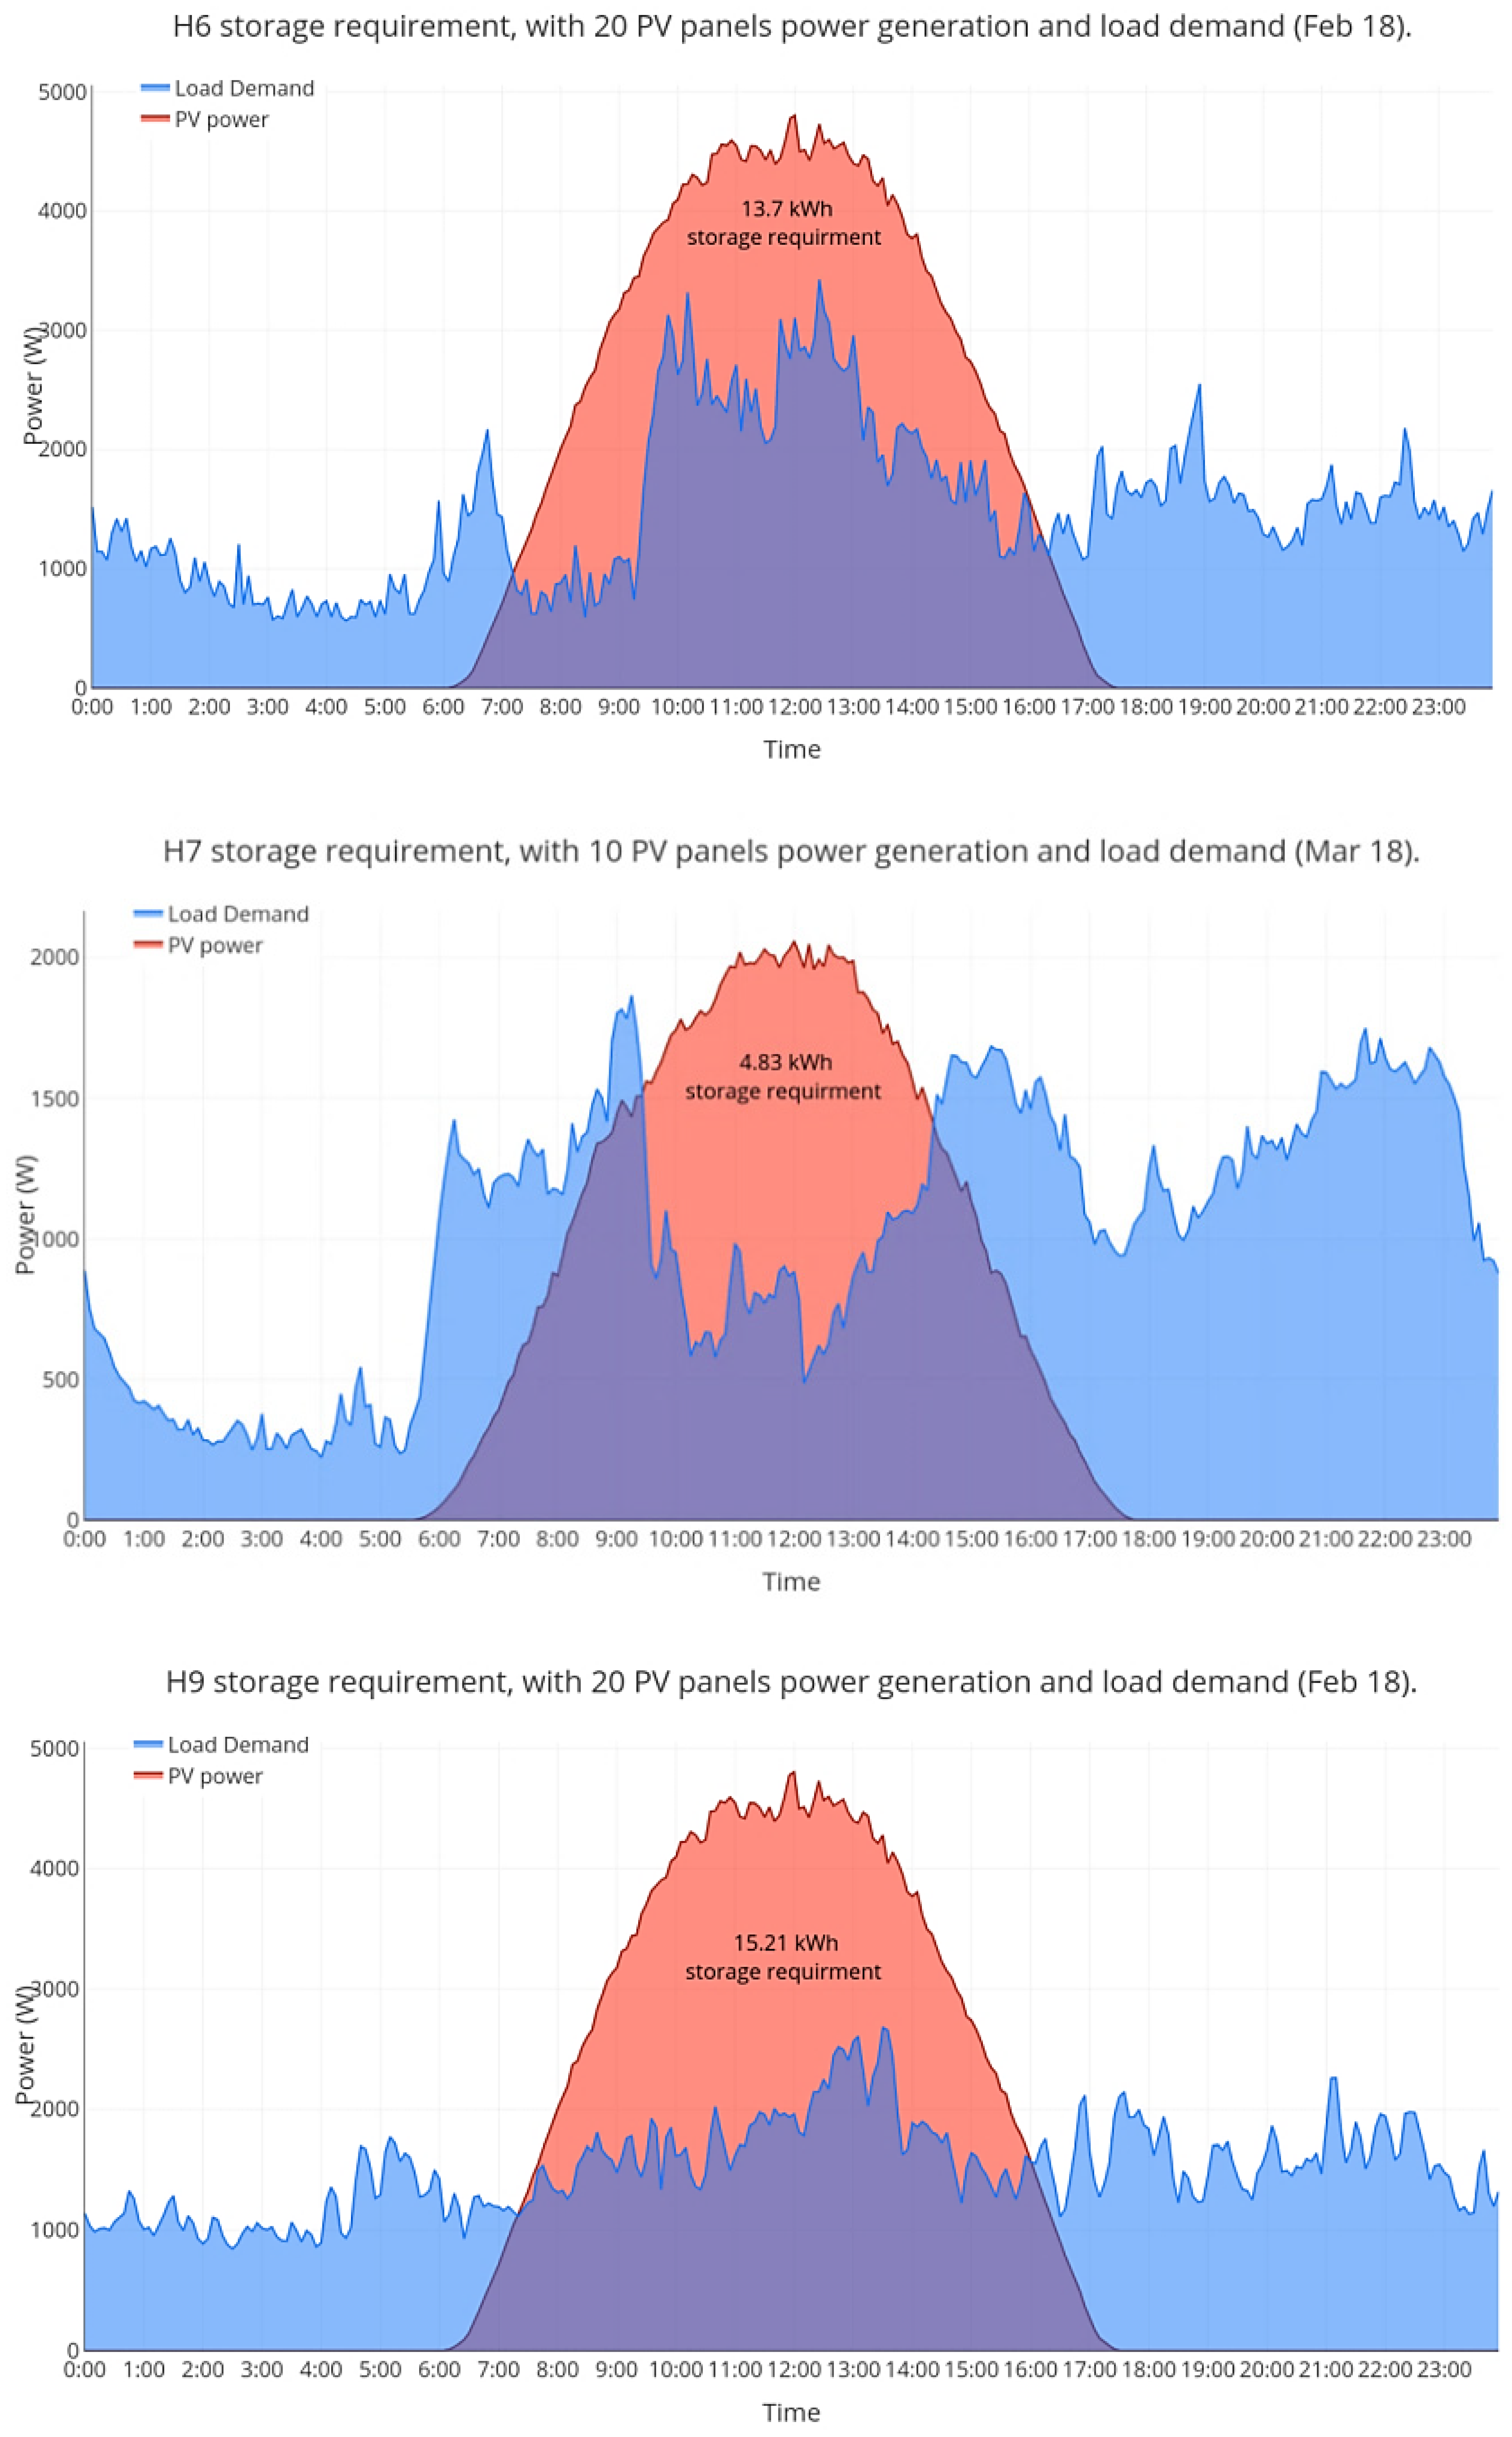
| Excess PV Energy (kWh) | Estimated Storage Cost (USD) | Excess PV Energy (Ah) | Max Storage Size (Ah) | Operation Duration within a Year | |
|---|---|---|---|---|---|
| H1 | 17.09 | 9400 | 1424 | 1700 | 76% |
| H3 | 11.32 | 6200 | 943 | 1100 | 67% |
| H5 | 18.90 | 10,400 | 1575 | 1900 | 66% |
| H6 | 13.70 | 7500 | 1142 | 1400 | 100% |
| H7 | 4.83 | 2700 | 402 | 500 | 83% |
| H9 | 15.21 | 8400 | 1268 | 1500 | 77% |
Publisher’s Note: MDPI stays neutral with regard to jurisdictional claims in published maps and institutional affiliations. |
© 2022 by the authors. Licensee MDPI, Basel, Switzerland. This article is an open access article distributed under the terms and conditions of the Creative Commons Attribution (CC BY) license (https://creativecommons.org/licenses/by/4.0/).
Share and Cite
Alrawi, O.; Bayram, I.S.; Koc, M.; Al-Ghamdi, S.G. Economic Viability of Rooftop Photovoltaic Systems and Energy Storage Systems in Qatar. Energies 2022, 15, 3040. https://doi.org/10.3390/en15093040
Alrawi O, Bayram IS, Koc M, Al-Ghamdi SG. Economic Viability of Rooftop Photovoltaic Systems and Energy Storage Systems in Qatar. Energies. 2022; 15(9):3040. https://doi.org/10.3390/en15093040
Chicago/Turabian StyleAlrawi, Omar, Islam Safak Bayram, Muammer Koc, and Sami G. Al-Ghamdi. 2022. "Economic Viability of Rooftop Photovoltaic Systems and Energy Storage Systems in Qatar" Energies 15, no. 9: 3040. https://doi.org/10.3390/en15093040
APA StyleAlrawi, O., Bayram, I. S., Koc, M., & Al-Ghamdi, S. G. (2022). Economic Viability of Rooftop Photovoltaic Systems and Energy Storage Systems in Qatar. Energies, 15(9), 3040. https://doi.org/10.3390/en15093040