Article

Emission of Methane and Carbon Dioxide during Soil Freezing without Permafrost

1
Geology Faculty, Lomonosov Moscow State University, 1 Leninskie Gory, 119991 Moscow, Russia
2
International Center of Cryology and Cryosophy, Tyumen State University, 6 Volodarskogo Str., 625003 Tyumen, Russia
3
NIIIT LLC, 20 Kulakova Str., 123592 Moscow, Russia
4
First Institute of Oceanography, SOA, 6 Xianxialing Road, Qingdao 266061, China
*
Author to whom correspondence should be addressed.
Energies 2022, 15(7), 2693; https://doi.org/10.3390/en15072693
Submission received: 26 January 2022 / Revised: 17 March 2022 / Accepted: 1 April 2022 / Published: 6 April 2022

Abstract

:
Research on methane and carbon dioxide emissions mainly focuses on industrial emissions, cultivated land, and wetlands, while few studies have studied freezing-related emissions. This paper presents field experiments conducted during soil freezing to measure carbon dioxide and methane concentrations in the air, near the soil surface, and in the soil. In addition, the influence of precipitation, snowfall, air temperature, and depth of freezing on gas emissions was analyzed. We observed increased concentrations of methane and carbon dioxide in soil and air at soil freezing and snow cover growth. For the first time, an increase in gas flux during soil freezing was found in the absence of permafrost.

1. Introduction

In recent decades, concerns have been raised about rapidly increasing concentrations of greenhouse gases in the atmosphere [1,2,3,4,5,6,7]. As permafrost melts, carbon in the soil is converted into methane and carbon dioxide, and released into the atmosphere, accelerating global warming and permafrost melting [8,9,10,11,12,13,14]. It is predicted that, by 2300, about 20% of permafrost will melt, and permafrost carbon emissions will increase by 50%. Lakes and wetlands formed in permafrost areas will emit 60–100 billion tons of carbon, while other regions may emit 200 billion tons of carbon [15,16].
Winter–spring carbon dioxide (CO2) fluxes from permanently and seasonally frozen soil composed of a significant part of the annual carbon balance, ranging from 5% to 50% [17,18].
In previous studies, increased gas emissions were observed when soils were frozen in the presence of permafrost, and were explained by the gas collection in the closed area between the frozen and permafrost layers, and by the low permeability of frozen ground [19,20]. This study examines whether the absence of permafrost affects methane and CO2 emissions. This is rarely noticed in previous studies. In addition, the influence of precipitation, snowfall, air temperature, and depth of freezing on gas emissions was analyzed. The findings of this work allow for a better understanding of gas emission mechanisms in a global warming environment at mid- and high latitudes.

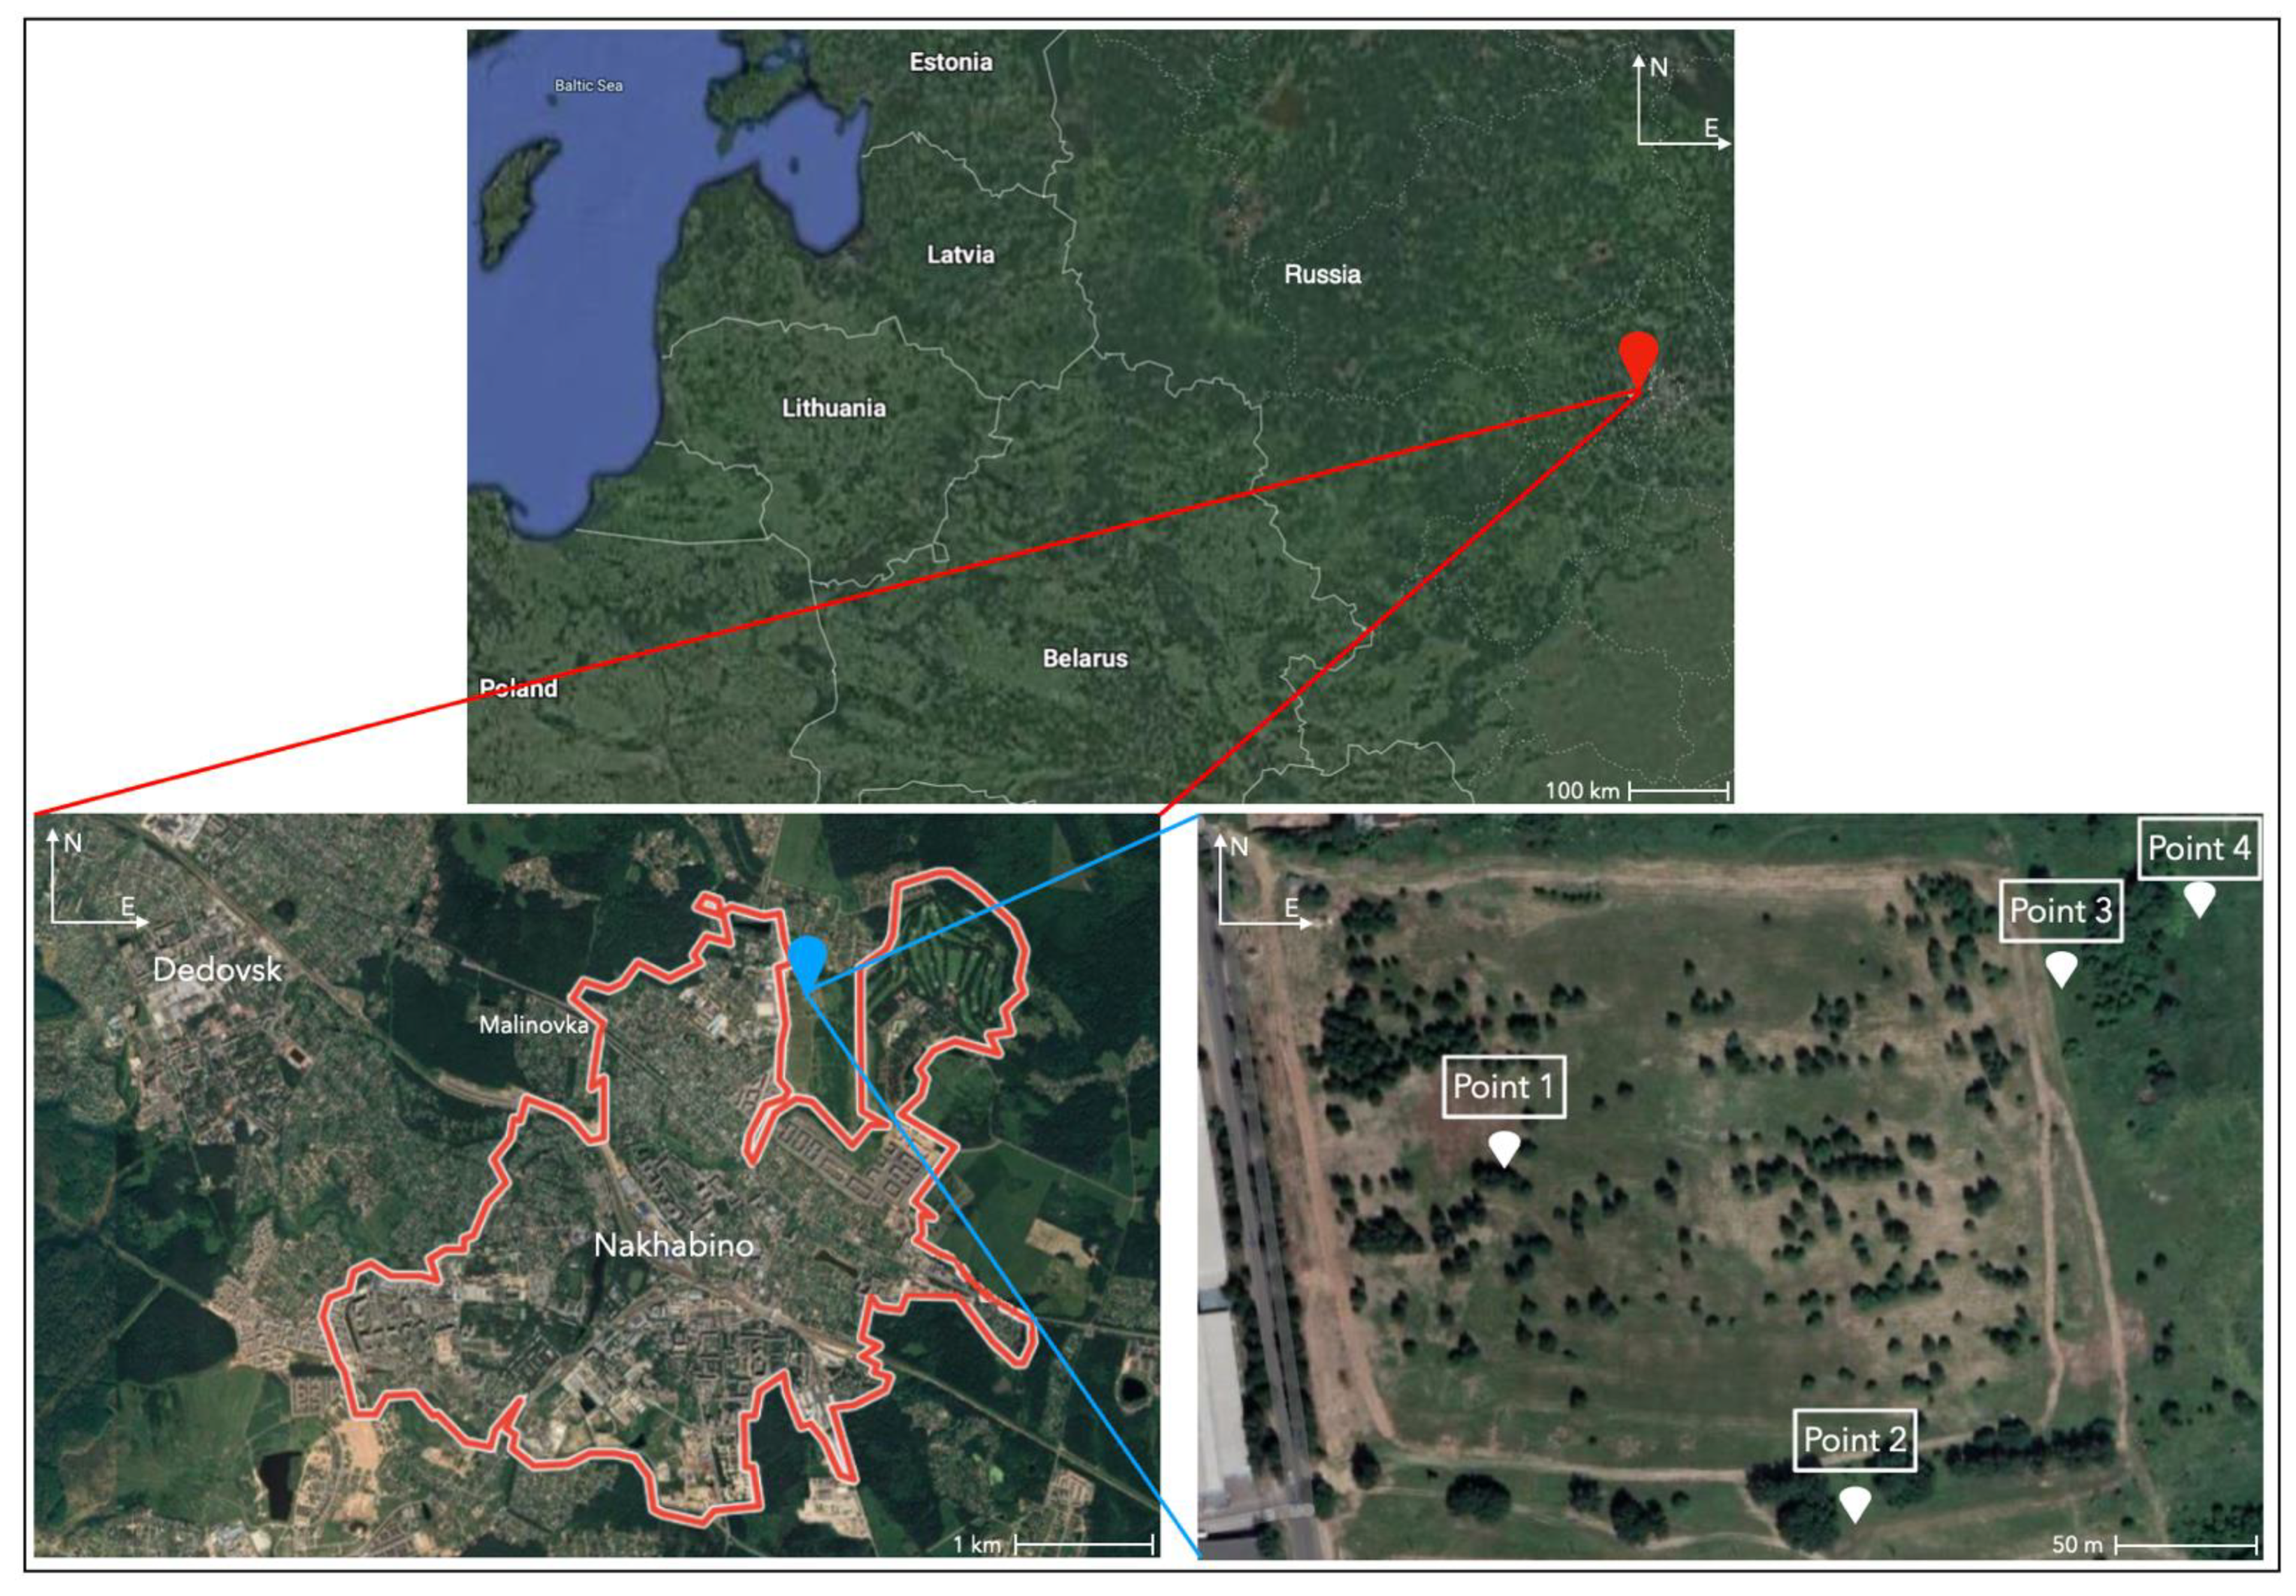
2. Experimental Area and Conditions

A site (55°51′44.3″ N, 37°11′21.3″ E, Figure 1) at the junction of Nakhabino and Krasnogorsk town in the Moscow region of Russia was chosen as the test area of this study. It is located in the Russian plain, and its climate is moderate continental humid. Quaternary sediments are mainly alluvial and fluvial moraine representing loam and sandy soils. Cold weather with frequent heavy snowfall is common in the area. The main vegetation types include grasses (lungwort, gingerbread, zelenchuk), undergrowth plants (forest honeysuckle, viburnum), coniferous–deciduous forests (spruce, pine, birch, poplar), and broad-leaved forests (oak and elm). The average snow cover period is 146 days with an average annual precipitation of 190–240 mm (meteorological station of MTAA). The mean January temperature is −10.2 °C (minimum of −42 °C), while the mean temperature of July is 18.1 °C (maximum of 37 °C) (meteorological station of MTAA). No agricultural or other human activities on the site can be observed all year round except rare occasions of walking. To avoid human influence, we randomly selected four test points and repeated the measurements at the same points.
To compare different variables, we took the following approach. First, 5 L of purified water was added into the dry soil in an area of 0.5 × 0.5 m to evaluate the effect of atmospheric precipitation on gas emissions. Second, a 2.5 L dome-shaped cap was placed on four test points on the soil surface with the opening facing down, and kept for 16 days. The container was used to study the influence of the frozen layer on gas storage and to estimate total gas emissions. Third, the impact of natural conditions on gas storage was studied, and conditions included temperature change, snow formation, and the frozen layer on the soil surface.

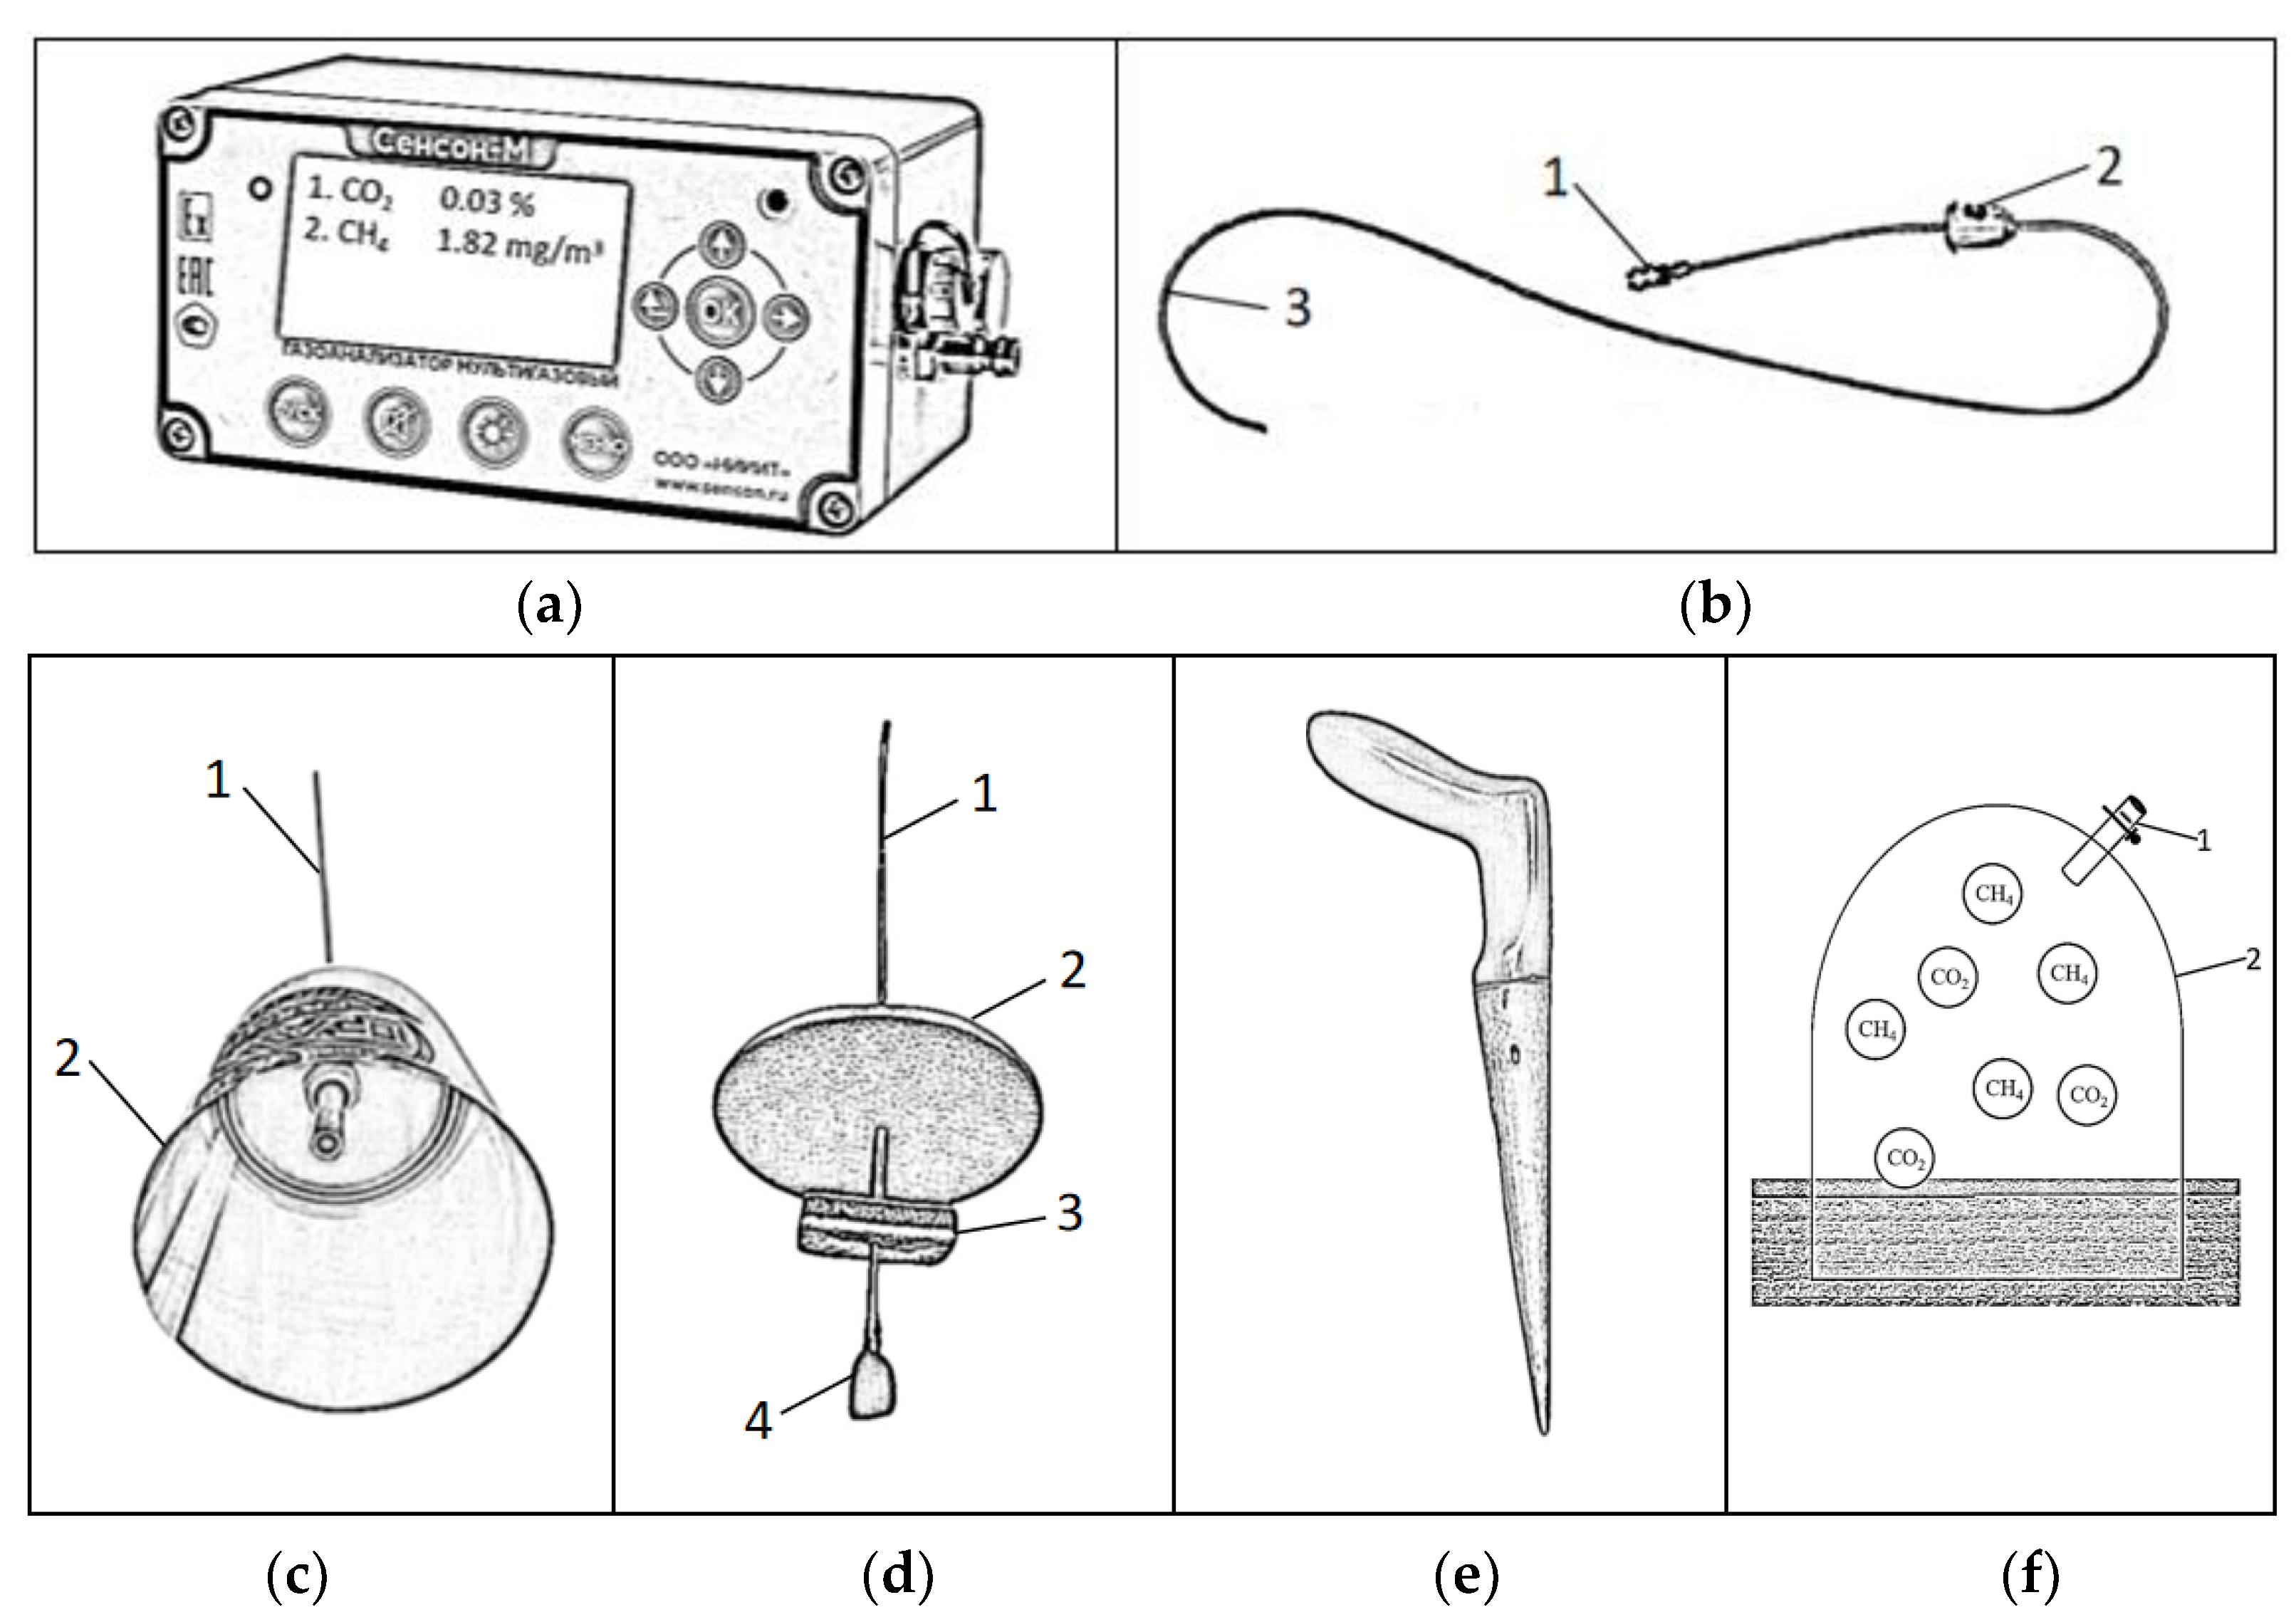
3. Experimental Instruments and Methods
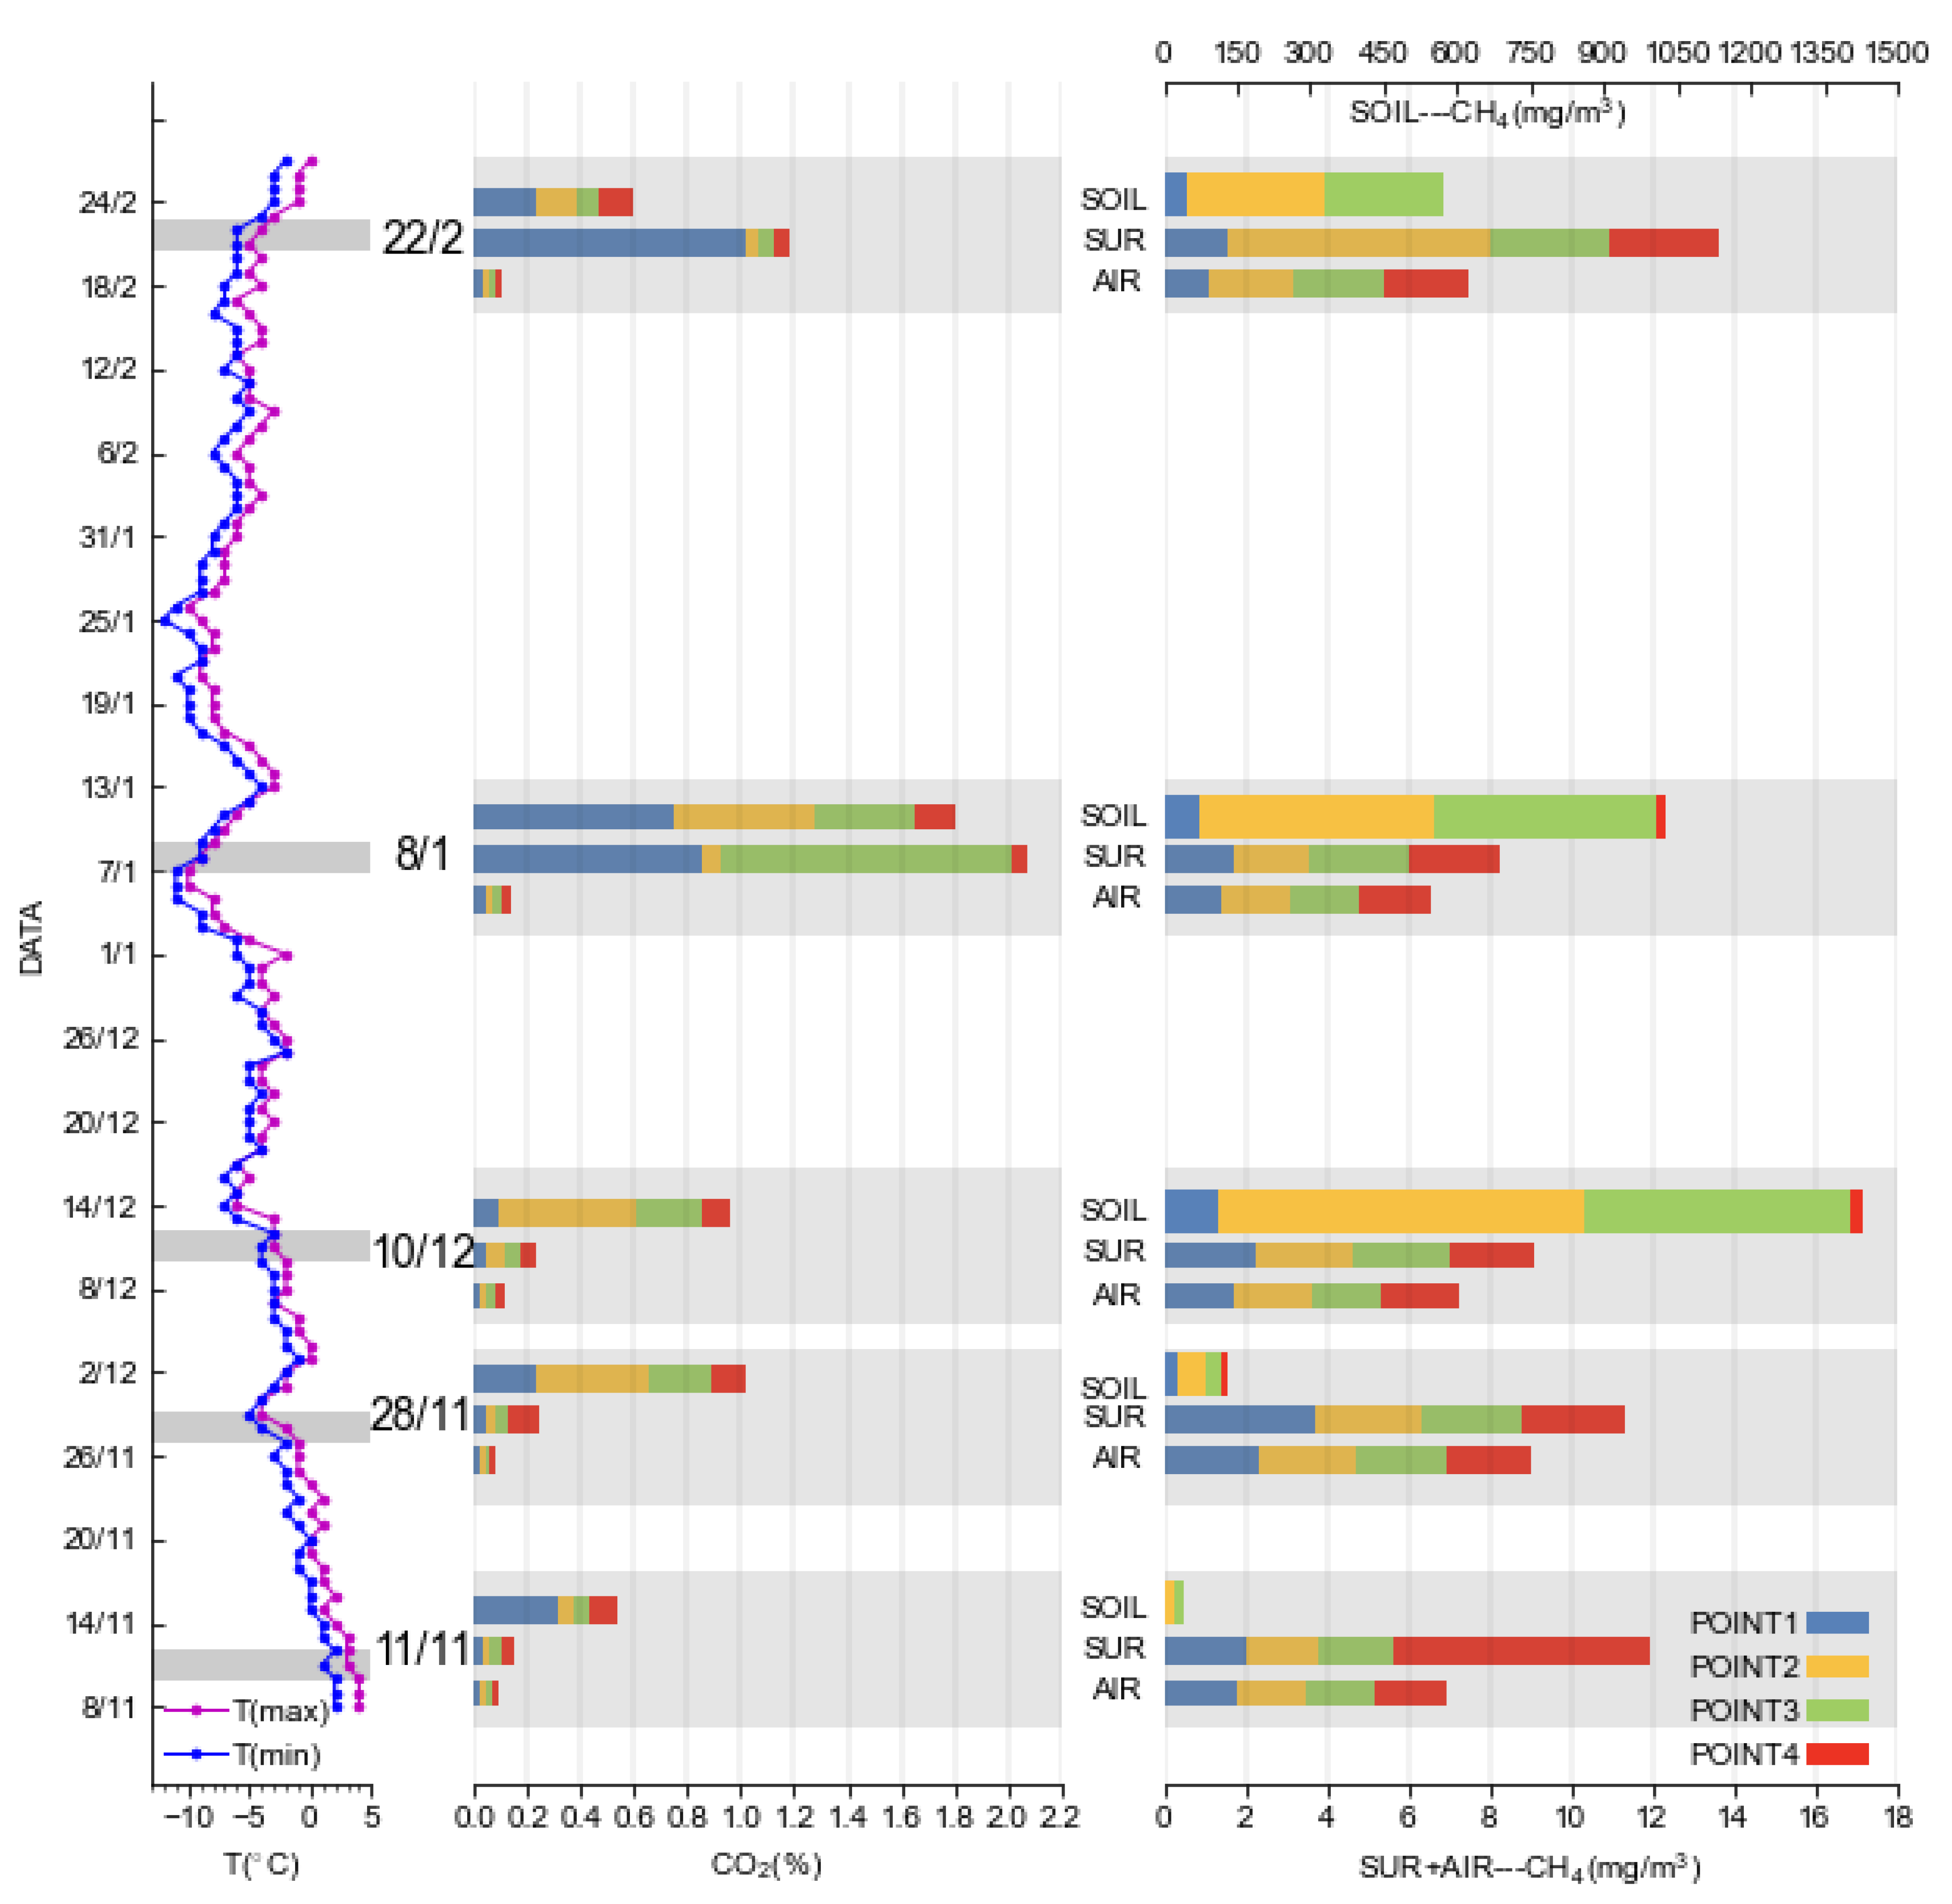
Multigas analyzer Kometa-M (Figure 2) was used as a measuring device, which contains gas-sensitive sensors for methane and carbon dioxide. The instrument is highly precise and has not been used by other studies. We used it here because of its advantages of lightness and high precision.
The Comet-M device was used with two sampling probes (Figure 2c,d) in field experiments to measure the concentration of gases in the air, on the soil surface, and inside the soil. To measure gas concentration in the air, sampling probes were disconnected from the gas analyzer, while the device directly measured gas concentrations in the air. To measure gas concentrations on the soil surface, a sampling probe had to be connected to the device (Figure 2c). Measurements began with installing a dome-shaped cap on the partly dug down soil surface. In this case, the dome-shaped cap was slightly pressed into the soil, reducing air suction under the dome-shaped cap. After the concentration equilibrium had been restored under the dome-shaped cap, the pump was turned on before taking the analyzed sample from the dome space through the probe to obtain the maximal concentration value. For measuring gas concentration in the soil, a 20 cm deep well was dug using a drilling device without a permafrost table. A probe (g) was installed above the wellhead; the exit from the well was sealed with a rubber gasket. After 1 min, the pump was turned on, and the measurement was carried out. A filter was set at the end of the probe inside the well to keep out dust and dirt. After reaching an equilibrium state between the gaseous medium and the interpore space of the soil, the pump was switched on, releasing the analyzed gas from the well. Meanwhile, maximal concentration values were recorded. In order to better study the effect of the freezing layer on gas storage, we inserted a 2.5 L dome-shaped cap (f) about 5 cm into the soil with the vent closed, and after 16 days, we measured the gas concentration. The vent was opened at the time of measurement, and the measuring device was then quickly accessed through a rubber tube. Affected by factors such as device air tightness, device volume, field environment, and gas leakage at the moment of measurement, the measured experimental data may have been subjected to certain errors.
For greater accuracy of the obtained data, each experiment at each point was carried out 3 times. In terms of data processing, the most stable gas concentration value was selected among all measurements in the air. The maximal gas concentration value was selected among all measurements on the soil surface and in the soil.

4. Research Results

On the basis of the three established relative variables in the field experiment, all obtained data in the field experiment were sorted in sequence, as shown in the following tables and charts.
According to the experimental results (Table 1) on 11 November 2020, the concentration of carbon dioxide in dry air was about 0.02%, and methane concentration was about 1.67–1.75 mg/m3. According to the experimental results of four test points, the concentrations of carbon dioxide and methane in the soil were higher than those on the soil surface.
After watering the soil, the concentration of methane in the air increased by about 4–15%. With water added into the soil at test point 3, the methane concentration on the soil surface increased from 1.83–3.25 mg/m3, while that in the soil decreased from 19.75–17.17 mg/m3.
At the same time, after watering the soil, the changing trend of the concentration of carbon dioxide was consistent between test points 3 and 4. With water added into the soil, the concentration of carbon dioxide in the air remained at 0.02%. The concentration of carbon dioxide on the soil surface increased by 25–80%, and that in the soil increased by 54–83%.
Data of carbon dioxide and methane produced during the cooling and freezing process in Table 2 show that, with the decrease in temperature, the emissions of carbon dioxide and methane from the ground generally tended to increase. Emissions of methane concentration at point 3 during the freezing were 4.7 times higher than those during cooling, which might have been related to the temperature mechanism, snow melting into the ground, and the comprehensive action of microorganisms.
Data comparison and analysis of the cooling and freezing processes (Table 1 and Table 2) showed that the concentration of carbon dioxide in the air during the freezing process was almost the same as that during the cooling process; the mechanism of methane changing with temperature was different than that of carbon dioxide. During the freezing process, methane concentration in the air was 1.19–1.45 times that during the cooling process. On the soil surface, with a decrease in temperature, the concentration of carbon dioxide increased by 1.33–2.20 times, and methane concentration increased to the initial 1.31–1.87 times. Inside the soil, with a decrease in temperature, the concentration of carbon dioxide increased by 1.18–7.16 times, and methane concentration increased by 1.72–4.70 times more than the initial value.
The first few points of the experiment had been covered with dome-shaped caps at all control points before the measured data were calculated. Experimental results showed that, in about 16 days, 78.42 mg methane was released per square meter at point 3, and about 750 mg methane was emitted per square meter at point 4.
Through observing the freezing soil and analyzing data obtained during five field experiments, the changing trend of carbon dioxide on the soil surface and in the soil was similar, as soil freezing progressed, and snow-cover thickness increased. The concentration of carbon dioxide on the soil surface first increased by about 27 times in 1 months, and then decreased by 1.2–22 times in 1.5 months. The concentration of carbon dioxide in the soil first increased by about 1.4–8.3 times in 2 months, and then decreased by 1.2–4.1 times in 1.5 months. The value of carbon dioxide in the air was stable at first (0.02%), and then rose by 1.5–2 times for 2 months before decreasing by 1.5–2 times until it became stable (0.02–0.03%).
According to the changing trend of methane, with the freezing process of the soil surface, methane content in the soil first steadily increased (1.7–4.7 times in 0.5 months), increased sharply (3.1–15.6 times in half a month), and lastly decreased (2.2–6.7 times in 2 months) before it became stable. However, methane content in the air first increased from 1.67–2.42 mg/m3 in 0.5 months, decreased from 2.42–1.67 mg/m3, and then increased to 2.25 mg/m3 in 1.5 months, which ended up stabilizing.
Methane concentration on the soil surface increased from 1.83–3.75 mg/m3 in 0.5 months, and then decreased from 3.75–2.08 mg/m3 in 3 months. Lastly, the value tended to be stable.

5. Discussion

Greenhouse gas emissions are a complex system involving the activities of above-ground and underground plants and microorganisms, and the interactions between microorganisms and plants [21,22,23,24,25,26]. Gases are also affected by soil vapor conductivity during emissions [27]. By analyzing the relationship between CH4 emissions and physical parameters such as temperature, water table level, thickness of the active soil layer, wind speed, and precipitation, Friborg et al. indicated that space and time are the main factors affecting gas emissions [28,29]. In our study, we attempted to describe in detail the hypothesized physicochemical process.
According to observations of soil freezing processes and analysis of data obtained during five field experiments (Table 1, Table 2 and Table 3, Figure 3), with the gradual freezing of soil and the increase in snow thickness, the concentration of carbon dioxide on the soil surface and inside the soil tended to first increase and then rapidly decrease, which could be caused by the formation of permafrost tables [30]. In addition, snow prevented carbon dioxide removal, so that gas could accumulate in the soil. As snow thickness increased, the soil surface began to gradually melt due to the gradual emission of carbon dioxide accumulated in the soil. With the decrease in temperature, the concentration of carbon dioxide in the air first dropped; then, it rocketed until became stable before lastly decreasing, which could have resulted from the amount of carbon dioxide released into the soil.
With the freezing process, the content of carbon dioxide in the air first decreased. The downward trend was because the photosynthesis and respiration of land vegetation were slowed down or stopped with the decrease in temperature and the soil surface being frozen [31]. At first, the concentration decreased, and the concentration of carbon dioxide in the air increased rapidly, which might have been because carbon dioxide in the soil was squeezed out during the freezing of the soil surface [32]. After the soil surface had completely frozen, carbon dioxide content in the air became stable. The subsequent decrease in carbon dioxide in the air could have been related to the decrease in carbon dioxide emissions from the soil.
In our study, methane was primarily measured at soil locations at the soil surface and in shallow layers, as Wille et al. proposed [33]. According to the changing trend of methane (Table 1, Table 2 and Table 3, Figure 3), with the freezing of the soil surface, methane content in the soil increased steadily at first, increased sharply, and lastly gradually decreased until it stabilized. However, methane content in the air and soil surface increased first, decreased, increased, and lastly stabilized. At the beginning of soil freezing, methane content in the soil increased, but it was not exceptionally high because the generated methane was released to the soil surface and air. At the beginning of freezing, methane was on the soil surface and in the air, and when the methane content in the soil increased sharply, methane content in the air and soil surface decreased, giving rise to the increase. The soil under the snow cover was frozen, and methane could not be released [34]. Thus, after a sharp increase in methane in the soil, its content decreased. Due to the increased snow thickness, the methane concentration in the air and on the soil surface slowly increased. Soil temperature at the soil surface rose accordingly, and methane leaked from the underground soil after the surface of the permafrost table had partially melted.
Tao Bao et al. collected soil heat fluxes (G) and turbulent fluxes CH4, latent heat (LE), and sensible heat (H) from three eddy covariance (EC) measurement sites points, finding that, during the freezing period in autumn (1212.31 ± 280.39 mg m−2 year−1) and the thawing period in spring (307.39 ± 46.11 mg m−2 year−1), the accumulated methane emissions were much higher [35]. By analyzing the research results, they thought that the near-surface soil temperatures could not wholly reflect deep soil’s freezing and thawing processes. There would be a lag effect on methane emissions from early spring thawing to late autumn freezing. Interestingly, Huai Chen et al. combined vortex covariance, incubation experiments, and high-throughput sequencing, and monitored methane flow from alpine swamps during four-year thaw–freeze periods. The primary source of methane emissions occurred in the thawing period: warm and long thawing periods accounted for 69.1–88.6% of methane emissions in the whole year. Their research proved that peatland was an important natural source of methane. Soil temperature and humidity seemed to be the main determinants of emissions during thawing and freezing. It seemed that lowering the groundwater level could significantly reduce methane emissions, which might have a complicated relationship with the response of Archean communities to climate change. The change in freeze–thaw conditions affected the dynamics of soil methane emissions [36].
Compared with related studies, the soil surface freezing and snow formation process was investigated, but no data on freezing and thawing in autumn could be found, as relative changes in methane and carbon dioxide during this period had not been recorded [33,34]. Each stage was analyzed in detail, providing an accurate database for studying the influence of the freezing process on greenhouse gas emissions. Only temperature data from monitoring stations were used in this study, while corresponding data on methane and carbon dioxide were obtained by experimenters during field tests, which were relatively accurate. Another critical and interesting research point in this study is the influence of precipitation on methane and carbon dioxide emissions.
After the soil surface had frozen, the content of greenhouse gases inside the soil increased, which may have resulted from the fact that soil began to freeze down from the soil surface and up from the permafrost table surface [19,20]. Due to the double-sided freezing process, the permafrost table prevented gas from being released into the soil, so that the gas remained in the soil pores, which increased the gas concentration inside the soil [32,33,37,38] (Figure 4a). However, according to our on-site measurements, the obtained stratigraphic model and gas emission mechanism were different (Figure 4b,c).
Notably, most research in related fields focuses on permafrost, while our research area was located in seasonal permafrost with an average of at least 146 days of snow every year [32,38]. Under special geographical conditions, the following situation often occurs: as the thickness of the snow increases, soil under the snow cover melts. According to field data, as freezing progressed, and the lower part of the soil was not frozen, gas concentration in the soil gradually rose, indicating that gas circulation was mainly related to the upper frozen soil layer and the thickness of snow. As topsoil freezes, gas under the soil gradually accumulates near the stomata below the frozen soil layer. When pressure in the stomata reaches a certain level, it forces the gas to rush out of the frozen soil and upper snow layers to overflow into the air (Figure 4b).
On the basis of test data from a field model, this study analyzed the reasons for the suppression of gas emissions by snow cover. Within a certain underground depth range, deeper depth led to more gas generation sources, and smaller soil particle pores corresponded to less gas content. The concentrated gas gradually moved towards the location close to the lower part of the snow cover and penetrated the snow cover before being discharged into the air due to the increase in pressure. The soil surface at the three other measuring points was not frozen because of the thick snow according to the last measurement (22 February 2021). Methane and carbon dioxide concentrations were still higher than those before soil freezing. Therefore, the freezing of the upper and lower soil layers did not only block the release of gas into the soil (Figure 4c). By analyzing the last two gas measurements, carbon dioxide concentration on the soil surface of measuring point 1 reached up to 1.02% (Table 3). By analyzing methane, we found that snow could inhibit methane emissions by 50–60%. Thus, the formation of snow inhibited carbon dioxide and methane emissions, and snow cover is an essential factor in studying permafrost’s greenhouse gas emission mechanism, but it was often ignored in previous studies.

6. Conclusions

The following conclusions can be drawn on the mechanism of methane and carbon dioxide emissions by analyzing the results of a large number of field control experiments.
(1)
Rainfall was conducive to the release of methane and carbon dioxide in soil.
(2)
Much methane and carbon dioxide were released from the soil during the freezing process, and especially methane. With the emergence of the permafrost table and the formation of snow, in a short period of 16 days, emissions per square meter could reach even more than 750 mg/m3. Although the survey area was not in the permafrost area, there were already many greenhouse gases. In permafrost regions, with the increase in temperature, permafrost melts. If scientists take adequate measures to capture methane and carbon dioxide in permafrost and reuse them, their values are even more surprising. If proper measures are not taken, on the other hand, large amounts of methane and carbon dioxide are released into the air, increasing the greenhouse effect.
(3)
The formation of frozen layers and snow cover was critical in accumulating methane and carbon dioxide in the soil. After forming the frozen layer and snow on the soil surface, the methane concentration was 57.6 times higher than that without snow. This result provides strong evidence that permafrost is the most important natural source of greenhouse gases.
(4)
With the progress of freezing, the concentration of carbon dioxide in the soil surface and soil increased, while the concentration of carbon dioxide in the air first decreased and then sharply increased until it stabilized with the decrease in temperature.
(5)
The trend of methane change showed that, as the freezing process continued, methane content in the soil first stabilized, increased sharply, and lastly decreased, tending to be stable. However, methane content in the air and soil surface at first increased, then decreased, and lastly stabilized.
(6)
The gas cycle and gas emissions in frozen soil were mainly related to the upper frozen soil layer and the thickness of snow cover.
(7)
The formation of snow would restrain the release of methane and carbon dioxide in soil. Snow cover is a significant factor that should not be ignored while studying the mechanism of greenhouse gas emissions in permafrost.

Author Contributions

Conceptualization, A.V.B. and V.G.C.; methodology, A.V.S.; software, K.L.; validation, C.L., A.V.B. and A.V.S.; formal analysis, A.V.B. and V.G.C.; investigation, C.L. and A.V.B.; resources, A.V.B. and A.V.S.; data curation, C.L. and K.L.; writing—original draft preparation, C.L.; writing—review and editing, C.L., A.V.B. and V.G.C.; visualization, C.L. and K.L.; supervision, A.V.B. and A.V.S.; project administration, A.V.B.; funding acquisition, A.V.B. All authors have read and agreed to the published version of the manuscript.

Funding

This research was funded by the CTGS’21 academic conference (ЯHAO conferences in Salekhard, Russia).

Institutional Review Board Statement

Not applicable.

Informed Consent Statement

Not applicable.

Data Availability Statement

Not applicable.

Acknowledgments

The authors thank the China Scholarship Council (no. 202008090312) for supporting this work.

Conflicts of Interest

The authors declare no conflict of interest.

References

  1. Brown, J.; Romanovsky, V.E. Report from the International Permafrost Association: State of permafrost in the first decade of the 21st century. Permafr. Periglac. Process. 2008, 19, 255–260. [Google Scholar] [CrossRef] [Green Version]
  2. Claussen, E.; Cochran, V.A.; Davis, D.P. Climate Change: Science, Strategies, & Solutions; Brill: Leiden, The Netherlands; Boston, MA, USA; Cologne, Germany, 2001; 373p. [Google Scholar]
  3. Commane, R.; Lindaas, J.; Benmergui, J.; Luus, K.A.; Chang, R.; Daube, B.C.; Euskirchen, E.S.; Henderson, J.M.; Karion, A.; Miller, J.; et al. Carbon dioxide sources from Alaska driven by increasing early winter respiration from Arctic tundra. Proc. Natl. Acad. Sci. USA 2017, 114, 5361–5366. [Google Scholar] [CrossRef] [PubMed] [Green Version]
  4. Hugelius, G.; Strauss, J.; Zubrzycki, S.; Harden, J.W.; Schuur, E.A.G.; Ping, C.-L.; Schirrmeister, L.; Grosse, G.; Michaelson, G.J.; Koven, C.D.; et al. Estimated stocks of circumpolar permafrost carbon with quantified uncertainty ranges and identified data gaps. Biogeosciences 2014, 11, 6573–6593. [Google Scholar] [CrossRef] [Green Version]
  5. Koven, C.D.; Riley, W.J.; Stern, A. Analysis of Permafrost Thermal Dynamics and Response to Climate Change in the CMIP5 Earth System Models. J. Clim. 2013, 26, 1877–1900. [Google Scholar] [CrossRef] [Green Version]
  6. Schneider, S.H. Global Climate Change in the Human Perspective. In Geosphere-Biosphere Interactions and Climate; Bengtsson, L.O., Hammer, C.U., Eds.; Cambridge University Press: Cambridge, UK, 2001; pp. 90–91. [Google Scholar]
  7. Tubiello, F.N.; Salvatore, M.; Cóndor Golec, R.D.; Ferrara, A.; Rossi, S.; Biancalani, R.; Federici, S.; Jacobs, H.; Flammini, A. Agriculture, Forestry and Other Land Use Emissions by Sources and Removals by Sinks: 1990–2011 Analysis; FAO: Rome, Italy, 2014. [Google Scholar] [CrossRef]
  8. Romanovsky, V.E.; Drozdov, D.S.; Oberman, N.G.; Malkova, G.V.; Kholodov, A.L.; Marchenko, S.S.; Moskalenko, N.G.; Sergeev, D.O.; Ukraintseva, N.G.; Abramov, A.A.; et al. Thermal state of permafrost in Russia. Permafr. Periglac. Process. 2010, 21, 136–155. [Google Scholar] [CrossRef]
  9. Schuur, E.A.G.; McGuire, A.D.; Schädel, C.; Grosse, G.; Harden, J.W.; Hayes, D.J.; Hugelius, G.; Koven, C.D.; Kuhry, P.; Lawrence, D.M.; et al. Climate change and the permafrost carbon feedback. Nature 2015, 520, 171–179. [Google Scholar] [CrossRef]
  10. Schuur, E.A.G.; Bockheim, J.; Canadell, J.G.; Euskirchen, E.; Field, C.B.; Goryachkin, S.V.; Hagemann, S.; Kuhry, P.; LaFleur, P.M.; Lee, H.; et al. Vulnerability of Permafrost Carbon to Climate Change: Implications for the Global Carbon Cycle. Bioscience 2008, 58, 701–714. [Google Scholar] [CrossRef]
  11. Tarnocai, C.; Canadell, J.G.; Schuur, E.A.G.; Kuhry, P.; Mazhitova, G.; Zimov, S.A. Soil organic carbon pools in the northern circumpolar permafrost region. Glob. Biogeochem. Cycle 2009, 23, 1–11. [Google Scholar] [CrossRef]
  12. Zimov, S.A.; Schuur, E.A.G.; Chapin, F.S. Permafrost and the Global Carbon Budget. Science 2006, 312, 1612–1613. [Google Scholar] [CrossRef]
  13. Avis, C.A.; Weaver, A.J.; Meissner, K.J. Reduction in areal extent of high-latitude wetlands in response to permafrost thaw. Nat. Geosci. 2011, 4, 444–448. [Google Scholar] [CrossRef]
  14. Hertwich, E. The Carbon Footprint of Material Production Rises to 23% of Global Greenhouse Gas Emissions; Center for Open Science: Charlottesville, VA, USA, 2019. [Google Scholar]
  15. Turetsky, M.R.; Abbott, B.; Jones, M.C.; Anthony, K.W.; Olefeldt, D.; Schuur, E.A.G.; Koven, C.; McGuire, A.D.; Grosse, G.; Kuhry, P.; et al. Permafrost collapse is accelerating carbon release. Nature 2019, 569, 32–34. [Google Scholar] [CrossRef] [Green Version]
  16. MacDougall, A.H.; Avis, C.A.; Weaver, A.J. Significant contribution to climate warming from the permafrost carbon feedback. Nat. Geosci. 2012, 5, 719–721. [Google Scholar] [CrossRef]
  17. Kurganova, I.; Teepe, R.; Loftfield, N. Influence of freeze-thaw events on carbon dioxide emission from soils at different moisture and land use. Carbon Balance Manag. 2007, 2, 2. [Google Scholar] [CrossRef] [PubMed] [Green Version]
  18. Natali, S.M.; Watts, J.D.; Rogers, B.M.; Potter, S.; Ludwig, S.M.; Selbmann, A.K.; Sullivan, P.F.; Abbott, B.W.; Arndt, K.A.; Birch, L.; et al. Large loss of CO2 in winter observed across the northern permafrost region. J. Nat. Clim. Chang. 2019, 9, 852–857. [Google Scholar] [CrossRef] [PubMed]
  19. Arndt, K.A.; Lipson, D.A.; Hashemi, J.; Oechel, W.C.; Zona, D. Snow melt stimulates ecosystem respiration in Arctic ecosystems. Glob. Chang. Biol. 2020, 26, 5042–5051. [Google Scholar] [CrossRef]
  20. Bing, H.; He, P.; Zhang, Y. Cyclic freeze–thaw as a mechanism for water and salt migration in soil. Environ. Earth Sci. 2015, 74, 675–681. [Google Scholar] [CrossRef] [Green Version]
  21. Mooney, H.A.; Canadell, J.; Chapin, F.S.; Ehleringer, J.E.; Korner, C.H.; Mcmurtie, R.E.; Parton, W.J.; Pitelka, L.F.; Schulze, E.-D. Ecosystem physiology responses to global change. In The Terrestrial Biosphere and Global Change; Walker, B.H., Steffen, W.L., Canadell, J., Ingram, J.S.I., Eds.; Cambridge University Press: Cambridge, UK, 1999; pp. 141–189. [Google Scholar]
  22. Briggs, M.A.; Walvoord, M.; McKenzie, J.M.; Voss, C.I.; Day-Lewis, F.; Lane, J.W. New permafrost is forming around shrinking Arctic lakes, but will it last? Geophys. Res. Lett. 2014, 41, 1585–1592. [Google Scholar] [CrossRef]
  23. Burke, S.A.; Wik, M.; Lang, A.; Contosta, A.R.; Palace, M.; Crill, P.M.; Varner, R.K. Long-Term Measurements of Methane Ebullition from Thaw Ponds. J. Geophys. Res. Biogeosci. 2019, 124, 2208–2221. [Google Scholar] [CrossRef]
  24. Jorgenson, M.T.; Romanovsky, V.; Harden, J.; Shur, Y.; O’Donnell, J.; Schuur, E.A.G.; Kanevskiy, M.; Marchenko, S. Resilience and vulnerability of permafrost to climate change. Can. J. For. Res.-Rev. Can. Rech. For. 2010, 40, 1219–1236. [Google Scholar] [CrossRef] [Green Version]
  25. Reyes, A.V.; Froese, D.G.; Jensen, B.J. Permafrost response to last interglacial warming: Field evidence from non-glaciated Yukon and Alaska. Quat. Sci. Rev. 2010, 29, 3256–3274. [Google Scholar] [CrossRef]
  26. Zamolodchikov, D.G.; Karelin, D. An empirical model of carbon fluxes in Russian tundra. Glob. Chang. Biol. 2001, 7, 147–161. [Google Scholar] [CrossRef] [Green Version]
  27. Zhai, Q.; Ye, W.; Rahardjo, H.; Satyanaga, A.; Dai, G.; Zhao, X. Theoretical method for the estimation of vapour conductivity for unsaturated soil. Eng. Geol. 2021, 295, 106447. [Google Scholar] [CrossRef]
  28. Friborg, T.; Christensen, T.R.; Hansen, B.U.; Nordstroem, C.; Soegaard, H. Trace gas exchange in a high-arctic valley 2. Landscape CH4 fluxes measured and modeled using eddy correlation data. Glob. Biogeochem. Cycles 2000, 14, 715–724. [Google Scholar] [CrossRef]
  29. Olefeldt, D.; Turetsky, M.R.; Crill, P.M.; McGuire, A.D. Environmental and physical controls on northern terrestrial methane emissions across permafrost zones. Glob. Chang. Biol. 2013, 19, 589–603. [Google Scholar] [CrossRef] [PubMed]
  30. Mastepanov, M.; Sigsgaard, C.; Tagesson, T.; Ström, L.; Tamstorf, M.P.; Lund, M.; Christensen, T.R. Revisiting factors controlling methane emissions from high-Arctic tundra. Biogeosciences 2013, 10, 5139–5158. [Google Scholar] [CrossRef] [Green Version]
  31. Amthor, J.S. Terrestrial higher-plant response to increasing atmospheric [CO2] in relation to the global carbon cycle. Glob. Chang. Biol. 1995, 1, 243–274. [Google Scholar] [CrossRef]
  32. Pirk, N.; Santos, T.; Gustafson, C.; Johansson, A.J.; Tufvesson, F.; Parmentier, F.W.; Mastepanov, M.; Christensen, T.R. Methane emission bursts from permafrost environments during autumn freeze-in: New insights from ground-penetrating radar. Geophys. Res. Lett. 2015, 42, 6732–6738. [Google Scholar] [CrossRef]
  33. Wille, C.; Kutzbach, L.; Sachs, T.; Wagner, D.; Pfeiffer, E.-M. Methane emission from Siberian arctic polygonal tundra: Eddy covariance measurements and modeling. Glob. Chang. Biol. 2008, 14, 1395–1408. [Google Scholar] [CrossRef] [Green Version]
  34. Hargreaves, K.J.; Fowler, D.; Pitcairn, C.E.R.; Aurela, M. Annual methane emission from Finnish mires estimated from eddy covariance campaign measurements. Theor. Appl. Climatol. 2001, 70, 203–213. [Google Scholar] [CrossRef]
  35. Bao, T.; Xu, X.; Jia, G.; Billesbach, D.P.; Sullivan, R.C. Much stronger tundra methane emissions during autumn freeze than spring thaw. Glob. Chang. Biol. 2020, 27, 376–387. [Google Scholar] [CrossRef]
  36. Chen, H.; Liu, X.; Xue, D.; Zhu, D.; Zhan, W.; Li, W.; Wu, N.; Yang, G. Methane emissions during different freezing-thawing periods from a fen on the Qinghai-Tibetan Plateau: Four years of measurements. Agric. For. Meteorol. 2021, 297, 108279. [Google Scholar] [CrossRef]
  37. Mastepanov, M.; Sigsgaard, C.; Dlugokencky, E.J.; Houweling, S.; Ström, L.; Tamstorf, M.; Christensen, T.R. Large tundra methane burst during onset of freezing. Nature 2008, 456, 628–630. [Google Scholar] [CrossRef] [PubMed] [Green Version]
  38. Tagesson, T.; Mölder, M.; Mastepanov, M.; Sigsgaard, C.; Taster, M.P.; Lund, M.; Falk, J.M.; Lindroth, A.; Christensen, T.R.; Ström, L. Land-atmosphere exchange of methane from soil thawing to soil freezing in a high-Arctic wet tundra ecosystem. Glob. Chang. Biol. 2012, 18, 1928–1940. [Google Scholar] [CrossRef] [Green Version]
Figure 1. Location for field experiments chosen in a field at the junction of the cities of Nakhobino and Krasnogorsk in the Moscow region, Russia (55°51′44.3″ N 37°11′21.3″ E) (Google Earth snapshot of territory adjacent to the city of Nakhobino).
Energies 15 02693 g001
Figure 2. Experimental equipment: (a) Kometa-M-4 gas measuring device; (b) connecting pipe, 1—Camozzi quick disassembly devices, 2—dust and moisture filter, 3—MBS hose; (c) experimental probe for measuring gas on Earth’s surface, 1—pipe, 2—gas isolation tank; (d) experimental probe used for measurements of gas inside soil, 1—pipe, 2—gas leakproof layer 2, 3—gas leakproof layer 1, 4—dust and moisture filter; (e) soil drill, 20 cm; (f) dome-shaped caps for measuring stored gas, 1—switchable vent, 2—dome-shaped caps.
Energies 15 02693 g002
Figure 3. Change in concentrations of CO2 (%) and CH4 (mg/m3) in air, at soil surface, and in soil at different test points with temperature (Tmax/°C, highest temperature of the day; Tmin/°C, lowest temperature of the day). temperature analysis data were taken from the Russian Federal Service for Hydrometeorology and Environmental Monitoring, Roshydromet.
Energies 15 02693 g003
Figure 4. Gas transport mechanism comparison during entire freezing process. (a) Permafrost table [32,33,37,38]. (b,c) Wihout permafrost underneath: ours.
Energies 15 02693 g004
Table 1. Concentrations of methane and carbon dioxide in the air, on the surface of Earth, and in soil during cooling and after adding water.
Cooling Process—11 November 2020 (Soil is Not Frozen)
Point NumberCO2 Concentration,%
(Dry-Air)
CO2 Concentration,%
(Dry-Surface)
CO2 Concentration,% (Dry-Ground)CH4 Concentration, mg/m3 (Dry-Air)CH4 Concentration, mg/m3
(Dry-Surface)
CH4 Concentration, mg/m3 (Dry-Ground)CO2 Concentration,% (Wet-Air)CO2 Concentration,% (Wet-Surface)CO2 Concentration,% (Wet-Ground)CH4 Concentration, mg/m3 (Wet-Air)CH4 Concentration, mg/m3 (Wet-Surface)CH4 Concentration, mg/m3 (Wet-Ground)
10.020.030.311.8326
20.030.030.061.671.8313
30.020.040.061.671.8319.750.020.050.111.923.2517.17
40.020.050.111.756.254.50.020.090.171.834.256.17
Each experiment was conducted 3 times at each point. Gas concentration in air was the most stable in all measurements, and gas concentration in soil and on soil surface was the maximum in all measurements. Experimental data in Table 2 and Table 3 were also through the same conditions.
Table 2. Concentration of methane and carbon dioxide in the air, on soil surface, and in soil during freezing process.
Freezing Process—28 November 2020 (Soil Begins to Freeze; Depth of Freezing, 3 cm; Snow Thickness, 2–4 cm)
Point NumberCO2 Concentration,%
(Air)
CO2 Concentration,%
(Surface)
CO2 Concentration,%
(Ground)
CH4 Concentration, mg/m3
(Air)
CH4 Concentration, mg/m3
(Surface)
CH4 Concentration, mg/m3
(Ground)
CO2 Concentration,%
(in Bottle)
CH4 Concentration, mg/m3
(in Bottle)
10.020.040.232.333.7525.42
20.020.040.432.422.5861.17
30.020.050.232.172.4234.420.1778.42
40.020.110.132.082.587.750.12750.00
Table 3. Concentration of methane and carbon dioxide in the air, on soil surface, and in soil with intensification of freezing process, state of freezing, and state of high snow cover.
ProcessPoint NumberCO2 Concentration,%
(Air)
CO2 Concentration,%
(Surface)
CO2 Concentration,%
(Ground)
CH4 Concentration, mg/m3
(Air)
CH4 Concentration, mg/m3
(Surface)
CH4 Concentration, mg/m3
(Ground)
Process was stronger than freezing—10 December 2020 (depth of soil freezing 3–5 cm, snow thickness 7–10 cm)10.020.050.091.752.25113
20.030.060.521.922.42750
30.030.060.241.672.33540.33
40.040.060.111.922.0824.33
Freezing state—8 January 2021 (depth of soil freezing 0–4 cm, snow thickness 24–31 cm)10.040.860.751.421.7573.67
20.030.060.531.671.83477.25
30.031.100.371.672.42457
40.040.060.161.832.2519.08
Freezing state—22 February 2021 (depth of soil freezing 0 cm, snow thickness 41–80 cm)10.031.020.231.081.5844.75
20.030.050.152.086.42283.25
30.020.050.092.252.92242.33
40.020.060.132.082.673.58
Publisher’s Note: MDPI stays neutral with regard to jurisdictional claims in published maps and institutional affiliations.

