
Extraction of Time-Domain Characteristics and Selection of Effective Features Using Correlation Analysis to Increase the Accuracy of Petroleum Fluid Monitoring Systems

 , , ,
, , ,  ,
,  and
and
Abstract
1. Introduction
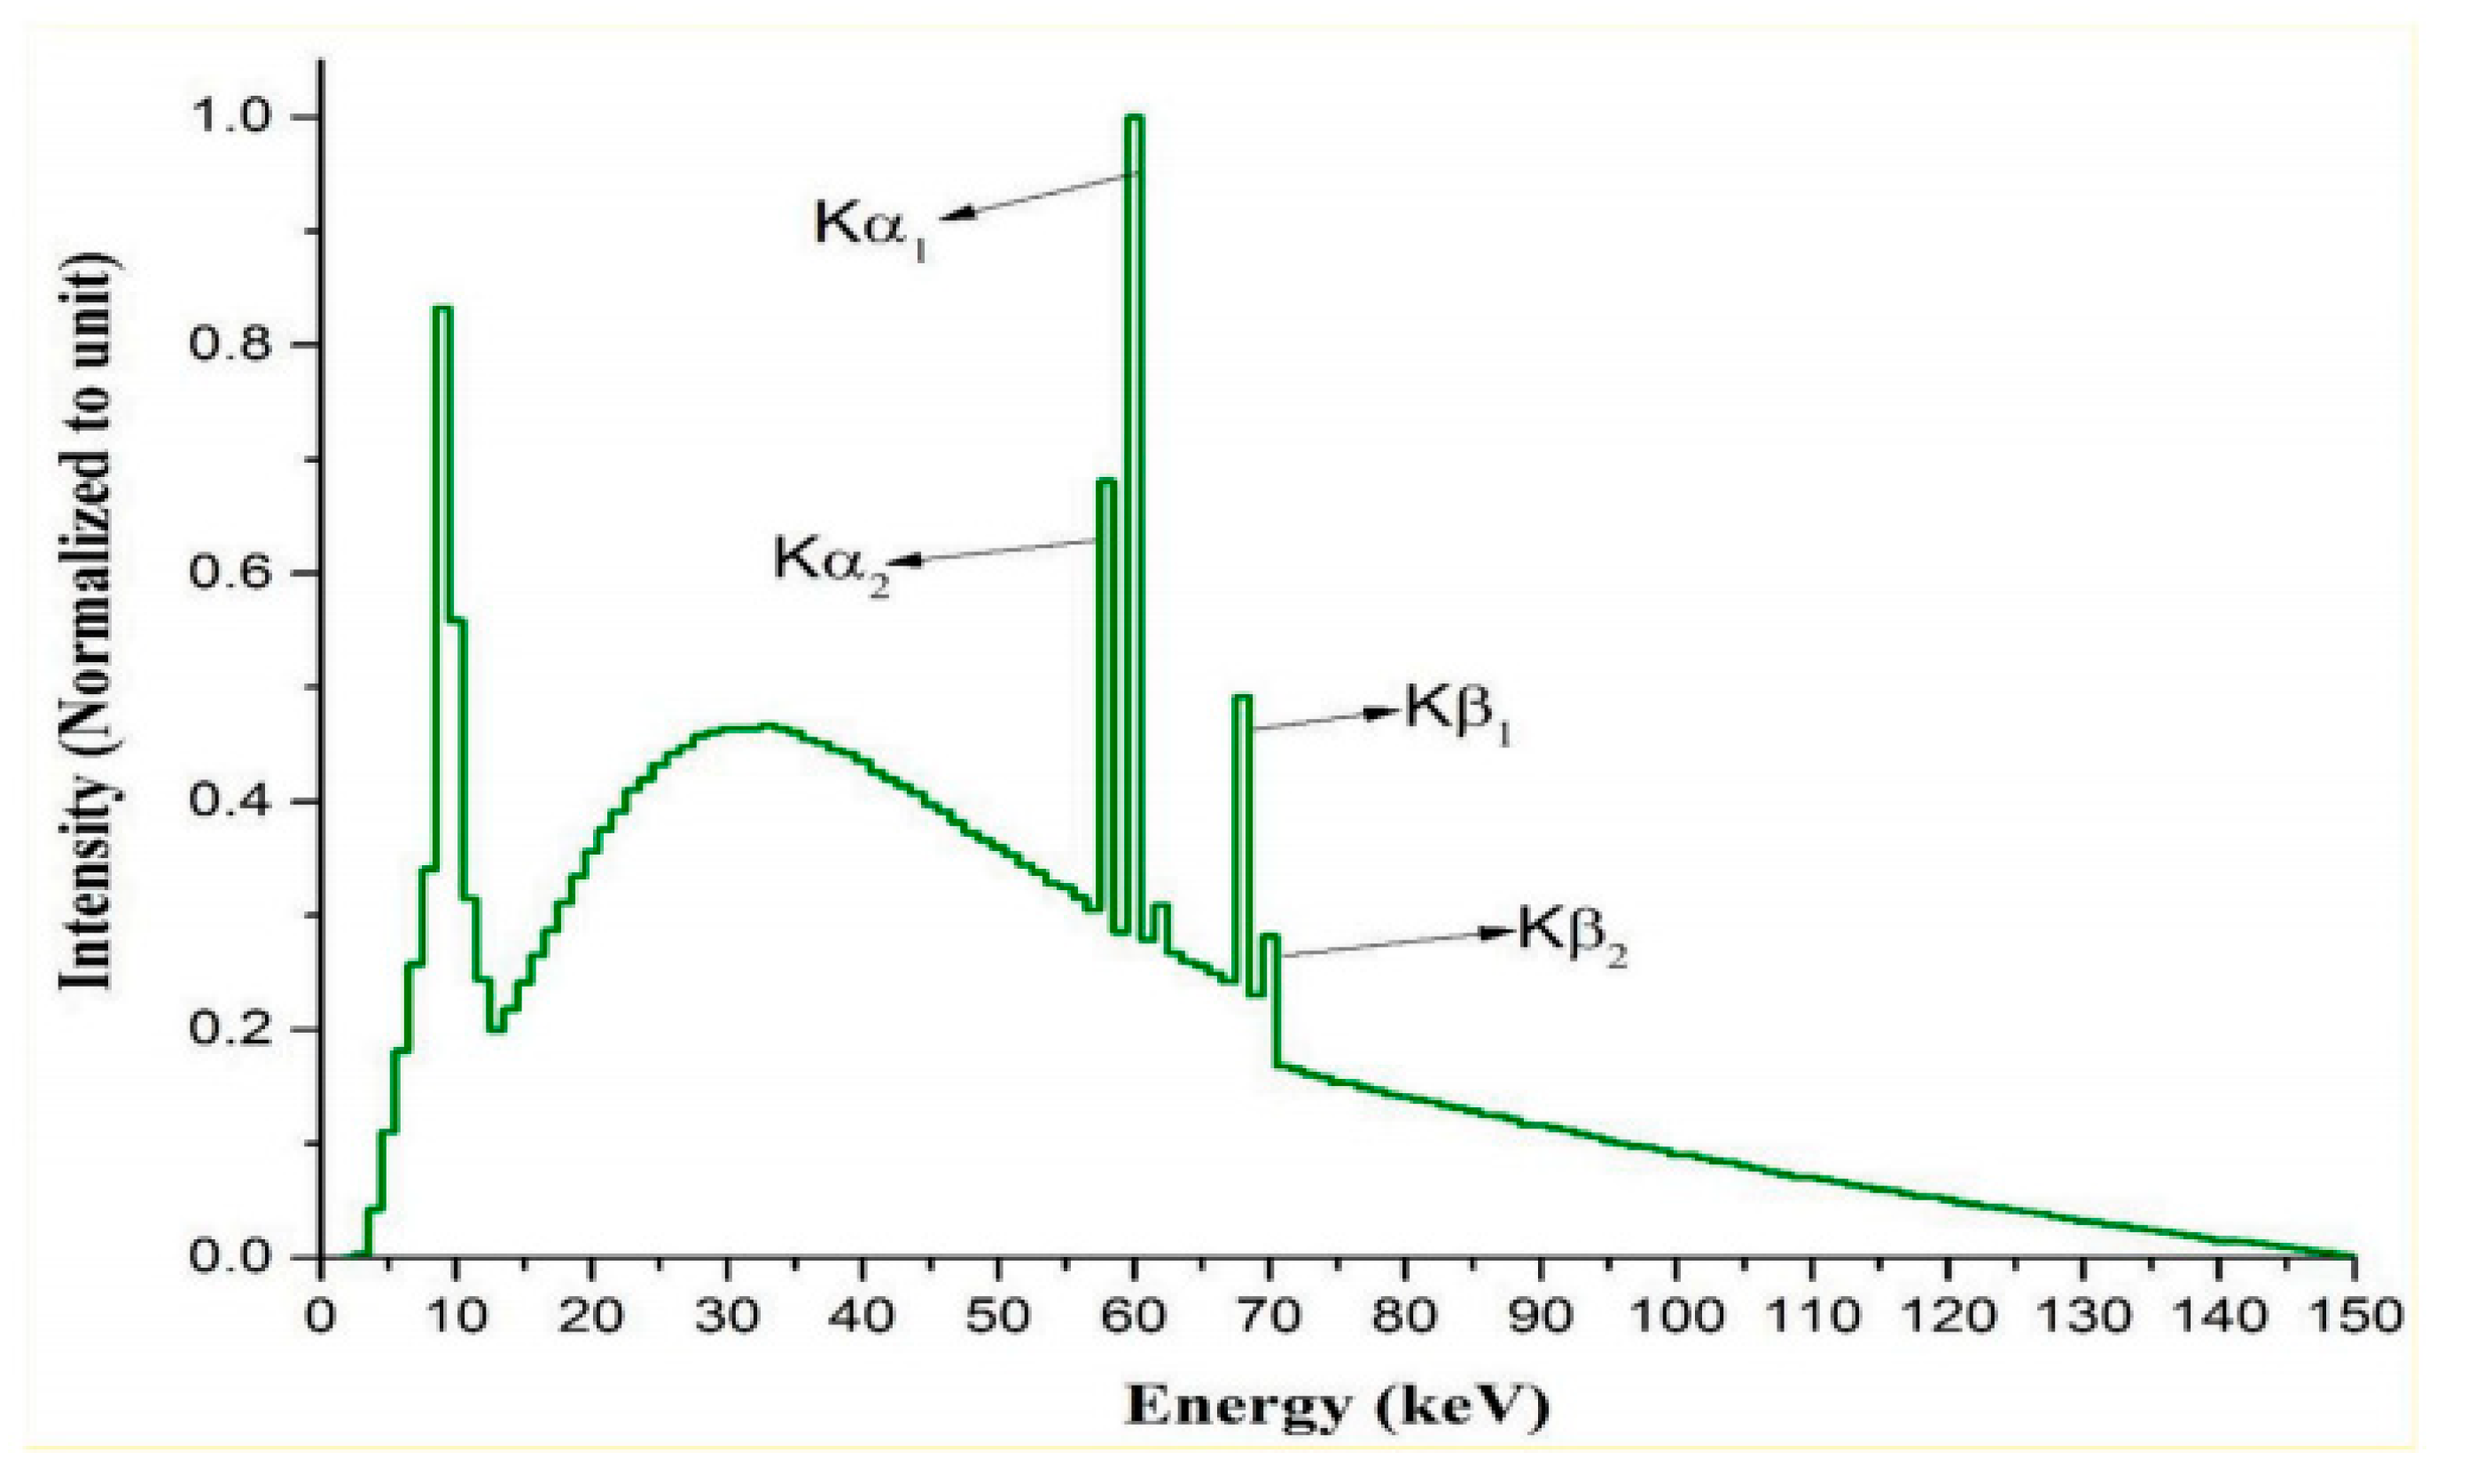
2. Simulation System
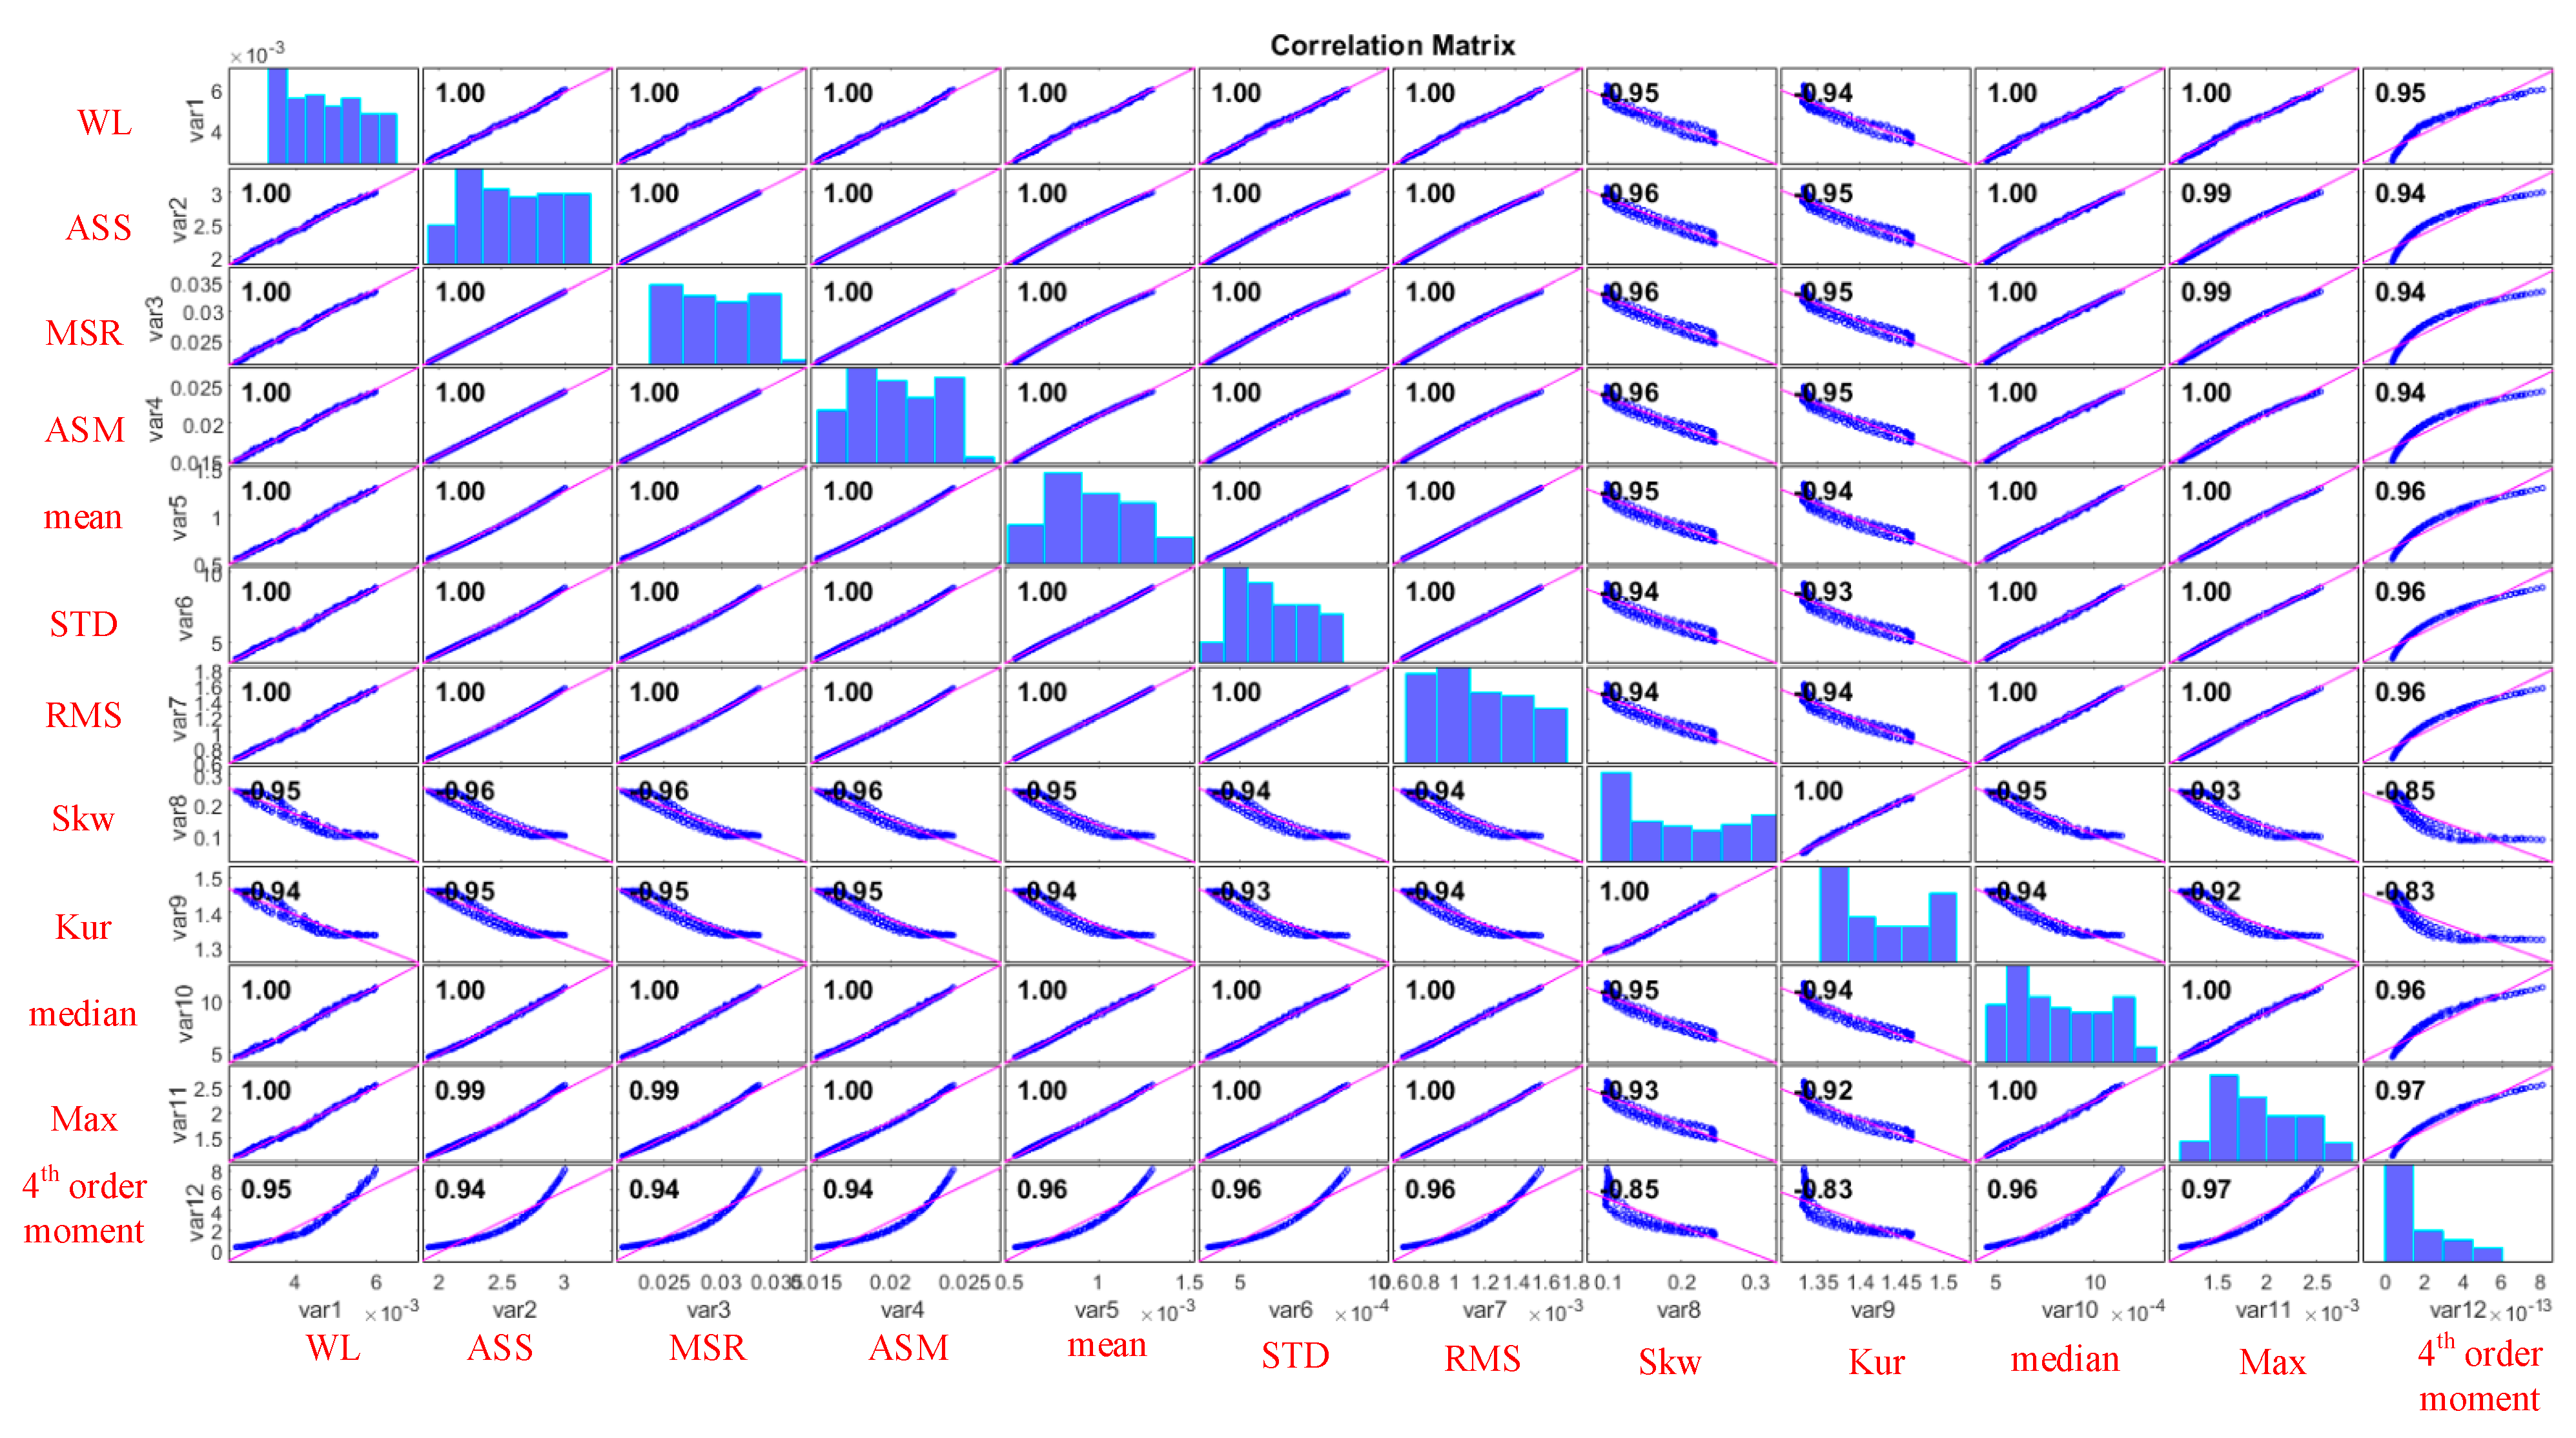
3. Feature Extraction
- Average value:
- Standard deviation:
- Fourth-order moment:
- Root mean square:
- Skewness:
- Kurtosis:
- Median:
- Waveform length (WL):
- Absolute value of the summation of square root (ASS):
- Mean value of the square root (MSR):
- Absolute value of the summation of the exp th root (ASM):
- Maximum value:
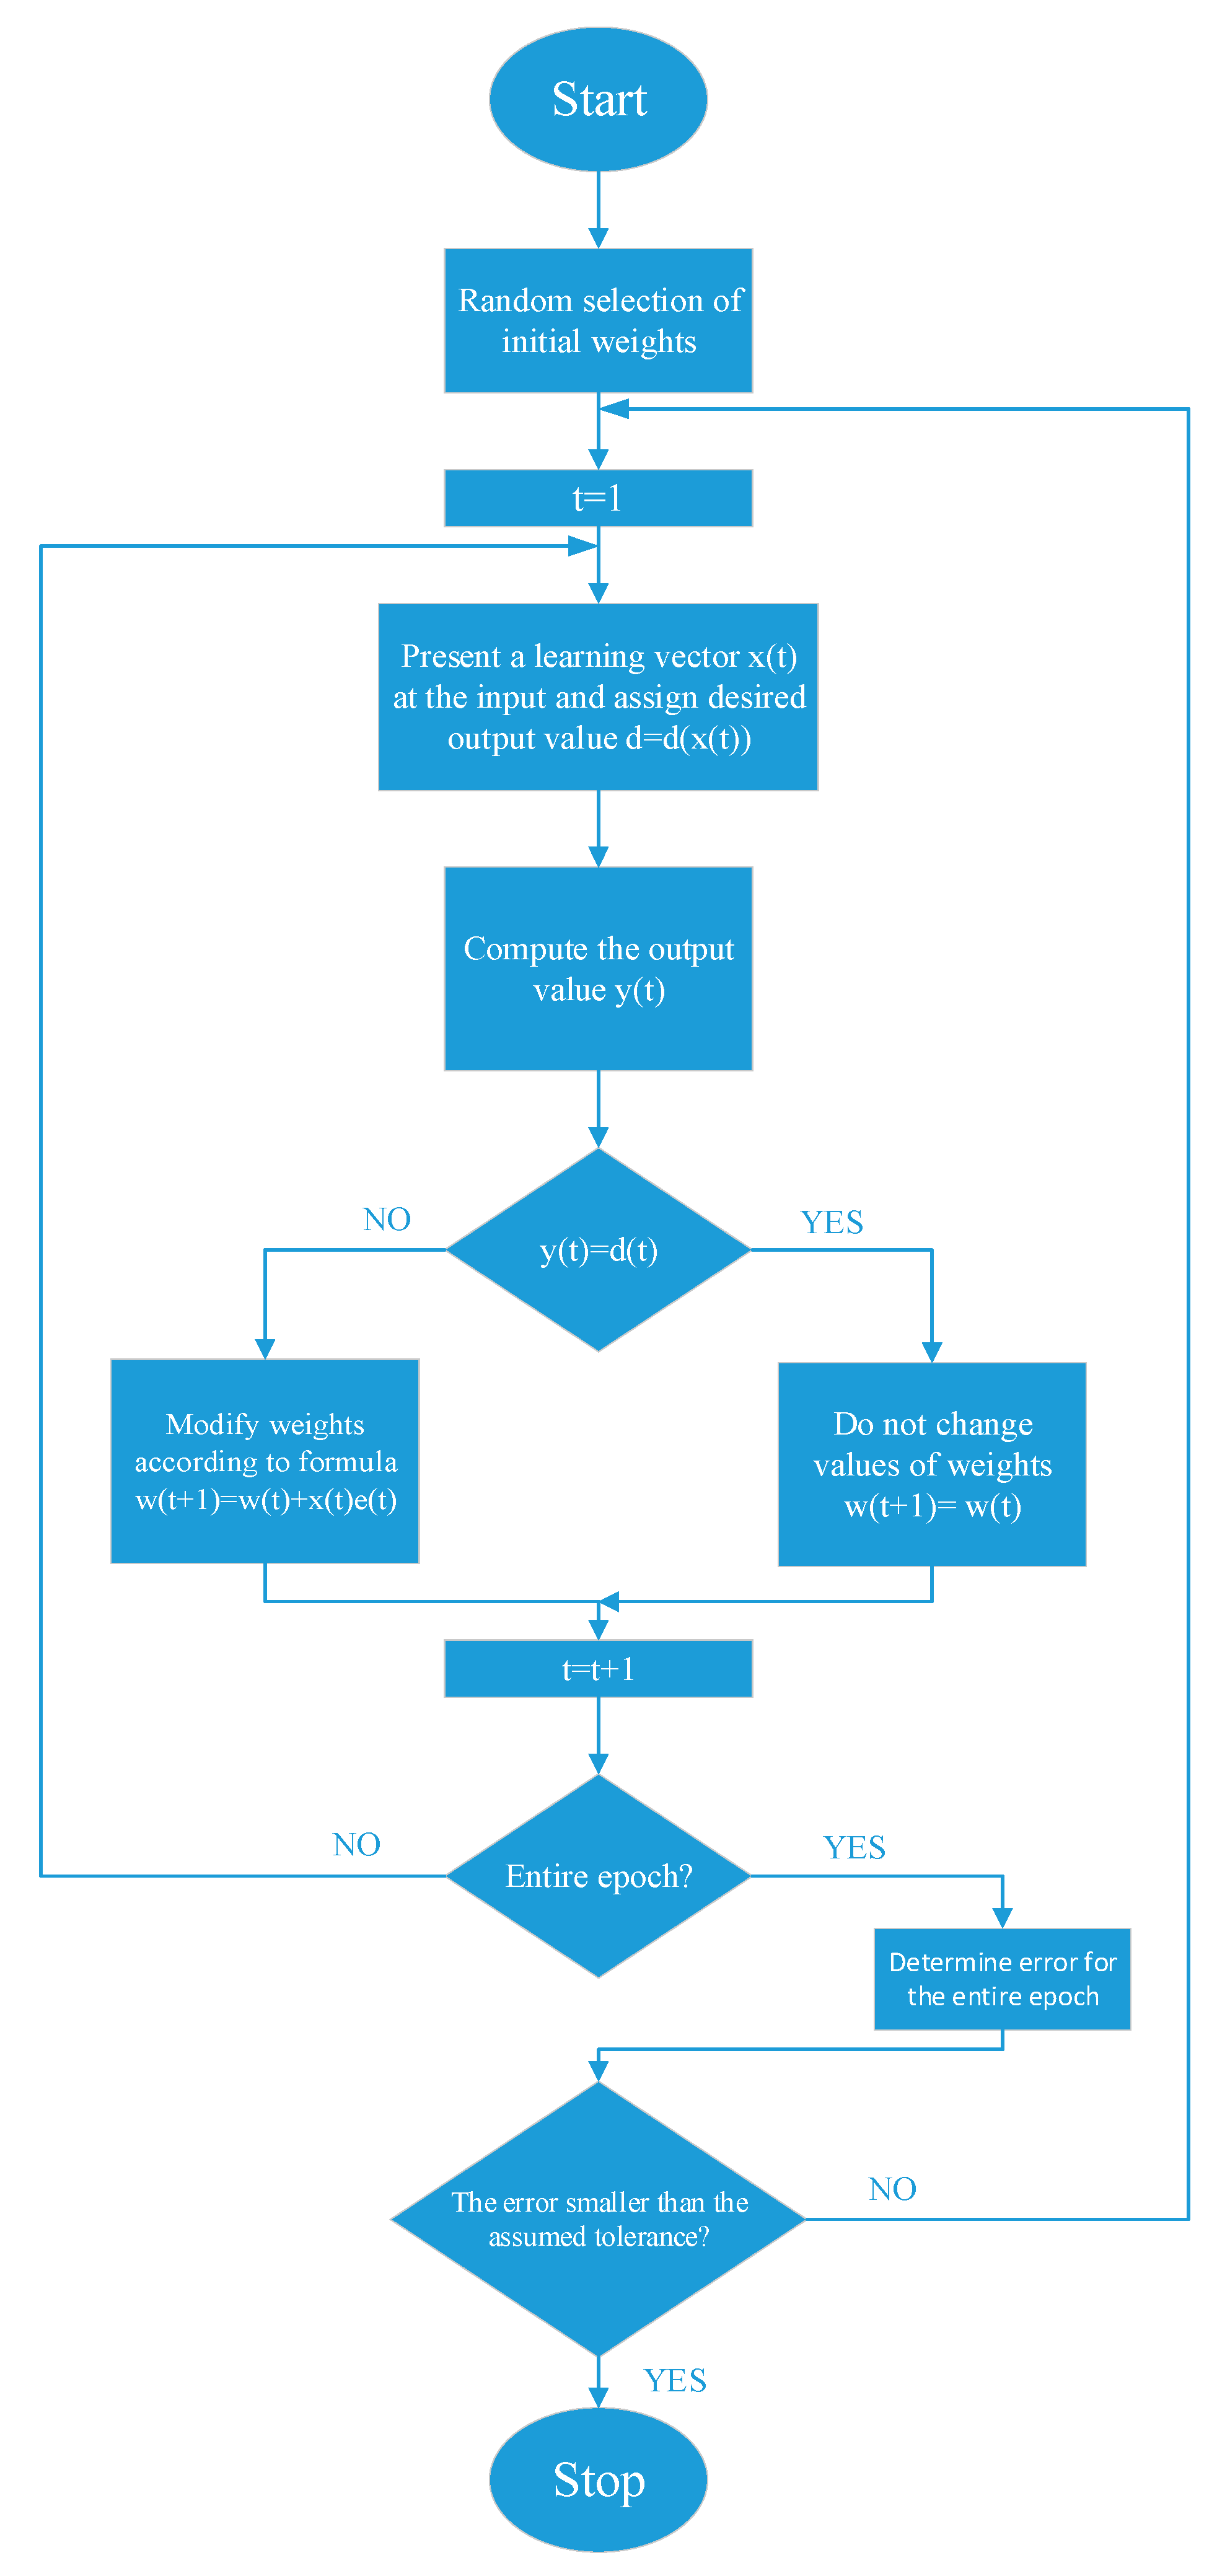
4. Artificial Neural Network
- Random values are attributed to weights.
- Perceptron is applied to each training sample. If the samples are evaluated incorrectly, the values of perceptron weights are corrected.
- Is all the training properly evaluated?
- Yes, the end of the algorithm.
- No, back to step 2.
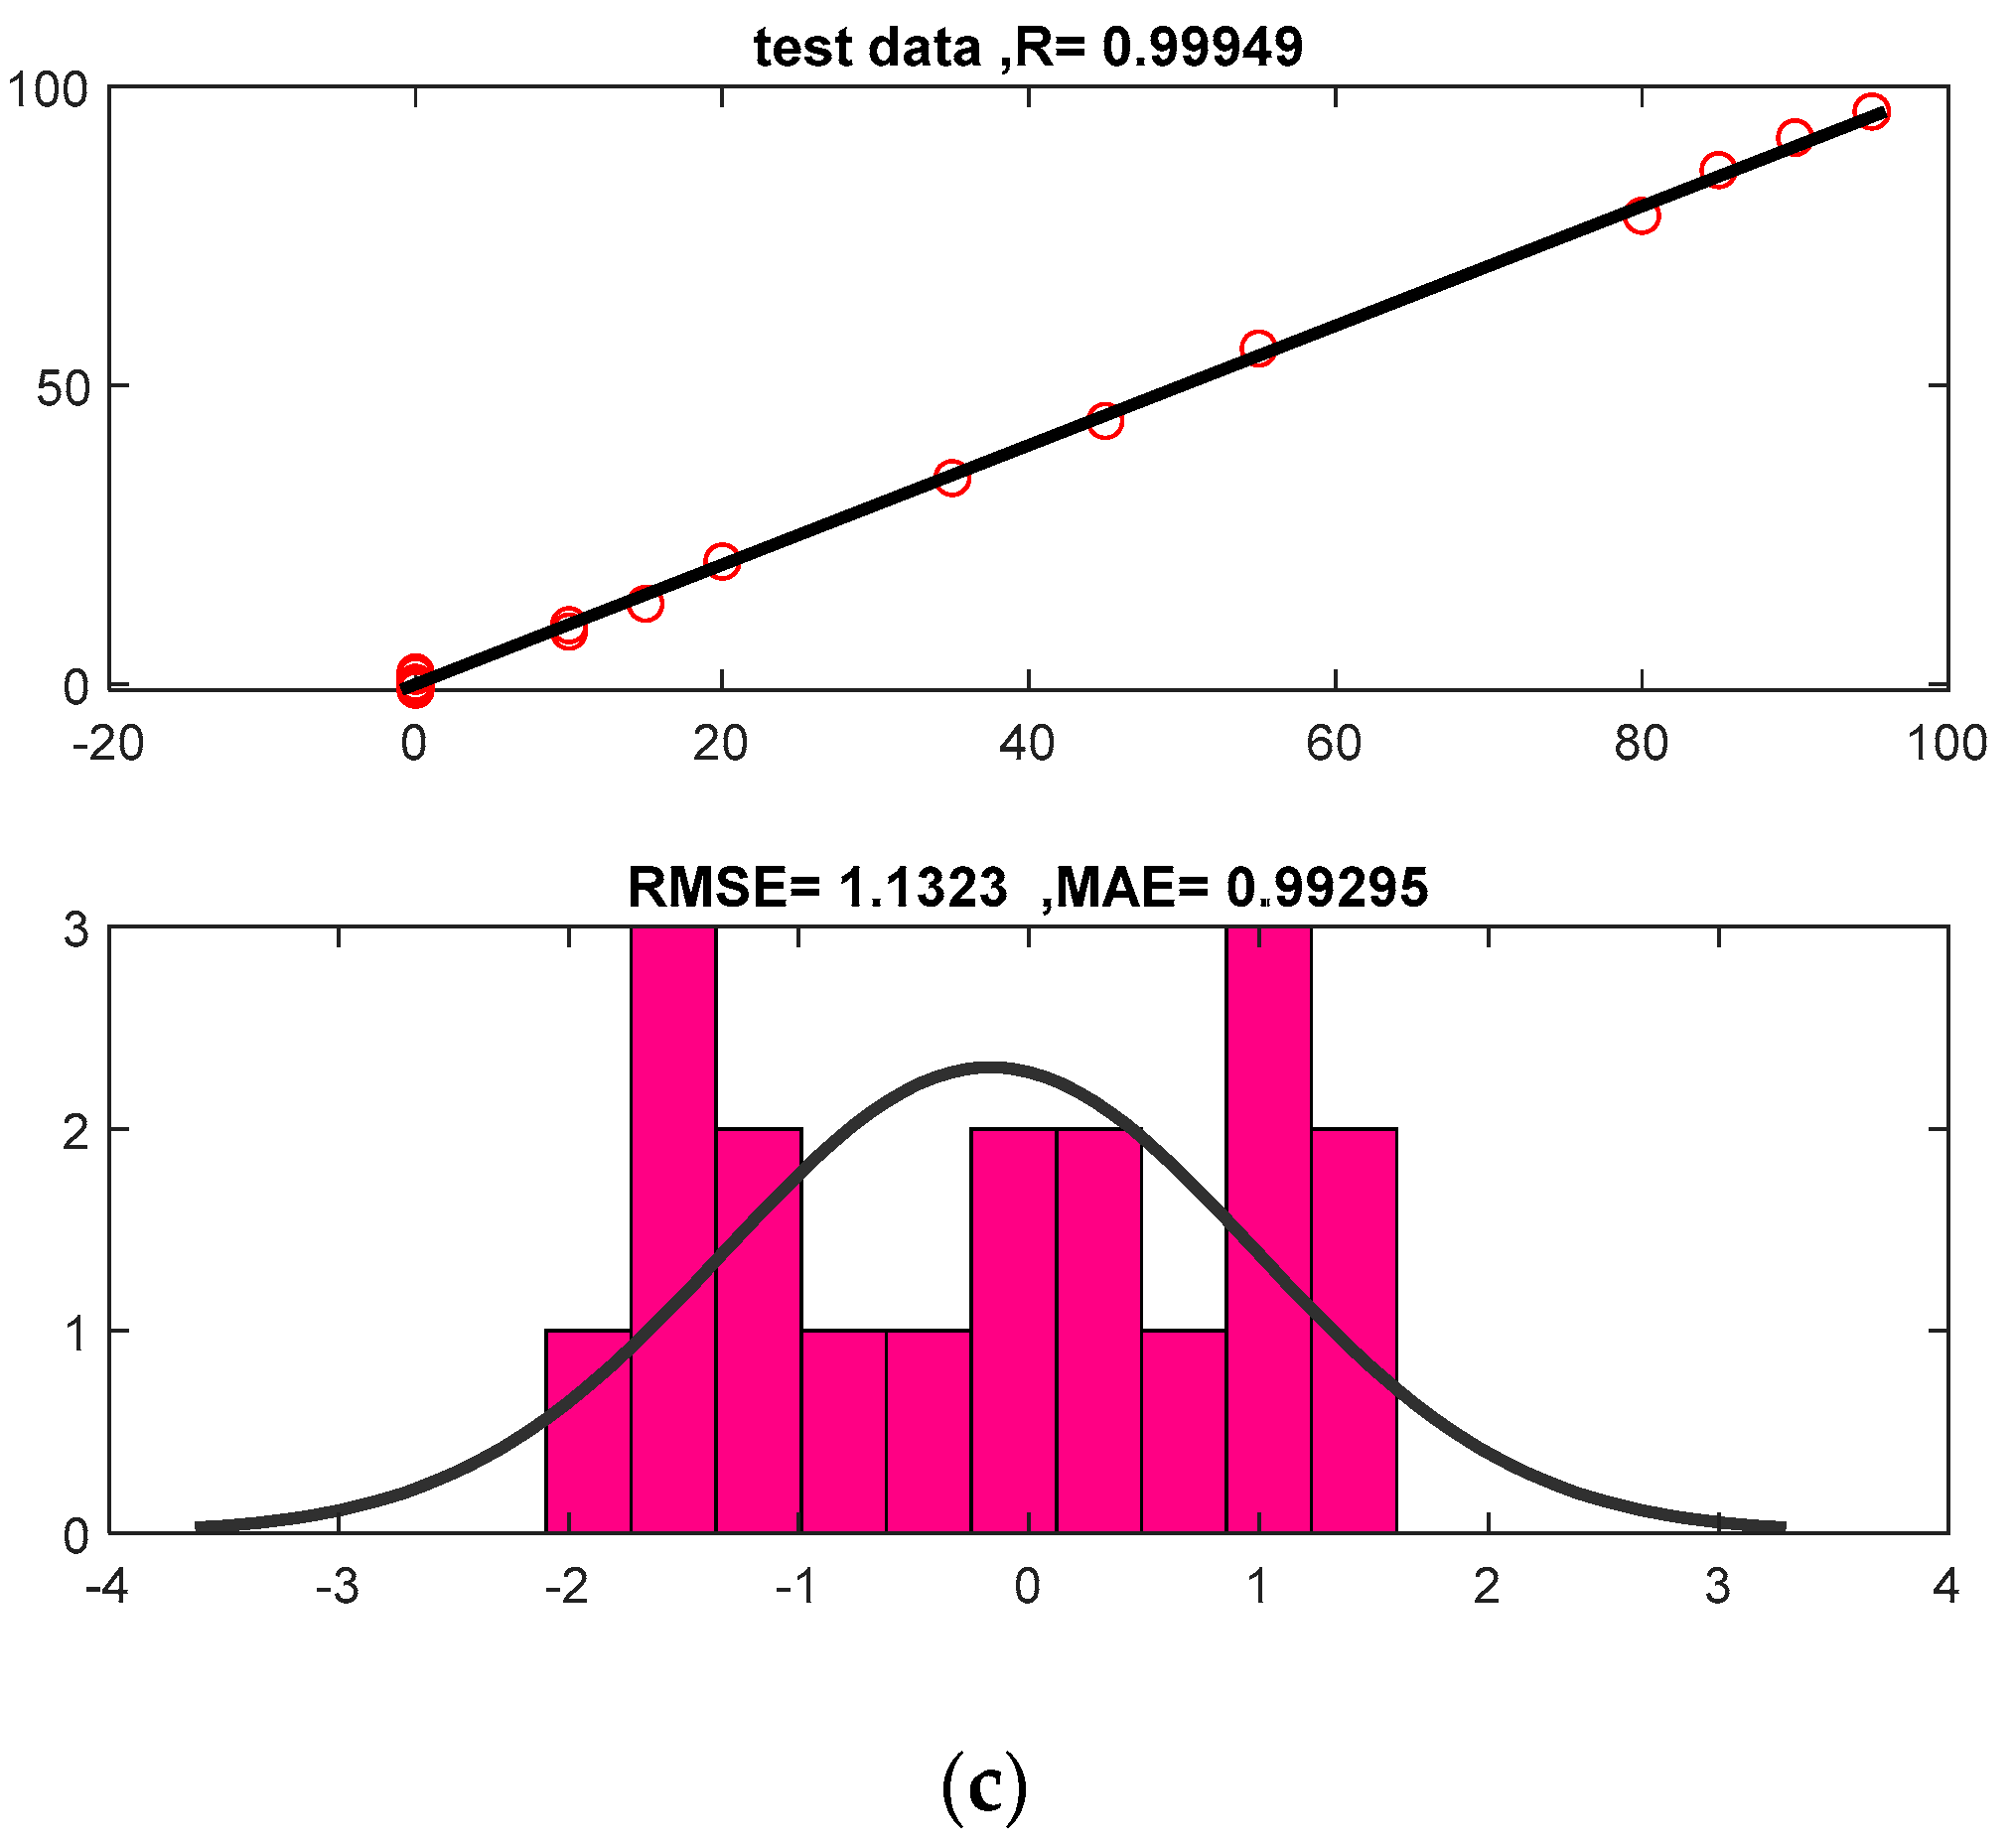
5. Results Verification
6. Discussion
7. Conclusions
Author Contributions
Funding
Institutional Review Board Statement
Informed Consent Statement
Data Availability Statement
Conflicts of Interest
References
- Salgado, C.M.; Brandão, L.E.B.; Conti, C.C.; Salgado, W.L. Density prediction for petroleum and derivatives by gamma-ray attenuation and artificial neural networks. Appl. Radiat. Isot. 2016, 116, 143–149. [Google Scholar] [CrossRef] [PubMed]
- Salgado, W.L.; Dam, R.S.; Barbosa, C.M.; da Silva, A.X.; Salgado, C.M. Monitoring system of oil by-products interface in pipelines using the gamma radiation attenuation. Appl. Radiat. Isot. 2020, 160, 109125. [Google Scholar] [CrossRef] [PubMed]
- Åbro, E.; Johansen, G.A. Improved void fraction determination by means of multibeam gamma-ray attenuation measurements. Flow Meas. Instrum. 1999, 10, 99–108. [Google Scholar] [CrossRef]
- Nazemi, E.; Feghhi, S.A.H.; Roshani, G.H.; Peyvandi, R.G.; Setayeshi, S. Precise Void Fraction Measurement in Two-phase Flows Independent of the Flow Regime Using Gamma-ray Attenuation. Nucl. Eng. Technol. 2016, 48, 64–71. [Google Scholar] [CrossRef]
- Roshani, G.; Nazemi, E.; Feghhi, S. Investigation of using 60 Co source and one detector for determining the flow regime and void fraction in gas–liquid two-phase flows. Flow Meas. Instrum. 2016, 50, 73–79. [Google Scholar] [CrossRef]
- Chunguo, J.; Qiuguo, B. Flow regime identification of gas/liquid two-phase flow in vertical pipe using RBF neural networks. In Proceedings of the 2009 Chinese Control and Decision Conference, Guilin, China, 17–19 June 2009; pp. 5143–5147. [Google Scholar] [CrossRef]
- Peyvandi, R.G.; Rad, S.Z.I. Application of artificial neural networks for the prediction of volume fraction using spectra of gamma rays backscattered by three-phase flows. Eur. Phys. J. Plus 2017, 132, 511. [Google Scholar] [CrossRef]
- Roshani, G.H.; Nazemi, E.; Roshani, M.M. Intelligent recognition of gas-oil-water three-phase flow regime and deter-mination of volume fraction using radial basis function. Flow Meas. Instrum. 2017, 54, 39–45. [Google Scholar] [CrossRef]
- Roshani, G.; Nazemi, E.; Roshani, M. Identification of flow regime and estimation of volume fraction independent of liquid phase density in gas-liquid two-phase flow. Prog. Nucl. Energy 2017, 98, 29–37. [Google Scholar] [CrossRef]
- Roshani, G.H.; Nazemi, E.; Feghhi, S.A.; Setayeshi, S. Flow regime identification and void fraction prediction in two-phase flows based on gamma ray attenuation. Measurment 2015, 62, 25–32. [Google Scholar] [CrossRef]
- Nazemi, E.; Roshani, G.H.; Feghhi, S.A.H.; Setayeshi, S.; Zadeh, E.E.; Fatehi, A. Optimization of a method for identifying the flow regime and measuring void fraction in a broad beam gamma-ray attenuation technique. Int. J. Hydrogen Energy 2016, 41, 7438–7444. [Google Scholar] [CrossRef]
- Roshani, G.H.; Nazemi, E.; Shama, F.; Imani, M.A.; Mohammadi, S. Designing a simple ra-diometric system to predict void fraction percentage independent of flow pattern using radial basis function. Metrol. Meas. Syst. 2018, 25, 347–358. [Google Scholar]
- Roshani, G.H.; Karami, A.; Nazemi, E.; Shama, F. Volume fraction determination of the annular three-phase flow of gas-oil-water using adaptive neuro-fuzzy inference system. Comput. Appl. Math. 2018, 37, 4321–4341. [Google Scholar] [CrossRef]
- Roshani, G.; Karami, A.; Khazaei, A.; Olfateh, A.; Nazemi, E.; Omidi, M. Optimization of radioactive sources to achieve the highest precision in three-phase flow meters using Jaya algorithm. Appl. Radiat. Isot. 2018, 139, 256–265. [Google Scholar] [CrossRef]
- Roshani, M.; Sattari, M.A.; Ali, P.J.M.; Roshani, G.H.; Nazemi, B.; Corniani, E.; Nazemi, E. Application of GMDH neural network technique to improve measuring precision of a simplified photon attenuation based two-phase flowmeter. Flow Meas. Instrum. 2020, 75, 101804. [Google Scholar] [CrossRef]
- Hanus, R.; Zych, M.; Petryka, L.; Jaszczur, M.; Hanus, P. Signals features extraction in liquid-gas flow measurements using gamma densitometry. Part 1: Time domain. EPJ Web Conf. 2016, 114, 02035. [Google Scholar] [CrossRef]
- Sattari, M.A.; Roshani, G.H.; Hanus, R.; Nazemi, E. Applicability of time-domain fea-ture extraction methods and artificial intelligence in two-phase flow meters based on gamma-ray absorption technique. Measurement 2021, 168, 108474. [Google Scholar] [CrossRef]
- Cocchi, L.; Passaro, S.; Caratori Tontini, F.; Ventura, G. Volcanism in slab tear faults is larger than in island-arcs and back-arcs. Nat. Commun. 2017, 8, 1451. [Google Scholar] [CrossRef]
- Hosseini, S.; Roshani, G.; Setayeshi, S. Precise gamma based two-phase flow meter using frequency feature extraction and only one detector. Flow Meas. Instrum. 2020, 72, 101693. [Google Scholar] [CrossRef]
- Sattari, M.A.; Roshani, G.H.; Hanus, R. Improving the structure of two-phase flow meter using feature extraction and GMDH neural network. Radiat. Phys. Chem. 2020, 171, 108725. [Google Scholar] [CrossRef]
- Roshani, G.H.; Ali, P.J.M.; Mohammed, S.; Hanus, R.; Abdulkareem, L.; Alanezi, A.A.; Sattari, M.A.; Amiri, S.; Nazemi, E.; Eftekhari-Zadeh, E.; et al. Simulation Study of Utilizing X-ray Tube in Monitoring Systems of Liquid Petroleum Products. Processes 2021, 9, 828. [Google Scholar] [CrossRef]
- Basahel, A.; Sattari, M.; Taylan, O.; Nazemi, E. Application of Feature Extraction and Artificial Intelligence Techniques for Increasing the Accuracy of X-ray Radiation Based Two Phase Flow Meter. Mathematics 2021, 9, 1227. [Google Scholar] [CrossRef]
- Alamoudi, M.; Sattari, M.; Balubaid, M.; Eftekhari-Zadeh, E.; Nazemi, E.; Taylan, O.; Kalmoun, E. Application of Gamma Attenuation Technique and Artificial Intelligence to Detect Scale Thickness in Pipelines in Which Two-Phase Flows with Different Flow Regimes and Void Fractions Exist. Symmetry 2021, 13, 1198. [Google Scholar] [CrossRef]
- Taylan, O.; Sattari, M.A.; Essoussi, I.E.; Nazemi, E. Frequency Domain Feature Extraction Investigation to Increase the Accuracy of an Intelligent Nondestructive System for Volume Fraction and Regime Determination of Gas-Water-Oil Three-Phase Flows. Mathematics 2021, 9, 2091. [Google Scholar] [CrossRef]
- Roshani, M.; Phan, G.; Roshani, G.H.; Hanus, R.; Nazemi, B.; Corniani, E.; Nazemi, E. Combination of X-ray tube and GMDH neural network as a nondestructive and potential technique for measuring characteristics of gas-oil–water three phase flows. Measurement 2021, 168, 108427. [Google Scholar] [CrossRef]
- Meric, I.; Johansen, G.A.; Mattingly, J.; Gardner, R. On the ill-conditioning of the multiphase flow measurement by prompt gamma-ray neutron activation analysis. Radiat. Phys. Chem. 2014, 95, 401–404. [Google Scholar] [CrossRef]
- Holstad, M.B.; A Johansen, G. Produced water characterization by dual modality gamma-ray measurements. Meas. Sci. Technol. 2005, 16, 1007–1013. [Google Scholar] [CrossRef]
- Pelowitz, D.B. MCNP-X TM User’s Manual, Version 2.5.0. LA-CP-05e0369; Los Alamos National Laboratory: Los Alamos, NM, USA, 2005. [Google Scholar]
- Hernandez, A.M.; Boone, J.M. Tungsten anode spectral model using interpolating cubic splines: Unfiltered X-ray spectra from 20 kV to 640 kV. Med. Phys. 2014, 41, 042101. [Google Scholar] [CrossRef]
- Rodriguez-Ibarra, J.L.; Hernandez-Adame, P.L.; Vega-Carrillo, H.R.; Rivera, T. X-ray spectra and doses. Appl. Radiat. Isot. 2016, 117, 32–35. [Google Scholar] [CrossRef]
- Poludniowski, G.; Landry, G.; Deblois, F.; Evans, P.M.; Verhaegen, F. SpekCalc: A program to calculate photon spectra from tungsten anode X-ray tubes. Phys. Med. Biol. 2009, 54, N433. [Google Scholar] [CrossRef]
- Aleksandrov, A.N. Simulating the formation of wax deposits in wells using electric submersible pumps. In Advances in Raw Material Industries for Sustainable Development Goals; CRC Press: London, UK, 2021; pp. 283–295. [Google Scholar]
- Wang, Q.; Zhao, X.; Zhang, J.; Zhang, P.; Wang, X.; Yang, C.; Wang, J.; Wu, Z. Research on Quality Characterization Method of Micro-Injection Products Based on Cavity Pressure. Polymers 2021, 13, 2755. [Google Scholar] [CrossRef]
- Roth, B.; Drummer, D. Pressure Equilibrium Time of a Cyclic-Olefin Copolymer. Polymers 2021, 13, 2309. [Google Scholar] [CrossRef] [PubMed]
- Khounani, Z.; Hosseinzadeh-Bandbafha, H.; Nazemi, F.; Shaeifi, M.; Karimi, K.; Tabatabaei, M.; Aghbashlo, M.; Lam, S.S. Exergy analysis of a whole-crop safflower biorefinery: A step towards reducing agricultural wastes in a sustainable manner. J. Environ. Manag. 2020, 279, 111822. [Google Scholar] [CrossRef] [PubMed]
- Karpikov, A.V.; I Aliev, R.; Babyr, N.V. An analysis of the effectiveness of hydraulic fracturing at YS1 of the Northern field. IOP Conf. Ser. Mater. Sci. Eng. 2020, 952, 012036. [Google Scholar] [CrossRef]
- Prischepa, O.M.; Nefedov, Y.V.; Kochneva, O.E. Raw material base of hard-to-extract oil reserves of Russia. Matéria-prima base de reservas de óleo de difícil extração da Rússia. Period. Tche Quim. 2020, 17, 915–924. [Google Scholar]
- Choi, J.; Kim, Y. A Heterogeneous Learning Framework for Over-the-Top Consumer Analysis Reflecting the Actual Market Environment. Appl. Sci. 2021, 11, 4783. [Google Scholar] [CrossRef]
- Rožanec, J.; Kažič, B.; Škrjanc, M.; Fortuna, B.; Mladenić, D. Automotive OEM Demand Forecasting: A Comparative Study of Forecasting Algorithms and Strategies. Appl. Sci. 2021, 11, 6787. [Google Scholar] [CrossRef]
- Villaseñor, C.; Gallegos, A.A.; Lopez-Gonzalez, G.; Gomez-Avila, J.; Hernandez-Barragan, J.; Arana-Daniel, N. Ellipsoidal Path Planning for Unmanned Aerial Vehicles. Appl. Sci. 2021, 11, 7997. [Google Scholar] [CrossRef]
- Alhammad, N.; Al-Dossari, H. Dynamic Segmentation for Physical Activity Recognition Using a Single Wearable Sensor. Appl. Sci. 2021, 11, 2633. [Google Scholar] [CrossRef]
- Moradi, M.J.; Hariri-Ardebili, M.A. Developing a Library of Shear Walls Database and the Neural Network Based Predictive Meta-Model. Appl. Sci. 2019, 9, 2562. [Google Scholar] [CrossRef]
- Nazemi, B.; Rafiean, M. Forecasting house prices in Iran using GMDH. Int. J. Hous. Mark. Anal. 2020, 14, 555–568. [Google Scholar] [CrossRef]
- Nazemi, B.; Rafiean, M. Modelling the affecting factors of housing price using GMDH-type artificial neural networks in Isfahan city of Iran. Int. J. Hous. Mark. Anal. 2021, 15. [Google Scholar] [CrossRef]
- Karami, A.; Roshani, G.H.; Khazaei, A.; Nazemi, E.; Fallahi, M. Investigation of different sources in order to optimize the nuclear metering system of gas–oil–water annular flows. Neural Comput. Appl. 2018, 32, 3619–3631. [Google Scholar] [CrossRef]
- Alanazi, A.K.; Alizadeh, S.M.; Nurgalieva, K.S.; Guerrero, J.W.G.; Abo-Dief, H.M.; Eftekhari-Zadeh, E.; Nazemi, E.; Narozhnyy, I.M. Optimization of X-ray Tube Voltage to Improve the Precision of Two Phase Flow Meters Used in Petroleum Industry. Sustainability 2021, 13, 13622. [Google Scholar] [CrossRef]
- Golijanek-Jędrzejczyk, A.; Mrowiec, A.; Hanus, R.; Zych, M.; Heronimczak, M.; Świsulski, D. The assessment of metrological properties of segmental orifice based on simulations and experiments. Measurement 2021, 181, 109601. [Google Scholar] [CrossRef]
- Alanazi, A.K.; Alizadeh, S.M.; Nurgalieva, K.S.; Nesic, S.; Grimaldo Guerrero, J.W.; Abo-Dief, H.M.; Eftekhari-Zadeh, E.; Nazemi, E.; Narozhnyy, I.M. Application of Neural Network and Time-Domain Feature Extraction Techniques for Determining Volumetric Percentages and the Type of Two Phase Flow Regimes Independent of Scale Layer Thickness. Appl. Sci. 2022, 12, 1336. [Google Scholar] [CrossRef]
- Zych, M.; Petryka, L.; Kępiński, J.; Hanus, R.; Bujak, T.; Puskarczyk, E. Radioisotope investigations of compound two-phase flows in an open channel. Flow Meas. Instrum. 2014, 35, 11–15. [Google Scholar] [CrossRef]
- Roshani, M.; Phan, G.T.; Ali, P.J.M.; Roshani, G.H.; Hanus, R.; Duong, T.; Corniani, E.; Nazemi, E.; Kalmoun, E.M. Evalua-tion of flow pattern recognition and void fraction measurement in two phase flow independent of oil pipeline’s scale layer thickness. Alex. Eng. J. 2021, 60, 1955–1966. [Google Scholar] [CrossRef]
- Nguyen, V.T.; Rogachev, M.K.; Aleksandrov, A.N. A new approach to improving efficiency of gas-lift wells in the conditions of the formation of organic wax deposits in the Dragon field. J. Pet. Explor. Prod. Technol. 2020, 10, 3663–3672. [Google Scholar] [CrossRef]
- Dolgii, I.E. Methods to enhance oil recovery in the process of complex field development of the Yarega oil and titanium deposit. J. Min. Inst. 2017, 231, 263–297. [Google Scholar]
- Gabdrakhmanov, N.K.; Mingulov, S.G.; Strizhnev, V.A.; Karimov, R.D. Diagnostics of field pipelines as a means of improving the reliability of pipeline systems. J. Min. Inst. 2005, 164, 5. [Google Scholar]
- Sandyga, M.S.; Struchkov, I.A.; Rogachev, M.K. Formation damage induced by wax deposition: Laboratory investigations and modeling. J. Pet. Explor. Prod. Technol. 2020, 10, 2541–2558. [Google Scholar] [CrossRef]
- Sultanbekov, R. Research of the influence of marine residual fuel composition on sedimentation due to incompatibility. J. Mar. Sci. Eng. 2021, 9, 1067. [Google Scholar] [CrossRef]
- Kashnikov, Y.A.; Ashikhmin, S.; Kukhtinskii, A.; Shustov, D.V. The relationship of fracture toughness coefficients and geophysical characteristics of rocks of hydrocarbon deposits. J. Min. Inst. 2020, 241, 83. [Google Scholar] [CrossRef]
- Belonogov, E.V.; Korovin, A.Y.; Yakovlev, A.A. Increase of the injectivity coefficient by dynamic development of injection wells. J. Min. Inst. 2019, 1, 238. [Google Scholar]
- Grigorev, B.M.; Tananykhin, D.; Poroshin, A.M. Sand management approach for a field with high viscosity oil. J. Appl. Eng. Sci. 2020, 18, 64–69. [Google Scholar] [CrossRef][Green Version]
- Shagiakhmetov, A.M.; Podoprigora, D.G.; Terleev, A.V. The study of the dependence of the rheological properties of gel-forming compositions on the crack opening when modeling their flow on a rotational viscometer. Period. Tche Quim. 2020, 17, 933–939. [Google Scholar]
- Galkin, S.V.; Kochnev, A.A.; Zotikov, V.I. Predictive assessment of the effectiveness of radial drilling technology for the Bashkir production facilities of the Perm Territory fields. J. Min. Inst. 2019, 1, 238. [Google Scholar]
- Molchanov, A.A.; Ageev, P.G. Implementation of new technologies is a reliable way of extracting residual reserves of hydro-carbon deposits. J. Min. Inst. 2017, 1, 227. [Google Scholar]
- Morenov, V.; Leusheva, E.; Martel, A. Investigation of the Fractional Composition Effect of the Carbonate Weighting Agents on the Rheology of the Clayless Drilling Mud. Int. J. Eng. 2018, 31. [Google Scholar] [CrossRef]
- Nikitin, M.; Saychenko, L. The rheological properties of abnormally viscous oil. Pet. Sci. Technol. 2017, 36, 136–140. [Google Scholar] [CrossRef]
- Ruiz-Morales, B.; Espitia-Moreno, I.; Alfaro-Garcia, V.; Leon-Castro, E. Sustainable Development Goals Analysis with Ordered Weighted Average Operators. Sustainability 2021, 13, 5240. [Google Scholar] [CrossRef]
- Francik, S.; Knapczyk, A.; Knapczyk, A.; Francik, R. Decision Support System for the Production of Miscanthus and Willow Briquettes. Energies 2020, 13, 1364. [Google Scholar] [CrossRef]
- Taylor, J.G. Neural Networks and Their Applications; John Wiley & Sons Ltd.: Brighton, UK, 1996. [Google Scholar]
- Gallant, A.R.; White, H. On learning the derivatives of an unknown mapping with multilayer feedforward networks. Neural Netw. 1992, 5, 129–138. [Google Scholar] [CrossRef]
- Song, Y.-Q.; Zhao, T.-H.; Chu, Y.-M.; Zhang, X.-H. Optimal evaluation of a Toader-type mean by power mean. J. Inequal. Appl. 2015, 2015, 408. [Google Scholar] [CrossRef]
- Hu, S.; Wu, H.; Liang, X.; Xiao, C.; Zhao, Q.; Cao, Y.; Han, X. A preliminary study on the eco-environmental geological issue of in-situ oil shale mining by a physical model. Chemosphere 2021, 287, 131987. [Google Scholar] [CrossRef]
- Chu, Y.; Zhao, T.-H. Concavity of the error function with respect to Hölder means. Math. Inequal. Appl. 1998, 589–595. [Google Scholar] [CrossRef]
- Shen, Z.; Wang, F.; Wang, Z.; Li, J. A critical review of plant-based insulating fluids for transformer: 30-year development. Renew. Sustain. Energy Rev. 2021, 141, 110783. [Google Scholar] [CrossRef]
- Zhao, T.-H.; He, Z.-Y.; Chu, Y.-M. On some refinements for inequalities involving zero-balanced hypergeometric function. AIMS Math. 2020, 5, 6479–6495. [Google Scholar] [CrossRef]
- Cheng, H.; Sun, L.; Wang, Y.; Chen, X. Effects of actual loading waveforms on the fatigue behaviours of asphalt mixtures. Int. J. Fatigue 2021, 151, 106386. [Google Scholar] [CrossRef]
- Zhao, T.-H.; Wang, M.-K.; Chu, Y.-M. A sharp double inequality involving generalized complete elliptic integral of the first kind. AIMS Math. 2020, 5, 4512–4528. [Google Scholar] [CrossRef]
- Sun, J.; Wang, Y.; Liu, S.; Dehghani, A.; Xiang, X.; Wei, J.; Wang, X. Mechanical, chemical and hydrothermal activation for waste glass reinforced cement. Constr. Build. Mater. 2021, 301, 124361. [Google Scholar] [CrossRef]
- Jin, F.; Qian, Z.-S.; Chu, Y.-M.; Rahman, M.U. On nonlinear evolution model for drinking behavior under caputo-fabrizio derivative. J. Appl. Anal. Comput. 2020. [Google Scholar] [CrossRef]
- Iqbal, A.; Wang, Y.; Miah, M.; Osman, M.S. Study on Date–Jimbo–Kashiwara–Miwa Equation with Conformable Derivative Dependent on Time Parameter to Find the Exact Dynamic Wave Solutions. Fractal Fract. 2021, 6, 4. [Google Scholar] [CrossRef]
- Zhao, T.-H.; He, Z.-Y.; Chu, Y.-M. Sharp Bounds for the Weighted Hölder Mean of the Zero-Balanced Generalized Complete Elliptic Integrals. Comput. Methods Funct. Theory 2020, 21, 413–426. [Google Scholar] [CrossRef]
- He, Z.-Y.; Abbes, A.; Jahanshahi, H.; Alotaibi, N.D.; Wang, Y. Fractional-Order Discrete-Time SIR Epidemic Model with Vaccination: Chaos and Complexity. Mathematics 2022, 10, 165. [Google Scholar] [CrossRef]
- Chu, H.-H.; Zhao, T.-H.; Chu, Y.-M. Sharp bounds for the Toader mean of order 3 in terms of arithmetic, quadratic and contraharmonic means. Math. Slovaca 2020, 70, 1097–1112. [Google Scholar] [CrossRef]
- Zhao, T.-H.; Wang, M.-K.; Chu, Y. Concavity and bounds involving generalized elliptic integral of the first kind. J. Math. Inequal. 2007, 701–724. [Google Scholar] [CrossRef]
- Chu, Y.-M.; Zhao, T.-H. Convexity and concavity of the complete elliptic integrals with respect to Lehmer mean. J. Inequal. Appl. 2015, 2015, 396. [Google Scholar] [CrossRef]
- Chu, Y.-M.; Wang, H.; Zhao, T.-H. Sharp bounds for the Neuman mean in terms of the quadratic and second Seiffert means. J. Inequal. Appl. 2014, 2014, 299. [Google Scholar] [CrossRef]
- Sun, H.; Zhao, T.-H.; Chu, Y.; Liu, B. A note on the Neuman-Sándor mean. J. Math. Inequal. 2007, 8, 287–297. [Google Scholar] [CrossRef]
- Wang, M.-K.; Hong, M.-Y.; Xu, Y.-F.; Shen, Z.-H.; Chu, Y. Inequalities for generalized trigonometric and hyperbolic functions with one parameter. J. Math. Inequal. 2007, 14, 1–21. [Google Scholar] [CrossRef]
- Karthikeyan, K.; Karthikeyan, P.; Baskonus, H.M.; Venkatachalam, K.; Chu, Y. Almost sectorial operators on Ψ-Hilfer derivative fractional impulsive integro-differential equations. Math. Methods Appl. Sci. 2021. [Google Scholar] [CrossRef]
- Lalbakhsh, A.; Mohamadpour, G.; Roshani, S.; Ami, M.; Roshani, S.; Sayem, A.S.M.; Alibakhshikenari, M.; Koziel, S. Design of a Compact Planar Transmission Line for Miniaturized Rat-Race Coupler with Harmonics Suppression. IEEE Access 2021, 9, 129207–129217. [Google Scholar] [CrossRef]
- Roshani, S.; Koziel, S.; Roshani, S.; Jamshidi, M.B.; Parandin, F.; Szczepanski, S. Design of a Patch Power Divider with Simple Structure and Ultra-Broadband Harmonics Suppression. IEEE Access 2021, 9, 165734–165744. [Google Scholar] [CrossRef]
- Pirasteh, A.; Roshani, S.; Roshani, S. A modified class-F power amplifier with miniaturized harmonic control circuit. AEU Int. J. Electron. Commun. 2018, 97, 202–209. [Google Scholar] [CrossRef]
- Roshani, S.; Roshani, S.; Zarinitabar, A. A modified Wilkinson power divider with ultra harmonic suppression using open stubs and lowpass filters. Analog Integr. Circuits Signal Process. 2018, 98, 395–399. [Google Scholar] [CrossRef]
- Roshani, S.; Roshani, S. Design of a very compact and sharp bandpass diplexer with bended lines for GSM and LTE applications. AEU Int. J. Electron. Commun. 2018, 99, 354–360. [Google Scholar] [CrossRef]
- Pirasteh, A.; Roshani, S.; Roshani, S. Compact microstrip lowpass filter with ultrasharp response using a square-loaded modified T-shaped resonator. Turk. J. Electr. Eng. Comput. Sci. 2018, 26, 1736–1746. [Google Scholar] [CrossRef]
- Roshani, S.; Roshani, S. Design of a compact LPF and a miniaturized Wilkinson power divider using aperiodic stubs with harmonic suppression for wireless applications. Wirel. Netw. 2019, 26, 1493–1501. [Google Scholar] [CrossRef]
- Heshmati, H.; Roshani, S. A miniaturized lowpass bandpass diplexer with high isolation. AEU Int. J. Electron. Commun. 2018, 87, 87–94. [Google Scholar] [CrossRef]
- Roshani, S. A compact microstrip low-pass filter with ultra wide stopband using compact microstrip resonant cells. Int. J. Microw. Wirel. Technol. 2016, 9, 1023–1027. [Google Scholar] [CrossRef]
- Jamshidi, M.; Siahkamari, H.; Roshani, S.; Roshani, S. A compact Gysel power divider design using U-shaped and T-shaped resonators with harmonics suppression. Electromagnetics 2019, 39, 491–504. [Google Scholar] [CrossRef]
- Jamshidi, M.B.; Roshani, S.; Talla, J.; Roshani, S.; Peroutka, Z. Size reduction and performance improvement of a microstrip Wilkinson power divider using a hybrid design technique. Sci. Rep. 2021, 11, 7773. [Google Scholar] [CrossRef]
- Roshani, S.; Roshani, S. Design of a high efficiency class-F power amplifier with large signal and small signal measurements. Measurement 2019, 149, 106991. [Google Scholar] [CrossRef]
- Hookari, M.; Roshani, S.; Roshani, S. High-efficiency balanced power amplifier using miniaturized harmonics suppressed coupler. Int. J. RF Microw. Comput. Eng. 2020, 30, e22252. [Google Scholar] [CrossRef]
- Roshani, S.; Roshani, S. Two-Section Impedance Transformer Design and Modeling for Power Amplifier Applications. Appl. Comput. Electromagn. Soc. J. 2017, 32, 1042–1047. [Google Scholar]
- Roshani, S.; Jamshidi, M.B.; Mohebi, F.; Roshani, S. Design and Modeling of a Compact Power Divider with Squared Resonators Using Artificial Intelligence. Wirel. Pers. Commun. 2020, 117, 2085–2096. [Google Scholar] [CrossRef]
- Roshani, S.; Roshani, S. A compact coupler design using meandered line compact microstrip resonant cell (MLCMRC) and bended lines. Wirel. Netw. 2020, 27, 677–684. [Google Scholar] [CrossRef]
- Pourbemany, J.; Zhu, Y.; Bettati, R. Breath to Pair (B2P): Respiration-Based Pairing Protocol for Wearable Devices. arXiv 2021, arXiv:2107.11677. [Google Scholar]
- Pourbemany, J.; Zhu, Y.; Bettati, R. A Survey of Wearable Devices Pairing Based on Biometric Signals. arXiv 2021, arXiv:2107.11685. [Google Scholar]
- Seaberg, J.; Kaabipour, S.; Hemmati, S.; Ramsey, J.D. A rapid millifluidic synthesis of tunable polymer-protein nanoparticles. Eur. J. Pharm. Biopharm. 2020, 154, 127–135. [Google Scholar] [CrossRef] [PubMed]
- Charchi, N.; Li, Y.; Huber, M.; Kwizera, E.A.; Huang, X.; Argyropoulos, C.; Hoang, T. Small mode volume plasmonic film-coupled nanostar resonators. Nanoscale Adv. 2020, 2, 2397–2403. [Google Scholar] [CrossRef] [PubMed]
- Rezaei, T.; Aslmarand, S.M.; Snyder, R.; Khajavi, B.; Alsing, P.M.; Fanto, M.; Miller, W.A. Experimental realization of Schumacher’s information geometric Bell inequality. Phys. Lett. A 2021, 405, 127444. [Google Scholar] [CrossRef]
- Kharazmi, O.; Jahangard, S. A new family of lifetime distributions in terms of cumulative hazard rate function. Commun. Fac. Sci. Univ. Ank. Ser. A1 Math. Stat. 2020, 69, 1–22. [Google Scholar] [CrossRef]
- Kharazmi, O.; Saadatinik, A.; Jahangard, S. Odd Hyperbolic Cosine Exponential-Exponential (OHC-EE) Distribution. Ann. Data Sci. 2019, 6, 765–785. [Google Scholar] [CrossRef]
- Sabzi, M.; Kamarei, M.; Haghighi, T.R.; Mahe, Y. Analysis and Design of X-Band LNA Using Parallel Technique. In Proceedings of the 2020 28th Iranian Conference on Electrical Engineering (ICEE), Tabriz, Iran, 4–6 August 2020; pp. 1–5. [Google Scholar] [CrossRef]
- Fatholahi, M.; Anvari, A.; Akbari, O.A.; Montazerifar, F.; Ghaedamini, H.; Toghraie, D.; Nouraei, S. Numerical investigation of mixed convection of nanofluid flow in oblique rectangular microchannels with nanofluid jet injection. Eur. Phys. J. Plus 2021, 136, 1–25. [Google Scholar] [CrossRef]
- Rastegarzadeh, S.; Mahzoon, M.; Mohammadi, H. A novel modular designing for multi-ring flywheel rotor to optimize energy consumption in light metro trains. Energy 2020, 206, 118092. [Google Scholar] [CrossRef]
- Sabzi, M.; Kamarei, M.; Razban, T.; Mahe, Y. Optimization of LNA’s first stage to reduce overall noise figure in multi-stage LNAs. AEU Int. J. Electron. Commun. 2020, 123, 153300. [Google Scholar] [CrossRef]
- Chapnevis, A.; Guvenc, I.; Bulut, E. Traffic Shifting based Resource Optimization in Aggregated IoT Communication. In Proceedings of the 2020 IEEE 45th Conference on Local Computer Networks (LCN), Sydney, NSW, Australia, 16–19 November 2020; pp. 233–243. [Google Scholar] [CrossRef]
- Mohaghegh, M.; Valipour, A.S. Triggering Economic Growth:Trade Liberalization as the Prominent Factor in Less-developed Countries. Bus. Econ. Res. 2021, 11, 252–265. [Google Scholar] [CrossRef]
- Gukeh, M.J.; Damoulakis, G.; Megaridis, C.M. Experimental investigation of low-profile heat pipe with wickless wettability-patterned condenser. In Proceedings of the 2021 20th IEEE Intersociety Conference on Thermal and Thermomechanical Phenomena in Electronic Systems (iTherm), San Diego, CA, USA, 1–4 June 2021; pp. 271–279. [Google Scholar]
- Jadidi, A.; Dizadji, M.R. Node Clustering in Binary Asymmetric Stochastic Block Model with Noisy Label Attributes via SDP. In Proceedings of the 2021 International Conference on Smart Applications, Communications and Networking (SmartNets), Glasgow, UK, 22–24 September 2021; pp. 1–6. [Google Scholar] [CrossRef]
- Azhiri, R.B.; Jadidi, A.; Bideskan, A.S.; Dizadji, M.R. Ultrasonic nanocrystalline surface modification of low strength aluminum alloy: Trade-off between surface integrity and production rate aiming at desired fatigue life. Int. J. Adv. Manuf. Technol. 2021, 113, 1237–1251. [Google Scholar] [CrossRef]
- Khalifehei, K.; Azizyan, G.; Shafai-Bajestan, M.; Chau, K.W. Experimental Modeling and Evaluation Sediment Scouring in Riverbeds around Downstream in Flip Buckets. Int. J. Eng. 2020, 33, 1904–1916. [Google Scholar] [CrossRef]
- Ghaedamini, H.; Amiri, M.C. Effects of temperature and surfactant concentration on the structure and morpholo-gy of calcium carbonate nanoparticles synthesized in a colloidal gas aphrons system. J. Mol. Liq. 2019, 282, 213–220. [Google Scholar] [CrossRef]
- Chireh, M.; Naseri, M.; Ghaedamini, H. Enhanced microwave absorption performance of graphene/doped Li fer-rite nanocomposites. Adv. Powder Technol. 2021, 32, 4697–4710. [Google Scholar] [CrossRef]
- Carrera, F.; Dentamaro, V.; Galantucci, S.; Iannacone, A.; Impedovo, D.; Pirlo, G. Combining Unsupervised Approaches for Near Real-Time Network Traffic Anomaly Detection. Appl. Sci. 2022, 12, 1759. [Google Scholar] [CrossRef]
- Sabzi, M. Analysis and Performance Improvement in High Frequency Wide-Band LNAs. Ph.D. Thesis, Université de Nantes, Nantes, France; Université de Téhéran, Téhéran, Iran, 2021. [Google Scholar]
- Walid, W.; Awais, M.; Ahmed, A.; Masera, G.; Martina, M. Real-time implementation of fast discriminative scale space tracking algorithm. J. Real-Time Image Process. 2021, 18, 2347–2360. [Google Scholar] [CrossRef]
- Shiri, A. A Novel Implementation of CORDIC Algorithm Based on Dynamic Microrotation Generation. Mapta J. Electr. Comput. Eng. MJECE 2021, 3, 17–27. [Google Scholar]


| ANN Kind | MLP | ||
|---|---|---|---|
| Ethylene Glycol | Gasoil | Crude Oil | |
| No. of neurons in input layer | 3 | 3 | 3 |
| No. of neurons in the 1st hidden layer | 24 | 20 | 15 |
| No. of neurons in the 2nd hidden layer | 11 | 12 | 5 |
| No. of neurons in the output layer | 1 | 1 | 1 |
| No. of epoch | 500 | 480 | 640 |
| Activation function used for each hidden neuron | Tansig | Tansig | Tansig |
| Train Data | Validation Data | Test Data | ||||
|---|---|---|---|---|---|---|
| RMSE | MAE | RMSE | MAE | RMSE | MAE | |
| Ethylene glycol | 0.91 | 0.68 | 1.16 | 1.03 | 1.13 | 0.99 |
| Crude oil | 0.27 | 0.14 | 0.94 | 0.76 | 1.07 | 0.86 |
| Gasoil | 0.21 | 0.15 | 1.21 | 1.06 | 1.03 | 0.89 |
Publisher’s Note: MDPI stays neutral with regard to jurisdictional claims in published maps and institutional affiliations. |
© 2022 by the authors. Licensee MDPI, Basel, Switzerland. This article is an open access article distributed under the terms and conditions of the Creative Commons Attribution (CC BY) license (https://creativecommons.org/licenses/by/4.0/).
Share and Cite
Mayet, A.M.; Alizadeh, S.M.; Nurgalieva, K.S.; Hanus, R.; Nazemi, E.; Narozhnyy, I.M. Extraction of Time-Domain Characteristics and Selection of Effective Features Using Correlation Analysis to Increase the Accuracy of Petroleum Fluid Monitoring Systems. Energies 2022, 15, 1986. https://doi.org/10.3390/en15061986
Mayet AM, Alizadeh SM, Nurgalieva KS, Hanus R, Nazemi E, Narozhnyy IM. Extraction of Time-Domain Characteristics and Selection of Effective Features Using Correlation Analysis to Increase the Accuracy of Petroleum Fluid Monitoring Systems. Energies. 2022; 15(6):1986. https://doi.org/10.3390/en15061986
Chicago/Turabian StyleMayet, Abdulilah Mohammad, Seyed Mehdi Alizadeh, Karina Shamilyevna Nurgalieva, Robert Hanus, Ehsan Nazemi, and Igor M. Narozhnyy. 2022. "Extraction of Time-Domain Characteristics and Selection of Effective Features Using Correlation Analysis to Increase the Accuracy of Petroleum Fluid Monitoring Systems" Energies 15, no. 6: 1986. https://doi.org/10.3390/en15061986
APA StyleMayet, A. M., Alizadeh, S. M., Nurgalieva, K. S., Hanus, R., Nazemi, E., & Narozhnyy, I. M. (2022). Extraction of Time-Domain Characteristics and Selection of Effective Features Using Correlation Analysis to Increase the Accuracy of Petroleum Fluid Monitoring Systems. Energies, 15(6), 1986. https://doi.org/10.3390/en15061986