Abstract
Different solar thermal collectors have been used recently to meet the thermal requirements of single effect and double effect vapor absorption cooling systems, making selection of the correct method a challenge. Different attributes of each vapor absorption cooling and solar collector combination are taken into account, and a Multi-Attribute Decision-Making model is used to select the best option. The model requires variables indicating the performance of the system, which are called attributes that are organized into a hierarchical structure called a tree of attributes. The dependent attributes finally end up in the basic attributes representing the input to the model. The technology options considered are flat plate water heating collectors with forced circulation, flat plate air heating collectors with forced circulation, evacuated tube collectors, parabolic trough collectors, and collectors with compound parabolic concentrator. Two types of cooling, namely single effect and double effect, are compared. Three climatic zones with three different cooling loads, ambient temperatures and solar radiation intensity have been considered. Comparison of the solar vapor absorption technologies with vapor compression technology is made considering the major performance factors. The major attributes, namely cost and emissions produced, are compared with conventional vapor compression methods.
1. Introduction
Increase in fuel prices, the energy crisis and environmental issues were the driving forces for development of vapor absorption refrigeration (VAR) technology. Commercial progress of vapor absorption refrigeration technology is affected by two major hurdles, namely large equipment volume and low coefficient of performance (COP). Vapor absorption cooling machines have a unique advantage over vapor compression refrigeration (VCR) machines from the energy perspective. A single unit is capable of managing a wide range of cooling loads. The operating capacity, temperature requirements and COP of VAR cooling systems vary according to the number of effects in the VAR cycle. Other advantages of VAR cooling systems are adaptability with low grade heating sources, environmentally friendly refrigerant usage, and longtime trouble-free operation [1]. Numerous research works are on the way to develop strategies to improve the COP of vapor absorption systems so as to make them economically competitive with vapor compression refrigeration systems [2]. Multiple-effect vapor absorption cycles demonstrated better energy performance compared with single effect system, but they require higher heat source temperatures and are complex with associated higher initial costs [3]. COP depends primarily on the generator temperature apart from the evaporator and condenser temperatures. Experimentally, it was determined that single effect, double effect and triple effect VAR cooling systems require average generator temperatures of 75 °C, 115 °C and 145 °C respectively with average COP values of 0.7, 1.2 and 1.6, respectively [4]. Single effect systems provided lower COP when temperatures were less than 60 °C [5]. In the parametric studies conducted over the temperature ranges of the condenser, absorber and evaporator, reduced generator temperature and higher ambient temperature resulted in considerably lower COP. Recent developments indicate that small and medium capacity systems worked better with Lithium Bromide/Water systems in which the latter is refrigerant and the former is the absorber. Ammonia/Water combination is preferred for vapor absorption systems of very large capacities [6]. A double-effect Lithium Bromide and Water absorption chiller based on solar parabolic trough collector was constructed and tested for determining the solar utilization efficiency in a hotel building and solar contribution of 61.98% is reported [7].
Solar thermal collectors are used to meet the thermal requirements of single effect and double effect VAR cooling systems [8]. Recent technological advances in solar thermal collection have resulted in efficiency improvements and higher temperature outputs. Solar thermal collectors used are the natural circulation and forced circulation water heating collectors, air heating collectors, evacuated tube collectors, cylindrical parabolic collectors, spherical parabolic collectors, and collectors with compound parabolic reflectors or Fresnel concentrators [9]. Solar water heating collectors were tested by connecting several such heaters in a series in order to obtain higher outlet temperatures and thus better performance [10]. A novel design procedure for simultaneously optimizing the various design variables of an indirect forced circulation solar water heating (SWH) system based on the life cycle cost using a genetic algorithm was developed, and cost reduction of 3.3% to 6.1% was reported [11]. The performance improvement was done by altering some of the design variables like the slope and mass flow rate, and the optimum number of collectors to be connected in series was identified. The efficiency of solar collectors improves with an increase in the mass flow rate of the working fluid. Evacuated tube collectors were experimented to determine the efficiency at solar radiation levels of 80 kW/m2 and 112.8 kW/m2 and it was found to have efficiencies of 45.3% and 32.9% respectively [12] indicating higher losses at increased solar radiation levels. Experiments were conducted during summer using evacuated glass tubes and collector performance for cooling a 27,778 W VAR system was tested with a collector area of 250 m2 with refrigerant R410A used in the evacuated tubes [13]. The cooling system used a storage tank and a supporting energy source with a heating furnace. Average tank temperature obtained in the storage tank was 78 °C. The average COP was 0.35. Wind flow resulted in substantial losses in efficiency even when the solar radiation levels were high. Parabolic trough or cylindrical parabolic collectors are low cost methods of concentrated solar power technology in which solar radiation is focused on a tube filled with heat transfer fluid. Temperatures attained by the fluid are more than 150 °C especially when tracking of the sun is done [14]. There is a substantial performance improvement with continuous tracking of sun but with associated cost escalation and auxiliary energy consumption. Higher temperatures can be achieved using evacuated tube solar collectors or concentration type collectors. Simulation studies of a 15 kW VAR system using evacuated tubes with 100% solar heat supply indicated a collector area requirement of 66 m2 and 62 m2 for air and water, respectively, as working fluids [15]. A VAR cooling system with serpentine type SWH collectors was used with collector area of 24 m2 with thermal energy storage. The system could be operated with 65% of the energy supplied from solar source [16].
As evident from the above studies, more than one solar collection technology can be used for operating VAR cooling systems in an efficient manner. A few studies have reported on comparison of two or three methods for a particular type of VAR cooling system. Flat plate collectors and evacuated tube collectors were compared for their technical performance, and the higher temperature and efficiency of the evacuated tube collector was established [17]. A multi-objective optimization for single effect, double effect and triple effect VAR cooling systems with three types of collectors, namely evacuated tube collectors (ETCs), evacuated flat plate collectors (EFPCs), and concentrating parabolic trough collectors (PTCs), was done to address the issue of technology assessment [18]. The study revealed that double-effect chillers have the best ranking in terms of energetic, economic and environmental performance. Decisions regarding the right choice of solar collection technology (SCT) must involve its temperature and heat output, area and cost requirement, as well as the associated environmental issues. Moreover, the cooling capacity range of the VAR cooling system impacts the size and techno-economics of the SCT. The feasibility of these technologies with due consideration of meeting temperature requirements, heat supply rate, cost, collector area, auxiliary power requirement and the consequent cooling performance of the VAR cooling system has not been reported.
Diverse attributes of each VAR-Solar collector combination are taken into account, and hence, a Multi-Attribute Decision-Making (MADM) process is used to consider different factors involved. This method is suitable for decision making especially when it involves imprecise numerical qualitative factors for consideration. These include uncertainty in material quality, material cost or labor cost occurring due to time or locational variations. The scope of the present study is divided into the following areas:
- Ranking VAR cooling systems that use solar thermal collectors for heat supply. This includes flat plate water heating collectors (forced circulation), flat plate air heating collectors (forced circulation), evacuated tube collectors, parabolic trough collectors and collector with compound parabolic concentrators. These collectors have different fluid outlet temperatures under different climate zones which affect the VAR cooling system performance. The cost factors of each type of solar collector varies, and this also affects the ranking.
- Conducting the study for single effect and double effect VAR cooling systems only. Because single effect and double effect methods have different temperature requirements and cooling performance, they were separately analyzed.
- Considering three climatic zones as per the Koppen climate classification with different cooling load requirements. The solar radiation level and the ambient temperature of the climate zones affects the output of the solar thermal collectors and hence on the VAR system performance.
- To compare the performance of the VAR cooling systems with conventional vapor compression refrigeration (VCR) cooling systems and to identify the relative performance in terms of technical, economic and environmental issues.
Multi-attribute models are tiered structures that break down the decision problem into smaller problems. DEXi is a software used for multi-attribute decision making. Qualitative decision models that need collaborative development in order to evaluate different options are done using this method. This method is efficient in selecting the appropriate option from among different possible options and to make the accurate decisions in order to adopt for implementation. Several areas like manufacturing and process industry, health and education have adopted DEXi with encouraging results in terms of its applicability and flexibility [19]. Integrated systems involving several interacting attributes that are varied and nondeterministic have been evaluated by this method [20]. MADM model was used to select the appropriate strategy for contaminated ground water remediation [21]. This method is used to handle imprecise numerical quantities. The most appropriate small hydropower plant investments among five alternative ones were studied using DEXi by considering the crucial performance parameters of the plant that included technological, economic, political and environmental factors [22]. The above studies show that DEXi is the appropriate choice for making the feasibility study of the different solar collection technology (SCT) options for VAR cooling systems.
2. Materials and Methods
DEXI requires variables indicating the performance of the systems which are called attributes that are organized into a hierarchical structure called a tree of attributes. The dependent attributes finally end up in the basic attributes which represents the input to the model. The values given to the basic attributes are based on numerical calculations or accepted values from the literature. The different basic attributes required for the solar operated cooling systems are numbered C111 to C533 as given by Table 1. The basic attributes determine the value of the next higher level dependent attributes numbering from C11 to C53 which in turn decide the main attributes C1 to C5. The main attributes are of two types, namely MAJOR and MINOR. The major main attributes are cost (C3) and environmental impact (C). The minor attributes are thermal requirement (C1), area and volume requirement (C2) and auxiliary power requirement (C4). The basic attributes are tabulated using the equations given below. The attributes are given qualitative and discrete values called ranks. Ranks of attributes at a given level determine the value at a higher level. That is, the ranks of the basic attributes determine the rank of the dependent attribute and the rank of dependent attributes determine the rank of the main attribute. Basic attributes related to thermal requirements are determined from existing equations related to VAR systems, solar collectors and cooling load calculations. Area and cost requirements of solar collectors are determined from equations as well as data reported in the published literature. Land cost is calculated from existing data for the three climatic locations considered in this study, namely Niger, Riyadh and Beijing. The net present value is determined for a 15-year operation of the collector and cooling machine.

Table 1.
The distribution of the different levels of attributes.
The ranks of the higher level attributes (Y) are related to the lower level attribute (X) through the utility function Equation (1).
The DEXi method uses qualitative multi-attribute models. Scales that are distinct and represented by words rather than numbers are called qualitative attributes. Four types of attributes, namely very good (VGD), good (GDD), acceptable (ACC) and unacceptable (UCC) are used in this study. These attributes are determined from the numerical results of calculations using equations or data published in the literature. Decision rules in the form of utility functions are used to related the attributes. These are components of the model that define the combined action of the attributes as they move up the decision tree. For example, an aggregate attribute Y has got X1, X2, X3, …. as its descendants and the utility function uses weights to give the importance of each of the descendant attributes as described in Equation (2). Weights are numbers, usually normalized to the sum or maximum of 100, which define the contribution of the corresponding attribute to the final evaluation. In Decision Analysis, utility functions are commonly defined using some form of the weighted sum, for example:
Here, wi denote weights and Xi denote attributes. Figure 1 gives the algorithm used as well as the local and global weights used for each basic attribute. This is the decision tree, and the decisions are made up to the major attribute level after which the final ranking of the technology option is given. Technology option rank gives the final overall ranking of a particular technology. The technology option rank (1 to 5) is dependent on the major and minor attributes C1 to C5. These again depend on the dependent attributes C11 to C53, and they are again dependent on the basic attributes C111 to C533.
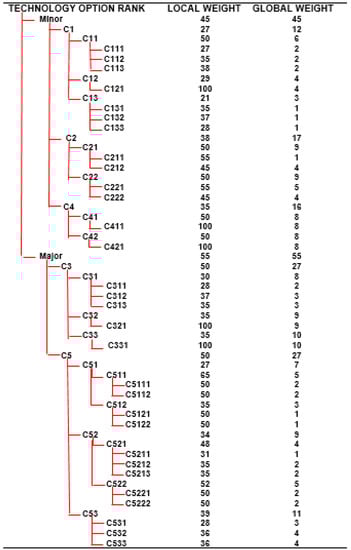
Figure 1.
Algorithm for the decision analysis with weights of the basic attributes.
The utility function follows a set of rules which is made into the program depending on the requirements. Each of the dependent attributes takes one of the above values depending on the combination of values given to the lower level attributes. The ratio of difference between the value of the attribute (Ci) and the minimum value of the attributes (Ci,min) to the difference between the minimum (Ci,min) and maximum value (Ci,max) of the attributes is used to determine the rank as per the rule given in Table 2. Unfavorable options will have opposite ranks for minimization compared to favorable options requiring maximization.
Table 2.
Rules for ranking the attributes.
In this case, two types of utility functions are created based on whether the impact of the attribute on the final decision is major or minor. Major attributes consist of cost (C3) and environmental effect (C5). Minor attributes consist of thermal requirement (C1), area and volume requirement (C2) and auxiliary power requirement (C4). The decision rules for the major attributes as more stringent than the decision rules set for the minor attributes. The attributes are determined from the theoretical performance of single effect and double effect VAR cooling systems as given in Section 2.1 and Section 2.2. The cooling loads for operating the above cooling machines are taken for three different climatic zones as described in Section 2.3 using the equations given in Section 2.4. The theoretical procedure used to determine different performance parameters of solar collectors as well as the specific operating details of each type of solar thermal collector is described in Section 2.5. The study is conducted with the following assumptions.
- This study is based on a VAR cooling system operated during six hours of active sunshine hours with solar collector.
- The total energy required by the VAR cooling system for 24 h is to be supplied by the solar collector with the help of a storage tank.
- The collector supplies heat to the storage system in order to meet the total heat required at the required temperature.
- Three different climatic zones from the Koppen classification are considered based on the cooling load requirements.
- Only single effect and double effect VAR cooling systems are considered due to their successful performance.
- Only the efficiency of the equipment is considered during calculations, and the heat loss during fluid transport is considered negligible.
2.1. Single Effect
The schematic diagram of a single effect VAR refrigeration cycle is shown in Figure 2. The main components of the absorption system consist of generator, condenser, evaporator, absorber, and solution heat exchanger. If Lithium Bromide–Water pair is used as the working fluid in this cycle, Lithium Bromide works as an absorbent and water works as a refrigerant. There are two pressure levels in this cycle, the generator and condenser operate at high pressure, while evaporator and absorber operate at low pressure level. The refrigerant enters the evaporator as saturated liquid and leaves as saturated vapor, thereby producing a cooling effect in the required space. The refrigerant vapor leaving the evaporator is absorbed by strong solution from the generator, forming a weak or diluted solution of the Lithium Bromide–Water mixture. This weak solution leaves the absorber and is pumped to the generator through the pre-heater. The pre-heater is the equipment that receives heat from the strong solution that leaves the generator and uses it for heating the solution entering the generator. Pure refrigerant is separated from the solution and proceeds to the condenser after it receives heat in the generator. The strong solution returns back to the absorber and rejects heat in the pre-heater on its way back.
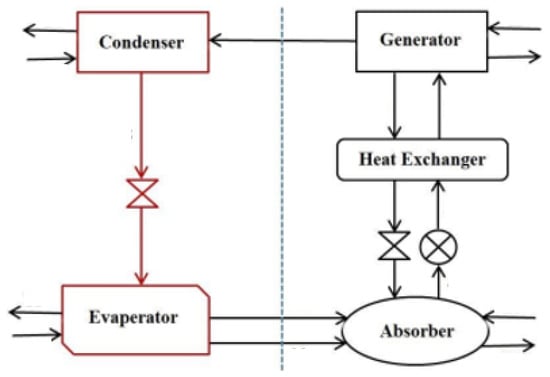
Figure 2.
Single effect VAR cooling system.
COP of single effect VAR cooling systems is very low compared to double or triple effect systems. In one such study on single effect VAR cooling systems, when the evaporation temperature is varied from 4 °C to 10 °C, condenser and absorber temperatures are varied from 33 °C to 39 °C, and generator temperature is varied from 60 °C to 190 °C the maximum COP value varied from 0.73 to 0.79 [23]. Thermodynamic analysis of Lithium Bromide–Water system was done numerically, and it was found that the cycle attains maximum COP of 0.8849 at 60.38 °C generator temperature with 12.5 °C evaporator temperature [24]. Cooling systems that use single-effect double-lift Lithium Bromide–Water absorber refrigerant pair operate in the cooling capacity range of 176 to 4395 kW with chilled water outlet and return temperatures of 7 and 12 °C, respectively, for European conditions and 8 and 13 °C for Asian conditions. The generator hot water outlet temperature and the condenser cooling water inlet temperatures are 95 and 27 °C, respectively, for Europe and 95 and 31 °C, respectively, for Asian countries. Consequently, the COP is 0.72 and 0.70, respectively, for the two regions.
2.2. Double Effect
The generator temperature for double effect cooling machines is higher than that required for operating a single-effect systems and the COP is also higher [25]. The working of the double effect system is illustrated in Figure 3. Performance of the double-effect cycle is about 1.5 times that of the single-effect cycle [26]. Two significant factors, namely heat transfer area and crystallization limits the performance of double-effect absorption chillers [27]. Studies conducted further concluded that the parallel and the reverse parallel cycles could operate with a wider range of working conditions without crystallization risks compared to the normal series flow scheme [28]. Two different flow arrangements, namely series and parallel flow schemes were studied [29]. It was observed that the series configuration provided greater COP than the parallel cycle for a generator temperature below 150 °C. In contrast, the parallel scheme gave higher performance than the series for generator temperatures higher than 150 °C.
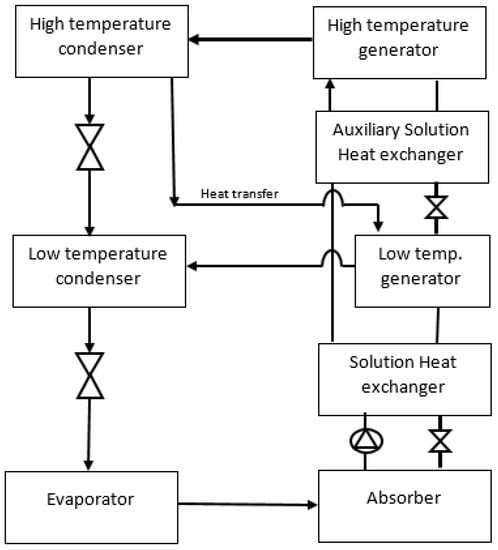
Figure 3.
Double effect VAR system.
The operating requirements and thermal performance differs for the single effect and double effect systems. The COP of single effect VAR cooling systems using Lithium Bromide and water combination varies between 0.7 and 0.8 based on the heat supply temperatures, and COP of double effect varies between 1.2 and 1.5. Table 3 gives these different operating requirements for both single effect and double effect VAR machines [30,31,32].
Table 3.
Requirements of single and double effect VAR cooling system.
2.3. Climatic Zones
The Köppen classification subdivides terrestrial climates into five major types [33], and the three of them representing different climatic zones in terms of cooling load requirement are considered.
- Subtropical steppe climate zone (Bsh) in Niger
- Dry desert hot arid climate (BWh) in Riyadh
- Hot summer continental climate (Dwa) in Beijing
Three different regions with the above climatic zones are used for the analysis, namely Niger, Riyadh, and Beijing. The average annual temperature in Niger with subtropical steppe climate zone is 29.1 °C. Riyadh has a hot desert climate. During the year, there is virtually no rainfall. The average annual temperature is 26.2 °C. Beijing, which has a hot summer continental climate, has an average temperature of 12.8 °C. The data for the five hottest months of the year are used to calculate the total cooling load. The monthly cooling load and average ambient temperature are given in Table 4 [34].
Table 4.
Average solar ambient temperature and monthly cooling load.
2.4. Cooling Load and Thermal Energy Requirements
Figure 4 shows the heat supply from the solar collector to the VAR cooling system at a temperature of To. Heat flows from the collector to storage tank and back. The fluid for operating the VAR cooling system is taken from the storage tank and returns to the storage after heat extraction in the generator. The fluid returns back to the collector at a reduced temperature of Ti. The collector sizing is done as based on the 24-h operation requirement of the cooling system.
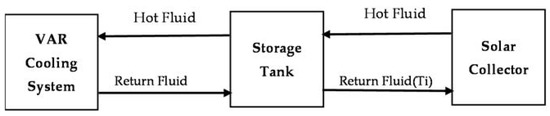
Figure 4.
Heat supply between solar collector and VAR system.
The total cooling load (QCM) required for these five months of cooling degree days is calculated from Equations (3) and (4). DDC(Tb) indicates monthly cooling degree days for base temperature of 18.3 °C. BLC is the building load coefficient in W/m2 -h, which depends on the nature of the wall insulation layers and number of walls.
NE represents the number of heat transfer walls in the building, Ai represents the area of the wall ‘i’ and RT,i represents the resistance of wall “i” as in Equation (4). The BLC is assumed to be 1000 W/m2h for cooling load calculations. The thermal energy required to be supplied by VAR machine (QC) in order to meet the above cooling load after considering the transmission and equipment losses (ηT) is given by the Equation (5), and the heat supplied by the solar collector after considering the storage losses (ηS) is given by Equation (6).
Theoretical COP of the collector is determined from the generator temperature (Tg), the evaporator temperature (Te), and the ambient temperature (To) outside the room which fixes the condenser temperature as given in Equation (7).
The total heat collected during the five summer months (Qs) during active sunshine hours from 10 am to 4 pm is calculated by taking the average solar radiation and average day temperature. Inlet temperature to the collector is taken as 10 °C below generator temperature by assuming the generator to produce a temperature drop of 10 °C as in Equation (8).
The total cooling load (QCM) required for these five months of cooling degree days is calculated from Equations (3) and (4). DDC(Tb) indicates monthly cooling degree days for base temperature of 18.3 °C. BLC is the building load coefficient in W/m2h which depends on the nature of the wall insulation layers and number of walls.
2.5. Solar Collector Area
Solar collector technology differs from each other in terms of type of working fluid, outlet temperature, efficiency, cost of operation, and auxiliary power consumption, among several factors. The requirements of the VAR cooling system have a direct effect on these factors. The performance of different solar collectors is described below.
The collector dimensions are determined so as to supply heat to the VAR for the minimum solar radiation and ambient temperature conditions prevailing in the selected location. The cooling load includes the heat storage required to operate the VAR system during the off sunshine hours by supplying energy to the storage system. Steady state performance of solar collector is described by energy balance between the incident solar radiation, useful energy gain, thermal losses, and optical losses. The solar radiation absorbed by the tilted plane of the collector is equal to the product of incident radiation IT and the optical average absorptivity–transmissivity ratio (τα). The area required for a flat plate non-concentrating collector (AC) is given by Equation (9). This is obtained from the Hottell–Whillier–Bliss (HWB) equation for solar collectors using a ‘τα’ value of 0.85 [35].
PR is the required thermal power produced by the collector which must match with the power requirement of the VAR system. UT is the overall heat transfer coefficient of collector, Ti is the inlet fluid temperature and Ta is the ambient temperature. Costs of solar water heating collectors have an average value of $1300 per kilowatt [36,37]. Very small quantity of emission occurs during the manufacture, installation and operation of solar collectors. As a thumb rule, a glazed collector area of 1.49 m2 is required for a 1 KW thermal capacity [38]. The annual maintenance cost of a flat plate solar water heater is 5% of the installation cost per kilowatt.
The fluid outlet temperature of solar flat plate collector is calculated by equating the HWB equation to the heat gained by the fluid as given by Equation (10).
Heat removal factor (FR) of SWH collector is a function of the fluid flow condition and fluid properties as well as the collector efficiency factor. represents fluid mass flow rate in solar collector and CP is the specific heat of the fluid. UL is the overall loss coefficient between the collector and the surroundings. Experimental studies were conducted by different methods to determine the heat removal factor, and it was found to be a function of the angle of inclination of the collector [39]. Equation (11) gives the relation used to calculate the heat removal factor. In this equation, F’ represents the collector efficiency factor which depends on the type of collector and its material properties.
3. Solar Collectors
The key performance parameters, cost and environmental factors pertaining to each type of solar collector is discussed.
3.1. Flat Plate Water Heating Collector (SWH)
As a thumb rule, a glazed collector area of 1.49 m2 is required for a 1 KW thermal capacity [40]. The annual maintenance cost of flat plate solar water heater is 5% of the installation cost per kilowatt. Because water is the working fluid, additional handling cost are involved compared to air heating collectors. Because the temperatures involved are much below the saturation temperature in this type of collectors, it is safe and does not require steam quality piping.
3.2. Flat Plate Air Heating Collector (SAH)
Air heating collectors, which are predominantly used for drying and room heating applications can be used to supply heat to VAR generators. One of the advantages of air heating collectors is the high outlet temperature achievable in spite of their low efficiency. Equations (3)–(10) is applicable for air heating collectors as well to calculate their thermal performance. The average installation cost of solar air heater is $1200 per kW [41] and annual maintenance cost is 5% of the installation cost. Because air is the working fluid, the handling and maintenance cost is much lower compared to other types of collectors.
3.3. Evacuated Tube Collector (ETC)
Due to the evacuation of the air space between the absorber tube and its cover, losses are significantly reduced resulting in higher efficiency of ETCs. The conduction and convective movement of heat within this spacing is absent after evacuation. The heat is extracted directly by a liquid flow inside the absorber tube or by using the heat pipe method. With direct flow, the fluid in the primary loop passes through the absorber pipe. In the heat pipe type, heat is absorbed from the heating zone of the collector by evaporation of a heat pipe fluid which then transfers the heat to condensing region for heat utilization. Because evaporation and conduction temperatures of the fluid are same, the conductivity is very high. Numerical and experimental studies were conducted in performance study of heat pipes and substantial data is available [42,43,44]. It is seen that the average efficiency of ETC is about 65.6%. Installation cost of ETC has an average cost of $5500 to produce 2000 kWh of energy, and every kilowatt of thermal power requires 1.4 m2 of collector area [45]. Normal outlet temperatures of collectors of this type can be more than 80 °C. Usually water is used to transport the heat from the collector to the VAR system when operating temperatures are less than saturation temperature.
3.4. Parabolic trough Type Collectors (PTC)
Parabolic trough type collectors use a reflecting parabolic trough that focuses solar radiation onto a central receiver. Concentration ratios ranging from 15 to 30 provide temperatures in the range of 250–400 °C when direct solar radiation is available. A lower range of concentration ratios will result in outlet temperatures between 90 and 250 °C in the case of less performing parabolic troughs. This occurs due to reduction in aperture widths to a range in between 50 and 250 cm. Methods like installation of glazing over the absorber tubes can reduce losses further [46]. A non-evacuated tube with glass cover and black paint coating achieved maximum instantaneous efficiency of 66.78% [47]. Area required for 1 kW of thermal power is 1.95 m2 and the cost of installation is $55 per square meter area [48]. Working fluid can be organic fluids or molten salts, and they come at an extra cost and handling charges.
3.5. Compound Parabolic Air Heating Collector (CPC)
Compound parabolic collectors (CPCs) come under the category of non-imaging concentrators. The special feature of these collector is acceptance of radiation from a wide area which focusses on to the absorber region by single or multiple reflections within the reflectors. This type of collectors can produce hot air at temperatures between 70 and 120 °C. The basic design of the CPC employed a flat absorber with single or double glass covers [49]. With fluid temperatures up to 100 °C, no vacuum would be necessary, but if using a glass cover, a high thermal efficiency could be reached [50]. Experimental studies with CPC showed that 450 W of thermal power can be obtained using an aperture area of 0.96 m2 [51]. CPC have an average cost of $1800 per kilowatt thermal. Annual maintenance cost is 5% of the installation cost [52]. Because air is the working fluid, handling is easy.
4. Performance of Conventional Vapor Compression Cooling System
The four components of the simple vapor compression cooling method are the compressor, condenser, expansion device and the evaporator. Figure 5 gives a description of the simple vapor compression refrigeration cycle. The principle of working of this method is the cooling process that occurs due to evaporation of a low pressure liquid refrigerant. The refrigerant that is compressed by the compressor passes through the condenser to reject its heat and becomes subcooled liquid. This subcooled liquid refrigerant is then expanded to lower pressures in the expansion device. Although hydro flouro-carbon refrigerants like R-134a which have zero ozone depletion potential (ODP), they have considerably high global warming potential (GWP) which makes them undesirable. Safer options like hydro-fluoro-olefin (HFO), R744 (carbon dioxide), and environmentally safe nano-refrigerants can be used due to their low ozone depletion potential and global warming potential [53]. A typical refrigerant compressor uses 0.33 kW of electrical power for every kW of cooling when the condenser is maintained at 26 °C, and this power consumption increases to 0.4 kW when the condenser temperature rises to 40 °C [54]. Hence, the ambient condition that determines the condenser temperature has a key role in the power consumption by this type of cooling system. The power consumption increases in summer conditions in an annual cycle and during the mid-day in the daily cycle. ODP and GWP levels due to refrigerant usage and electrical power generation processes are detrimental to the environment. The emission of carbon dioxide can vary from as low as 300 kg per ton of refrigeration to 2500 kg per ton of refrigeration depending on the technology adopted in the compressor as well as the operating conditions. The initial investment cost of vapor compression systems is around $570 per kW [55].
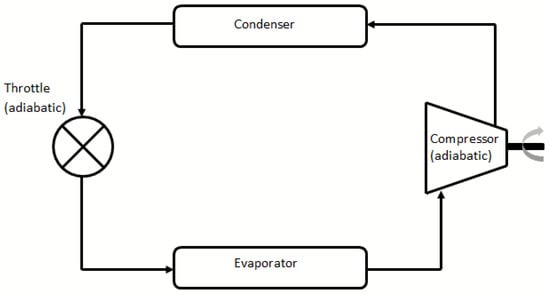
Figure 5.
Process diagram of simple vapor compression cooling system.
Vapor compression refrigeration systems use grid power for driving the compressor, condenser fan and evaporator fan. Several technological developments have come up in order to reduce this power consumption. Variable speed drives are used to adjust compressor speed when the cooling load changes, thereby saving energy. Variable refrigerant machines use methods to control refrigerant flow to the evaporator coils as per the cooling demand in the room. This helps to save the energy used in the system. In the case of the latter, the quantity of refrigerant evaporated in the evaporator is controlled. The cooling energy required to manage a particular cooling load is calculated using the cooling degree days (DDC) for the location for the base temperature (Tb) and the building load coefficient (BLC). The cooling energy required and the cooling machine performance COP determine the cooling energy required by the machine. The actual grid energy used to meet this cooling load is then calculated after accounting for the efficiency of the drives. Emissions occurring due to the generation of this grid power has been well documented in several publications for fuels like natural gas as assumed in this study [56,57,58,59]. Actual emissions quantity is determined after considering the transmission efficiency occurring during transportation of power as 85% and the losses occurring in the drives resulting in an efficiency of 80%. R-134A is assumed as the refrigerant used in order to calculate the emissions in the cooling system with data taken from publications [60,61]. Vapor compression systems have developed well in terms of operational flexibility and ergonomics over several years of development when compared with vapor absorption systems.
5. Calculation Procedure of Basic Attributes
The data in the basic attributes table are generated for three different climate zones for cooling using the VAR cooling machines, single and double effect, with heat supply from five different solar collector technologies as required by DEXi model. These data are calculated using Equations (3)–(11) and for the conditions prevailing in the three climate zones as in Table 4. Established data from the published literature are also used. Initially, the average solar radiation data, average ambient temperature, collector heat removal factor and overall loss coefficient are used to calculate the outlet temperature of solar collector. The heat removal factor required for calculating the collector outlet temperature was calculated for collector efficiency factor of 0.9. Water heating collectors, parabolic trough collector and evacuated tube collector were assumed to have a liquid mass flow rate of 0.01 kg/s and air heating collector working fluid mass flow rate is assumed as 0.001 kg/s. The specific heat values used were 4.18 kJ/kg·K for water and 1.005 kJ/kg·K for air. The overall loss coefficient was taken as 15 W/m2·K for all the collectors except for evacuated tube collector for which 3 W/m2·K was used [62]. The average intensity of solar radiation and the ambient temperature are taken from Table 4. Because the outlet from the solar collector is connected to the generator, the generator temperature is equal to the collector outlet temperature. The COP is calculated from ambient conditions (C112), required cooling temperature or base temperature (C113) and generator temperatures (C111) achievable by the respective collectors for the average solar radiation in the climate zone using Equation (7). The COP calculated using the above temperatures is used to determine the heat supply required at the generator or supplied by the solar collector outlet, which is the attribute C131, using Equation (8). For this, the room cooling temperature is taken as 278 K, and the ambient temperature and cooling load data are taken using Table 4 data. The heat supply required is used to calculate the collector area (C211) using Equation (9). Cost (C311 to C331) and emissions (C5111 to C533) calculations use data existing in the published literature. The land requirement for a solar thermal installation includes the actual collector area plus the area required for the associated equipment like fluid machinery, controls, storage and space for access. Collector area required for a specific type of collector for the required power output was calculated from Equation (9). Average land cost in the selected location was taken after using a multiplication factor of 1.5 for accommodating accessibility space and associated equipment in order to calculate the land cost [63,64,65]. The land costs used in the calculation are 1240 $/m2 for Niger, 1047 $/m2 for Riyadh and 1428 $/m2 for Beijing at current price levels. Net present value is determined by summing up the cooling machine installation cost, solar thermal collector cost, land cost and present value of maintenance cost for a 15 year operating period. Table 5 and Table 6 give these values for the three different climatic zones. The tables give the basic attributes for subtropical steppe climate zone (Niger, Bsh) for single effect VAR cooling machines with five different solar collector technologies. The first column gives the description for the attribute. The second to sixth column gives the attribute values for the different types of solar collectors used. Table 6 gives similar values of attributes values for double effect VAR cooling machines for the three climate zones as described above. It can be seen from the table that the generator temperature (C111) is maximum with PTC collectors for single effect machines in the case of Bsh climate zone. Correspondingly, the heat required at the generator (C131) is minimal in this case due to high COP. Table 7 gives the attribute values for VCR technology for the three climate zones. The boxes irrelevant to VCR system or with negligible data are made zero.
Table 5.
Basic attribute values for Niger (Bsh), Riyadh (BWh) and Beijing (DWA) climate zone for single effect systems.
Table 6.
Basic attribute values for Niger (Bsh), Riyadh (BWh) and Beijing (DWA) climate zone for double effect systems.
Table 7.
Basic attribute values for Niger (Bsh), Riyadh (BWh) and Beijing (DWA) climate zone for VCR technology.
6. Results and Discussion
The relative ranking of the basic attributes is done based on the rules given in Table 2 and tabulated in Table 8 and Table 9. Table 8 gives the ranks for single effect VAR systems for the three climate zones, and Table 9 gives the ranks for the double effect. It is observed that minimum generator temperature is produced by SWH collector and the generator heat requirement is maximum for the same cooling effect for the Bsh climate zone. The same trend is observed for double effect machines as well, as seen in Table 6. Comparison of the generator temperature produced by PTC collectors for the three climate zones as in Table 5 and Table 6 shows that the generator temperature produced is maximum in the case of dry arid (BWh) due to higher values of solar radiation intensity. Area and volume requirement attributes (C21 and C22) depend on the climate zone as well as the type of machine used for cooling. Solar collector area (C211) is maximum in the case of air heating collectors and minimum in the case of parabolic trough collectors. These values are lower in the case of double effect machines due to their higher COP and lower heat supply requirements. The collector area also shows a maximum requirement for an arid climate (BWh) and a minimum requirement for the temperate climate zone (Dwa). Similar trends were obtained for generator heat exchange area and machinery volume.
Table 8.
Ranking of basic attributes for Niger (Bsh), Riyadh (BWh) and Beijing (DWA) climate zone for single effect systems.
Table 9.
Ranking of basic attributes for Niger (Bsh), Riyadh (BWh) and Beijing (DWA) climate zone for double effect systems.
The rules given in Table 2 depending on the minimization or maximization of the basic attributes are used to rank a particular attribute as Unacceptable (UNC), Acceptable (ACC), Good (GDD) and Very good (VGD). Unfavorable options will have opposite ranks for minimization compared to favorable options requiring maximization as given in Table 2. The rankings for the three different climate zones are given in Table 8 and Table 9.
An overall ranking of the best technology options for three climate zones for the five different solar collectors for single effect and double effect VAR cooling machines is given in Figure 6, Figure 7 and Figure 8. SWH collectors have the best rank in the case of Bsh climate zones for single effect cooling machines, and compound parabolic collectors have the best rank for the same climate and for double effect cooling machines as shown in Figure 6a,b. This is explained by the lower generator temperature requirement in the case of single effect machines compared to double effect machines. Compound parabolic air heating collectors have the third rank among single effect machines. Other solar thermal collectors are poorly ranked due to lower temperature output as well as reasons like higher area requirements and cost.
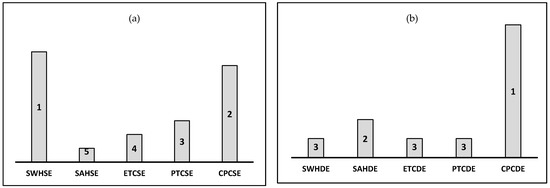
Figure 6.
(a) Overall Ranking for Bsh climate zone SE, (b) Overall Ranking for Bsh climate zone DE.
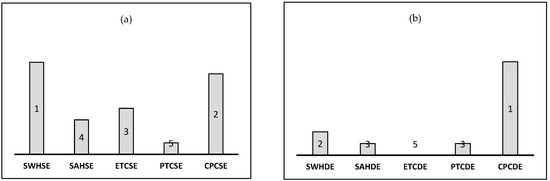
Figure 7.
(a) Overall Ranking for BWh weather scenario SE, (b) Overall Ranking for BWh weather scenario DE.
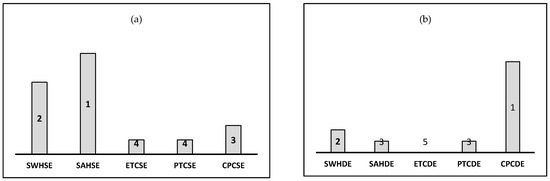
Figure 8.
(a) Overall Ranking for Dwa weather scenario SE, (b) Overall Ranking for Dwa weather scenario DE.
BWh climate zone has high cooling load requirement, and hence, the associated values of cost and area are much higher, as shown in Figure 7a,b. Moreover, because the solar radiation intensity in this zone is higher, the thermal performance of the collectors is better in this zone. Hence, it is seen that ordinary SWH collectors are able to give best performance in this zone. This is followed by compound parabolic air heating type collectors due to their lower cost and auxiliary power requirements. In the case of double effect machines in the BWh zones, higher generator temperature requirement results in poorer ranking of the water heating collector and best ranking for the air heating collector.
In the case of Dwa weather zone, the cooling load requirement is much lower than the previous two zones, and the intensity of solar radiation received is much lesser throughout the year. Due to higher outlet temperatures of solar air heating compared to SWH, ordinary solar air heaters without concentration are able to meet the temperature and energy requirements for cooling in this zone, as in Figure 8a. The lower cost of these systems also work favorable to this concept. However, in the case of double effect cooling machines in Figure 8b, the required temperature can be met only by concentrating type solar air heaters. This is due to lower average solar radiation in this climate zone.
Comparison of the major dependent attributes for the best solar collector option for single effect and double effect cooling systems with the VCR systems is done in Figure 9, Figure 10 and Figure 11. It can be seen from Figure 9 that fixed costs of VCR systems are much less compared to the solar operated VAR technology. This is because of the high cost of the cooling machine as well as the additional cost of the solar thermal collector and associated land cost. The ideal COP of vapor compression systems which are calculated from evaporator and condenser temperature are much higher than that of VAR systems. This due to the higher grade of energy input in VCR in the form of electricity and lower grade energy input in VAR systems in the form of heat. The losses incurred in electricity production are not accounted for in this case. The electrical power consumed for the three cases is also compared. Electrical power consumed for VCR systems is much more than that of VAR systems. The power required for VCR is for compressor operation, and it is for operating fans, blowers or pumps in the case of VAR, and it is very low order of magnitude. Maintenance costs are higher for solar operated VAR technologies need cleaning activity due to dust accumulation on the collectors. Maintenance cost for VAR technology is high compared to VCR systems. Total present value that considers the present value of maintenance costs and the fixed costs gives the overall picture. Solar VAR options need to be improved further for cost reduction in order to compete with existing VCR cooling systems. Larger capacity of VAR systems can help to reduce this difference. Moreover, the CPCDE technology has a lesser cost advantage compared to SWHSE technology in the case of Bsh and BWh climate zones but better cost advantage in Dwa climate zone. This is because of the fact that the solar radiation intensity is lesser in Dwa locations requiring concentration of solar radiation. Low temperature solar collectors are able to perform better in the case of Bsh and BWh locations. Primary emissions are always high in the case of VCR cooling systems due to the effect of fossil fuel power generation systems by which these cooling systems are operated. Moreover, primary emissions from CPCSE systems and secondary emissions also show the same trend.
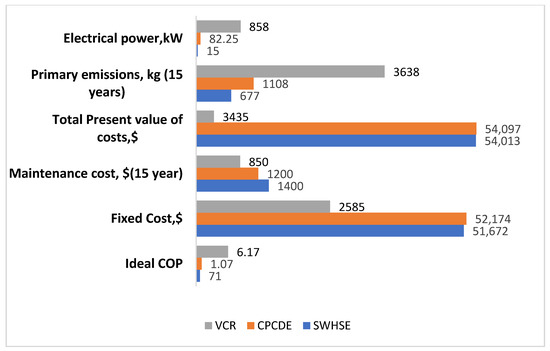
Figure 9.
Comparison of performance of the best ranking single effect solar method (SWHSE), double effect solar method (CPCDE) and vapor compression method(VCR) for Niger (Bsh).
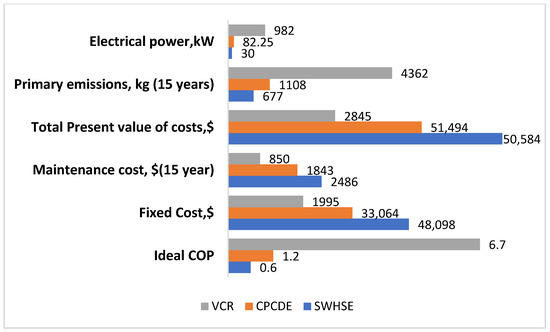
Figure 10.
Comparison of performance of the best ranking single effect solar method (SWHSE), double effect solar method (CPCDE) and vapor compression method(VCR) for Riyadh (BWh).
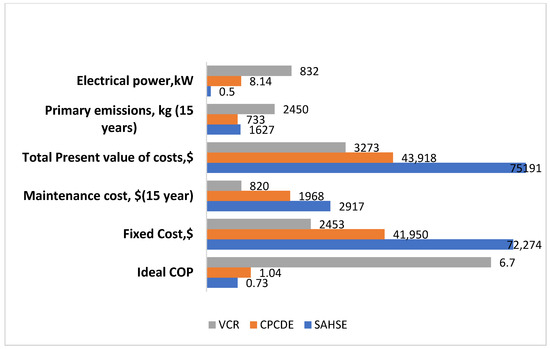
Figure 11.
Comparison of performance of the best ranking single effect solar method (SWHSE), double effect solar method (CPCDE) and vapor compression method (VCR) for Beijing (Dwa).
7. Conclusions
A Multi-Attribute Decision-Making (MADM) process is used make a comparison of five different solar thermal collection systems for operating a VAR cooling system to meet the cooling requirements for human comfort under three different climate zones. Both single effect VAR technology and double effect cooling technology are compared. The MADM program DEXi is used in which the different attributes required for comparison of the different methods are provided. The attributes are basically grouped as main, dependent and basic attributes. The basic attributes are calculated from existing thermodynamic equations as well as published data from the literature. The basic attributes are related to the dependent attributes and further to the main attributes through utility functions which define the relationship between each level. Moreover, the main attributes are divided into major and minor depending on their relative importance.
The values calculated for each of the basic attributes are tabulated for the three climate zones, namely the subtropical steppe climate zone in Niger (Bsh), dry hot arid desert climate in Riyadh (BWh) and hot summer continental climate in Beijing (Dwa). Single effect and double effect VAR cooling machines are listed separately. The ranking values for the basic attributes are then given based on their relative values as well as minimization or maximization requirements. The overall ranking of the technologies is done by a scale from 1 to 5.
Under the subtropical steppe climate zone in which the maximum cooling capacity requirement is 2.78 kW for a building with load coefficient of 1000 W/m2h, SWH collectors was best performer for single effect VAR cooling systems and air heaters with compound parabolic concentrators performed best for double effect systems. Air heaters with compound parabolic concentrator is as an energy efficient as well as low cost option for operating double effect VAR technology. In the decision-making process, the cost factor plays an important role in the ranking. This is because cost is a major attribute which was given higher weight. Land cost required for the solar collectors was main reason for cost escalation. Moreover, the installation costs for solar water heating collectors and solar air heating collectors are much less compared to parabolic trough collectors and evacuated tube collectors. Similarly, under a hot arid desert climate with a maximum cooling capacity of 3.5 kW, the results were the same. In the case of hot summer continental climate, the maximum cooling capacity requirement is 2.31 kW, and the best performance by solar air heaters without concentrators for single effect and solar air heaters with compound parabolic concentrator for double effect.
Comparison of the performance of solar thermal powered VAR technology and vapor compression technology in terms of their major attributes shows that the latter is a superior option in terms of fixed cost and the former is better in terms of electrical energy consumption and emissions. Overall net present value is in favor of vapor compression systems with values of $3435 for Niger (Bsh) climate condition, $2845 for Riyadh (BWh) and $3273 for Beijing (DWa) calculated for a 15 year operating period. This is approximately 5 to 6% of the cost of vapor absorption systems with solar thermal collectors. Both primary emissions and secondary emissions showed better performance of solar thermal VAR technologies.
The results show that the solar VAR cooling technologies have to undergo more cost reductions primarily in terms of fixed cost of machinery in order to show better performance compared to vapor compression systems. The question of viability of solar VAR technology for very large cooling capacities requires attention for future studies.
Author Contributions
The concept of application of multi criteria decision analysis for selecting the appropriate cooling technologies for different climate zones was conceptualized by Z.K. The methodology and investigation were carried out by Z.K. and B.S. The investigation and data curation were carried out by Z.K. and A.A. and the software application and validation were performed by Z.K. and A.A. Project administration and funding management was performed by Z.K. All authors have read and agreed to the published version of the manuscript.
Funding
National Plan for Science, Technology and Innovation (MAARIFAH), King Abdulaziz City for Science and Technology, Kingdom of Saudi Arabia, Funding Number: 13-ENE1292-02.
Institutional Review Board Statement
Not applicable.
Informed Consent Statement
Not applicable.
Data Availability Statement
Data is available in the manuscript itself.
Acknowledgments
We hereby acknowledge the National Plan for Science, Technology and Innovation (MAARIFAH), King Abdulaziz City for Science and Technology, Kingdom of Saudi Arabia, Award Number: 13-ENE1292-02 for funding this research.
Conflicts of Interest
The authors declare no conflict of interest. The funding sponsors had no role in the design of the study; in the collection, analyses or interpretation of data; in the writing of the manuscript. However, they encouraged the publication of the results.
References
- Chakravarty, K.H.; Sadi, M.; Chakravarty, H.; Alsagri, A.S.; Howard, T.J.; Arabkoohsar, A. A review on integration of renewable energy processes in vapor absorption chiller for sustainable cooling. Sustain. Energy Technol. Assess. 2022, 50, 101822. [Google Scholar] [CrossRef]
- Nikbakhti, R.; Wang, X.; Hussein, A.K.; Iranmanesh, A. Absorption cooling systems—Review of various techniques for energy performance enhancement. Alex. Eng. J. 2020, 59, 707–738. [Google Scholar] [CrossRef]
- Wu, S.; Eames, I. Innovations in vapor-absorption cycles. Appl. Energy 2000, 66, 251–266. [Google Scholar] [CrossRef]
- Domínguez-Inzunza, L.A.; Hernández-Magallanes, J.A.; Sandoval-Reyes, M.; Rivera, W. Comparison of the performance of single-effect, half-effect, double-effect in series and inverse and triple-effect absorption cooling systems operating with the NH3–LiNO3 mixture. Appl. Therm. Eng. 2014, 66, 612–620. [Google Scholar] [CrossRef]
- Wonchala, J.; Hazledine, M.; Boulama, K.G. Solution procedure and performance evaluation for a Water–LiBr absorption refrigeration machine. Energy 2014, 65, 272–284. [Google Scholar] [CrossRef]
- Florides, G.A.; Kalogirou, S.A.; Tassou, S.A.; Wrobel, L.C. Design and construction of a LiBr–Water absorption machine. Energy Convers. Manag. 2003, 44, 2483–2508. [Google Scholar] [CrossRef]
- Wang, J.; Yan, R.; Wang, Z.; Zhang, X.; Shi, G. Thermal Performance Analysis of an Absorption Cooling System Based on Parabolic Trough Solar Collectors. Energies 2018, 11, 2679. [Google Scholar] [CrossRef]
- Yattara, A.; Zhu, Y.; Mosa Ali, M. Comparison between solar single-effect and single-effect double-lift absorption machines (Part I). Appl. Therm. Eng. 2003, 23, 1981–1992. [Google Scholar] [CrossRef]
- Dincer, I.; Hussain, A.; Tahir, R. Solar Thermal Power Systems. In Reference Module in Earth Systems and Environmental Sciences; Elsevier: New York, NY, USA, 2013; pp. 1–14. [Google Scholar]
- Liu, Y.; Chung, K.; Chang, K.; Lee, T. Performance of Thermosyphon Solar Water Heaters in Series. Energies 2012, 5, 3266–3278. [Google Scholar] [CrossRef]
- Ko, M.J. A Novel Design Method for Optimizing an Indirect Forced Circulation SWH System Based on Life Cycle Cost Using a Genetic Algorithm. Energies 2015, 8, 11592–11617. [Google Scholar] [CrossRef]
- Siuta-Olcha, A.; Cholewa, T.; Dopieralska-Howoruszko, K. Experimental studies of thermal performance of an evacuated tube heat pipe solar collector in Polish climatic conditions. Environ. Sci. Pollut. Res. 2021, 28, 14319–14328. [Google Scholar] [CrossRef]
- Rahman, A.; Abas, N.; Dilshad, S.; Saleem, M.S. A case study of thermal analysis of a solar assisted absorption air-conditioning system using R-410A for domestic applications. Case Stud. Therm. Eng. 2021, 26, 101008. [Google Scholar] [CrossRef]
- Sridhar, K.; Lingaiah, G.; Vinod Kumar, G. Performance of Cylindrical Parabolic Collector with Automated Tracking System. Appl. Sol. Energy 2018, 54, 134–138. [Google Scholar] [CrossRef]
- Xu, S.M.; Huang, X.D.; Du, R. An investigation of the solar powered absorption refrigeration system with advanced energy storage technology. Sol. Energy 2011, 85, 1794–1804. [Google Scholar] [CrossRef]
- Christopher, S.S.; Santosh, R.; Vikram, M.P.; Prabakaran, R.; Thakur, A.K.; Xu, H. Optimization of a SWH system for vapor absorption refrigeration system. Sustain. Energy 2020, 40, e13489. [Google Scholar]
- Arora, S.; Chitkara, S.; Udayakumar, R.; Ali, M. Thermal analysis of evacuated solar tube collectors. J. Pet. Gas Eng. 2011, 2, 74–82. [Google Scholar]
- Shirazi, A.; Taylor, R.A.; Morrison, G.L.; White, S.D. A comprehensive multi-objective optimization of solar-powered absorption chiller systems for air-conditioning applications. Energy Convers. Manag. 2017, 132, 281–306. [Google Scholar] [CrossRef]
- Bohanec, M.; Rajkovic, V. Multi-Attribute Decision Modeling: Industrial Applications of DEXi. Informatica 1999, 23, 487–491. [Google Scholar]
- Li, Y. Research on efficiency evaluation model of integrated energy system based on hybrid multi-attribute decision-making. Environ. Sci. Pollut. Int. J. 2019, 26, 17866–17874. [Google Scholar] [CrossRef]
- Lu, H.; Ren, L.; Chen, Y.; Tian, P.; Liu, J. A cloud model based multi-attribute decision making approach for selection and evaluation of groundwater management schemes. J. Hydrol. 2017, 555, 881–893. [Google Scholar] [CrossRef]
- Saracoglu, B.O. An Experimental Research of Small Hydropower Plant Investments Selection in Turkey. J. Invest. Manag. 2015, 4, 47–60. [Google Scholar]
- Dereje, S.; Ayou, D.S.; Coronas, A. New Developments and Progress in Absorption Chillers for Solar Cooling Applications. Appl. Sci. 2020, 10, 4073. [Google Scholar]
- Fujiia, T.; Takeda, N.; Miyauchi, H.; Kawamura, M.; Uchida, M. Cycle simulation and prototyping of single-effect double-lift absorption chiller. In Proceedings of the 12th IEA Heat Pump Conference, Rotterdam, The Netherlands, 15–18 May 2017. [Google Scholar]
- Gomri, R.; Hakimi, R. Second law analysis of double effect vapor absorption cooler system. Energy Convers. Manag. 2008, 49, 3343–3348. [Google Scholar] [CrossRef]
- Arora, A.; Kaushik, S.C. Theoretical analysis of LiBr-Water absorption refrigeration system. Int. J. Energy Res. 2009, 33, 1321–1340. [Google Scholar] [CrossRef]
- Xu, G.P.; Dai, Y.Q. Theoretical analysis and optimization of a double-effect parallel-flow-type absorption chiller. Appl. Therm. Eng. 1997, 17, 157–170. [Google Scholar] [CrossRef]
- Farshi, L.G.; Mahmoudi, S.; Rosen, M.A. Analysis of crystallization risk in double effect absorption refrigeration systems. Appl. Therm. Eng. 2011, 31, 1712–1717. [Google Scholar] [CrossRef]
- Chahartaghi, M.; Golmohammadi, H.; Shojaei, A.F. Performance analysis and optimization of new double effect lithium bromide-water absorption chiller with series and parallel flows. Int. J. Refrig. 2019, 97, 73–87. [Google Scholar] [CrossRef]
- Gomri, R. Second law comparison of single effect and double effect vapor absorption refrigeration system. Energy Convers. Manag. 2009, 50, 1279–1287. [Google Scholar] [CrossRef]
- Meraj, M.; Khan, M.; Imam, R. Thermodynamic Analysis of Single Effect Vapor Absorption Refrigeration Cycle. Int. J. Sci. Res. 2016, 5, 755–758. [Google Scholar]
- Aman, J.; Henshaw, P.; Ting, D. Modelling and Analysis of Bubble Pump Parameters for Vapor Absorption Refrigeration Systems. In Proceedings of the Conference: 2016 ASHRAE Annual Conference, St. Louis, MO, USA, 25–29 June 2016. [Google Scholar]
- Koppen Climate Classification. Available online: https://www.britannica.com/science/Koppen-climate-classification (accessed on 18 January 2022).
- Heating and Cooling Degree Days-Free Worldwide Data. Available online: https://www.degreedays.net/#generate (accessed on 18 January 2022).
- Klein, S.A. Calculation of flat-plate loss coefficients. Sol. Energy 1975, 17, 79. [Google Scholar] [CrossRef]
- Alrwashdeh, S.S.; Ammari, H. Life cycle cost analysis of two different refrigeration systems powered by solar energy. Case Stud. Therm. Eng. 2019, 16, 10. [Google Scholar] [CrossRef]
- Klein, S.; Duffie, J.; Beckman, W. Transient considerations of flat-plate solar collectors. Trans. ASME J. Eng. Power 1974, 96, 109–113. [Google Scholar] [CrossRef]
- Technical Note on Solar Thermal Capacity. Available online: https://view.officeapps.live.com/op/view.aspx?src=http%3A%2F%2Fwww.estif.org%2Ffileadmin%2Festif%2Fcontent%2Fpress%2Fdownloads%2FTechnical_note_solar_thermal_capacity-4.doc&wdOrigin=BROWSELINK (accessed on 18 January 2022).
- Montoya-Márquez, O.; Flores-Prieto, J.J. Heat Removal Factor in Flat Plate Solar Collectors: Indoor Test Method. Energies 2018, 11, 2783. [Google Scholar] [CrossRef]
- Nahar, N.M. Capital cost and economic viability of thermos syphon solar water heaters manufactured from alternate materials in India. Renew. Energy 2002, 26, 623–635. [Google Scholar] [CrossRef]
- Choudhury, P.K.; Baruah, D.C. Solar air heater for residential space heating. Energy Ecol. Environ. 2017, 2, 387–403. [Google Scholar] [CrossRef]
- Badar, A.W.; Buchholz, R.; Ziegler, F. Single and two-phase flow modeling and analysis of a coaxial vacuum tube solar collector. Sol. Energy 2012, 86, 175–189. [Google Scholar] [CrossRef]
- Zambolin, E.; Del Col, D. Experimental analysis of thermal performance of flat plate and evacuated tube solar collectors in stationary standard and daily conditions. Sol. Energy 2010, 84, 1382–1396. [Google Scholar] [CrossRef]
- Zambolin, E.; Del Col, D. An improved procedure for the experimental characterization of optical efficiency in evacuated tube solar collectors. Renew. Energy 2012, 43, 37–46. [Google Scholar] [CrossRef]
- Evacuated Tube Solar Thermal Hot Water Systems. Available online: https://www.thegreenage.co.uk/article/how-do-evacuated-tube-solar-thermal-hot-water-systems-work/ (accessed on 18 January 2022).
- Yang, M.; Moghimi, M.A.; Zhu, Y.; Qiao, R.; Wang, Y.; Taylor, R.A. Optical and thermal performance analysis of a micro parabolic trough collector for building integration. Appl. Energy 2020, 260, 114234. [Google Scholar] [CrossRef]
- Kumar, D.; Kumar, S. Year-round performance assessment of a solar parabolic trough collector under climatic condition of Bhiwani, India: A case study. Energy Convers. Manag. 2015, 106, 224–234. [Google Scholar] [CrossRef]
- Torres, H.M.; Carrillo, R.A.M.; Torres, N.M. Design and Construction of an Experimental Parabolic Trough Collector Using Low Cost Alternative Materials. In AIP Conference Proceedings; AIP Publishing LLC.: Melville, NY, USA, 2021. [Google Scholar]
- Principle of Cylindrical Concentrators for Solar Energy. Available online: https://www.osti.gov/servlets/purl/5063714n (accessed on 18 January 2022).
- Hsieh, C.K. Thermal analysis of CPC collectors. Sol. Energy 1981, 27, 19–29. [Google Scholar] [CrossRef]
- Nashine, E.K.; Pisipaty, S.K. Thermal Analysis of a Compound Parabolic Collector. Int. J. Eng. Res. 2017, 6, 24–29. [Google Scholar]
- Gilani, H.A.; Hoseinzadeh, S. Techno-economic study of compound parabolic collector in SWH system in the northern hemisphere. Appl. Therm. Eng. 2021, 190, 116756. [Google Scholar] [CrossRef]
- García-Pabón, J.J.; Méndez-Méndez, D.; Belman-Flores, J.M.; Barroso-Maldonado, J.M.; Khosravi, A. A Review of Recent Research on the Use of R1234yf as an Environmentally Friendly Fluid in the Organic Rankine Cycle. Sustainability 2021, 13, 5864. [Google Scholar] [CrossRef]
- Electrical Energy Equipment: Refrigeration and Air Conditioning URL. Available online: https://www.academia.edu/16887222/Refrigeration_and_Air_Conditioning (accessed on 18 January 2022).
- Santos, A.F.; Gaspar, P.D.; de Souza, H.J.L. Eco-energetic Comparison of HVAC Systems in Data Centers. Climate 2021, 9, 42. [Google Scholar] [CrossRef]
- De Gouw, D.D.; Parrish, G.J.; Frost, M. Trainer. Reduced emissions of CO2, NOx, and SO2 from U.S. power plants owing to switch from coal to natural gas with combined cycle technology. Earth’s Future 2014, 2, 17. [Google Scholar] [CrossRef]
- Latif, S.N.A.; Chiong, M.S.; Rajoo, S.; Takada, A.; Chun, Y.; Tahara, K.; Ikegami, Y. The Trend and Status of Energy Resources and Greenhouse Gas Emissions in the Malaysia Power Generation Mix. Energies 2021, 14, 2200. [Google Scholar] [CrossRef]
- Hajny, K.D.; Salmon, O.E.; Rudek, J.; Lyon, D.R.; Stuff, A.A.; Stirm, B.H.; Kaeser, R.; Floerchinger, C.R.; Conley, S.; Smith, M.L.; et al. Observations of Methane Emissions from Natural Gas-Fired Power Plants. Environ. Sci. Technol. 2019, 53, 8976–8984. [Google Scholar] [CrossRef]
- Rubin, E.S. Toxic Releases from Power Plants. Environ. Sci. Technol. 1999, 33, 3062–3067. [Google Scholar] [CrossRef][Green Version]
- Mahmood, R.A.; Ali, O.M.; Noor, M.M. Mechanical vapor compression refrigeration system: Review part 1: Environment challenge. Int. J. Appl. Mech. Eng. 2020, 25, 30–147. [Google Scholar] [CrossRef]
- Chinnaraj, C.; Vijayan, R.; Govindarajan, P. Analysis of Ecofriendly Refrigerants Usage in Air-Conditioner. Am. J. Environ. Sci. 2011, 7, 510–514. [Google Scholar]
- Sukatme, S.P. ISolar Energy-Principles of Thermal Collection and Storage; Tata McGraw Hill: New Delhi, India, 1996. [Google Scholar]
- Land Prices in Nigeria. Available online: https://businessday.ng/real-estate/article/land-prices-to-rise-on-new-governments-housing-infrastructure-programmes/ (accessed on 14 February 2022).
- Real Estate Prices in Riyadh. Available online: https://www.argaam.com/en/article/articledetail/id/1494538 (accessed on 13 February 2022).
- Land Price-Beijing. Available online: https://www.ceicdata.com/en/china/land-price-city/cn-land-price-beijing#:~:text=Land%20Price%3A%20Beijing%20data%20was,Sep%202021%2C%20with%2071%20observations (accessed on 14 February 2022).
Publisher’s Note: MDPI stays neutral with regard to jurisdictional claims in published maps and institutional affiliations. |
© 2022 by the authors. Licensee MDPI, Basel, Switzerland. This article is an open access article distributed under the terms and conditions of the Creative Commons Attribution (CC BY) license (https://creativecommons.org/licenses/by/4.0/).