1. Introduction
Due to recent regulatory changes and international initiatives to reduce climate change effects and, as a consequence, CO2 emissions, many international regulatory administrations are designing plans that aim to reduce fossil fuel use in their respective electrical systems. Renewable energy (RE) can ensure fast and reliable carbon free electrical production but, the intermittence of many of the RE sources poses a risk to electrical grid systems both in terms of ensuring their stability and maintaining a stable and competitive electricity price. As a consequence, a RE transition must be applied gradually and manageable sources or energy accumulation, among others, are mandatory.
Renewable energy plans mainly rely on use of photovoltaic solar energy (PV) and wind energy as renewable energy sources, especially considering the recent importance of specific cost reductions. Despite an increase in novel energy storage systems and the contribution of traditional RE manageable sources, hydro energy and pumped hydro energy are the most promising important manageable storage systems in energy systems. Concentrating solar power (CSP) plants use a solar concentration system that aims to elevate the temperature of a working fluid that is later used in a power cycle. Therefore, these plants are also known as thermosolar energy plants [
1]. There are several types of CSP plants, but the most important ones are tower plants and parabolic-trough collector plants:
Parabolic-trough collector plants use a solar field with parabolic collectors whose target is to concentrate solar beams towards a receiver tube located in the collector focus. A heat transfer fluid that flows through the receiver tube is used, usually a synthetic oil, and is heated up to 400 °C. Parabolic-trough collectors use a system to reorient them to function in the incident direction of solar beams to maximize power generation. Thermal energy from heat transfer fluid is used, by means of a heat exchange system, to generate steam that is expanded in a power cycle.
Tower plants use flat mirrors named heliostats and there is a tower where a central receiver is installed. These heliostats work by concentrating solar radiation in a receiver that produces considerably higher temperatures than in parabolic-trough plants. Heliostats also have a system that allows them to reorient according to the incident direction of the solar beams. A receiver installed in the tower uses a fluid that flows through it, which is heated to finally produce electricity using a steam generation system where water steam is expanded in the turbine for generating electrical power.
Currently, natural gas (NG) markets are conditioned by stable price increases, which especially affect regions with high dependency and lack of NG production. NG prices have increased significantly due to markets tightened by increasing demand, supply bottlenecks, high winter demand, and increasing droughts during summers (lowering hydro generation) [
2]. Many European countries are aiming to decarbonize electricity generation and to increase RE system penetration and, simultaneously, to reduce or eliminate conventional manageable generation plants, especially coal plants. Due to the lack of RE generation and also due to the need for plants to match peak demand, many markets have experienced a significant and unexpected increase in their electrical prices as a consequence of high NG prices in the international market [
2]. For example, spot prices for electrical production in Spain have increased from an average of 44 €/MWh to 200 €/MWh, since January 2021 until October 2021, reaching values higher than 300 €/MWh. This fact is similar in all the European regions, due to their high dependency on NG, delivered using liquefied gas (using sea transport) or pipelines. Spain produces a high share of its electricity using RE and, although the installed capacity power is quite high for both wind energy (WE) and photovoltaic solar energy (PV) in Spain, the low-capacity factor and the intermittence of generation make it necessary to use nuclear energy (NE) and combined cycles (CC) to ensure grid stability and to match energy demand, similar to that of other countries.
As a consequence, manageable RE sources, that include many types of energy storage systems are necessary and can significantly contribute to both cost reduction and to grid stability. Nowadays, most of these electrical systems mainly rely on hydro energy as the only technology that can be regulated to match energy demand. Electrical storage, using batteries or hydrogen, can help improve this situation but large-scale systems still lack the competitivity for mass adoption. Furthermore, raw materials for batteries are increasing their prices, because it is difficult to match supply and demand; the situation will become more problematic with increasing demand associated with self-consumption PV systems and electrical vehicle (EV) deployment.
The transition to the objective of net zero emissions by 2050 is causing a deployment of low-carbon gases aimed at decarbonizing the gas system; however, this deployment must be supported by policies aimed in the short to medium term that must prepare for the intended massive transition for gas systems and industry. Policy makers and system regulators need to take into consideration supply security and the challenges that are already emerging in this transition.
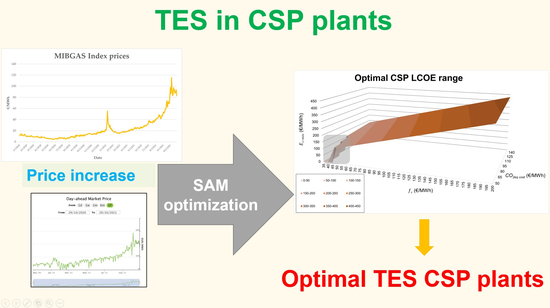
This research proposes using an optimization process, to design CSP with an optimized energy storage system for each particular location to maximize the availability of energy in the periods when manageable energy is required to complement the RE generation in order to match demand and, consequently, reduce or avoid the use of NG. The utilization of CSP plants with thermal energy storage (TES) for electrical generation systems can contribute to grid stability, price forecasting, and price control, due to their manageability capacity.
The techno-economic evaluation of a CSP plant with thermal energy storage (TES) and using System Advisor Model (SAM) has recently been studied from different points of view: considering the viability of the different TES technologies [
3], modeling the CSP system for determine the optimal operation of the plant [
4], optimizing a case study in Africa [
5], and using dynamic simulation to analyze a CSP hybridized with both TES and natural gas [
6]. However, none of these studies carried out the optimization of CSP with TES using SAM considering the factors that were used in this work, such as direct normal irradiance (DNI), solar multiple (SM), tower height, and TES capacity. Previous research has focused on model validation and the design of CSP plants but further research about grid integration and market implications is required.
In regions where these plants are economically and technically feasible as a consequence of the optimal solar radiation conditions and land availability, they should be considered as one key part of the generation mix, especially in the transition to zero emission systems. In many locations, such as Spain, other southern European countries, and also in other nearby countries such as Turkey or Morocco, the climatic conditions are optimal. Moreover, the effects of climate change are affecting the availability of water and, consequently, the share of hydro generation in grid generation will be reduced. In this scenario, water use will be prioritized for human or agricultural use, making it more difficult to program hydro generation as part of future power generation. The energy storage ability of CSP can be used to produce electricity that can be injected into the grid when required, although instant generation is not available as a consequence of low radiation or lack of it. Desert regions are also increasing as a consequence of climate change effects and this problem will pose a substantial risk in future years; these regions can be optimal locations for CSP plants due to the lack of other land uses. This technology could also be of great interest for small or isolated power systems, such as those existing on islands, for example, in the Canary Islands. Previous research has mainly focused on CSP plants modeling validation, system optimization, and energetic approach [
1,
2,
3,
4,
5,
6]. In this paper, previously validated models are used to propose an optimization scheme using the SAM software, in order to design plants of optimal size, which can act with a manageable renewable energy source in a spot market. In addition, these plants could help control the final price of electricity by using carbon free generation to replace natural gas-fired plants. The novelty of the research is focused on the ongoing situation of high electrical energy prices that, consequently, is impacting the final price of electricity in the spot markets where a marginal price calculation is established. The following sections present and analyze the proposed optimization scheme and the analysis of a case study in Spain. The methodology and results can be used as an example roadmap to be used in other locations.
1.1. Deregulated Power Markets
Deregulated power markets are one of the most common operational and regulatory power systems in the world. In Europe, the power market operates under a mixed scheme where the transport system operator (TSO) is generally regulated and operated by the government, while the spot market (price fix mechanism) uses an auction scheme. Under an unregulated spot market, there are many different price calculation methods. One of the most common, and the solution adopted in Europe, is the marginal price calculation [
7]. This means that the most expensive technology and, therefore, the most expensive offer price, sets the spot price and all the generators (both renewable and not renewable) bear this price. In this section and subsequent subsections, the spot market with a high share of RE is analyzed and the high influence of manageable sources (natural gas) is demonstrated.
Power Market in the Iberian Peninsula and Spain
The Iberian Peninsula integrates a power market including Portugal and Spain. This market, and particularly Spain, operates under a deregulated market for energy production, although some aspects, such as grid maintenance or general costs, are regulated by governmental organizations, Under this scheme, electricity cost is divided in two billing blocks for all consumers: (1) energy cost and (2) other costs, which include access fees and system costs. In a spot market, the hourly energy price is calculated under an auction scheme. Base load is matched using nuclear energy, PV, wind, NG, hydro, and other small RE sources [
8].
Recently, extensive research has been developed for markets under a transition process to net zero emissions. The Spanish system is one of the most extensively analyzed due to its particular characteristics, i.e., a high increase in the RE share, extensive good locations for PV and wind energy, and external dependency on fossil fuels production (natural gas) [
9]. Different studies have proven the feasibility of a transition to 100% decarbonized power systems and long-term decarbonization of the generation system but, during this transition period, it is necessary to adapt the electricity mix to these new requirements and ensure stability and manageability [
10]. The roadmap to this decarbonized system also includes financial, regulatory, and fiscal initiatives and, due to its similarity with other power systems, it can be extended to any other region worldwide [
8]. Regarding the RE effect, research on the final price effect shows that RE generation decreases day-ahead electricity market prices, complex orders alter prices in aggregate supply curves, and the minimum income condition complex order regulation results in an increase in electricity market prices [
11].
In the Spanish electrical system, considering the latest available data on the peak power capacity installed in the Spanish Peninsula, which excludes islands, the maximum power generation capacity is 105.22 GW, and RE sources account for up to 55.8% of this capacity [
12].
Figure 1 shows the electricity demand coverage for the maximum hourly demand coverage on the Spanish Peninsula (excluding islands), in 2020 [
13].
The power generation structure is shown in
Figure 2a, for the last available data (December 2020) and
Figure 2b shows a comparison between the installed power capacity and the generation share.
The Iberian electricity market operator (OMIE) includes a market structure shared between Portugal and Spain. As presented before and according to European regulations, the hourly price is calculated under a spot price market based on an auction process and the final price typology is a marginal price calculation, which implies that all electric generators receive the same amount [
14,
15]. This price calculation indirectly causes the most expensive generation source to set the hourly price, and therefore, power generators relying on international commodities prices have a significant effect on the final price [
12,
13]. This research presents a novel optimization algorithm and strategy to design CSP plants that can produce carbon free energy with the possibility of integrating production manageability, by means of thermal storage systems, and therefore, match peak power requirements without the need for natural gas-fired plants. The optimization methodology and results are presented for Spain and are of great interest for any other location with the right climatic conditions for CSP technology.
2. Analysis and Methodology
The present research analyzes the significant influence of fossil fuel (FF) prices in the international market on final spot prices in the OMIE market, considering the potential of optimally sized CSP plants with thermal energy storage (TES) to participate in price formation and to stabilize it. An optimization algorithm for the CSP plants is presented.
The data and the methodology of the research can be summarized as follows: An offer cost model for a spot market is presented and justified, in order to propose a model that can calculate the minimum offer prices that generators can provide. Later, for the proposed case study, a general description of the energy generation sources and their participation in production is presented. In addition, the general operation of the power spot market and the evolution of costs are analyzed, including the influence of increases in natural gas prices on final prices.
To create the optimization scheme, the fuel prices are collected and analyzed for the Spanish market. Then, the SAM software is used to optimize a CSP plant with an optimally sized TES system that allows the generation plant to operate without solar radiation. Therefore, the power plant fueled by renewable energy can, consequently, replace the natural gas electric power plants to match peak demand. Finally, the economic behavior and the economic benefits are presented and analyzed in order to propose final recommendations and propose a research roadmap for similar cases.
Due to the nature of renewable energy (RE) plants and the intermittency of RE resources, and according to power generation structure (shown in
Figure 2), combined cycle natural gas (CCNG) plants are critical to match power demand and, consequently, have a significant influence on final spot prices. These spot prices are determined by international purchase costs of natural gas (NG) that have recently suffered a significant increase (period 2020–2021) as a consequence of the situation of international markets. The purchase of NG is regulated for the Iberian market by MIBGAS (Iberian gas market) and reference prices have suffered a significant increase in the aforementioned period, as shown in
Figure 3 [
16].
This international scenario is causing a sharp rise in the spot price in the Iberian market and, consequently, final prices are experiencing an increase that is affecting competitiveness, heating costs, agricultural prices, and the viability of small companies, among others. The NG price increase is affecting all the actors in the international markets and, consequently, the power systems that depend on NG power plants are suffering an important increase in their energy prices.
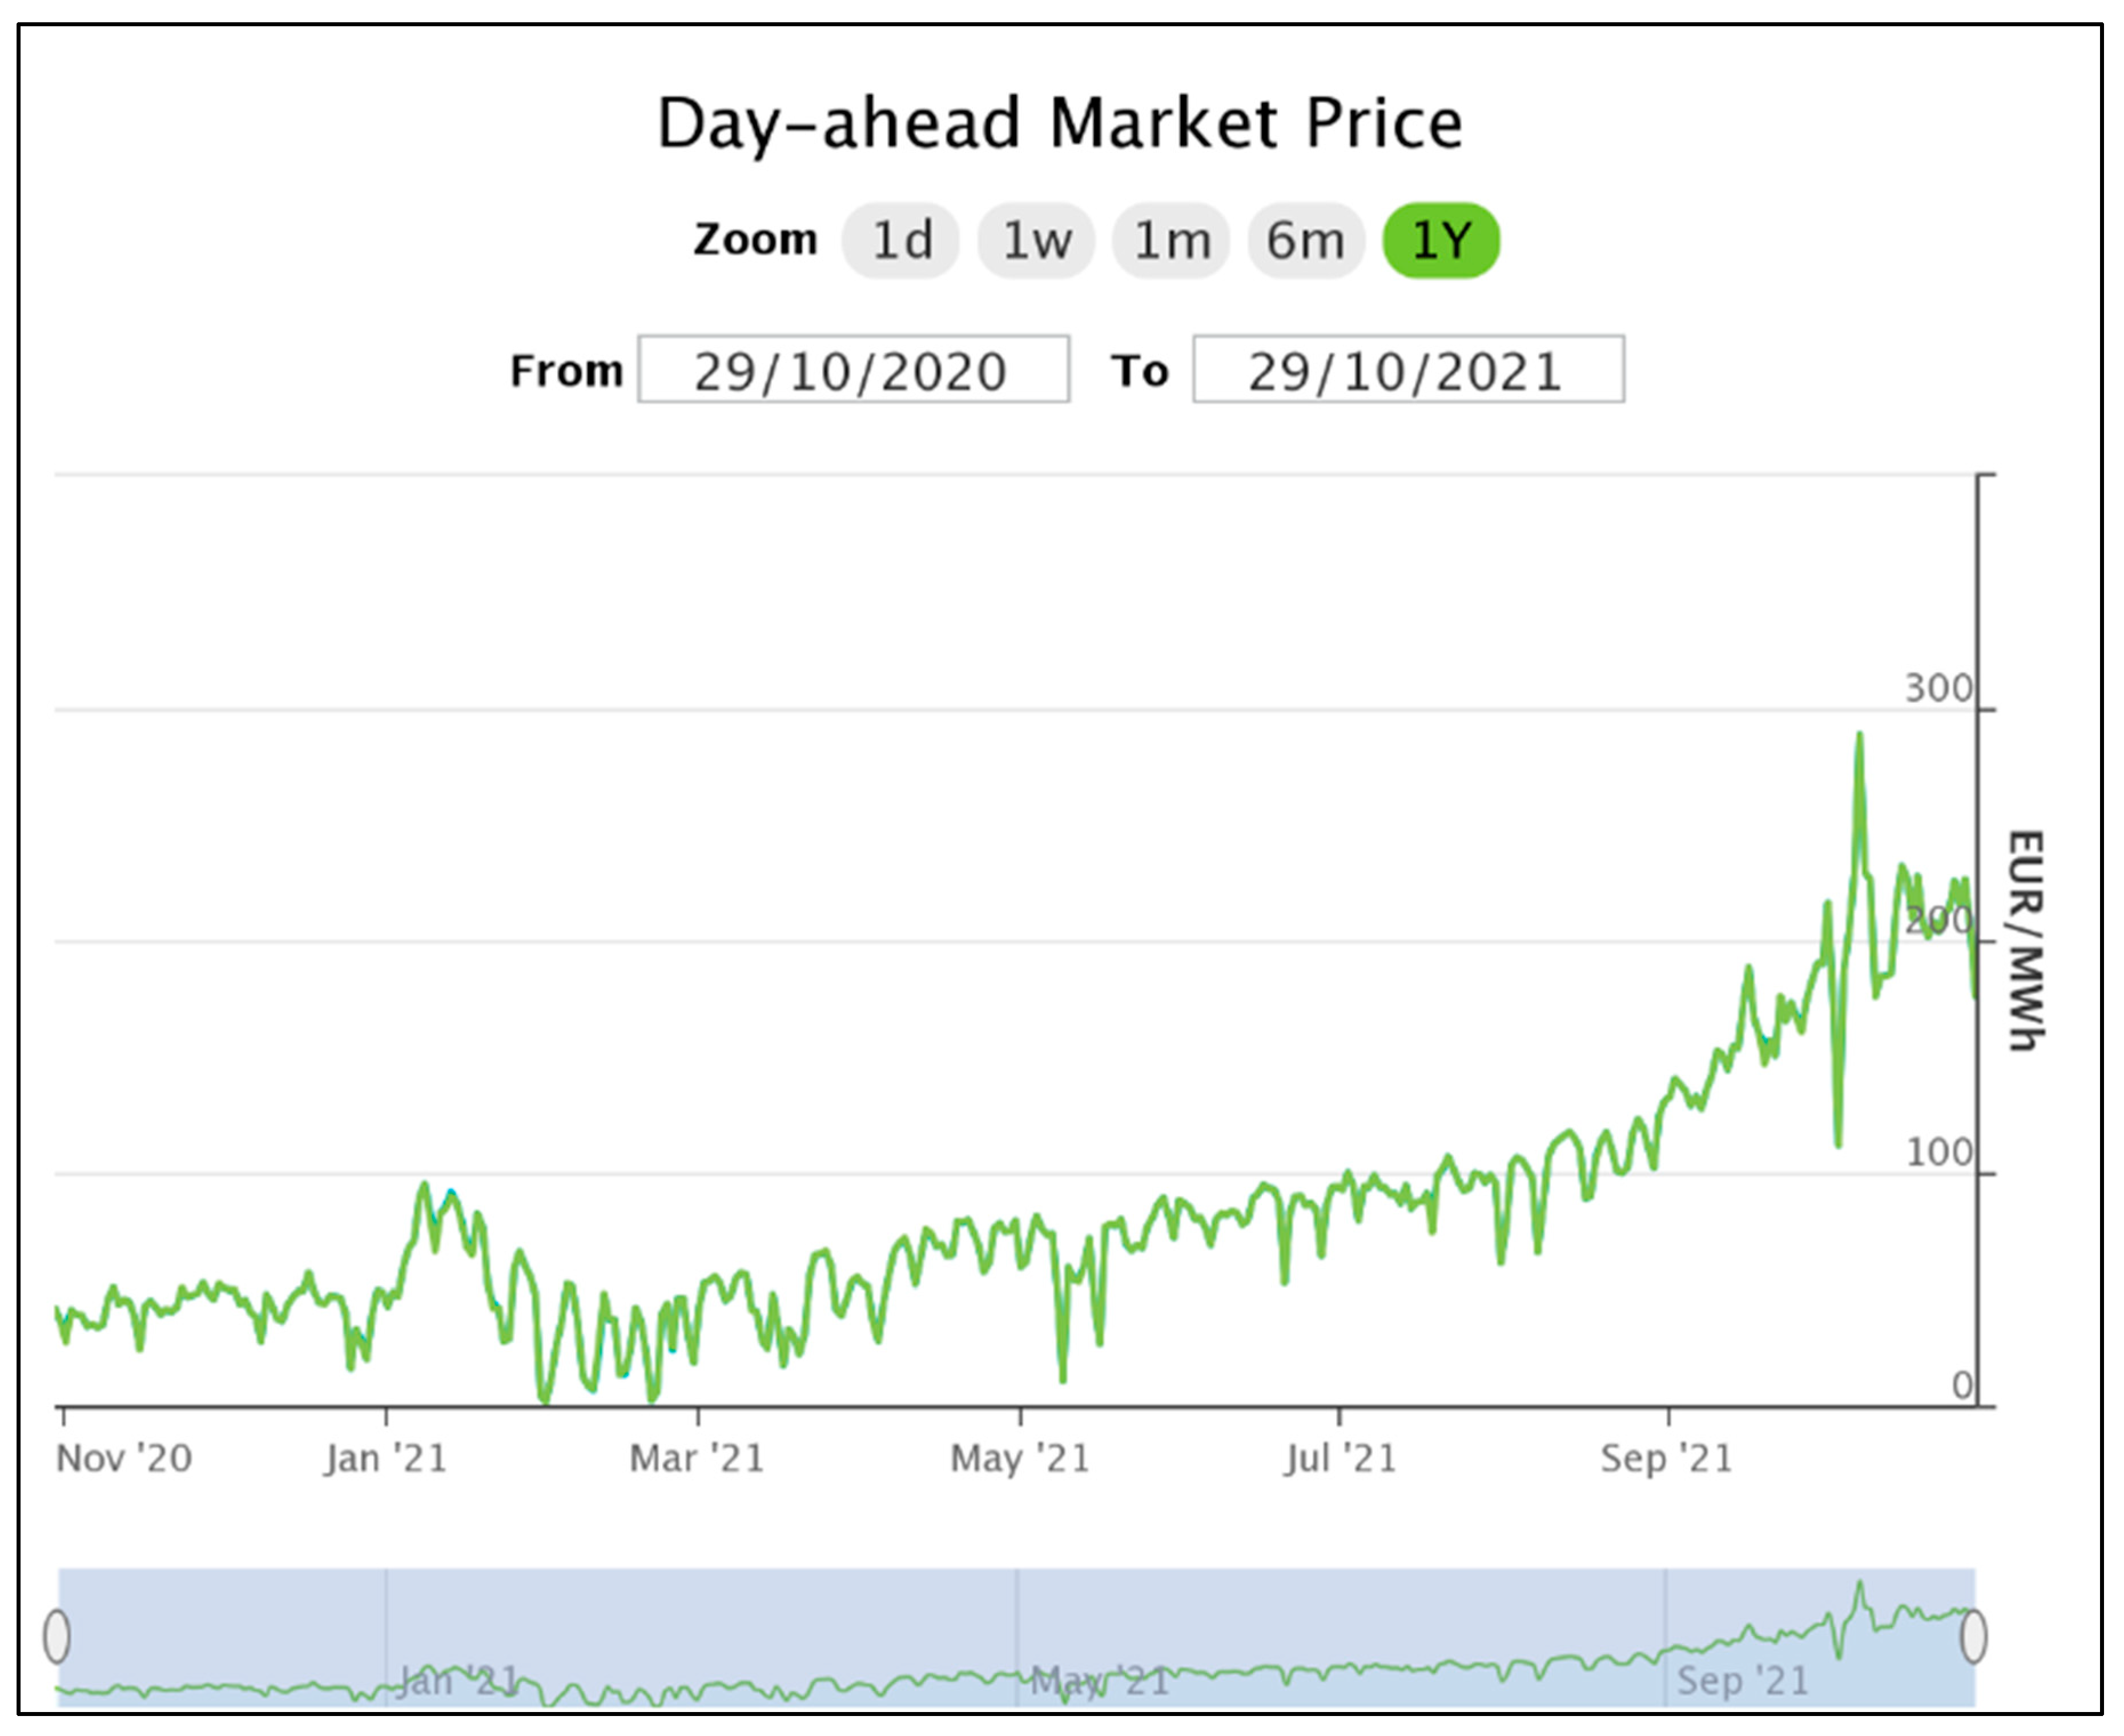
Figure 4 shows the variation in the final average daily price of the electricity market in Spain, for the OMIE market, which includes both Spain and Portugal. As shown in the figure, the price has changed from an average of about 45–50 €/MWh up to a range of 150–200 €/MWh with peaks of up to 275 €/MWh in less than a year. A marginal price structure, as previously mentioned, causes this market distortion [
17].
The use of CSP systems with TES can act as a manageable RE source and, therefore, can be used when there is not enough RE generation available. It would be the more important large-scale manageable RE generation source, excluding hydroelectric energy that is regulated not only based on an energy criterion but also on environmental and agricultural aspects [
18]. In the following sections, the complete optimization model and flowchart are presented, and the conclusions are presented and analyzed. The international implications of the results are extensively compared with previous studies [
19,
20,
21].
2.1. Minimum Power Costs and Offer Price
As shown in the previous sections, the method of calculating the marginal price in a spot market indirectly causes the most expensive source of generation to set the final cost per hour. This generates a distortion in energy prices that are greatly affected by dependency on fossil fuel and high fossil fuel costs. During the last months of 2021, NG prices increased due to the lack of enough offer to match demand at a competitive price and the situation will remain in the following years. The high dependence on fossil fuel of many energy markets, combined with the intermittency of RE sources, makes it necessary to use manageable plant fossil fuels to match demand and generation. The increment of final energy costs has affected the manufacturing companies, families, and small companies, among others.
Considering power plant efficiency (
) and fuel cost (
fc), the associated cost for fuel in any power plant (
Efuel) can be calculated using Equation (1):
For the power markets studied in this research and under a deregulated energy price spot market, the generators offer an energy price that is based on fuel costs (if any) and related CO
2eq emission taxes. The emissions for each fuel are calculated using the specific emission factor (
) for each fuel (
f) and taking into consideration the emission costs in the emissions market, the associated emission costs are calculated. Finally, the operational, financial, and other costs must be included and also the unitary benefit for the generator is considered. Taking all these terms into consideration, for each energy generator in the spot market, the offer price can be calculated as shown in Equation (2):
where:
(€/MWh) is the minimum specific energy cost offer;
($/€) is the exchange rate $/€ (applies when the cost of fuel is in $/MWh);
(%) is the power plant efficiency;
(€/MWh) is the fuel cost;
(CO2eq/MWh) is the specific emission factor for fuel (f);
(€/CO2eq) is the specific CO2eq emission factor cost;
(€/MWh) is the O&M costs;
(€/MWh) is the financial and amortization costs;
(€/MWh) is another costs, including taxes and regulatory taxes;
(€/MWh) is the operational unitary benefit.
If no unitary benefit is considered, will be equal to zero. Due to the generation structure and power grid system in the Iberian Peninsula, which is similar in many other different locations, combined cycle natural gas (CCNG) plants are fixing the spot prices and, as a consequence, NG purchase costs are directly related to final spot price on an hourly basis. Considering that a company would only consider the and the in their operation, the is the lower price that the company can offer only to cover direct operational costs. This price is calculated in this research as the minimum offer price (MOP) and can be calculated for different fossil fuel power plants (FFPPs). The MOP is calculated for CCNG plants (using NG as fuel) and for coal-fired plants (CFPs) for both imported and national coal. Therefore, the case study studies an imported coal-fired plant (ICFP) and a national CFP (NCFP). An imported CFP is one that uses imported coal, when national coal production is not possible.
For an imported CFP, a coal with a reference value of 6000 kcal/kg, typically in the international market, is assumed. Nowadays, for the Spanish electricity market there is no national carbon production and, therefore, no national CFP operates. For comparison purposes, a case study considering a European strategic reserve that would ensure a minimum yearly operation time of 1500 h and an estimated cost of 81 €/MWh will be used. Considering these parameters, the
for each power plant (CCNG, ICFP, and NCFP) is shown in
Table 1 and in
Figure 5.
These results show that considering these parameters, the possibility of reducing the final spot market price is quite low, due to the marginal price market structure that is determined by fuel prices. As mentioned before, the use of manageable RE sources can be one of the only possible solutions in a market so dependent on fossil fuel prices because they can be used as a substitute in GN plants.
2.2. CSP Plants Optimization and Spot Price Reduction
In this section, an optimization methodology for CSP plants in power systems in a transition process to zero emissions systems is proposed and its feasibility is analyzed using a case study. Optimized CSP plants with TES provide a solution for RE generation with manageable production in locations with adequate climatic conditions. This capacity to act as a manageable energy source can, consequently, help control and reduce the spot price in situations when manageable generation is required to match demand [
22].
The proposed optimization methodology is based on the use of the optimization tool available in the System Advisor Model (SAM) software. The System Advisor Model (SAM) software is a complete free tool for techno modeling and is used for project evaluation in the renewable energy industry. The SAM CSP models evaluate several different types of CSP systems that consist of a field of concentrating mirrors that focus direct sunlight on a receiver and transfer heat to fluid providing heat to a Rankine power cycle that produces electric power [
23].
The model evaluates different systems including parabolic-trough collectors with an oil or salt heat transfer fluid and with the possibility of thermal storage, power tower with molten salt and optional storage, and direct steam without storage. In addition, Dish Stirling and linear Fresnel using molten salt and optional storage or direct steam without storage can be simulated. SAM also includes Industrial Process Heat (IPH) models for systems delivering heat directly to a thermal process.
In this research, the CSP SAM model is used. It uses optical efficiency tables for solar field simulation and can be used to model any kind of CSP system for electric power generation. It also includes a CSP performance model that can be combined with financial modules to calculate financial and cash flow metrics. The SAM CSP model has been validated by direct comparison with the physical trough model and molten salt power tower plants using real data from CSP plants in Spain, i.e., Andasol-1 plant [
24] and Gemasolar [
25]. A short-term forecast of DNI for operating plants using SAM simulations for a plant similar to Gemasolar is presented in [
26].
Therefore, the SAM analysis and optimization tool [
27] is used for the whole system design in order to ensure the generation of carbon free electricity that is also available in the absence of solar radiation, using the energy stored in the TES. Future developments and applications of the SAM model for plant optimization include the use of artificial intelligence models that can use the validated CSP energy model to interact with machine learning and deep learning algorithms, to optimize plant design and operation, and to analyze existent data for different variables such as power demand curves or weather conditions, among others.
The design and optimization flow are illustrated in the flow chart shown in
Figure 6.
CSP Plant Configuration
To optimize the CSP plant, the operational and control parameters must be introduced in the SAM optimization tool and the parameters to be optimized must be defined [
28].
In this analysis, a plant located in southern Spain is used. To consider the weather conditions, the TMY file for the location is used for the modeling, analysis, and optimization process. A subcritical plant, with a rated power of 115 MW is used and the main plant operational parameters are presented in
Table 2, where HTF is hot thermal fluid.
The CSP plants can be divided into three main subsystems, based on the subsystem functionality [
29]:
The solar field is based on heliostats with an area of 91 m
2 (considering the average commercial systems) and with a specific cost fixed on 360
$/m
2. The TES system uses a thermo-solar grade molten salt. Molten salt technology is used as it is a mature technology that can ensure correct performance and match the project requirements [
30], being the most extensively used storage system. For the heliostat field, the design point parameters used in the SAM are shown in
Table 3. The solar multiple (SM) is one of the most important design parameters for a CSP plant. The SM is defined as the ratio between the thermal power produced by the solar field at the design point and the thermal power required by the power block at nominal conditions and it has an important influence on the global plant performance and behavior. It can be considered that an over-sized power plant (having a SM > 1) produces more energy at full solar power intake than the motor can transform. Therefore, it needs storage facilities to divert the power surplus [
31].
A CSP can use a hybrid heating system, based on NG burners, biomass hybridization, or waste energy systems, among others [
1]. The general schematics of the plant are shown in
Figure 7. In this research, there is no auxiliary heating system, and the operation strategy can be adjusted to operate only generating electrical power, charge TES system, or a mixed strategy. In the case of a lack of solar radiation, the energy storage in the TES will be used for power production [
32].
The design parameters shown in
Table 3 were used for the optimization and, consequently, the DNI, SM, and STH were considered as parameters [
33,
34,
35]. For the optimization strategy, three different parametric combinations were studied:
Optimization of DNI, SM, and STH (three variable parameters simultaneously);
Optimization of DNI and SM fixing STH (two variable parameters);
Optimization of STH fixing SM and DNI (one variable parameter).
These parameters were used to optimize the heliostat field size and the tower height and receiver height [
18]. Considering the results, a sensibility analysis was carried out with the results, in order to analyze the importance of the parameters in the global system performance and, particularly, in the levelized cost of energy (LCOE) [
36]. The results are discussed in
Section 3.
3. Results and Analysis
In this section, the case study results are presented and analyzed. The design and operational results, the LCOE, and the influence in the power spot market are presented, and the benefits of the optimized CSP plants are demonstrated.
3.1. Minimum Spot Price Calculation
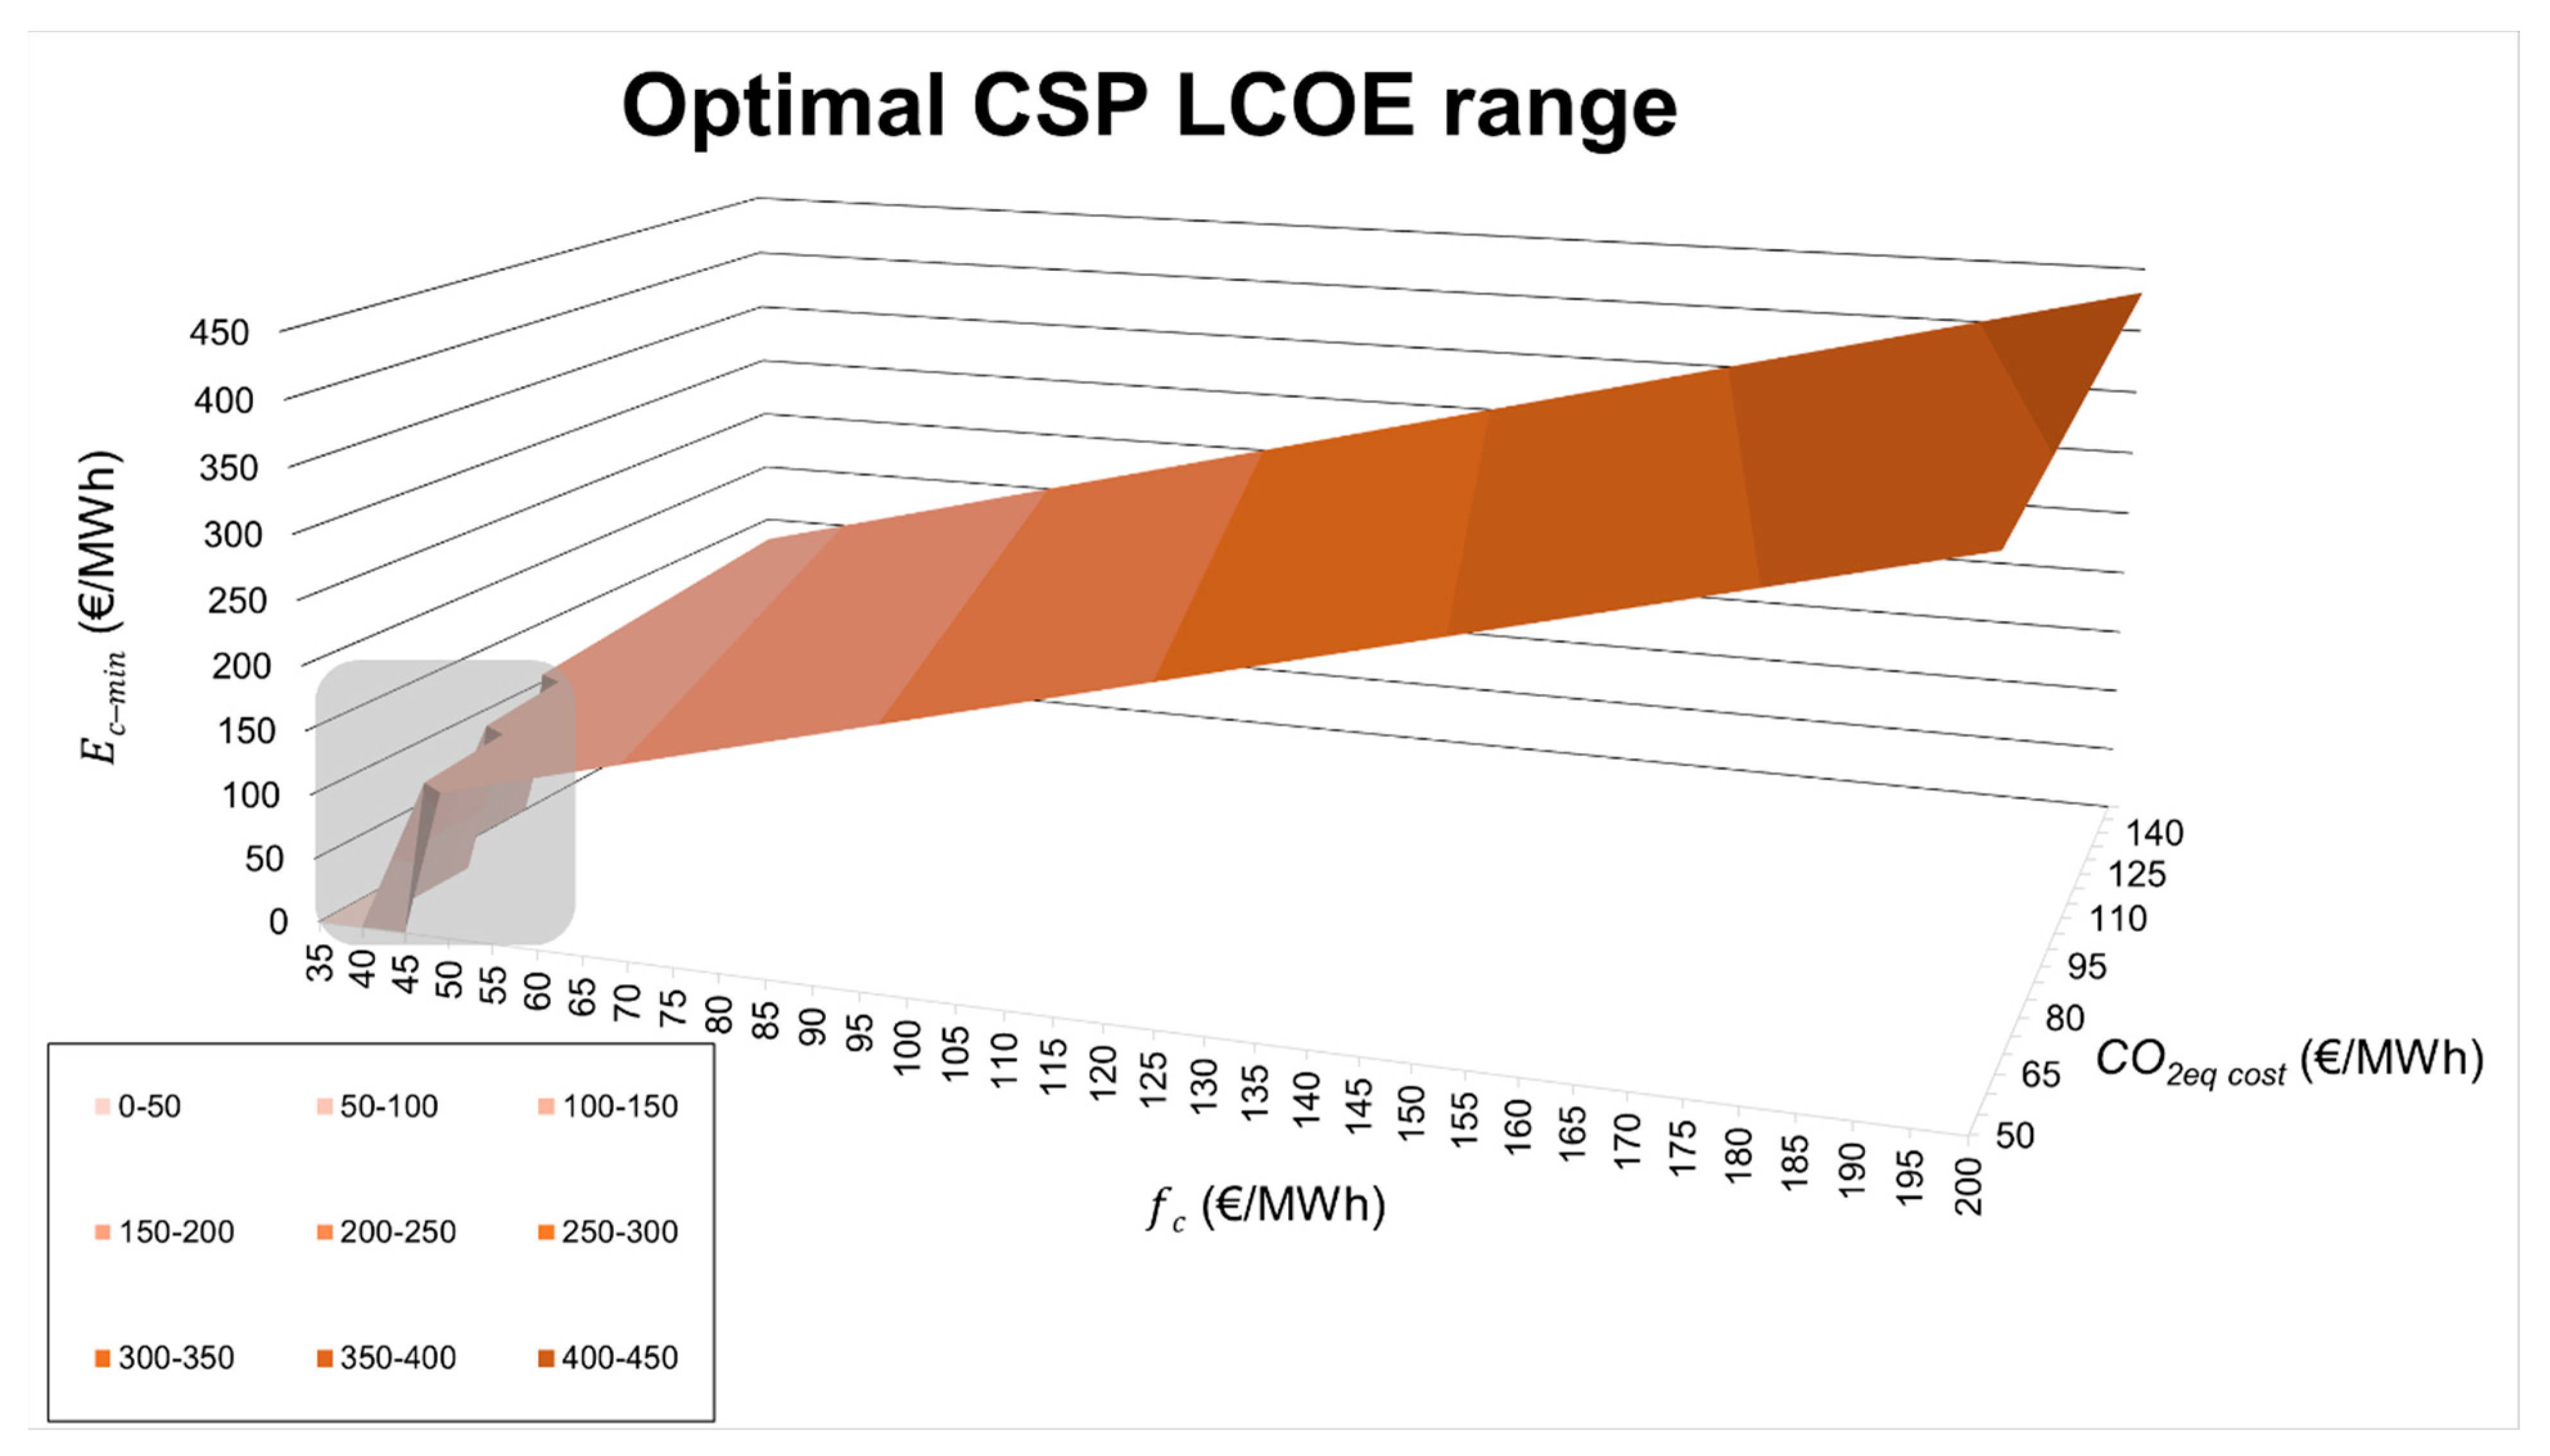
Considering the calculation methodology showed in Equation (2), the
costs can be calculated for any generation system and fuel, considering all the associated costs. In this research, the costs are calculated for different scenarios of fuel prices for CCNG plants. For the parametric study, fixed values of
range from 35 €/MWh to 200 €/MWh and for
from 50 €/CO
2eqt to 140 €/CO
2eqt. These two parameters lead to
costs ranging from 86 €/MWh to 431 €/MWh, with the high impact on final price. The results are shown in
Figure 8.
These results justify the need for a manageable source that can contribute to a price decrease and stabilization because, as mentioned before, the results of the marginal price of each hour in the spot market will depend on the most expensive generation source, causing a significant distortion in the market. These fuel-based manageable sources are usually used only to provide a small part of the total demand; nevertheless, they have a significant impact on the whole power system and on all consumers. For comparison and validation purposes, an optimized CSP plant using the proposed methodology is analyzed and its offer prices are compared, to analyze if it can offer a good solution to provide manageable RE generation.
3.2. Optimization of a CSP Plant with TES
Considering the three different optimization strategies mentioned in
Section 2, the results for all of them show an optimal plant with the following parameters, using the optimization tool in SAM:
DNI optimal, 700 W/m2;
SM, 2.8;
STH, 16 h.
The operational strategy for the plant is defined for two typical meteorological days, a winter day and a summer day. The storage and generation strategies are shown in
Figure 9 for a winter day and in
Figure 10 for a summer day. For each day, there are two points where the field cycle generation and TES converge. In SAM, the plant operation is fixed in the control interface dividing each day into different operation periods, each of these periods being individually modified. The period is divided into two subperiods (a weekly operation and weekend operation) and three periods of operation are estimated during the week (a night period from 8 p.m. to 7 a.m., a daytime period from 7 a.m. to 2 p.m. and from 4 p.m. to 8 p.m., and a daytime meal period between 2 p.m. and 4 p.m.). The turbine strategy control is different for these periods because the nominal power of the turbine in Periods 2 and 3 is increased by 5%, since these are the periods with the highest solar radiation and these periods are assumed to be the electrical grid peak demand.
For a winter day, two stages in the operation of the plant are defined: In the first stage, the energy is supplied by the storage system (TES) loaded the previous day and, in the second stage, the energy comes from the solar field; both stages converge in a period that approximately coincides with sunrise and sunset. In the model, the results show that the nominal power cycle varies according to the fixed control strategy of increasing the turbine power up to 5% higher than its nominal power in the hours of greatest solar intensity. For a summer day, the charge and discharge periods (
Figure 9 and
Figure 10) converge (crossing lines green and dotted red) due to higher solar radiation and light hours.
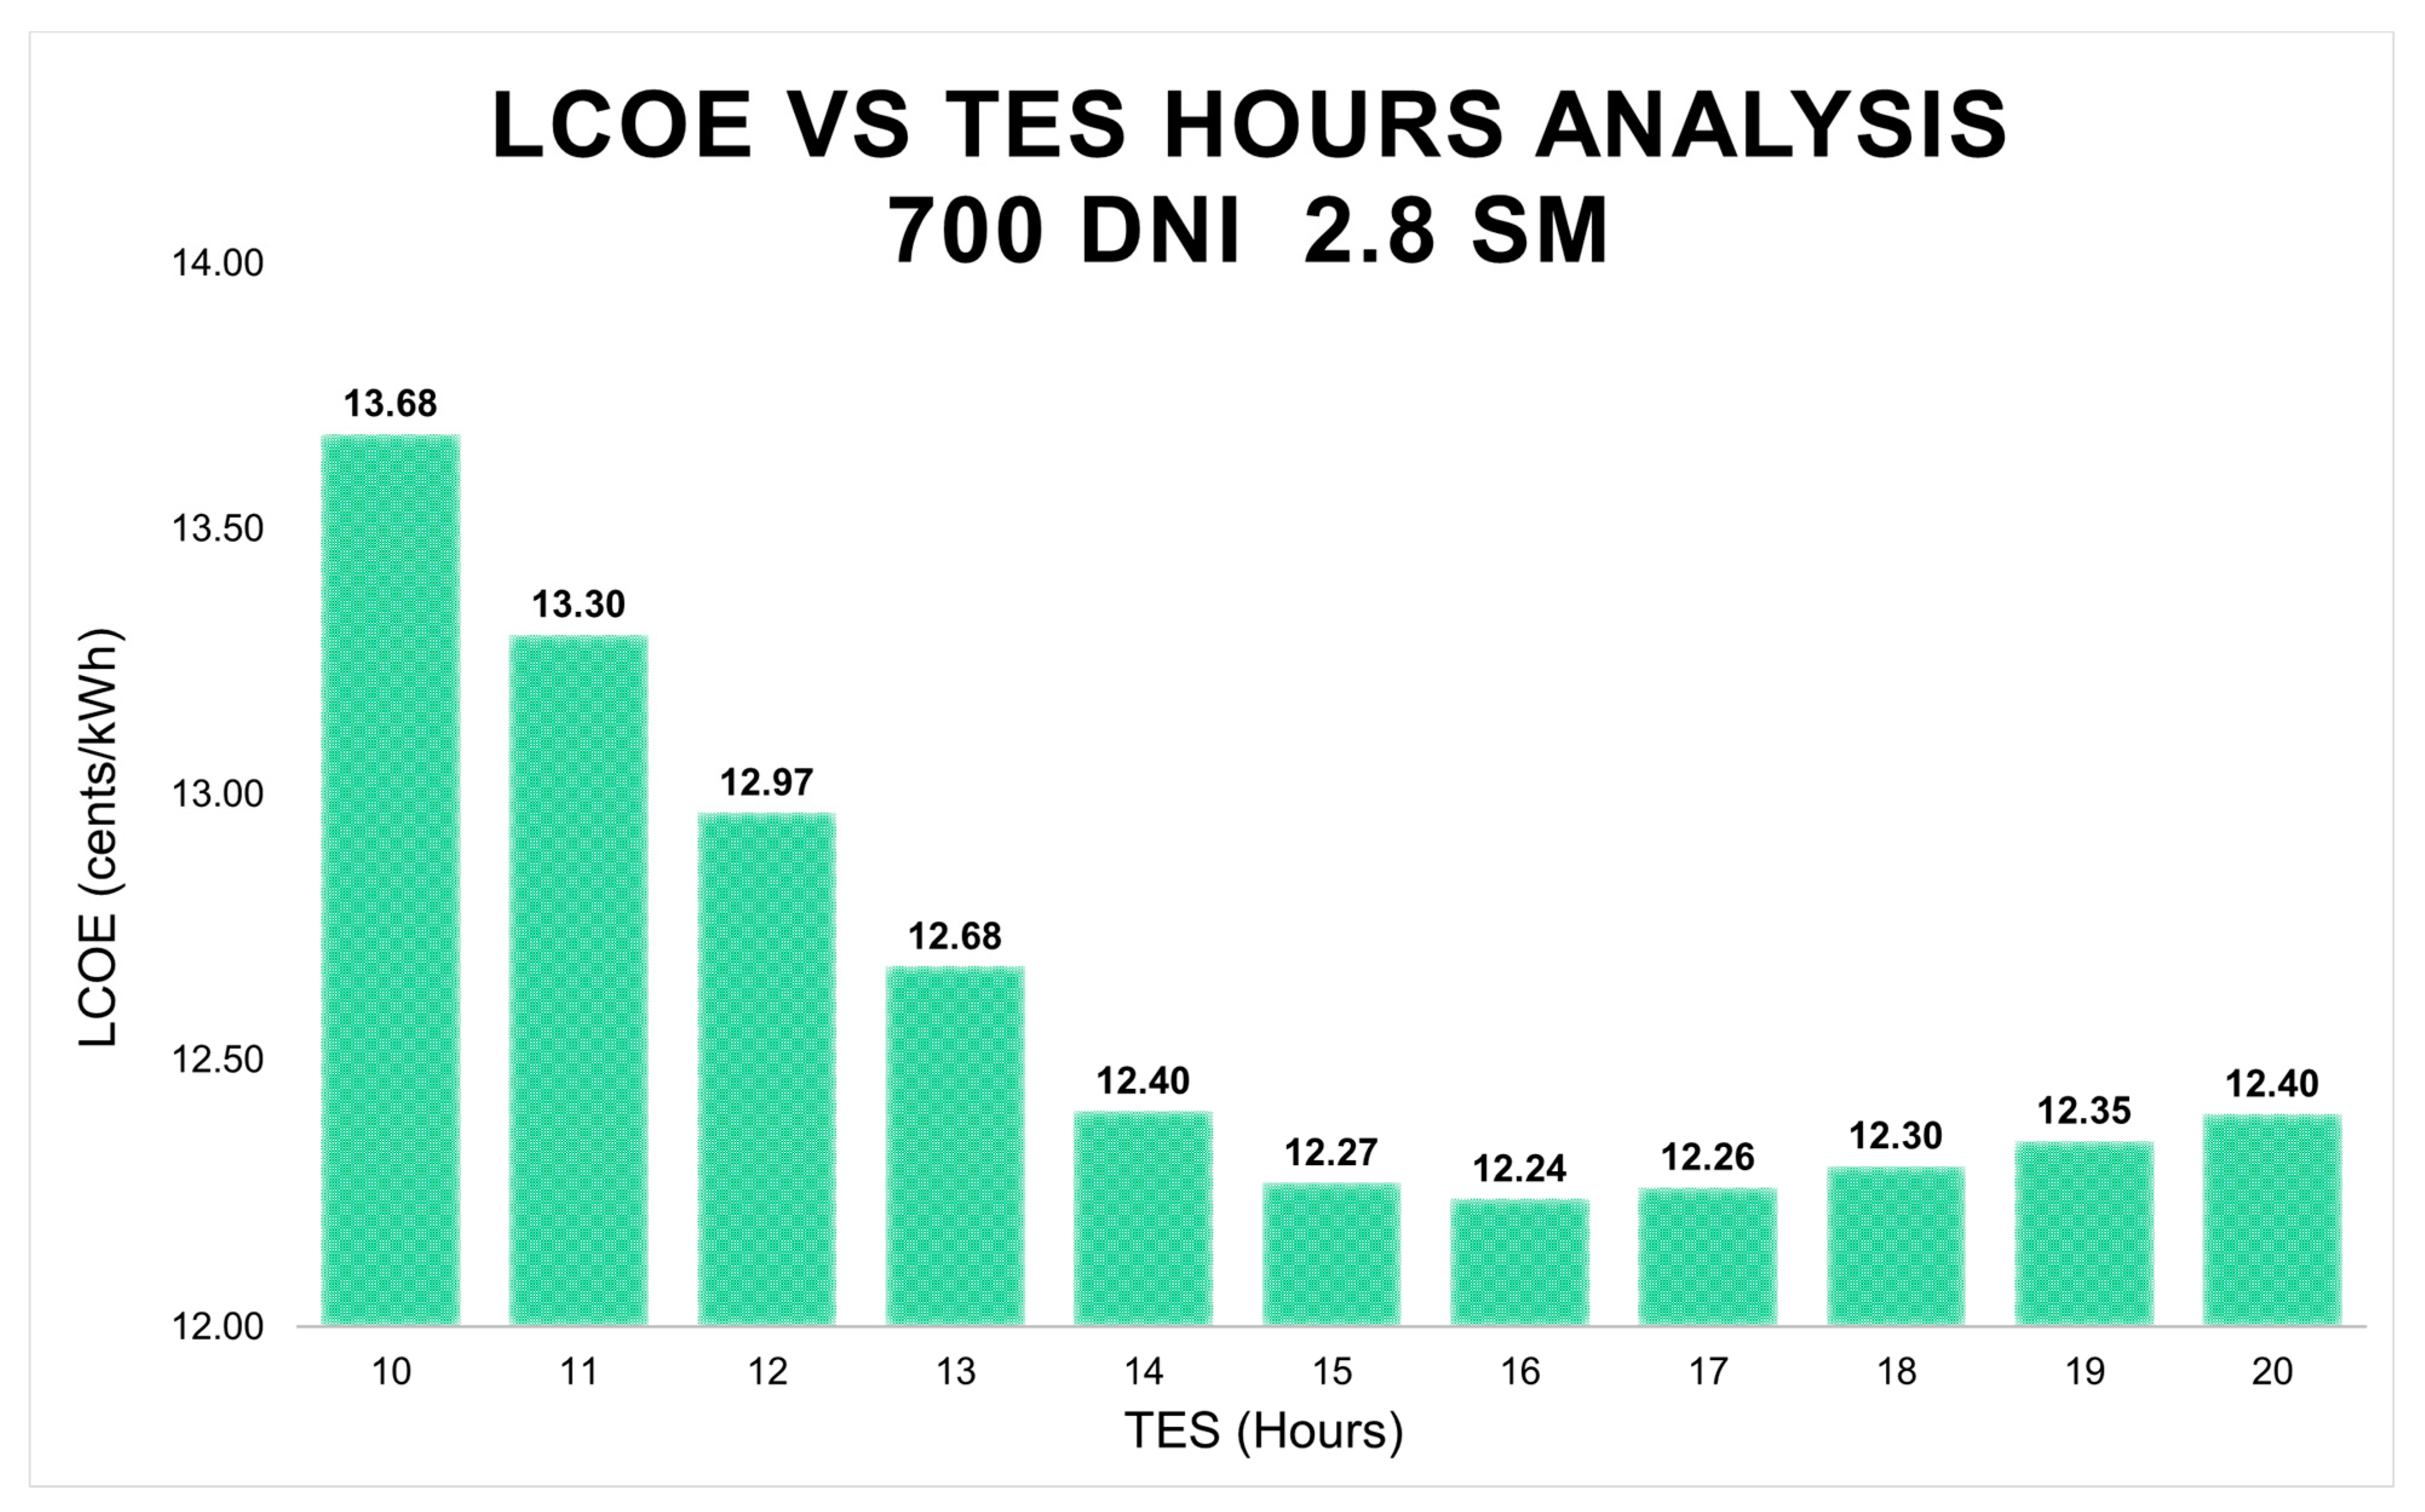
The hourly balance is used to analyze the STH operation. Despite the homogeneity of the results, the other considered variables vary, as analyzed below. It is important to note that the optimization algorithm suffers an indirect effect caused by the variation of DNI and SM. If these parameters increase or decrease, the heliostat field size increases or decreases, respectively, and, as a consequence, the thermal power of the field as well as the STH will vary. The main results for the optimization are shown and analyzed in following sections.
Figure 11 shows the optimization results when the optimal STH is 16 h.
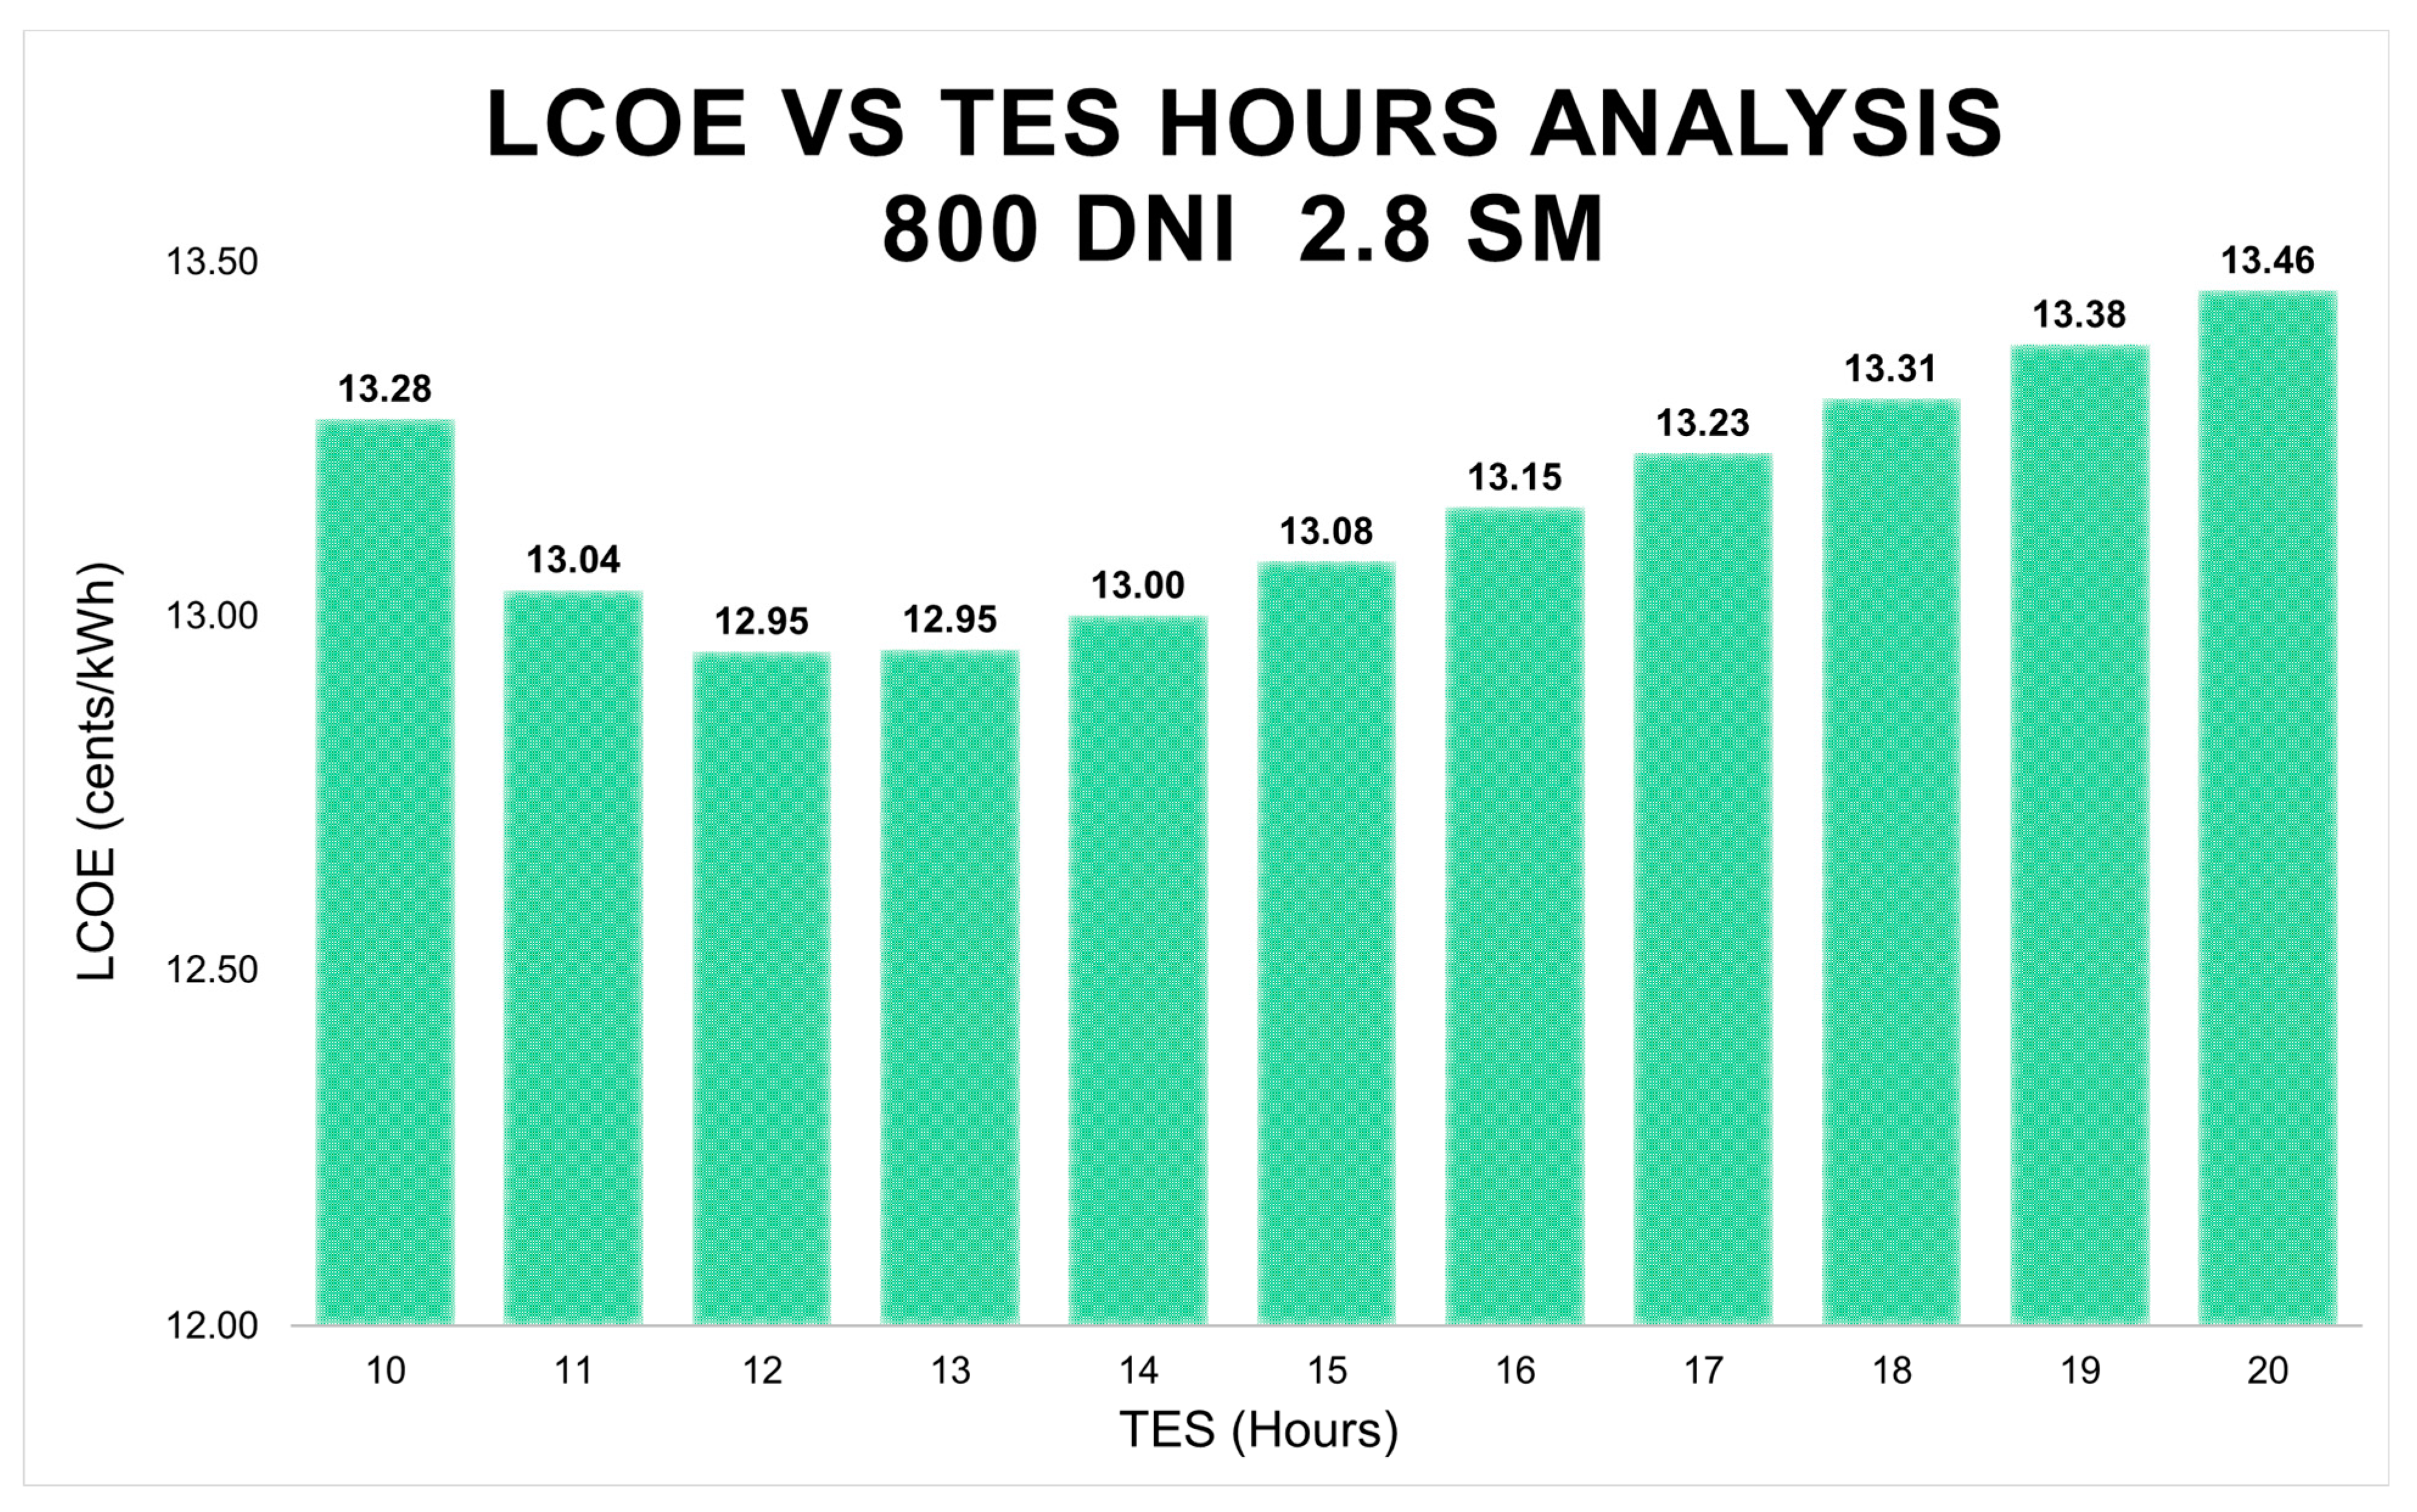
Figure 12 shows the results when the DNI is increased and, consequently, the heliostat field size is close to the maximum DNI in the location. Consequently, the solar field is undersized, and therefore, the storage thermal energy does not make the initial storage hours profitable, making it necessary to reduce the STH to increase the LCOE.
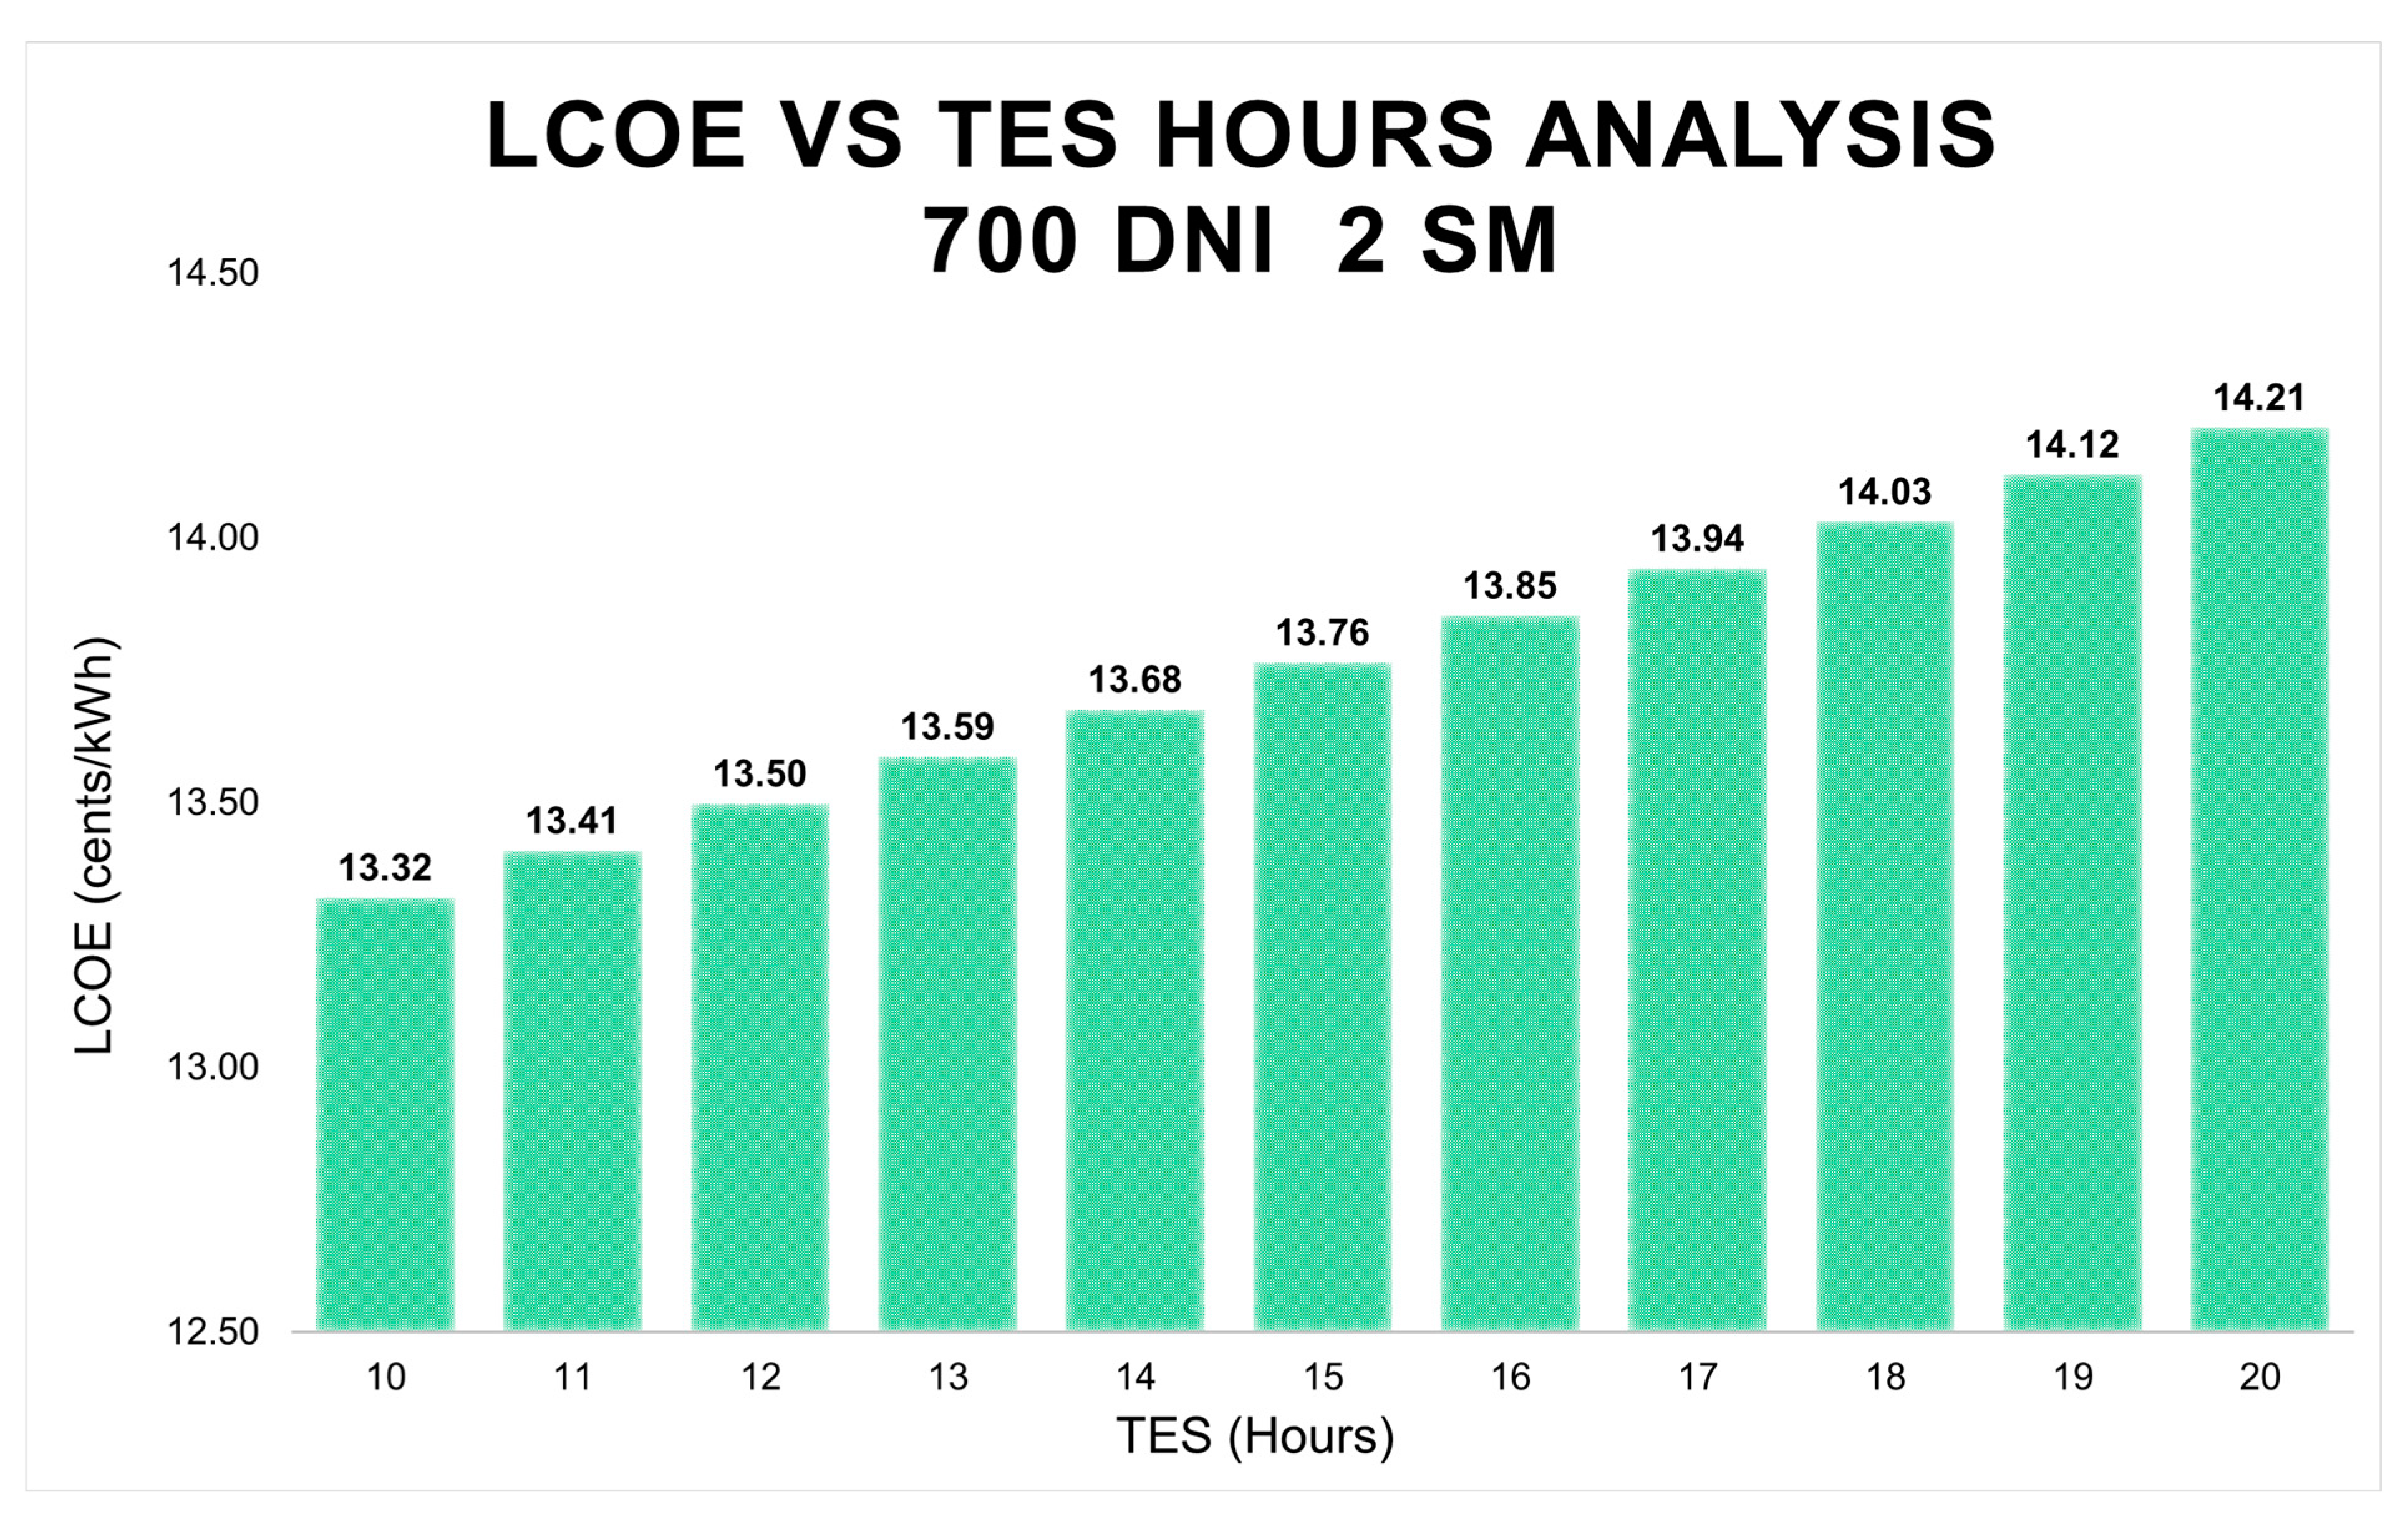
When the SM is modified (2 instead 2.8), the results show that there is no optimal LCOE with an increase in TES hours, as presented in
Figure 13. This analysis indicates that variations in a parameter can drastically change the results. Therefore, the three main parameters are interrelated and should be considered as a whole.
The optimization process produces a significantly oversized plant, as a consequence of the lack of enough solar radiation (hourly considered) to match the requirements. Considering the standard heliostat, receiver, turbine, and TES models in SAM, the optimal design parameters calculated using the SAM optimization are shown in
Table 4. A reflective surface of 91 m
2 is considered for each heliostat, as detailed in previous sections.
These parameters are used to calculate the energy production of the plant, as shown in
Table 5, and the economic results, as shown in
Table 6. The LCOE has a value of 122.60
$/MWh, with an effective capacity factor of 92.5%. This high value of operational hours is a result of the optimal TES sizing strategy and, as indicated above, improves the operational economic viability of the plant, as it increases energy production, maximizing plant usage in hours when no solar radiation is available. Previous
Figure 11,
Figure 12 and
Figure 13 presents the sensitivity analysis of solar field variations.
Economic Analysis
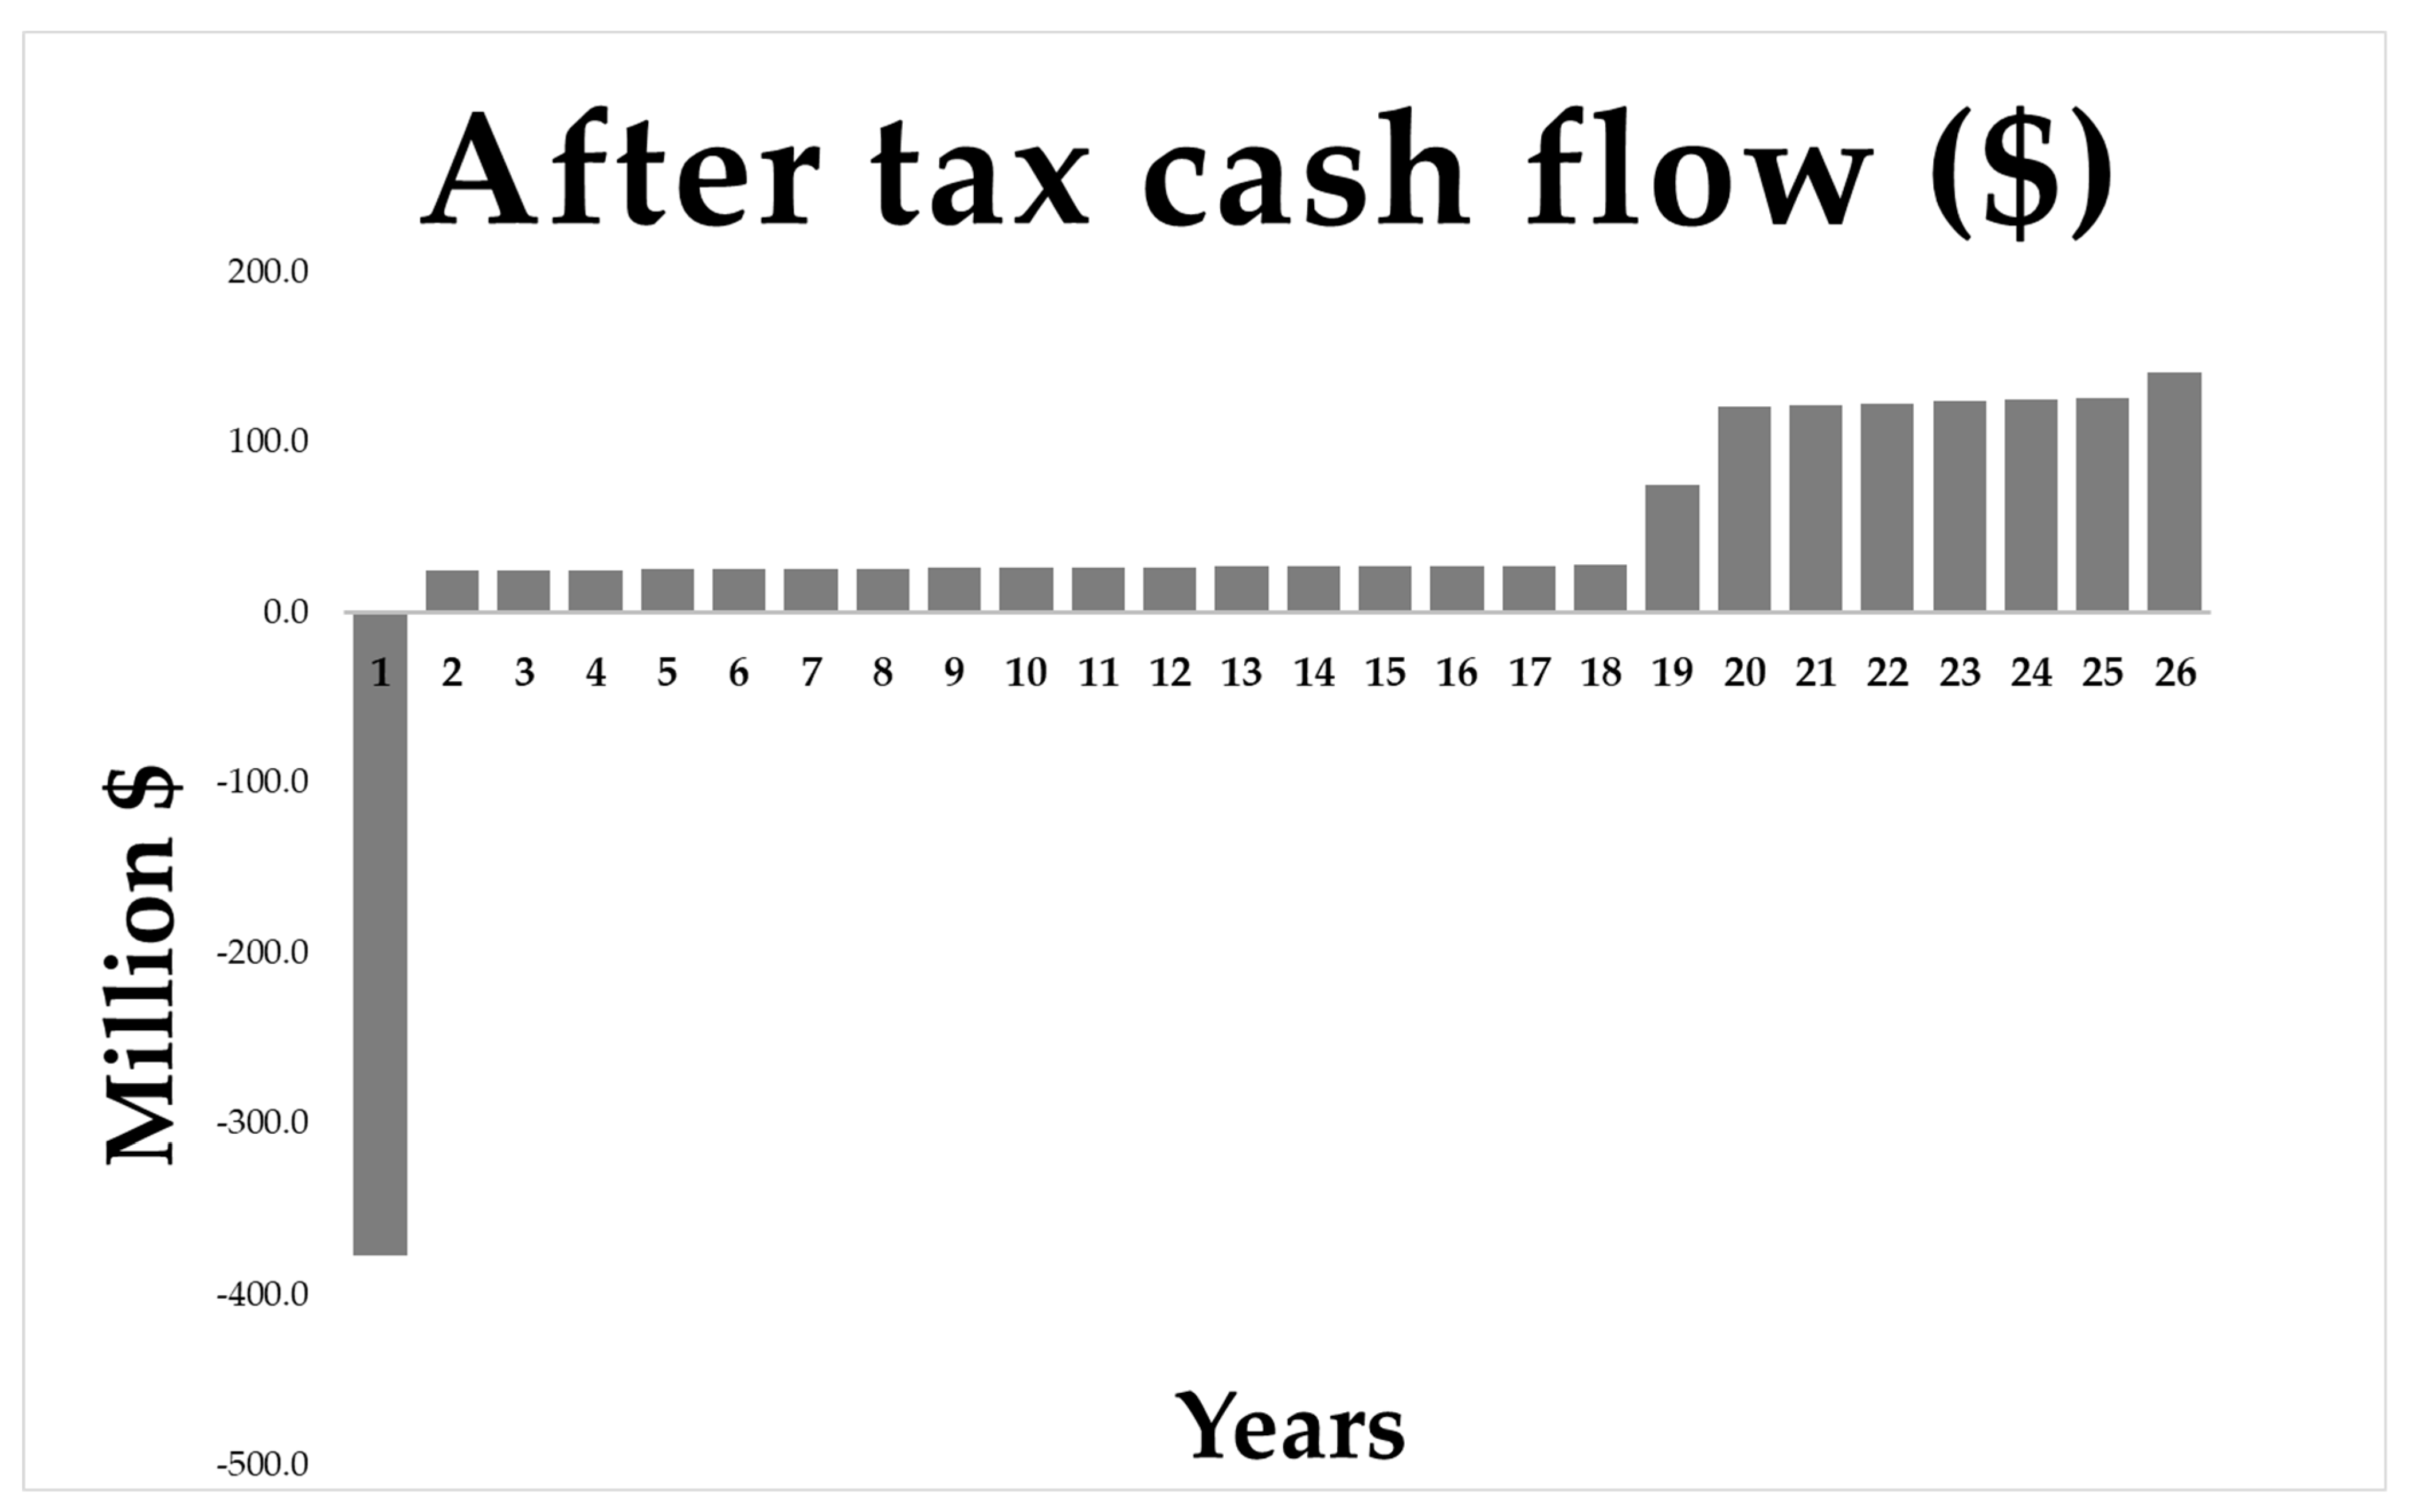
In the case study, the results are calculated for a global nominal discount rate of 8.13%, considering a real discount rate of 5.5% and inflation. The SAM model calculates the energy exported to the global production after subtracting the plant self-energy consumption. The economic performance of the plant is directly dependent on the initial investment and the debt payments,
Figure 14 The debt payments last 18 years and the closing debt for the year 19 is 77 Million
$.
3.3. Sensitivity Analysis
3.3.1. Solar Field Sensitivity Analysis
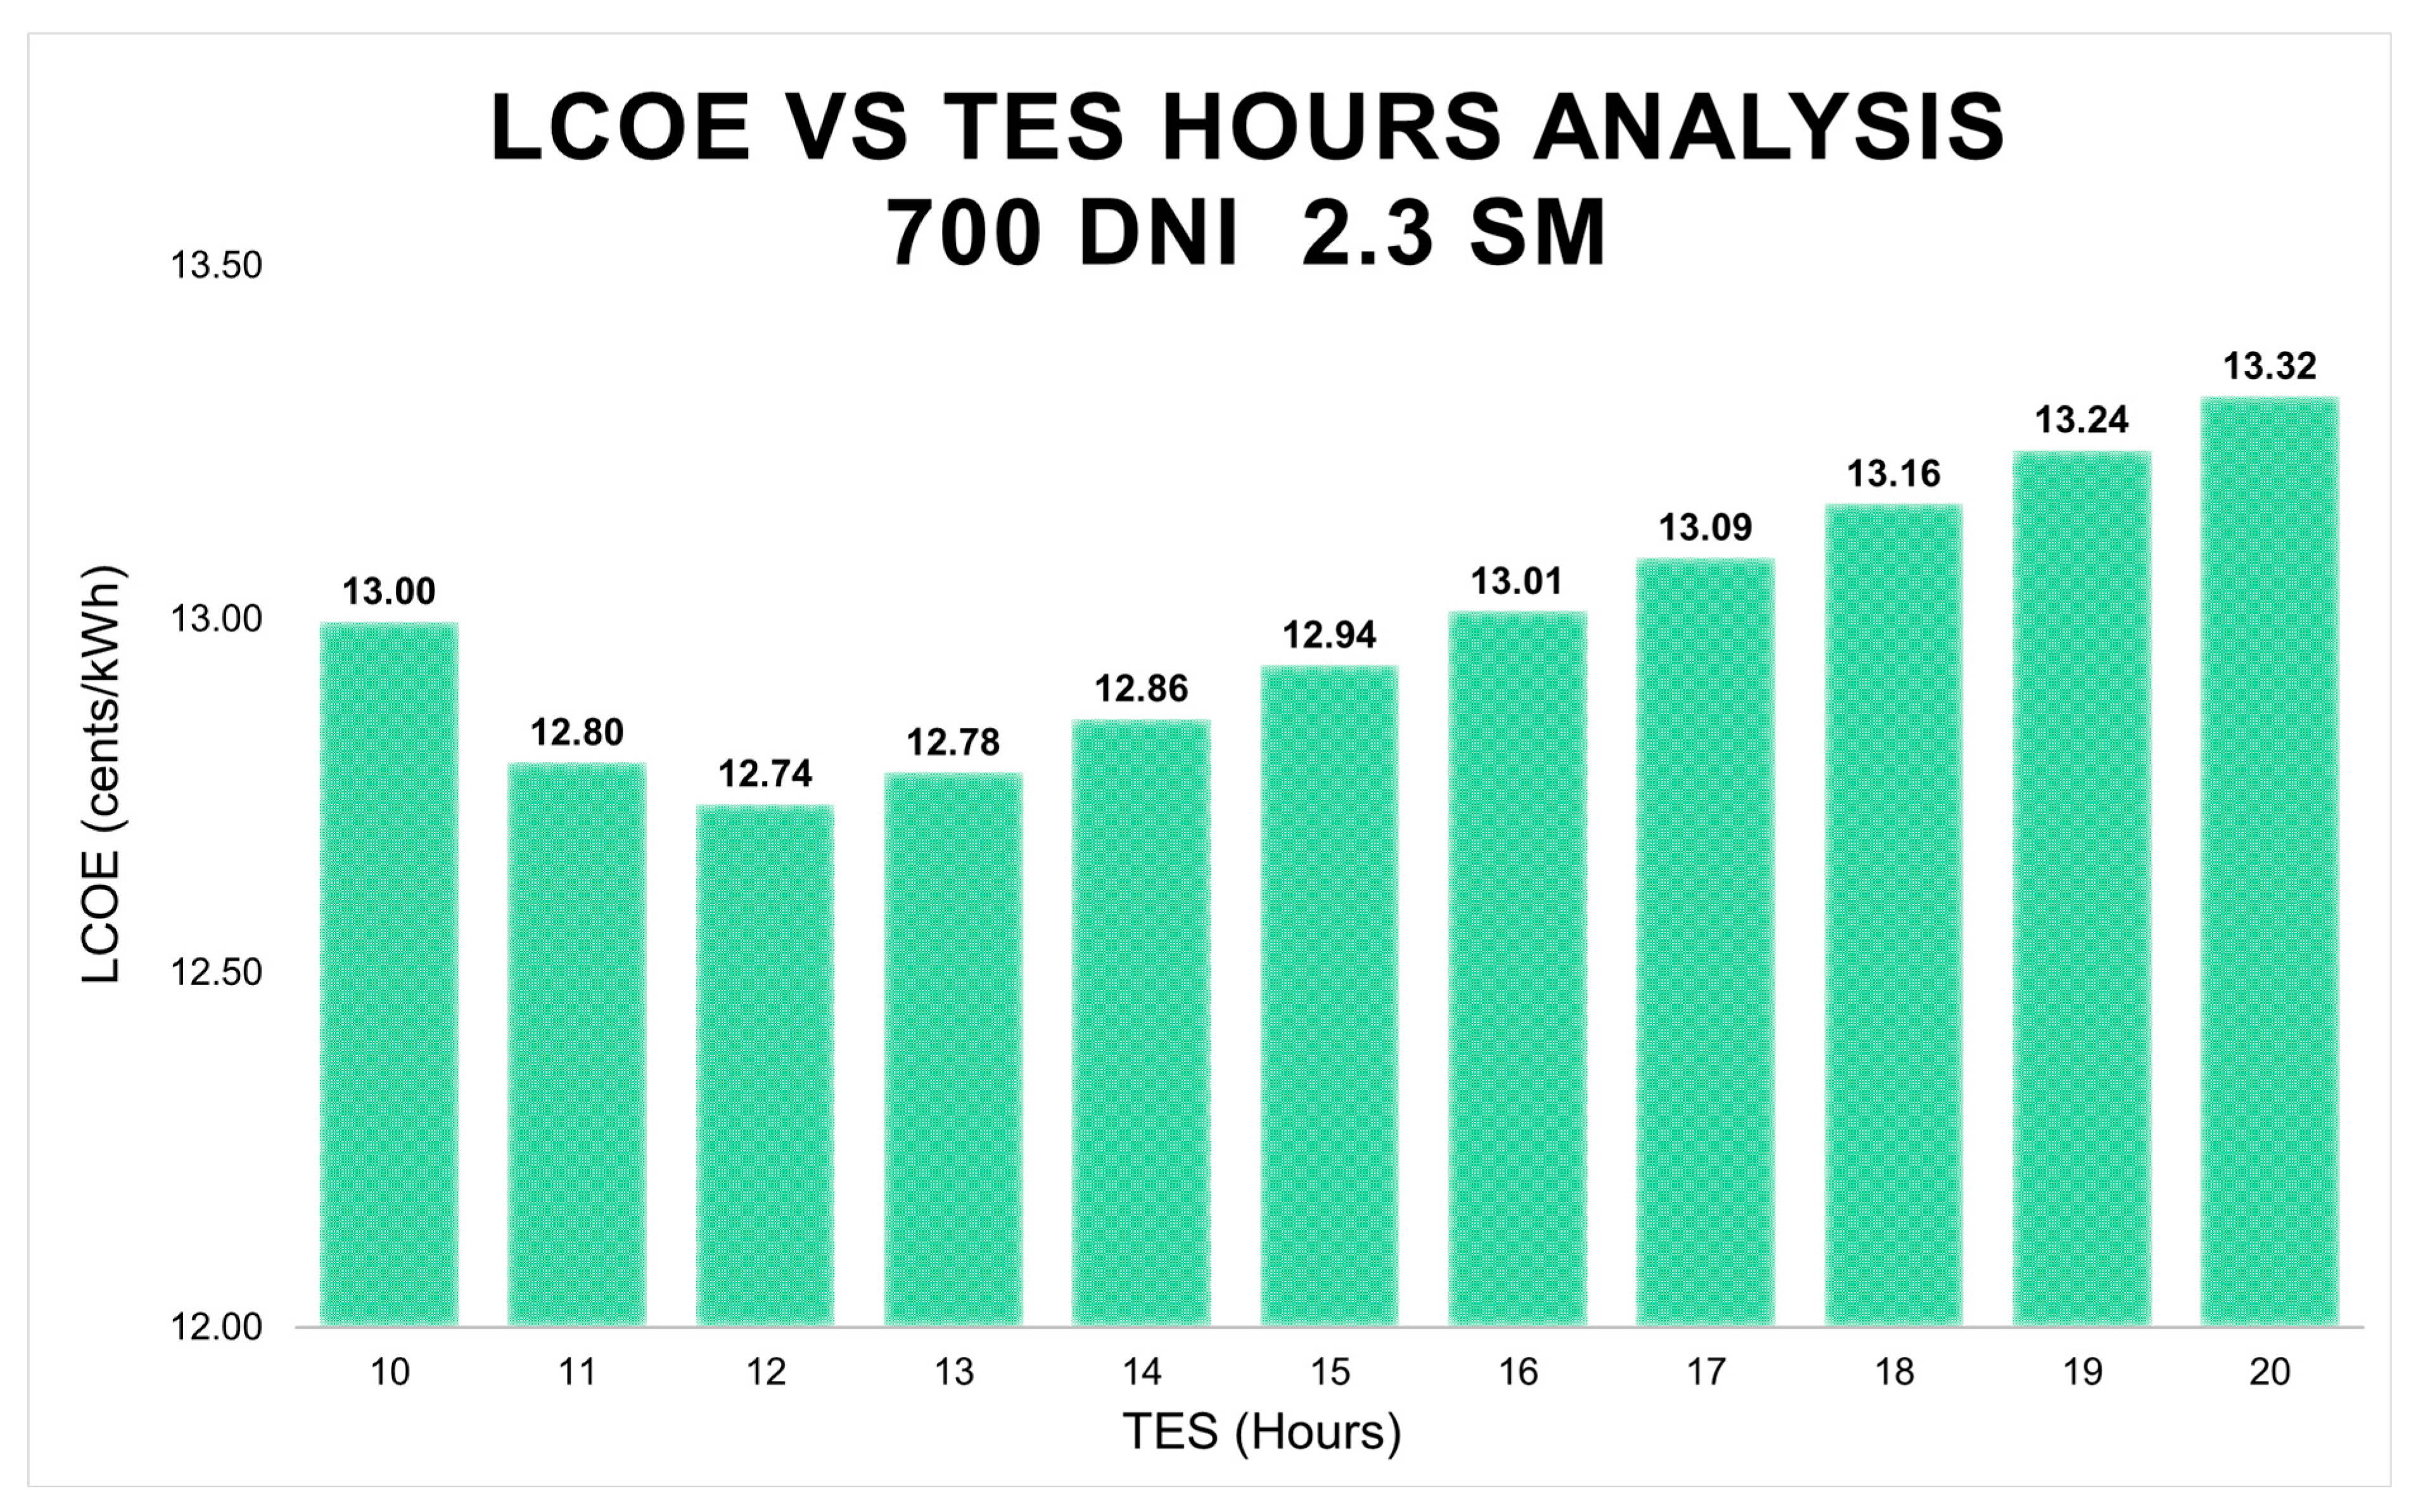
The results are used to perform a sensitivity analysis that provides information to optimize plant sizing and operational parameters. For the general analysis, two verifications are carried out. One verification shows that the sensitivity of the SM and the reference DNI are very similar, despite the fact that the terms do not represent similar variables but, in fact, they vary and modify similar parameters and directly change the sizing of the solar field. The DNI variable is varied in the same proportion as the solar multiple and the results obtained are very similar. The analysis and comparison for the DNI 700 W/m
2 and 2.3 SM, shown in
Figure 15, confirms the similarity of the optimal results presented in
Figure 12 for the DNI 850 W/m
2 and 2.8 SM.
The results shown in
Figure 15 prove that the LCOE variation curve has a visible similarity, but at the same time, if we compare the value of each of the cases, a small difference is presented. It proves that, although their variance does not differ in the results of optimal sizing for maximum plant profitability, the analysis must be parameterized considering difference values and variations for both of them.
3.3.2. Tower Height Sensitivity Analysis
The other optimized parameter, tower height, is used to perform a check of the optimization results. Considering the research analysis, the optimization algorithm should result in a tower height equal to that obtained if a sensitivity analysis and optimization were performed manually using a parametric analysis. The results shown in
Figure 16 confirm the same results and, therefore, the optimal sizing value.
The sensitivity of this variable is quite high and, therefore, the SAM optimization tool is validated, and the value is iterated each time that a simulation is run, always obtaining the optimum for each simulation.
3.3.3. Sensitivity Analysis Results
Considering the global parametric optimization, that used four optimal variables (solar multiple, reference DNI, tower height, and thermal storage hours) the results analysis can lead to two main conclusions:
The DNI and SM variables are the most sensitive in terms of results. Variations in these parameters imply drastic changes in a plant and it is important for plant developers to analyze their real impact on the plant to decide which parameters can be indirectly modified. Another variation to consider is that these parameters act on the sizing of the solar field, which is a major cost of the plant; any small variation produces a significant variation in the required funding to meet the initial cost of the plan. As a consequence, two sizing strategies can be chosen: One strategy is oriented to obtain the lowest plant LCOE and, the second strategy aims to reduce the initial cost of the plant. Available investment funds, interest rates, and depreciation can be limiting variables in this case.
As shown in the previous sections, the height of the tower also implies variations to be taken into consideration in the plant. The used SAM optimization tool and the strategy defined in this research make it possible to achieve similar variations using other parameters such as considered in the optimization.
The results show the importance of performing an optimization strategy for the entire CSP plant that considers the climatic, operational, and technical aspects in order to ensure maximum profitability and allow effective competitiveness of the technology as part of the energy mix.
4. Discussion
In this section, the results of the optimization process are analyzed and compared with the current situation. The optimization methodology results show that it is possible to use the extensively validated SAM tool to design optimal CSP plants with TES systems, aiming to maximize availability of RE generation in any hour of the day and to contribute to power system demand, avoiding use of conventional FF plants and, therefore, reducing global costs for each hour. The results show the feasibility to act as an alternative to CCNG contributing to the generation share and acting as a buffer against spot price increases due to fossil fuel cost increases. The cost reduction is caused by the lack of fuel usage and also because no carbon fees are required to be paid.
For the presented case study, the results shown in the previous sections prove that, if the proposed optimization process is carried out, it is possible to obtain an LCOE value of 122.6
$/MWh, which considering a CR of 1.159
$/€, leads to a value of 105.6 €/MWh. Considering the
for the CCNG plans, and the sensibility analysis that considers fuel costs and emission costs, the CSP can compete in a wide range of parameter variations. The benefits associated with the use of CSP plants are also related to energy independency and lack of fossil fuel resources, with no
emissions and associated
. The range where the CSP will offer a lower LCOE as compared with
for the CCNG is shown in
Figure 17.
These results only take into consideration fuel costs and emission costs for the FF but, if all the additional costs shown in Equation (2) are considered, the final offer cost for the CCGN plants would be increased. The ongoing desertification as a consequence of climate change effects, which are causing extensive droughts in southern European countries, will increase the lands with no possible agricultural use, making it possible to construct new CSP plants with minimum land impact. The results are extensive to intensive carbon power systems (relying mainly on coal or fuel) and also in any power grid in a transition to a carbon free generation system. In both cases, the influence of international markets and FF prices result in a significant increase in spot prices if the FF cost increases, as a consequence of the price formation mechanism. Regarding the case study in the Iberian Peninsula shown here, for international compromises that aim to reduce energy dependency, energy-related emissions, and the effects of climate change, it is mandatory to create a strategy that can ensure the introduction of RE sources with the requirement of manageability. The current situation is aggravated by the lack of FF resources in the Iberian Peninsula, a situation that is similar in most European countries and other places in the world. The possibility of integrating CSP plants as part of manageable power generation would stabilize the spot market price at least until extensive and low-cost energy storage systems are available. The proposed methodology proves the feasibility but also the need for this strategy and can also be extended to other manageable RE sources, such as biomass. Taking into consideration the climatic conditions in the Iberian Peninsula and the ongoing desertification, CSP plants are a cost-effective solution that must be considered as part of the energy mix. Moreover, the strategy can be extended to similar locations worldwide, such as Africa or Asia, to create a RE power generation mix that can match energy demand using some manageable RE source with feasible energy storage.
Nowadays, considering that, in most power systems, only CCNG plants offer advanced manageability capacity and that under a marginal price spot market, these plants consequently fix the spot hourly marginal price, the proposed optimized CSP plants can offer an alternative solution. The effect of higher costs for NG and, therefore, CCNG plants for energy production, is having a significant impact on the whole economy of Spain and also in all the European countries, due to their high dependency on fossil fuels. The current situation will continue for the next few years and will worsen as a result of the increasing demand for NG throughout the world and it represents a risk for the transition process and the countries’ economies. Moreover, considering the effects of ongoing climate change, which include the desertification of extensive parts of southern Spain and Portugal, CSP plants can be built in places where agricultural use is no longer feasible. The strategy presented in this research integrates a combined technical and cost optimization and can be widely used around the world in similar locations with spot energy markets.
5. Conclusions
The present research analyzes the impact of fossil fuel costs on spot energy market costs and the consequent increase in energy prices, where a marginal price mechanism causes a significant distortion in the final costs, especially in the international context of rising fossil fuel prices. This research and analysis focus on systems in power systems based on fossil fuels under zero-emission transition processes where, as a consequence of a reduction in NG supply and an increase in demand and the consequent increase in costs, the final price has been multiplied by six. CSP plants offer a manageable renewable energy generation source that can substitute the required contribution of combined cycle plants; by using the novel optimization method presented it is possible to maximize the energy availability via the operational and economic parameters, using a TES system. To validate the model, the Iberian power market is presented as a case study. In this market, which can be used an example for similar spot markets, a marginal price strategy ensures that the most expensive energy source fixes the final hourly cost. Despite the high RE share of energy production in Spain, the system lacks enough RE manageable energy sources or energy storage systems that could ensure grid stability and, in terms of costs, stabilize offer cost to avoid the high influence of NG costs. An analysis, considering both natural gas and coal, studies the minimum spot market offer, considering fuel costs and , and the results are compared with the cost of the optimized CSP plants.
The results show that if a CSP is optimally sized, by means of the optimization algorithm available in the SAM software, it is possible to reach generation costs that are competitive and could potentially reduce the spot market cost in these power systems. The results are based on the optimization of the SM, the DNI, tower height, and TES capacity. The results prove that including a TES system improves plant performance and allows manageability of solar resource and, as consequence, the solar energy could be introduced as part of the generation mix where manageable peak power is required.


