Abstract
This article’s focuses of photovoltaic installations, which are becoming more and more popular in Poland and around the world. A short theoretical introduction to photovoltaic cells is presented, and the aim of the research is distinguished. Then, the formulas for the parameters characterizing solar cells are derived. The parameters that determine the highest efficiency of solar cells are specified in the next section. In the experimental part, tests of a selected photovoltaic installation were carried out. Based on the research, we conclude that temperature and sunlight have a significant impact on the efficiency of solar cells.
1. Introduction
The increase in popularity of photovoltaic cells in Poland and the desire to minimize the excessive use of environmental resources have meant that in Poland and all over the world, the actions are taken to reduce the negative impact of humans on the environment. This resulted in a change in the human–environment relationship. Already in the last century it was noticed that the overexploitation of the environment, and thus its degradation and devastation, would later contribute to a deficit of natural resources. That is why many countries promote green energy sources, including photovoltaic cells [,,,].
Photovoltaic cells are technical objects from a group of renewable energy sources. Like any technical object, they go through the following life phases during their life cycle: design, production, operation, decommissioning, and post-utility management. For many users of photovoltaic cells, operation is the most important stage in the life cycle. At this stage, the user uses the capabilities of a photovoltaic cell. Therefore, certain activities are carried out to ensure that the management of the operation of photovoltaic cells is effective and affects the maintenance of the technical facility in peak condition. These activities include checking the most important parameters of photovoltaic cells and carrying out maintenance activities, including cleaning the surface of photovoltaic cells. Proper management of the operations may lead to the technical object being in an operational condition for a longer period of operation [,].
As is well known, photovoltaic cells convert the energy of solar radiation into electricity using the photovoltaic effect. The photovoltaic effect is created by an electromotive force, and it is a result of the absorption of solar radiation. Solar radiation waves knock electrons out of the valence band to the conductivity level. As a result, a hole is created in the place of the knocked-out electron. If there is a majority of electrons in a semiconductor, which is called an n-type semiconductor, there will be a predominance of holes. This is called a p-type semiconductor. The p and n type semiconductors are pushed together to form a p–n junction. If the semiconductor is not illuminated, the holes travel and a diffusion current flows. If the junction is lit, the photons break the electron hole in the junction. Then the negative charges move to the n-type region, and the positive charges to the p-type region. Due to such a movement of charges, a constant electric voltage is generated at the junction [,].
On the basis of the above-described process, it is possible to determine the current–voltage characteristics for each photovoltaic cell. The currentvoltage characteristic is changed by the appropriate selection of semiconductor materials and by the action of the parameters of solar radiation intensity, wind speed, and angle of incidence of sunlight, and many other factors that were included in the publication. Therefore, when managing the operation, monitoring the operation of photovoltaic cells should, first of all, control the current–voltage characteristics. If an abnormality is detected, the cause of the current–voltage curve distortion should be found and the problem eliminated [,]. The main aim of the article is to analyze the basic parameters of photovoltaic panels. The scope of work includes:
- 1.
- Collecting and organizing input data for the process of evaluating the work of PV panels;
- 2.
- Formulating of the relationship between determining the parameters of a photovoltaic cell and describing the influence of certain factors on these parameters.
The simulation of the operation of the photovoltaic module was carried out on the basis of collected and ordered input data. For this purpose, the basic operating parameters of a photovoltaic cell were determined, such as open circuit voltage, short-circuit current, maximum power point, fill factor, and efficiency. Current–voltage characteristics were prepared on the basic of data mentioned above. Specification of the influence of solar radiation intensity on the value of voltage, current, and power of photovoltaic panels.
2. Literature Review
The main element of the photovoltaic system is a photovoltaic panel, made of individual cells, connected in series or series–parallel. After connecting the PV cells, they are laminated to protect against damage and environmental factors. Solar panels can be classified according to many criteria. One of the basic criteria is the division into cells made of crystalline silicon and cells made of thin film cells.
The power generated by the modules and its electrical parameters depend mainly on the environmental conditions in which they work. The intensity of solar radiation and temperature are of particular importance. The characteristic that describes the most important parameters of a solar cell is the current–voltage characteristic (I–V). For a cell that is not illuminated, this is basically the characteristic of the diode. As we know, various materials are currently used to build photovoltaic panels. Therefore, the opening voltage, conduction resistance, and reverse resistance may differ from the values characteristic for a silicon diode. Values such as: short-circuit current (ISC) and open-circuit voltage (VOC) can be read from the current–voltage characteristic. On the basis of the characteristics, it is possible to determine the current Im and voltage Vm corresponding to the maximum power point of the cell. Thanks to this data, it is possible to calculate further parameters such as: the fill factor (FF), the maximum power (Pmax) or the cell efficiency. The above-mentioned parameters will be described later in the article, as they constitute the theoretical basis for understanding the experimental part of the article [].
To describe the parameters of a photovoltaic cell, the diagram of the photovoltaic cell shown in Figure 1 was adopted [,,,,].
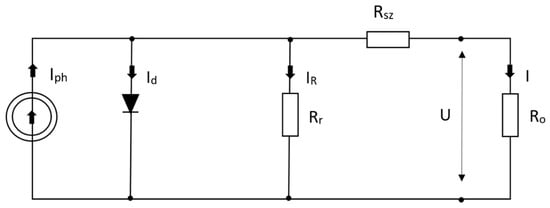
Figure 1.
Electric model of a solar cell (developed on the basis of [,]).
According to Kirchhoff’s first law, the current balance is given by the equation:
The current is directly proportional to the intensity of solar radiation and can be written down using the relationship:
ISC—short circuit current, Tstc—temperature under STC conditions [K], Go—solar radiation density [W/m2], T—cell operating temperature [K], J0—temperature coefficient [A/K]
The diode current Id polarized with the electromotive force ε is described by the relationship:
where the electromotive force ε is defined by the relationship:
U—voltage at the solar cell terminals, I—current generated by the photovoltaic cell, RSZ—series resistance of a solar cell.
where I0 is the sum of the currents of minority carriers in the equilibrium state (holes and electrons) it is the so-called saturation current, described by the relationship:
Id0—“dark” current of the diode [A], e—elementary equal charge 1.602 × 10⁻¹⁹ [C], Eq—potential energy barrier [V], k—Boltzmann constant equal to 1.38 × 10⁻²³ [J/K], T—solar cell operating temperature [K], A—diode quality factor (for an ideal cell A = 1, for the real cell 1 < A < 2)
The current flowing through the parallel resistance of the IR solar cell is determined by the relationship:
Rr—parallel resistance of the solar cell [Ω], ε—electromotive force
Substituting equations from 2 to 6 into the first Kirchhoff’s law 1 we get:
Assuming the voltage U = 0 V and ignoring I0, which is significantly lower than the current Iph, from dependence 7 we can obtain the approximate value of the short-circuit current of the photovoltaic cell is
The short circuit current is the highest current that a cell can generate when its resistance is 0. When the voltage is zero, it means that the front contact of the cell is shorted to the back contact and the current generated by light flows through the cell. The electron current flows from the p region to the n region, and the hole current flows from n to p. The value of the photocurrent Iph is the highest for a given cell under certain lighting conditions. This parameter depends on the material parameters of the semiconductor and the construction of the solar cell. The short-circuit current ISC determines the quality of the cell. For an ideal cell, the short-circuit current depends on the energy gap of the semiconductor and the intensity of solar radiation. The narrower the energy gap is the more photons are absorbed, which results in higher currents. It can often be noticed in publications that the short-circuit current density parameter JSC [mA/cm2] is used for comparison purposes. This value depends on the cell area and is expressed by the equation [,,]:
S—solar cell surface [cm2]
Assuming that I = 0 A and U = UOC and substituting these values for Equation (7), the relationship determining the open-circuit photovoltage, also called the open-circuit voltage of the cell, is determined:
The open circuit voltage is the highest possible voltage obtained at the solar cell electrodes. When the front contacts of the cells are not connected with the back contacts, minority currents flow during the illumination of the cell. The electron current flows from the p region to the n region, and the hole current flows from n to p. Therefore, negative charges are accumulated in the n-type semiconductor, and positive charges in the p-type semiconductor. Such a distribution of charges in the cell causes the greatest potential difference to be generated. Therefore, the formula follows Equation (10). As we can see in the formula, the open circuit voltage depends logarithmically on the photogeneration current ISC. The open circuit voltage depends logarithmically on current Isc and this current is proportional to the solar radiation density Go which caused the photovoltage Uoc, also depending on the solar radiation. On the basis of the above-described formulas, we can create the current–voltage characteristic for an ideal solar cell, which would have the shape of a rectangle with sides ISC and VOC. In fact, it is difficult to find a perfect cell. Therefore, the maximum power of a real cell is less than the maximum power of an ideal cell, equal to the product of the open circuit voltage VOC and the short circuit current ISC. The maximum power of a real cell is equal to [,,,]:
where Im and Vm are equal to the voltage and the current at the highest point on the current–voltage characteristic. This is called the maximum power point, which is the point where the cell’s power is greatest [].
Another important parameter describing the quality of a photovoltaic cell is the fill factor, abbreviated FF. As mentioned earlier, for an ideal cell, the current–voltage characteristic is in the form of a rectangle. Of course, such a state does not actually occur. To describe how the actual cell differs from the ideal characteristic, the fill factor FF was introduced. The value of this parameter increases the shape of the current–voltage characteristic of the cell and it is close to a rectangle. It can be expressed as a percentage or a dimensionless quantity and is defined by the relationship:
Im, Vm—current and voltage at maximum power point, ISC, VOC—short circuit current and open circuit voltage
In engineering, the key parameter describing the quality of technical facilities is efficiency. There is also the efficiency parameter η for photovoltaic cells. It can be defined as the amount of electricity supplied by the solar cell to the circuit in relation to the amount of solar radiation energy supplied to the cell’s surface and it is expressed by the formula:
Sa—active cell surface, St—total cell surface, Go—solar radiation intensity
In fact, the efficiency of a cell depends on three factors:
η1—the spectral factor, η2—the voltage factor, η3—the fill factor
The spectral factor is the amount of energy incident on the surface of the cell which is used to generate hole–electron pairs. It depends on the energy gap Eg, because photons with energy less than the energy gap are not absorbed Those with energy greater than Eg are converted into electricity. It is believed that about 55% of the Sun’s energy is lost in a cell due to the spectral factor. The voltage factor denotes the losses resulting from the fact that the maximum voltage that a cell can obtain is equal to the VOC. However, it is smaller than the value of the energy gap Eg. The last factor, the fill factor is equal to the fill factor FF [].
On the basis of the above-described relationships, the voltage–current characteristics of a photovoltaic cell can be determined (Figure 2). There are three characteristic points on it. The ISC point that specifies the short-circuit current of the solar cell for which the voltage is U = 0 and the current I = ISC. The next point is the USC point, which defines the opening voltage of the solar cell for which the current I = 0 and the voltage U = USC. The last characteristic point is the point P1, which is the maximum power point of the solar cell meeting the parameters U = Um and I = Im. On the basis of the above-described relationships, the voltage–current characteristics of a photovoltaic cell can be determined (Figure 2) [,,].
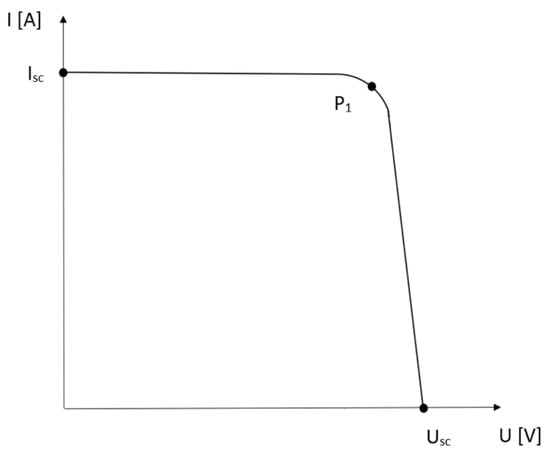
Figure 2.
Current–voltage characteristics of a photovoltaic cell (developed on the basis of []).
The shape of the current–voltage characteristic of the solar cell depends on the temperature and the value of the intensity of the solar radiation supplied to the cell (Figure 3 and Figure 4).
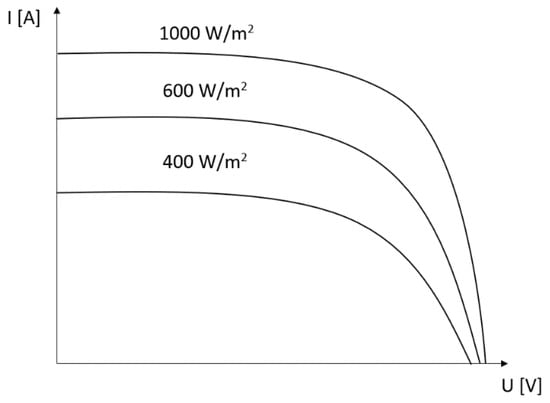
Figure 3.
Influence of solar radiation intensity on the current–voltage characteristics (developed on the basis of []).
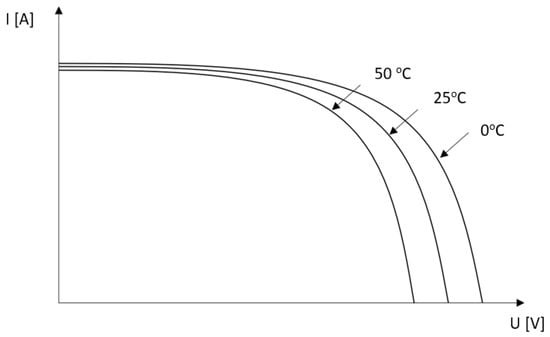
Figure 4.
Influence of temperature on the current–voltage characteristics (developed on the basis of []).
3. Mathematical Model
The work of a photovoltaic cell is primarily influenced by the lighting conditions of the photovoltaic cell. They are one of the important factors which influence the value of electricity generated by this technical facility. Many publications pay special attention to the level of solar radiation intensity (Go), the cell location angle (β) and the cell temperature (T) on the efficiency of photovoltaic cells. This relationship can be represented by the Equation (15) [,]:
E—efficiency of a photovoltaic cell, β—the angle of the cells’ location, T—solar cell temperature
As we know the principle of operation of a photovoltaic cell is based on the absorption of solar radiation reaching the suitably shaped surface of a silicon cell, which is a semiconductor junction (p—n type). The amount of solar radiation absorption is influenced by the absorption coefficient α, which is dependent on the wavelength of light λ. According to Bouger’s law, which says that the intensity of solar radiation passing through a layer of a material medium decreases exponentially with an increase in the thickness of this layer, we obtained [,,,,,]:
Jx—value of the intensity passing through the medium layer, x—medium layer thickness, J0—incident light intensity, α—light absorption coefficient, e—base of the natural logarithm
After transforming this formula, the following is obtained:
The coefficient of absorbing photons with a shorter wavelength is greater, they are more easily absorbed by the semiconductor material and therefore can participate in the generation of hole–electron pairs. Photons with shorter wavelengths carry more energy, which has a positive effect on the photovoltaic effect. However, research shows that their absorption decreases with increasing cell thickness (x) [,,,,].
Another factor is the angle of the location of the photovoltaic cells along with the location of the cells towards the south. The plane that has the greatest insolation is oriented towards the movement of the sun so that the radiation falls on it perpendicularly. During the day, the sun changes the height of its disc and the trajectories of its movement, therefore the links that follow the sun during the day and throughout the year are the most efficient [,,,,,].
An important factor influencing the efficient operation of photovoltaic cells is the operating temperature of the cells To. This temperature is mainly influenced by the ambient temperature (To) and the wind speed (v). The temperature value of photovoltaic cells affects the electrical parameters of the cells. Excessive heating of the cell surface is associated with a decrease in its efficiency. The main reason for this is the increase in vibrations of the atoms of the crystal lattice that builds the photovoltaic cell. These vibrations impede the flow of electrons, which translates into a reduction of the electromotive force, and leads to a voltage drop. The cell surface temperature increases with the recombination of electron-hole pairs and with the flow of photocurrent. The flow of electric current causes the release of thermal energy proportional to the product of the resistance of the conductor (R), the square of the current (I) and the time of the current (t) (Joule–Lenz’s law) [,,,,,].
As a result of the temperature increase according to the Joule–Lenz law, the physical properties of the semiconductor material of the cell change. The solar radiation absorption coefficient, the mobility of charges, the value of the energy gap or the conductor resistivity may change. Hence, the electrical parameters of the photovoltaic cell may change, such as: open circuit voltage, short-circuit current, maximum power, duty cycle, and efficiency of the photovoltaic cell.
On the basis of the above-mentioned relationships, the dependence on the efficiency of a photovoltaic cell can be extended by the following parameters:
E—photovoltaic cell work efficiency, β—the angle of the cells’ location, T—solar cell temperature, Jx—value of the intensity passing through the medium layer, x—medium layer thickness, J0—incident light intensity, α—light absorption coefficient, To—ambient temperature, v—wind speed, R—the resistance of the conductor, I—current intensity, and t—current flow time
All the parameters are taken into account depending on the efficiency of the photovoltaic cell have a significant impact on the effective operation of the cell. Therefore, the above-mentioned factors should be taken into account when managing the operation.
4. Experimental
The analyzed photovoltaic installation was located in Bydgoszcz. The annual average solar radiation is shown in Figure 5. As we can see, the highest value of solar radiation intensity occurred in June and the average was 171 kWh/m2. The lowest intensity was in December, about 14 kWh/m2, according to the data given by PVGIS.
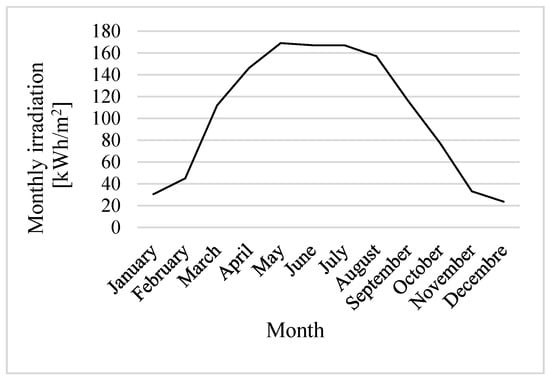
Figure 5.
Irradiation in individual months (data from PVGIS).
The discussed photovoltaic installation consisted of 12 Longi Solar photovoltaic panels with a capacity of 445 Wp. Figure 6 shows a block diagram of the discussed photovoltaic installation. According to the diagram, the basic elements of the photovoltaic system were photovoltaic panels, an inverter, and a receiver. All the elements were monitored by the monitoring system. The inverter had the function of registering the operating parameters of the photovoltaic installation. This function enabled the monitoring and proper management of the operation of the photovoltaic system. Based on the obtained data, the influence of solar radiation and temperature on the current, voltage, and power of a photovoltaic cell was elaborated. The results are presented and discussed later in the article.
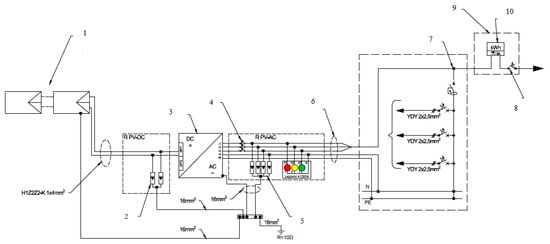
Figure 6.
Block diagram of the photovoltaic installation: 1. Solar panels, 2. Surge protector, 3. Inverter, 4. Overcurrent circuit breaker, 5. Surge protector, 6. The AC wire, 7. Connection point for the photovoltaic installation, 8. Pre-meter protection, 9. Existing power connection, 10. Electric energy meter (own elaboration).
The great popularity of silicon cells is the result of the availability of SiO2 quartz and the satisfactory efficiency of the main material used for their production, i.e., silicon. Quartz sand melts at 1800 °C and then cleans. The finished silicon was 99.99% pure. A single crystal of silicon with a small 345 amount of boron was obtained in a vacuum from the raw material, thus purified and molten. Monocrystalline cells were produced by a laser which cut a single crystal into plates of about 0.30 mm thick. Due to the fact that 40% of the light beam was reflected from the surface of the solar cell, it was covered with an active silicon surface, a transparent anti-reflective material. Metallized electrodes were glued to the upper and lower side of the cell. The lower electrode was completely covered with a metallized layer, which was designed to create a mirror reflecting photons in silicon, and thus increased their absorption in silicon.
The parameters of the photovoltaic panel are shown in Table 1. The photovoltaic panels were attached to the roof at an angle of 30 degrees. They were based on PERC cells, i.e., cells with lower emitter passivation. The back-passivation of the emitter reduced the attraction of electrons to the electrode and caused the light to be reflected back into the cell.

Table 1.
Parameters of panel Longi Solar 445 Wp (own elaboration).
5. Results and Discussion
The data taken from the app were from the following sunny days: 27 September, 10 October, and 10 November. During these days, the installation produced the following electricity values: 12.26 kWh, 8.97 kWh, and 3.49 kWh. The value of insolation on those days in Bydgoszcz was, respectively: 876.25 W/m2, 723.37 W/m2, and 547.35 W/m2.
Based on the data in Table 1, the parameters of the solar cell discussed in the literature review can be read. For the Longi Solar 445 Wp solar panel are: open circuit voltage UOC = 46 V, short-circuit current ISC = 9.33 A and maximum power point Pmax = 323.3 W. The fill factor should be calculated using the formulas.
The fill factor was 0.78, which means that the photovoltaic cells were made of good quality cells. Figure 7, Figure 8, Figure 9, Figure 10, Figure 11, Figure 12, Figure 13, Figure 14, Figure 15, Figure 16, Figure 17 and Figure 18 show the values of voltage, current, power, and temperature on particular days.
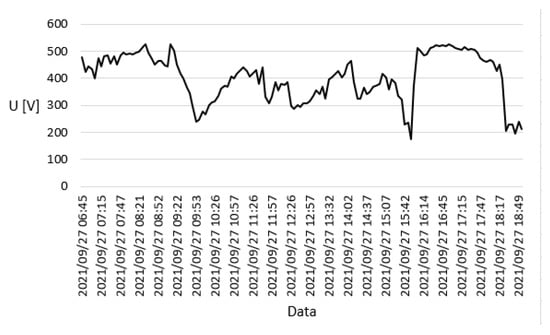
Figure 7.
The voltage value on 27 September 2021 (own elaboration).
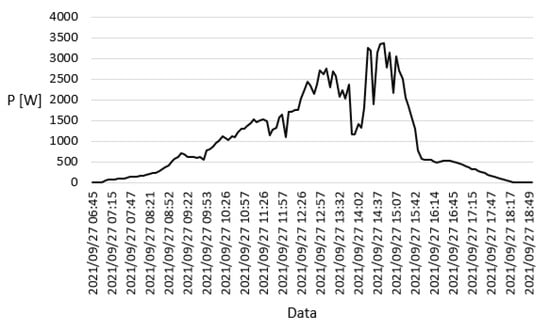
Figure 8.
The power value on 27 September 2021 (own elaboration).
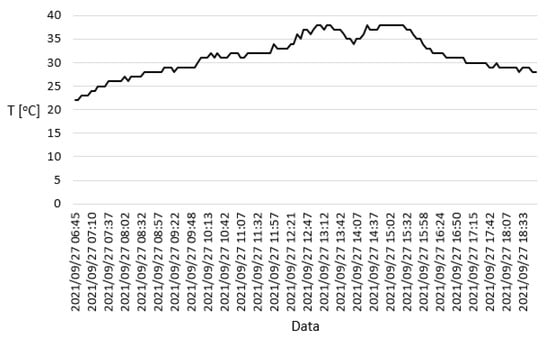
Figure 9.
The temperature on 27 September 2021 (own elaboration).
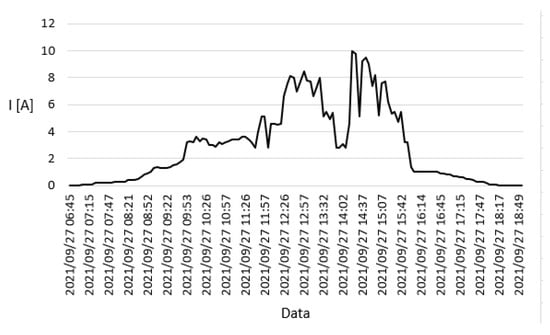
Figure 10.
The current value on 27 September 2021 (own elaboration).
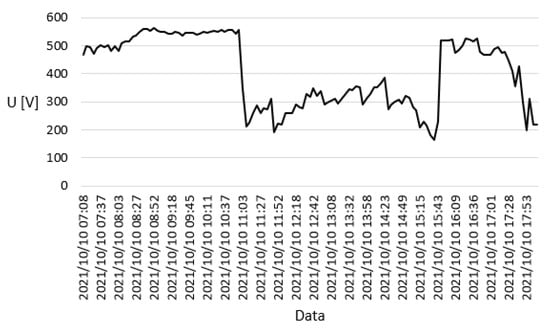
Figure 11.
The voltage value on 10 October 2021 (own elaboration).
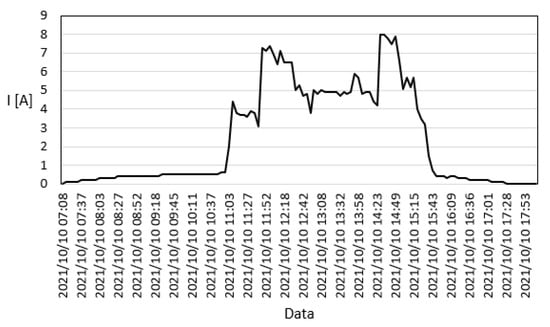
Figure 12.
The current on 10 October 2021 (own elaboration).
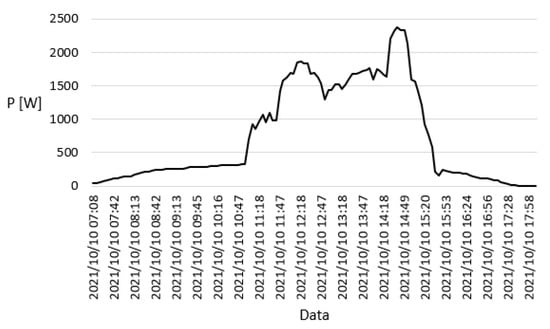
Figure 13.
The power value on 10 October 2021 (own elaboration).
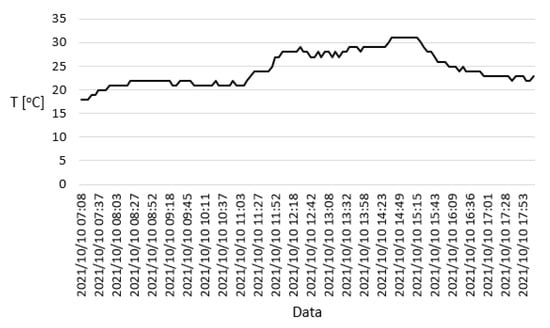
Figure 14.
The temperature on 10 October 2021 (own elaboration).
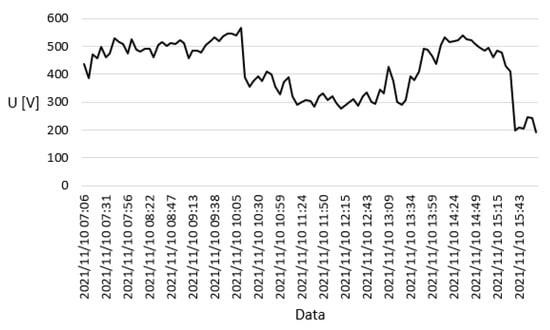
Figure 15.
The voltage value on 10 November 2021 (own elaboration).
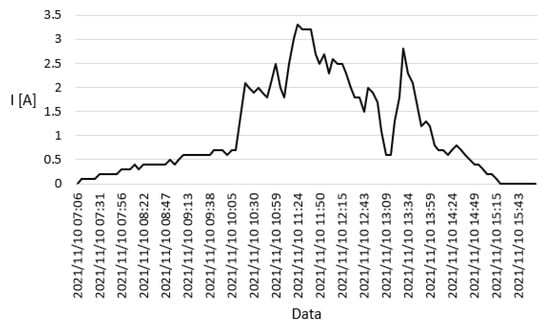
Figure 16.
The current value on 10 November 2021 (own elaboration).
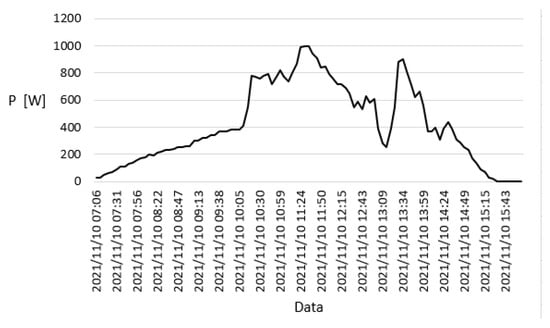
Figure 17.
The power value on 10 November 2021 (own elaboration).
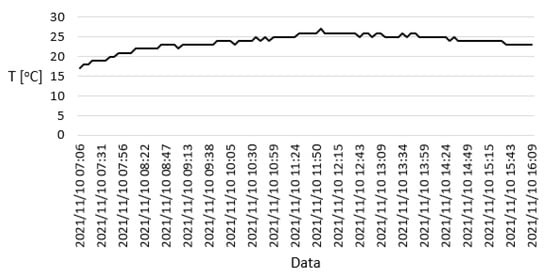
Figure 18.
The temperature on 10 November 2021 (own elaboration).
The graphs show that the voltage, current, and power of photovoltaic panels varied on individual days. On 27 September, the lowest voltage of photovoltaic panels was Umin = 175.6 V, the highest value was Umax = 526.9 V, the average voltage value on that day was Uśr = 403.81 V. As for other parameters, they had the following values: Imin = 0 A, Imax = 10 A, Iśr = 2.82 A, Pmin = 0 W, Pmax = 3370 W, Pśr = 1037.09 W and Tmin = 22 °C, Tmax = 38 °C, Tśr = 37.34 °C. On 10 October, you can read from the chart that the parameters had the following values: Umin = 163.4 V, Umax = 562.9 V, Uśr = 407.08 V, Imin = 0 A, Imax = 8 A, Iśr = 2.32 A, Pmin = 0 W, Pmax = 2370 W, Pśr = 722.03 W, Tmin = 16 °C, Tmax = 31 °C, Tśr = 24.27 °C. On 10 November, the parameters had the following values: Umin = 191.1 V, Umax = 567.5 V, Uśr = 419.39 V, Imin = 0 A, Imax = 3.3 A, Iśr = 1.04 A, Pmin = 0 W, Pmax = 1000 W, Pśr = 403.12 W, Tmin = 16 °C, Tmax = 27 °C, Tśr = 23.55 °C.
The data show that despite the higher intensity of solar radiation on 27 September, the voltage on the modules was higher on 10 October and 10 November. An earlier review of the literature showed that the radiation intensity had a slight influence on the voltage value, which is consistent with the research results. The voltage value is influenced by the temperature of the modules, as shown in graphs 7, 12, and 17. The most important module temperature was on 27 September and it was the factor that contributed to the voltage drop on the photovoltaic panels. It is worth noting that the currents on the modules changed during the tested days. It can be seen that the highest value of the current was on 27 September and the lowest on 10 November. This factor corresponds with the assumptions in the literature section that the intensity value is influenced by the intensity of solar radiation. On 27 September this value was the highest and the lowest on 10 November.
From the power charts of photovoltaic installations, it can be read that the highest power of the modules took place at noon. The graphs show instantaneous power drops, which may be caused by temporary decreases in the intensity of solar radiation resulting from the clouds.
The received data was processed in Excel. Based on the statistical analysis, the results were obtained, which are presented in Table 2 and Table 3 and in Figure 19, Figure 20, Figure 21, Figure 22, Figure 23 and Figure 24.
Table 2.
The influence of temperature on the voltage value.
Table 3.
The influence of temperature on the current intensity.
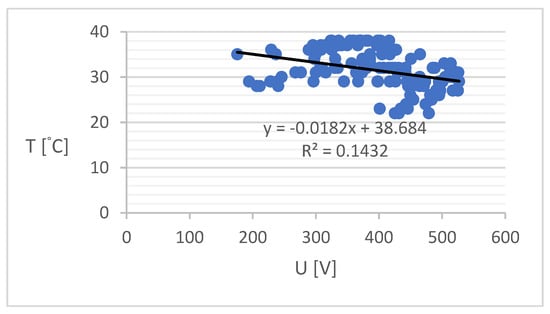
Figure 19.
Temperature to voltage correlation on 27 September.
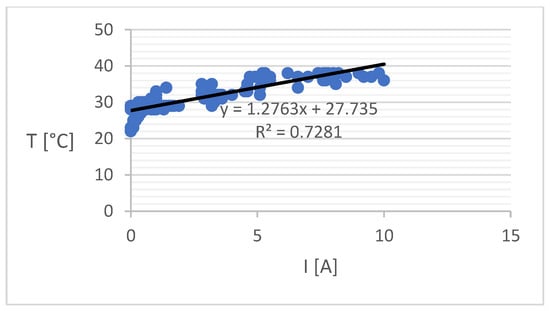
Figure 20.
Temperature-to-current correlation on 27 September.
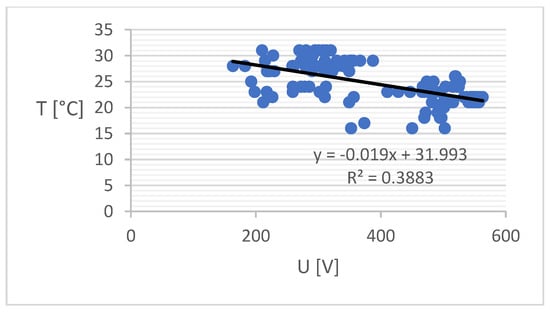
Figure 21.
Temperature to voltage correlation on 10 October.
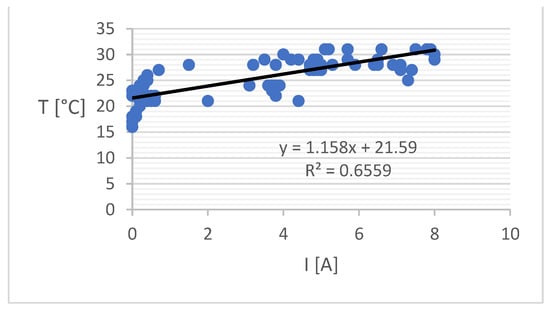
Figure 22.
Temperature-to-current correlation on 10 October.
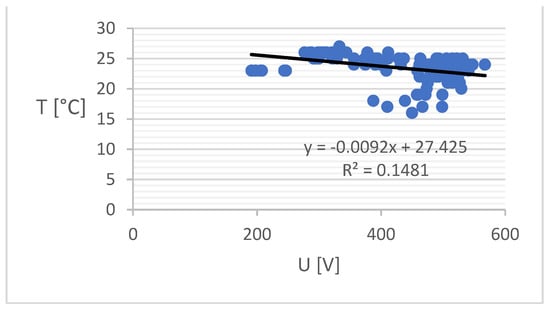
Figure 23.
Temperature to voltage correlation on 11 November.
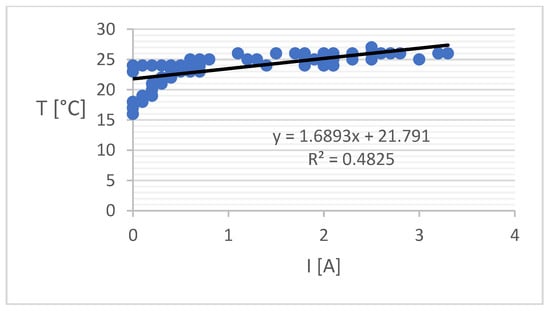
Figure 24.
Temperature-to-current correlation on 11 November.
It can be concluded from the obtained results that the temperature significantly affects the voltage and current value of the photovoltaic cell. For voltages the correlation is negative and for currents the correlation is positive. This means that as the temperature increases, the voltage value decreases. The R-squared determination coefficient measures the strength of the relationship between the model and the dependent parameter, as you can see, the coefficient of determination is at the level of 0.14–0.39, which means that the correlation is average. As far as the dependence of temperature on the intensity of the current is concerned, it can be stated that the correlation is strong and the temperature increase causes the increase in the intensity of the current, which can be agreed because the temperature increase is related to the increase in the intensity of solar radiation. All models are important because for all models the significance level is below 0.05%.
6. Summary and Conclusions
The aim of the article was realized and the basic parameters of the solar cell were discussed, such as open circuit voltage, short-circuit current, maximum power point, duty cycle, and efficiency. An attempt was made to describe these parameters and list what factors affect their value. Based on the mathematical model, we found that many parameters affect the efficiency of the solar cell, such as: the angle of the cells location, the solar cell temperature, the value of the intensity passing through the medium layer, the medium layer thickness, the incident light intensity, the light absorption coefficient, the ambient temperature, the wind speed, the resistance of the conductor, the current intensity, and current flow time. The values of voltage, current, power, and temperature were measured based on the monitoring of photovoltaic cells. It is necessary to control the voltage and current of photovoltaic cells in order to obtain the highest performance of photovoltaic cells. This is because these parameters influence the value of the maximum power point. However, these parameters are influenced by various factors such as temperature and intensity of solar radiation. The analysis clearly shows that the voltage value decreases with increasing temperature. On the other hand, the value of the intensity of solar radiation causes an increase in the current. Proper design and operation of a photovoltaic installation help us achieve the highest values of these parameters, i.e., the highest values of the maximum power point. Higher efficiency and fill factor are achieved due to the higher value of the maximum power point. These are important from the point of view of the proper management of the photovoltaic cells.
Author Contributions
Conceptualization, A.I., T.C. and A.A.-Z.; methodology A.I. and T.C.; validation, A.I.; formal analysis, T.C., A.I. and A.A.-Z.; investigation, T.C.; resources, A.I. and M.Z.; data curation, A.I. and A.A.-Z.; writing—original draft preparation, A.I. and T.C.; writing—review and editing, T.C.; visualization, A.A.-Z.; supervision, A.I. and M.Z.; funding acquisition, A.I. and M.Z. All authors have read and agreed to the published version of the manuscript.
Funding
This research received no external funding.
Institutional Review Board Statement
Not applicable.
Informed Consent Statement
Not applicable.
Conflicts of Interest
The authors declare no conflict of interest.
References
- Corcelli, F.; Ripa, M.; Ulgiati, S. End of life treatment of crystalline silicon photovoltaic panels. An energy-based case study. Clean. Prod. 2017, 9, 1129–1142. [Google Scholar] [CrossRef]
- Mroziński, A.; Flizikowski, J. Inżynieria Instalacji Fotowoltaicznych; Grafpol Agnieszka Blicharz-Kurpińska: Bydgoszcz, Poland, 2016. [Google Scholar]
- Mroziński, A.; Piasecka, I. Wspomaganie Komputerowe Projektowanie Wybranych Inztalacji OZE; Grafpol Agnieszka Blicharz-Kurpińska: Bydgoszcz, Poland, 2016. [Google Scholar]
- Ulewicz, R.; Siwiec, D.; Pacana, A.; Tutak, M.; Brudny, J. Multi-Criteria Method for the Selection of Renewable Energy Sources in the Polish Industrial Sector. Energies 2021, 14, 2386. [Google Scholar] [CrossRef]
- Hugh, J. Engineering Design Planning and Management; Academic Press: Cambridge, UK, 1941. [Google Scholar]
- Grądzki, R.; Lindstedt, P. Method of assessment of technical object aptitude in environment of exploitation service conditions. Eksploat. Niezawodn. Maint. Reliab. 2015, 17, 54–63. [Google Scholar] [CrossRef]
- Bauer, T. Thermophotovoltaics: Basic Principles and Critical Aspects of System Design; Springer: Berlin, Germany, 2002. [Google Scholar]
- Wrzesiński, Z. Termodynamika Odnawilanych źródeł Energii; Oficyna Wydawnicza Politechniki Warszawskiej: Warszawa, Poland, 2017. [Google Scholar]
- Hmamou, D.B.; Elyaqouti, M.; Arjdal, E.; Ibrahim, A.; Abdul-Gaffar, H.I.; Aboelsaud, R.; Obukhov, S.; Zaki Diab, A.A. Parameters identification and optimization of photovoltaic panels under real conditions using Lambert W-function. Energy Rep. 2021, 7, 9035–9045. [Google Scholar] [CrossRef]
- Wang, Z.; Zhang, H.; Dou, B.; Zhang, G.; Wu, W. Theoretical and experimental evaluation on the electrical properties of multi-junction solar cells in a reflective concetration photovoltaic system. Energy Rep. 2022, 8, 820–831. [Google Scholar] [CrossRef]
- Mertens, K. Photovoltaics-Fundamentals, Technology and Practice; John Wiley & Sons, Inc.: Hoboken, NJ, USA.
- Sibiński, M.; Znajdek, K. Postepy w Fotowoltaice; PWN: Warszawa, Poland, 2021. [Google Scholar]
- Landsberg, P.T.; Tonge, G. Thermodynamic and Statistical Mechanics; Dover Publications: New York, NY, USA, 1980. [Google Scholar]
- Idzikowski, A.; Cierlicki, T. Economy and Energy Analysis in the Operation of Renewable Energy Installations—A Case Study. Prod. Eng. Arch. 2021, 27, 90–99. [Google Scholar] [CrossRef]
- Markvart, T.; Castaner, L. Solar Cells: Materials, Manufacture and Operation; Elsevier: Oxford, UK, 2005. [Google Scholar]
- Gunnarsson, H.P.; Porsteinsson, E.G. Solid State Electronics, Junction Capacitance and Solar Cells; The University of Iceland: Reykjavik, Iceland, 2005. [Google Scholar]
- Green, M.A. Third Generation Photovoltaics: Advanced Solar Energy Conversion; Springer: Berlin, Germany, 2002. [Google Scholar]
- Singh, R.; Kumar, S. (Eds.) Green Technologies and Environmental Sustainability; Springer International Publishing: Berlin, Germany, 2002. [Google Scholar] [CrossRef]
- Toke, D. Ecological Modernization and Renewable Energy; Palgrave Macmillan: New York, NY, USA, 2011; pp. 167–179. [Google Scholar] [CrossRef] [Green Version]
- Twidell, J.; Weir, T. Renewable Energy Resource; Routledge: London, UK, 2015. [Google Scholar]
- Paranthaman, M.P.; Wong-Ng, W.; Bhattacharya, R.N. Semiconductor Materials for Solar Photovoltaic Cells; Springer International Publishing: Berlin, Germany, 2002; ISBN 978-3-319-20331-7. [Google Scholar]
- Márquez, F.P.G.; Karyotakis, A.; Papaelias, M. Renewable Energies; Springer International Publishing: Berlin, Germany, 2002; ISBN 978-3-319-45364-4. [Google Scholar]
- Meyers, R.A. Encyclopedia of Physical Science and Technology; Elsevier: Amsterdam, The Netherlands, 2020. [Google Scholar]
- Giuseppe, G.; Giuseppe, P.P. Solid State Physics; Elsevier: Amsterdam, The Netherlands, 2020. [Google Scholar]
- Szaynok, A.; Kuźmiński, S. Podstawy Fizyki Powierzchni Półprzewodników; Wydawnictwo Naukowo-Techniczne Warszwa: Warszawa, Poland, 2000. [Google Scholar]
Publisher’s Note: MDPI stays neutral with regard to jurisdictional claims in published maps and institutional affiliations. |
© 2022 by the authors. Licensee MDPI, Basel, Switzerland. This article is an open access article distributed under the terms and conditions of the Creative Commons Attribution (CC BY) license (https://creativecommons.org/licenses/by/4.0/).