Abstract
Integrating the exergy and economic analyses of water electrolyzers is the pivotal way to comprehend the interplay of system costs and improve system performance. For this, a 3D numerical model based on COMSOL Multiphysics Software (version 5.6, COMSOL, Stockholm, Sweden) is integrated with the exergy and exergoeconomic analysis to evaluate the exergoeconomic performance of the proton exchange membrane water electrolysis (PEMWE) under different operating conditions (operating temperature, cathode pressure, current density) and design parameter (membrane thickness). Further, the gas crossover phenomenon is investigated to estimate the impact of gas leakage on analysis reliability under various conditions and criteria. The results reveal that increasing the operating temperature or decreasing the membrane thickness improves both the efficiency and cost of hydrogen exergy while increasing the gas leakage through the membrane. Likewise, raising the current density and the cathode pressure lowers the hydrogen exergy cost and improves the economic performance. The increase in exergy destroyed and hydrogen exergy cost, as well as the decline in second law efficiency due to the gas crossover, are more noticeable at higher pressures. As the cathode pressure rises from 1 to 30 bar at a current density of 10,000 A/m2, the increase in exergy destroyed and hydrogen exergy cost, as well as the decline in second law efficiency, are increased by 37.6 kJ/mol, 4.49 USD/GJ, and 7.1%, respectively. The cheapest green electricity source, which is achieved using onshore wind energy and hydropower, reduces hydrogen production costs and enhances economic efficiency. The growth in the hydrogen exergy cost is by about 4.23 USD/GJ for a 0.01 USD/kWh increase in electricity price at the current density of 20,000 A/m2. All findings would be expected to be quite useful for researchers engaged in the design, development, and optimization of PEMWE.
1. Introduction
One of humanity’s main priorities is to eradicate climate change by reducing air pollution and greenhouse gas emissions while providing a growing demand for energy to support economic development. In this context, hydrogen energy tends to be an efficient means of simplifying the transition to a low-carbon community. Furthermore, the energy density of hydrogen is high and produces no contaminants because of its use. Therefore, it is a viable alternative to fossil fuels and can be employed in a variety of applications, particularly as a transportation fuel [1]. Hydrogen can be derived from various non-renewable energy sources, particularly fossil fuels, and renewable energy sources. Hydrogen production technologies include, but are not limited to, coal gasification, reforming oil/naphtha, steam reforming of methane, biological sources, biomass, and water electrolysis (WE) [2,3,4,5]. WE can be categorized into four forms as follows: polymer exchange membrane water electrolysis (PEMWE) [6,7,8], solid oxide electrolysis (SOE) [9], alkaline water electrolysis (AWE) [10], and microbial electrolysis cells (MEC) [11]. PEMWE has advantages over other types of WE, such as high efficiency, high current density, compact design, high safety, quick response, simple design, and high purity [12,13]. However, because of the higher cost of noble metals used as catalysts, such as Pt/Pd on the cathode side [14] and IrO2/RuO2 on the anode side [15], the cost of PEMWE is higher. Therefore, reducing manufacturing costs and retaining high efficiency are crucial for PEMWE applications.
In this context, system performance analysis and optimization were carried out according to the second law of thermodynamics to enhance the engineering system’s efficiency and performance. Thereby, much exergy analysis research, which can provide a highly valuable way to evaluate the actual behavior and performance of engineering devices [16], has also been conducted for PEMWE performance. Rosen [17] employed energy and exergy analysis to examine the thermodynamic performance of the WE process using current technology equipment. Ni et al. [18] developed a thermodynamic–electrochemical model to analyze the energy and exergy behavior of PEMWE. The results showed that the operating temperature should not exceed 373 K to increase the ionic conductivity by supplying liquid water, but a high-temperature operation is preferred. Nafchi et al. [19] noted that the energy and exergy efficiency of the PEMWE declined by increasing the current density and cathode pressure or reducing the working temperature.
Since economic concerns are critical for the commercialization of the PEMWE, an exergoeconomic analysis of the PEMWE technology is also very necessary. The exergoeconomic study can relate exergy to economics and includes calculations of the net exergy transfer rate as well as the operation, maintenance, and capital investment costs. Javadi et al. [20] introduced the 4E analysis, which stands for energy, exergy, economic, and environmental, of three different configurations of a combined cycle power plant integrated with a solar power tower system. This analysis was developed to improve the performance of the power plant, which is located in the southwest of Iran. Javadi et al. [21] developed an exergoeconomic and environmental analysis of a multi-generation system that generates hydrogen, fresh water, and electricity. The study was to identify the system components with the highest exergy and exergy destruction costs. However, most of the research regarding the exergy analysis of PEMWE has been conducted without considering exergoeconomic analysis [22,23,24]. Özdenet et al. [22] conducted an exergy and economic study for PEMWE. The results showed that PEMWE had a greater exergy efficiency than the energy efficiency, indicating that the system is more exergy efficient. Kazim [23] introduced an exergoeconomic analysis at different operating pressures and temperatures for PEMWE. It was indicated that the exergy cost is decreased by lowering the temperature, which conflicts with Toghyani’s findings [24] that the exergy cost of hydrogen decreases by raising the temperature. They also [24] modeled PEMWE numerically using the finite volume method to investigate the exergoeconomic performance. In their study, the electrical energy input varies with different conditions, leading the operating cost to change under various circumstances, which contradicts the behavior of the exergoeconomic analysis. Therefore, in the present study, the fixed capital cost under various conditions is determined using the chemical engineering plant cost index (CEPCI) of 547.2 as of October 2015 for a hydrogen capacity of 700 Nm3/h [25].
In addition, the gas crossover is believed to be one of the most critical phenomena influencing membrane degradation, safety issues, and cell performance. The permeation of gases through the membrane reduces the Faradaic efficiency due to the reduction of the production gas. Therefore, the energy required to compensate for the hydrogen leakage increases, resulting in reducing the cell’s performance and efficiency [26,27,28]. Nguyen et al. [29] numerically and experimentally examined the gas crossover inside the membrane for the PEMFC. The gas crossover rate and the diffusion coefficient through the membrane rise with increasing temperature and relative humidity. Moreover, the diffusion coefficient across the membrane of hydrogen has about twice the value of oxygen as the molecular size of hydrogen is smaller than that of oxygen. Omrani et al. [30] found that raising the temperature leads to an increase in the hydrogen crossover owing to an increase in both the diffusion coefficient and hydrogen solubility. Schalenbach et al. [27] investigated the gas crossover and efficiency losses of PEMWE. The results showed that the anode catalyst layer (iridium oxide) does not oxidize hydrogen gas, resulting in an explosion problem where the safety limit is 2% hydrogen in oxygen. Further, Afshari et al. [31] developed a mathematical model to study the phenomenon of gas crossover in PEMWE. The anodic hydrogen content is calculated at different temperatures, cathode pressures, and membrane thicknesses. The hydrogen crossover rate is reduced with a thicker membrane, while it is increased at higher cathode pressure owing to an increase in the pressure difference between the anode and cathode channels.
From the above literature review, little consideration has been paid to exergoeconomic analysis of the PEMWE. Furthermore, the exergoeconomic analysis available in the literature was computed without considering the influence of gas crossing through the membrane. Therefore, this paper is an extension and supplement to our previous research titled “Numerical Investigation on the Effects of Design Parameters and Operating Conditions on the Electrochemical Performance of PEM Water Electrolysis” [32], in which a comprehensive exergy and exergoeconomic analysis considering the influence of gas crossover was presented to address this knowledge gap. First, a three-dimensional single-phase model of PEMWE using the finite element method is presented. Then, the model is integrated into the exergy and exergoeconomic analysis to study the effects of membrane thickness, cathode pressure, current density, and operating temperature on the voltage efficiency, exergy destroyed, second law efficiency, and hydrogen exergy cost. The comparison between the exergy and exergoeconomic analysis with and without the influence of gas crossover in different conditions is also studied. Moreover, the effect of various renewable energy resources on the cost of hydrogen exergy is also investigated. All findings would be expected to be quite useful for researchers engaged in the design, development, and optimization of PEMWE.
2. Numerical Simulation
2.1. System Description
A PEMWE is made up of a membrane (PEM) sandwiched between two electrodes. The membrane divides the PEMWE into two parts called cathode and anode, which individually consist of a gas channel, a gas diffusion layer, and a catalyst layer. A schematic diagram of a typical PEMWE is shown in Figure 1. On the anode side, water enters the anode channel (ACH) and then passes through the porous gas diffusion layer (AGDL) to the anode catalyst layer (ACL) where water is split into protons, oxygen, and electrons as a result of semi-reactions of oxidation, as shown in Equation (1). Hydrogen protons pass through the membrane to the cathode catalyst layer (CCL), and electrons also migrate to the CCL via an external circuit. On the cathode side, hydrogen protons and electrons combine and produce hydrogen gas as a result of semi-reactions of a reduction, which is denoted by Equation (2). The overall reaction is presented in Equation (3).
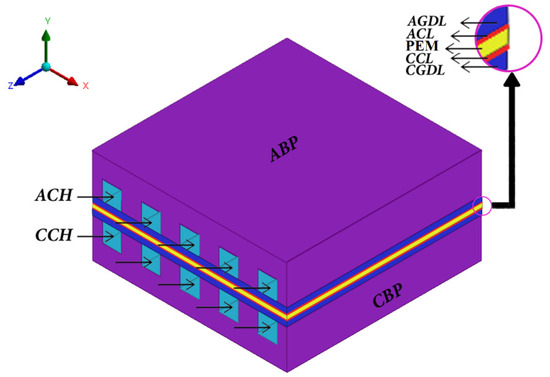
Figure 1.
Schematic diagram of a typical PEMWE.
2.2. Model Assumptions
The modeling studies aim to predict the electrochemical reactions as well as the exergy and exergoeconomic analysis of PEMWE. In this model, the following assumptions are made to prevent ambiguity and preserve consistency in a successful compromise. The assumptions of this model are as follows:
- The system is modelled in a steady state condition.
- Flow is laminar and incompressible.
- Changes in kinetic and potential energy are discarded.
- The anode pressure is equal to 1 bar.
- The ideal gas behavior is applied to the gas mixture.
- The contact resistance between various layers has been overlooked.
- The GDL, catalyst layer, and membrane are treated as isotropic and homogeneous.
The reference environment conditions are P0 = 1.01 bar and T0 = 298.15 K.
2.3. Modeling Definition
In this study, nonlinear differential equations for a three-dimensional single-cell PEMWE are modeled using the finite element method, which includes conservation equations of energy, momentum, mass, species, and electric charge for electrochemical reactions to be solved simultaneously across seven regions of the cell, consisting of the anode and cathode catalyst layer, GDLs, channels, and membrane. The CFD model is implemented with a single-domain approach. COMSOL Multiphysics is used to create the numerical model. An iterative process is carried out to resolve the set of equations until the residual reaches 10−6. The mesh independence of the results is verified in order to certify that the results are independent of the mesh, and the mesh count to ensure the independence of the results is approximately 165,000 cells. The geometry parameters, physical parameters, and operating conditions for the PEMWE are shown in Table 1 and Table 2. Moreover, the main differential equations, including the species transport equation, continuity equation, momentum conservation equation, energy conservation equation, electronic charge conservation equation, and protonic charge conservation equation are summarized in Equations (4)–(9). The corresponding source terms are employed according to the earlier research conducted by Toghyani et al. [33].

Table 1.
Geometry parameters for the PEMWE.
Table 2.
Physical properties and operating conditions for the PEMWE.
2.4. Gas Crossover through the Membrane
By Fick’s law, the diffusive crossover flux of gases across the membrane (), oxygen from anode to cathode, and hydrogen from the cathode to the anode can be estimated by Equation (10) [50]. It can also be expressed as Equation (11), which relies on the partial pressure of oxygen and hydrogen, as well as the gas permeability coefficient on both sides of the membrane [27].
where and denote the concentration and diffusion coefficient of gases on both sides of the membrane, and is the thickness of the membrane. is the gas permeability coefficient in the membrane, which can be described by Equations (12) and (13) [46].
where denotes the activation energy of gases, and is the volume fraction of water inside the membrane; can be expressed as Equation (14) [46].
where is the relative humidity that varies widely between 14 and 25 [51] and is equal to 20 for the current model. and represent the molar volume of the dry membrane and water.
The diffusive crossover flux through the membrane by Equation (11) can be expressed as Equations (15) and (16).
PEMWE can be operated at different pressures on the two sides of the membrane. The pressure on the cathode side may be greater than that on the anode side. This results in additional driving force for hydrogen gas to permeate through the membrane. The hydrogen permeation driven by the differential pressure on both sides of the membrane can be described as Equation (17) [27].
where and are the permeability coefficient and the hydrogen permeation due to the differential pressure. So, the total hydrogen and oxygen flux through the membrane () are expressed as Equations (18) and (19).
The Faraday efficiency () due to gas crossover can be described using the gas permeation and production rates of hydrogen and oxygen as Equation (20) [27]. The permeation of gases across the membrane reduces the Faradaic efficiency due to the reduction of the total gas production. Moreover, the electrical power required to compensate for the hydrogen leakage increases. Therefore, the hydrogen leakage resulting from the gas crossover lowers the overall hydrogen production as well as the cell performance of PEMWE.
where and are the hydrogen and oxygen production rates, which can be calculated using Faraday’s law as Equations (21) and (22) [4]:
2.5. PEMWE Efficiency according to the Voltage and Exergy Analysis
Various methods have already been used to assess the efficiency of the PEMWE. Among these methods, the voltage and second law efficiency are investigated in the current study. The voltage efficiency can be used to determine the actual stack voltage deviation that departs from the ideal stack voltage in an ideal condition. The voltage efficiency () can be expressed by Equation (23) [49].
where and represent the thermo-neutral voltage and the actual voltage. The thermoneutral voltage is obtained when no waste heat is produced during the electrolysis process where the thermal efficiency is equal to 100%. The thermoneutral voltage corresponding to the high heating value can be calculated as Equation (24) [52].
where , and F are the standard enthalpy of liquid water formation, the number of electrons, and the Faraday constant, respectively.
Exergy is the maximum amount of useful work that a system can produce, and it is a valuable method for assessing energy quality and quantifying the work potential of various systems. The second law efficiency is taken as an indicator to approximate the reversible process. The exergy balance relation is illustrated in Equation (25) [16].
where is the exergy input, is the exergy output, represents the rate of exergy destruction triggered by irreversibilities, and represents the change in exergy of the system. Figure 2 depicts all terms of the PEMWE exergy and exergoeconomic analysis. Therefore, the exergy input to the electrolyzer can be expressed by Equation (26):
where , , , and are the exergy of water, electrical exergy, water consumption rate, and specific exergy of water, respectively. The exergy output of the electrolyzer is the sum of exergy of hydrogen and oxygen production and can be determined by Equation (27).
where and are the exergy of oxygen and hydrogen and are the hydrogen and oxygen production rates, and are the specific exergy of hydrogen and oxygen. Therefore, the exergy relation in Equation (25) can be expressed as Equation (28) to identify irreversibilities, which is represented as exergy destroyed in exergy balance relations.
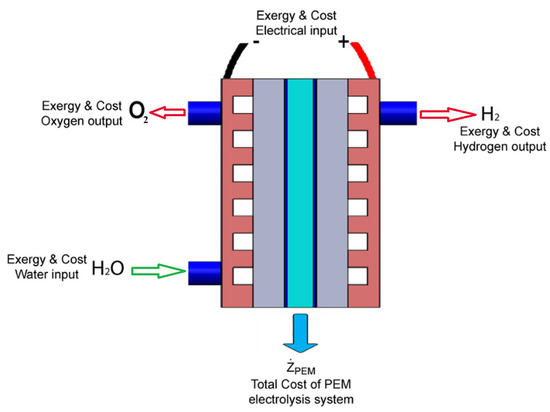
Figure 2.
Components of exergy and exergoeconomic analysis for a PEMWE.
The specific exergy is calculated using Equation (29).
where represent the specific physical and chemical exergies. The chemical exergy of liquid water, oxygen, and hydrogen are stated as 0.9, 3.97, and 236.1 kJ/mol, respectively [48]. Physical exergy can be expressed as Equation (30) [22].
where h and S are the specific enthalpy and entropy, hydrogen and oxygen can be considered ideal gases, and the physical exergy can be rewritten as Equation (31).
where represents the specific heat at constant pressure, and is the gas constant. The second law efficiency () is used as a measure of closeness to the reversible process and can be calculated as Equation (32) [16]. The exergy destruction ( is calculated using exergy balances as Equation (28).
2.6. Exergoeconomic Analysis for the PEMWE
Cost balances for the PEMWE demonstrate that all output costs of exergy streams are equal to all input costs for exergy streams plus necessary capital expenditures as well as the operating and maintenance charges [53]. All components of exergoeconomic analysis for the PEMWE can be described as shown in Figure 2. The cost balance equation for the PEMWE system is written as Equation (33), and all terms of cost balance are generally positive. The cost balance is expressed as a function of cost per unit exergy as Equation (34) [54,55].
where and represent the flow cost rate (USD/h) and the cost per unit exergy (USD/GJ). represents the total investment cost of PEMWE. The total investment cost of the PEMWE generating hydrogen capacity of 700 Nm3/h was estimated by using the chemical engineering plant cost index (CEPCI) of 547.2 as of October 2015 [25]. The capital cost, which includes H2 production equipment, pumps, storage, installation, dispenser, and supplements, is 819,513 USD/y, whereas maintenance, labor, land rent, and other running costs are 253,244 USD/y. The electrical energy consumption varies according to the operating conditions and design parameters, resulting in a change in the operating cost. As a result, the exergoeconomic analysis’s behavior and the hydrogen exergy cost change. The total investment cost can be calculated as Equation (35) [24].
where and denote the capital and operating costs of the PEMWE. The overhead costs are converted to annual costs using the capital recovery factor (CRF). The capital recovery factor depends on the equipment lifetime and interest rate and can be calculated as Equation (36) [23]:
where ir expresses the interest rate, and n represents the total operating period of the system in years. The concept of expenditure is not specifically related to the exergy destruction in the formulation of cost balance (Equation (34)), and the exergy destruction cost is considered a cryptic variable. If the exergoeconomic balances are coupled with the exergy balance, where from the exergy balance (Equation (28)) is exchanged for the exergoeconomic balance (Equation (34)), then the following relation (Equation (37)) is generated.
in which the last term on the right side shows the exergy destruction rate. Although the unit cost of electricity is independent of the exergy destruction, the calculation of the exergy destruction cost () combines the electricity cost and the exergy destruction rate and can be calculated as Equation (38) [55].
2.7. Validation
In order to validate the results of the simulation model, the numerical results are compared with the data of the experimental investigation presented by Millet [56]. The polarization curve predicted from the current model is compared to the polarization curve of the experimental study developed from [56] under the operating conditions of pressure at 1 bar and temperatures of 353 and 343 K, as given in Figure 3. The model predictions are in good agreement with the experimental results [56]. The maximum error in voltage measurements of the present model is equivalent to 0.02 and 0.0354 V at operating temperatures of 353 and 343 K, respectively, in comparison to the experiment data.
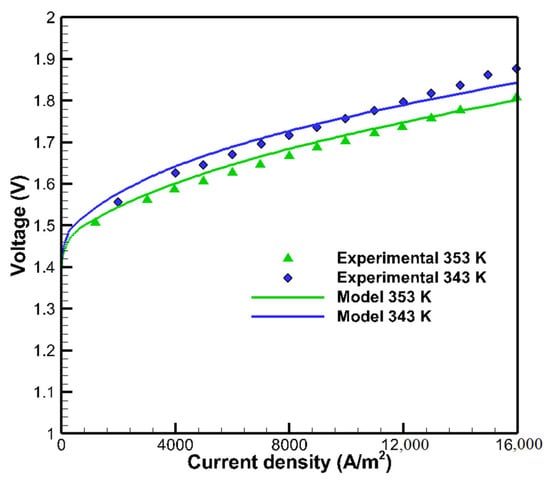
Figure 3.
Comparison of polarization curve between experimental data developed from [56] and the present model.
3. Results and Discussion
In this study, the fixed capital cost and the variation in the amount of electrical energy input are each considered with different conditions to avoid contradicting the results of the previous exergoeconomic analysis research of the PEMWE. Therefore, the exergy and exergoeconomic analysis are introduced here to study the effects of current density, operating temperature, cathode pressure, and membrane thickness on the voltage efficiency, exergy destroyed, second law efficiency, and hydrogen exergy cost. In addition, this research fills a gap in the literature by developing exergy and exergoeconomic assessments that consider the impact of gas crossover phenomena. The gas crossover phenomena influence the exergy and exergoeconomic study since such analyses are functional in the parameters of hydrogen exergy and cost, as well as oxygen exergy and cost, which depend on oxygen and hydrogen generation.
3.1. Effect of the Current Density
The effects of current density on the voltage efficiency, specific exergy destroyed, second law efficiency, hydrogen exergy cost, and investment cost ratio are shown in Figure 4 at an operating temperature of 353 K and pressure of 1 bar. It is realized in Figure 4a that the voltage efficiency decreases with the increase of the current density, where the voltage efficiency decreases from 96% to 78.5% with increasing the current density from 2000 to 23,000 A/m2. An increase in the current density leads to an increase in the actual voltage and power consumption, leading the actual voltage to diverge further from the ideal voltage, and consequently, the voltage efficiency decreases. The specific exergy destroyed has been found to increase with growing the current density due to the increasing quantity of chemical reactions, increasing the irreversibilities. Therefore, the second law efficiency decreases with raising the current density. It is also noticed from Figure 4b that the hydrogen exergy costs are reduced with raising the current density, even though the voltage and the second law efficiency decrease. At lower current density, the hydrogen production drops, which reduces the economic feasibility, as the capital cost and the lifetime of PEMWE are roughly constant. The capital cost ratio to the total cost decreases from 81 to 27% with the current density rising from 2000 to 20,000 A/m2. Moreover, the hydrogen exergy cost is reduced from 59.7 to 33.4 USD/GJ as the current density grows from 5000 to 20,000 A/m2.
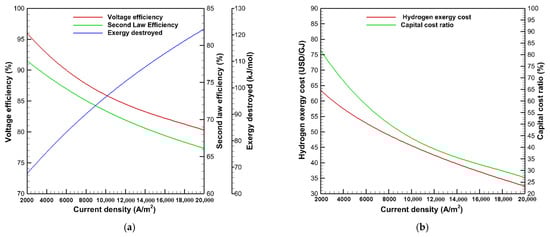
Figure 4.
Effects of current density on (a) voltage efficiency, exergy destroyed, second law efficiency, (b) hydrogen exergy cost, and capital cost ratio.
Figure 5 indicates the effects of current density on Faraday’s efficiency, the increase in exergy destroyed, the decrease in the second law efficiency, and the increase in hydrogen exergy cost due to the impact of gas crossover across the membrane at the operating temperature, pressure, and membrane thickness of 353 K, 1 bar, and 50 μm, respectively. It is observed in Figure 5a that Faraday’s efficiency increases at higher current density due to the high hydrogen and oxygen generation from the electrochemical reaction, as stated in Equations (21) and (22), which raises the denominator in Equation (20), resulting in a rise in Faraday’s efficiency at high current density. Faraday’s efficiency is improved from 98.6 to 99.7 % by increasing the current density from 2000 to 20,000 A/m2. It is also shown in Figure 5a,b that the rise in exergy destruction and hydrogen exergy cost, as well as the loss in second law efficiency due to the impact of the gas crossover, are noticeable at lower current density and diminish with raising the current density, eventually becoming negligible at higher current density. Therefore, the gas permeation to gas production ratio becomes relatively insignificant and is negligible at high current density, rendering the impact of gas crossover ineffective. As a result, it is recommended to operate the PEMWE at a high current density as far as possible to achieve maximum hydrogen production with maximum economic feasibility. Furthermore, the operation at a high current density limits the influence of gas crossover.
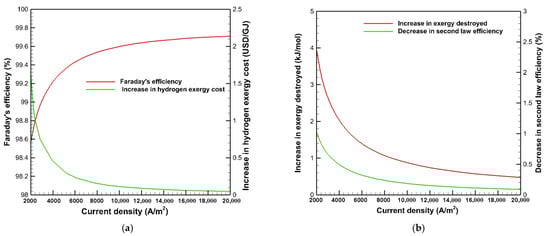
Figure 5.
Effects of current density on; (a) Faraday’s efficiency, the increase in hydrogen exergy cost; (b) the increase in exergy destroyed, and the decrease in second law efficiency.
3.2. Effect of the Operating Temperature
The exergy, exergoeconomic analysis, and the gas crossover phenomena are studied under different operating temperatures from 323 to 363 K at the same operating pressure and membrane thickness of 1 bar and 50 μm, respectively. Figure 6 presents the effects of operating temperature on the voltage efficiency, exergy destroyed, second law efficiency, and hydrogen exergy cost. The findings show that the voltage efficiency improves as the temperature increases. For instance, the voltage efficiency increases from 76.9 to 84% at a current density of 16,000 A/m2 with a raise in temperature from 323 to 363 K, respectively. On the one hand, the open-circuit voltage, ion conductivity, and exchange current density are enhanced by a temperature rise. On the other hand, the thermal energy required for the electrolysis reaction is minimized, and thus the exergy input is decreased. Therefore, the irreversibilities are decreased, leading to a reduction of the exergy destruction, which in turn improves the second law efficiency. The specific exergy destroyed is decreased by almost 32 kJ/mol, and the second law efficiency is improved by nearly 6% at a current density of 16,000 A/m2 by increasing the temperature from 323 to 363 K. It is also found in Figure 6d that raising the temperature reduces the hydrogen exergy cost because of the enhancement of voltage efficiency and second law efficiency at high temperature. Raising the temperature from 323 to 363 K reduces the hydrogen exergy cost from 36.5 to 34.3 USD/GJ at a current density of 18,000 A/m2.
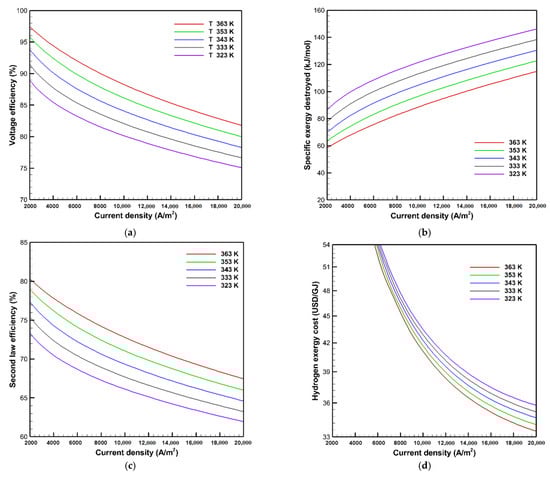
Figure 6.
Effects of temperature on: (a) voltage efficiency; (b) exergy destroyed; (c) second law efficiency; and (d) hydrogen exergy cost.
Figure 7 shows the effects of gas crossover through the membrane on Faraday’s efficiency, the increase in exergy destruction, the loss of second law efficiency, and the increase in hydrogen exergy cost as a function of the operating temperature. According to the findings, lowering the operating temperature increases Faraday’s efficiency, as it improves by roughly 0.5% when the operating temperature is reduced from 363 to 323 K. Moreover, as shown in Figure 7 b–d, the operating temperature degrades the PEMWE performance according to the gas crossover phenomena. The rise in exergy destruction, hydrogen exergy cost, and the decrease in second law efficiency increase with raising the temperature. At the current density of 10,000 A/m2, increasing the operating temperature from 323 to 363 K raises the increase in exergy destroyed, hydrogen exergy cost, and second law efficiency reduction owing to the gas crossover effect by 0.48 kJ/mol, 0.063 USD/GJ, and 0.14%, respectively. The gas permeability coefficients of the membrane are defined as the critical factor in evaluating the rate at which gases pass through the membrane, which increases with raising the operating temperature as described in Equations (12) and (13). The amorphous regions and the ion clusters size grow with raising the temperature. Consequently, the ratio between the amorphous and the crystalline phase is increased, leading to a rise in the gas permeability. Because gases permeate mostly via the amorphous hydrophobic region of nafion, whereas the crystalline region prevents gases from passing through the membrane [29,57], the rate of gas crossover increases with temperature rises.
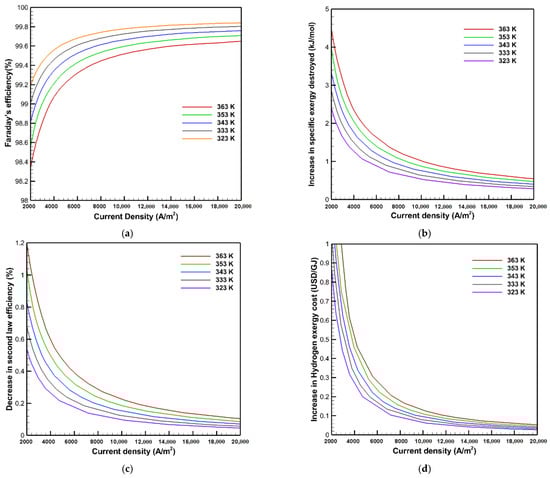
Figure 7.
Effects of temperature on: (a) Faraday’s efficiency; (b) the increase in exergy destroyed; (c) the decrease in second law efficiency; and (d) the increase in hydrogen exergy cost.
Finally, it can be inferred that the gas crossover through the membrane increases with raising the operating temperature, which has an undesirable influence on the exergy and exergoeconomic analysis, but this effect is insignificant. Therefore, operating the PEMWE at high temperature is more valuable to take advantage of reducing the hydrogen exergy cost and reaching high economic proficiency. However, membrane dehydration and high corrosion must be considered at a high operating temperature, which needs further investigation.
3.3. Effect of the Cathode Pressure
The effects of different cathode pressures from 1 to 30 bar at the operating temperature of 353 K, a membrane thickness of 50 μm, and an anode pressure of 1 bar are studied in this section. The voltage efficiency, exergy destroyed, second law efficiency, and hydrogen exergy cost are illustrated in Figure 8 at different cathode pressures. The voltage efficiency is lowered with an increase in cathode pressure, where the voltage efficiency is reduced from 82.8 to 80.6% at a current density of 15,000 A/m2 by raising the cathode pressure from 1 to 30 bar, respectively. The hydrogen ion diffusion across the membrane declines, while the open voltage circuit increases by raising the cathode pressure, which contributes to the deterioration of electrochemical reactions and delays the kinetics of the charge transfer. Consequently, the activation overpotential deteriorates, which increases the actual voltage and contributes to the voltage efficiency degradation. On the other hand, the efficiency of the second law is enhanced at higher cathode pressure because the rise in cathode pressure not only raises the exergy supply to the PEMWE but also contributes to increased hydrogen exergy output from the PEMWE. The hydrogen exergy increases with increasing the high pressure of hydrogen production because the quality and work potential of hydrogen are increased with the growth in hydrogen pressure.
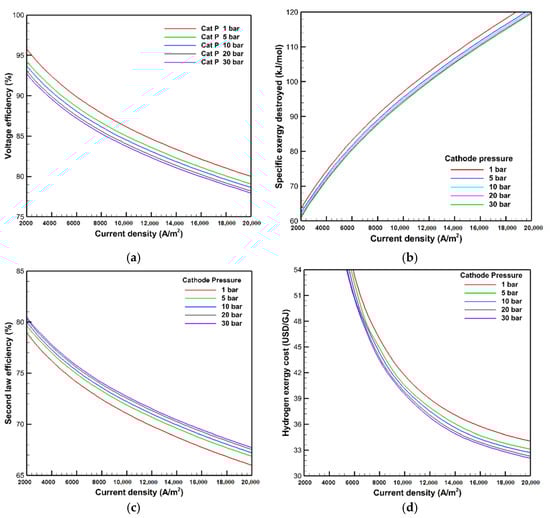
Figure 8.
Effects of cathode pressure on: (a) voltage efficiency; (b) exergy destroyed; (c) second law efficiency; and (d) hydrogen exergy cost.
Consequently, the exergy destroyed is reduced at higher cathode pressure, and thereby, the second law efficiency is improved. The specific exergy destroyed is reduced by almost 3 kJ/mol at the current density of 15,000 A/m2 with the cathode pressure increasing from 1 to 30 bar, whereas the second law efficiency is improved by 1.7%, respectively. It is also found in Figure 8d that the hydrogen exergy costs are minimized by rising cathode pressure due to the low exergy destruction and high second law efficiency at high cathode pressure, where hydrogen exergy cost is diminished from 36.5 to 34.4 USD/GJ at the current density of 15,000 A/m2 with raising the cathode pressure from 1 to 30 bar, respectively.
Figure 9 depicts the effects of cathode pressure on Faraday’s efficiency, the rise in exergy destroyed, second law efficiency loss, and hydrogen exergy cost owing to the gas crossover across the membrane. From Figure 9a, raising the cathode pressure significantly deteriorates Faraday’s efficiency. Faraday’s efficiency at the current density of 10,000 A/m2 is reduced from 99.6 to 89.6% by raising the cathode pressure from 1 to 30 bar. The explanation for this occurrence is that increasing the cathode pressure boosts the differential pressure between the two sides of the membrane and provides another additional incentive for the hydrogen gas to escape through the membrane. As a result, more hydrogen is likely to leak from the cathode to the anode, making the high cathode pressure a disadvantage in this context. Consequently, the influence of cathode pressure on the exergy and exergoeconomic analysis concerning the gas crossover issue has a significant impact, as shown in Figure 9b–d. As the cathode pressure rises from 1 to 30 bar, the increase in exergy destroyed and hydrogen exergy cost, as well as the decline in second law efficiency due to the gas crossover impact at the current density of 10,000 A/m2, are increased from 0.9 kJ/mol, 0.11 USD/GJ, and 0.2% to 38.5 kJ/mol, 4.6 USD/GJ, and 7.3%, respectively.
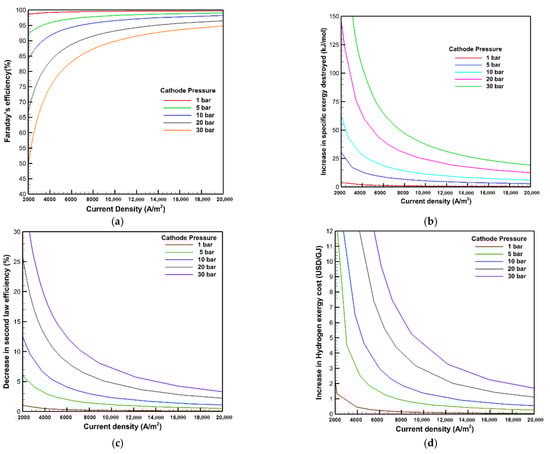
Figure 9.
Effects of cathode pressure on: (a) Faraday’s efficiency; (b) the increase in exergy destroyed; (c) the decrease in second law efficiency; and (d) the increase in hydrogen exergy cost.
The increase in the gas crossover at higher cathode pressure reduces costs and efficiency while simultaneously increasing explosion hazards [28]. Because the hydrogen concentration on the anode side might reach dangerous explosion levels, the normal safety limit is 2 mol % H2 in O2. The extensive mixing of product gases owing to the gas crossover at high cathode pressure should be avoided [27]. As a result, further research is needed to suggest alternative ideas for resolving the gas permeability through the membrane and the explosion limit issues.
3.4. Effect of the Membrane Thickness
The influences of membrane thickness on the voltage efficiency, exergy destroyed, second law efficiency, and hydrogen exergy cost, which are shown in Figure 10, are assessed at an operating temperature and pressure of 353 K and 1 bar. The results show that increasing the membrane thickness leads to a reduction in the voltage efficiency as a result of the actual voltage rise. The voltage efficiency drops from 82.8 to 73.9% at a current density of 15,000 A/m2 by increasing the membrane thickness from 0.05 to 0.25 mm. It is also observed from Figure 10b,c that the exergy destroyed increases with a thicker membrane, which in turn degrades the second law efficiency. The ionic resistance increases with a rise in membrane thickness, which declines the ion diffusion through the membrane and degrades the rate of the electrochemical reaction. Therefore, the ohmic overpotentials at high membrane thickness are increased, which leads to an increase in the irreversibilities and the required exergy input in the form of electrical power. Consequently, the specific exergy destroyed is increased with raising the membrane thickness, while the second law efficiency deteriorates. At the current density of 15,000 A/m2, the specific exergy destroyed is decreased by almost 41.8 kJ/mol, whereby the second law efficiency is enhanced by nearly 7.3% as the membrane thickness is reduced from 0.25 to 0.05 mm. It is also illustrated in Figure 10d that the hydrogen exergy cost is improved using a thin membrane. This reflects the effects of reducing the irreversibility and enhancing the second law efficiency, being reduced from 39.3 to 36.5 USD/GJ at the current density of 15,000 A/m2 with the membrane thickness reduction from 0.25 to 0.05 mm.
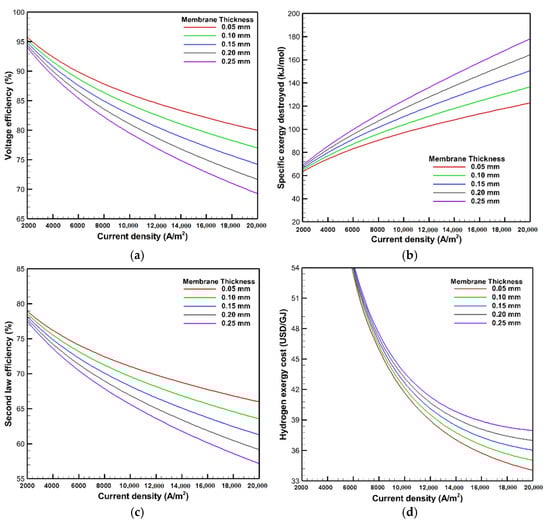
Figure 10.
Effects of membrane thickness on: (a) voltage efficiency; (b) exergy destroyed; (c) second law efficiency; and (d) hydrogen exergy cost.
Figure 11 illustrates the influence of the crossover phenomenon on Faraday’s efficiency, the exergy, and exergoeconomic analysis under different membrane thicknesses at an operating temperature and pressure of 353 K and 1 bar. The findings depict that employing a thicker membrane enhances efficiency and minimizes the amount of gas leakage passing through the membrane, thus using a thicker membrane in PEMWE declines the influence of the crossover phenomenon. The Faraday efficiency deteriorates by 0.5% with decreasing membrane thickness from 250 to 50 μm at the current density of 10,000 A/m2. This phenomenon can be described as a thicker membrane increasing the barrier and the resistance of gas molecules to leak in the opposite direction through the membrane, thereby the hydrogen crossover decreases with increasing the membrane thickness, improving the PEMWE performance related to the gas crossover phenomena. Additionally, the rise in exergy destruction and hydrogen exergy costs and the reduction in second law efficiency are reduced at the thicker membrane considering the gas crossover behavior. Thus, the implementation of a thicker membrane has a beneficial effect according to the gas crossover phenomena. At the current density of 10,000 A/m2, the second law efficiency reduction and the increase in hydrogen exergy cost due to the gas crossover are increased by 0.2% and 0.1 USD/GJ, respectively, with a lowering of the membrane thickness from 250 to 50 μm. Moreover, it is also observed from Figure 11 that the curves for 150, 200, and 250 μm membrane thicknesses are quite close together; thus raising the membrane thickness by more than 150 μm has no noticeable influence on Faraday’s efficiency and the comparison of the analysis results.
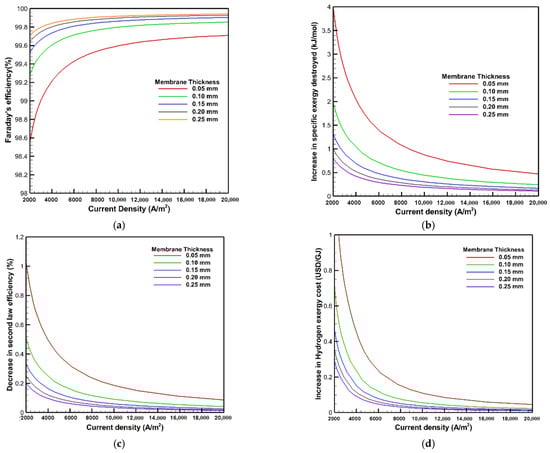
Figure 11.
Effects of membrane thickness on: (a) Faraday’s efficiency; (b) the increase in exergy destroyed; (c) the decrease in second law efficiency; and (d) the increase in hydrogen exergy cost.
As a result, using a thin membrane mitigates the irreversibility and ohmic overpotentials but increases the gas leakage through the membrane. Therefore, it may be necessary to determine the appropriate membrane thickness value and a trade-off between the ohmic overpotential losses and the hydrogen leakage for the ideal overall cell performance and hydrogen cost. Further studies of low gas crossover, high membrane stability, and longevity at low thickness are also needed.
3.5. Electricity Price Effect
It is well known that the price of electricity varies among countries. Similarly, the price of electricity generated from different renewable energy resources also varies as well. The electricity price generated from various renewable energy resources, including bioenergy, geothermal, hydropower, solar photovoltaics, concentrating solar power, offshore wind energy, and onshore wind energy as stated by Lee et al. [58] is used in this paper. Therefore, this study could be appropriate for various countries and different renewable energy resources by observing the impact of different electricity prices on hydrogen cost. The effect of the electricity price on the hydrogen exergy cost for PEMWE is shown in Figure 12a under an operating current density, a temperature, and a pressure of 20,000 A/m2, 353 K, and 1 bar, respectively. The cost of hydrogen exergy increases by raising the electricity price since the electricity cost ratio to the overall cost is almost 73% at an electricity price of 0.06 USD/kWh. The growth in the hydrogen exergy cost is by about 4.23 USD/GJ for an electricity price increase of 0.01 USD/kWh at the current density of 20,000 A/m2, reflecting the significant impact of the electricity price on the cost of hydrogen production. With increasing the electricity price from 0.03 to 0.27 USD/kWh, the hydrogen exergy cost is raised from 21.4 to 123 USD/GJ, which corresponds to the rise in the hydrogen exergy cost from 0.077 to 0.44 USD/kWh. Figure 12b depicts the effect of electricity prices generated from various renewable energy resources on hydrogen exergy costs. The lowest price of renewable electricity has been achieved by employing onshore wind energy and hydropower. In contrast, the highest price for renewable electricity has been attained from concentrating solar power. Consequently, the maximum hydrogen exergy cost is achieved using concentrating solar power, whereas it is less costly using onshore wind and hydro. Therefore, it should be mentioned that it is essential to utilize the lowest possible electricity price to run the PEMWE, which intensively minimizes the cost of hydrogen production and improves the economic proficiency.
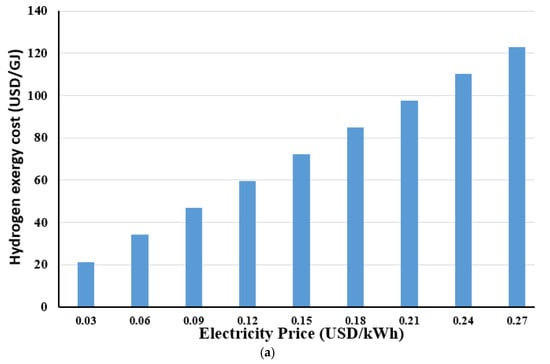
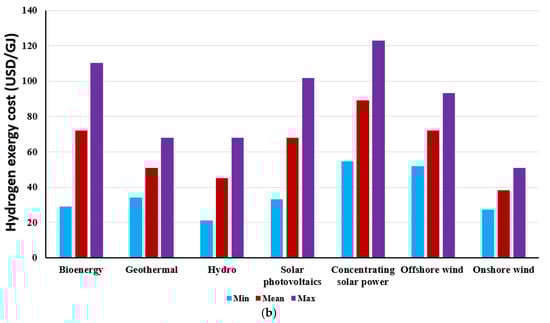
Figure 12.
Hydrogen exergy cost with different: (a) electricity prices; and (b) electricity generated using various renewable energy resources.
4. Conclusions
In this study, a three-dimensional numerical model using the finite element method is combined with the exergy and exergoeconomic analysis to assess the influence of design parameters and operating conditions on the voltage efficiency, exergy destroyed, second law efficiency, and hydrogen exergy cost. Additionally, the gas crossover phenomena have been incorporated into the model to compare the exergy and exergoeconomic analysis with and without considering the gas crossover phenomena under different conditions. The main results are summarized as follows:
- The current density, operating temperature, membrane thickness, and cathode pressure have a tremendous effect on the exergy and exergoeconomic analysis for PEMWE.
- Both voltage and second law efficiency are favorably affected by increasing the operating temperature and decreasing the membrane thickness, minimizing the hydrogen exergy cost. When the gas leakage through the membrane increases, the trade-off between the ohmic overpotentials losses and hydrogen leakage for ideal overall cell performance and hydrogen cost becomes a critical issue and needs future research. The voltage and second law efficiency are reduced by nearly 9% and 7.3% at a current density of 15,000 A/m2 by increasing the membrane thickness from 0.05 to 0.25 mm. At the same time, the hydrogen exergy cost is increased from 36.5 to 39.3 USD/GJ.
- The increase in exergy destroyed and hydrogen exergy cost, as well as the decline in second law efficiency due to the gas crossover, are more noticeable at higher pressures. As the cathode pressure rises from 1 to 30 bar at a current density of 10,000 A/m2, the increase in energy destroyed and hydrogen exergy cost, as well as the decline in second law efficiency, increase from 0.9 kJ/mol, 0.11 USD/GJ, and 0.2% to 38.5 kJ/mol, 4.6 USD/GJ, and 7.3%, respectively. As a result, raising the cathode pressure not only significantly deteriorates the gas crossover performance but also raises the hazard of explosion. Therefore, further study is needed in the future to propose alternate solutions to the gas crossover and explosion issues.
- The effects of gas crossover and hydrogen leakage on the exergy and exergoeconomic analysis are prominent at low current densities and reduce gradually with increasing current densities, and finally become insignificant at high current densities. Furthermore, increasing the current density has a positive effect on the hydrogen exergy cost. The hydrogen exergy cost is reduced from 59.7 to 33.4 USD/GJ as the current density grows from 5000 to 20,000 A/m2. As a result, the PEMWE performance associated with the gas crossover phenomenon and the hydrogen cost is more optimal at high current density.
Author Contributions
Conceptualization, A.H.H. and K.W.; methodology, Z.L. and M.M.A.; software, A.H.H.; validation, A.H.H., M.M.A. and Z.L.; formal analysis, M.M.A.; investigation, C.X.; resources, Y.W.; data curation, Y.W., A.H.H. and K.W.; writing—original draft preparation, A.H.H.; writing—review and editing, Z.L. and C.X.; visualization, Y.W. and M.M.A.; supervision, C.X. and Z.L.; project administration, C.X.; funding acquisition, C.X. All authors have read and agreed to the published version of the manuscript.
Funding
This work was supported by the National Natural Science Foundation of China (Grant Numbers 51821004 and 51876061) and the Interdisciplinary Innovation Program of North China Electric Power University.
Data Availability Statement
Not applicable.
Conflicts of Interest
The authors declare no conflict of interest.
Abbreviations
| Nomenclature | |
| Flow cost rate, USD × h−1 | |
| c | Flow cost rate per unit exergy, USD × GJ−1 |
| CRF | Factor of capital recovery |
| Effective diffusion coefficient, m2 × s−1 | |
| Standard enthalpy of formation for liquid water, kJ × mol−1 | |
| ir | Interest rate |
| Total current density, A | |
| n | Overall system’s operational period, year |
| Reaction rate of species, mol × m−2 × s−1 | |
| Diffusive hydrogen crossover flux, mol × m−2 × s−1 | |
| Diffusive oxygen crossover flux, mol × m−2 × s−1 | |
| Hydrogen crossover flux due to the differential pressure, mol × m−2 × s−1 | |
| Total hydrogen crossover flux, mol × m−2 × s−1 | |
| Total oxygen crossover flux, mol × m−2 × s−1 | |
| Diffusive gas permeability coefficients, mol × m−1 × s−1 × bar −1 | |
| Gas permeability coefficients due to the differential pressure, mol × m−1 × s−1 × bar −1 | |
| Thickness of membrane, mm | |
| Actual voltage, V | |
| Energy consumed, W | |
| Rate of exergy, W | |
| Total investment cost, USD × s−1 | |
| Capital cost, USD × s−1 | |
| Operating cost, USD × s−1 | |
| Greek symbols | |
| Voltage efficiency | |
| Specific exergy, J × kg−1 | |
| Second−law efficiency | |
| Faraday efficiency | |
| Abbreviations | |
| ABP | Anode bipolar plate |
| CBP | Cathode bipolar plate |
| CFD | Computational fluid dynamics |
| PEM | Membrane |
| PEMWE | Proton exchange membrane water electrolysis |
| WE | water electrolysis |
References
- Singh, S.; Jain, S.; PSV; Tiwari, A.; Nouni, M.; Pandey, J.; Goel, S. Hydrogen: A sustainable fuel for future of the transport sector. Renew. Sustain. Energy Rev. 2015, 51, 623–633. [Google Scholar] [CrossRef]
- Barbir, F. PEM electrolysis for production of hydrogen from renewable energy sources. Sol. Energy 2005, 78, 661–669. [Google Scholar] [CrossRef]
- Atlam, O.; Kolhe, M. Equivalent electrical model for a proton exchange membrane (PEM) electrolyser. Energy Convers. Manag. 2011, 52, 2952–2957. [Google Scholar] [CrossRef]
- Ferrero, D.; Santarelli, M. Investigation of a novel concept for hydrogen production by PEM water electrolysis integrated with multi-junction solar cells. Energy Convers. Manag. 2017, 148, 16–29. [Google Scholar] [CrossRef]
- Li, Y.; Yang, G.; Yu, S.; Kang, Z.; Mo, J.; Han, B.; Talley, D.; Zhang, Y. In-situ investigation and modeling of electrochemical reactions with simultaneous oxygen and hydrogen microbubble evolutions in water electrolysis. Int. J. Hydrogen Energy 2019, 44, 28283–28293. [Google Scholar] [CrossRef]
- Sapountzi, M.; Gracia, M.; Weststrate, C.J.; Fredriksson, O.A.; Niemantsverdriet, J.W. Electrocatalysts for the generation of hydrogen, oxygen and synthesis gas. Prog. Energy Combust. Sci. 2016, 58, 1–35. [Google Scholar] [CrossRef]
- Li, Y.; Kang, Z.; Mo, J.; Yang, G.; Yu, S.; Talley, D.A.; Han, B.; Zhang, F.Y. In-situ investigation of bubble dynamics and two-phase flow in proton exchange membrane electrolyzer cells. Int. J. Hydrogen Energy 2018, 43, 11223–11233. [Google Scholar] [CrossRef]
- Lagadec, M.F.; Grimaud, A. Water electrolysers with closed and open electrochemical systems. Nat. Mater. 2020, 19, 1140–1150. [Google Scholar] [CrossRef]
- Laguna-Bercero, M.A. Recent advances in high temperature electrolysis using solid oxide fuel cells: A review. J. Power Sources 2012, 203, 4–16. [Google Scholar] [CrossRef]
- Kumar, S.S.; Ramakrishna, S.U.B.; Krishna, S.V.; Srilatha, K.; Devi, B.R.; Himabindu, V. Synthesis of titanium (IV) oxide composite membrane for hydrogen production through alkaline water electrolysis. S. Afr. J. Chem. Eng. 2018, 25, 54–61. [Google Scholar] [CrossRef]
- Kadier, A.; Simayi, Y.; Abdeshahian, P.; Azman, N.F.; Chandrasekhar, K.; Kalil, M.S. A comprehensive review of microbial electrolysis cells (MEC) reactor designs and configurations for sustainable hydrogen gas production. Alex. Eng. J. 2016, 55, 427–443. [Google Scholar] [CrossRef]
- Ju, H.K.; Badwal, S.; Giddey, S. A comprehensive review of carbon and hydrocarbon assisted water electrolysis for hydrogen production. Appl. Energy 2018, 231, 502–533. [Google Scholar] [CrossRef]
- Nikolaidis, P.; Poullikkas, A. A comparative overview of hydrogen production processes. Renew. Sustain. Energy 2017, 67, 597–611. [Google Scholar] [CrossRef]
- Cheng, J.; Zhang, H.; Chen, G.; Zhang, Y. Study of IrxRu1-xO2 oxides as anodic electrocatalysts for solid polymer electrolyte water electrolysis. Electrochim. Acta 2009, 54, 6250–6256. [Google Scholar] [CrossRef]
- Kumar, S.S.; Ramakrishna, S.U.B.; Devi, B.R.; Himabindu, V. Phosphorus-doped graphene supported palladium (Pd/PG) electrocatalyst for the hydrogen evolution reaction in PEM water electrolysis. Int. J. Green Energy 2018, 15, 558–567. [Google Scholar] [CrossRef]
- Yunus, A.Ç. Thermodynamics: An Engineering Approach; McGraw-Hill Education: New York, NY, USA, 2014; Chapter 8. [Google Scholar]
- Rosen, M.A. Energy and exergy analyses of electrolytic hydrogen production. Int. J. Hydrogen Energy 1995, 20, 547–553. [Google Scholar] [CrossRef]
- Ni, M.; Leung, H.; Leung, C. Energy and exergy analysis of hydrogen production by a proton exchange membrane (PEM) electrolyzer plant. Energy Convers. Manag. 2008, 49, 2748–2756. [Google Scholar] [CrossRef]
- Nafchi, F.M.; Afshari, E.; Baniasadi, E.; Javani, N. A parametric study of polymer membrane electrolyser performance, energy and exergy analyses. Int. J. Hydrogen Energy 2019, 44, 18662–18670. [Google Scholar] [CrossRef]
- Javadi, M.; Najafi, N.; Abhari, M.; Jabery, R.; Pourtaba, H. 4E analysis of three different configurations of a combined cycle power plant integrated with a solar power tower system. Sustain. Energy Technol. Assess. 2021, 48, 101599. [Google Scholar] [CrossRef]
- Javadi, M.; Khodabakhshi, S.; Ghasemiasl, R.; Jabery, R. Sensivity analysis of a multi-generation system based on a gas/hydrogen-fueled gas turbine for producing hydrogen, electricity and freshwater. Energy Convers. Manag. 2022, 252, 115085. [Google Scholar] [CrossRef]
- Ozden, E.; Tari, I. Energy-exergy and economic analyses of a hybrid solar-hydrogen renewable energy system in Ankara, Turkey. Appl. Therm. Eng. 2016, 99, 169–178. [Google Scholar] [CrossRef]
- Kazim, A.M. Exergoeconomic analysis of a PEM electrolyser at various operating temperatures and pressures. Int. J. Energy Res. 2005, 29, 539–548. [Google Scholar] [CrossRef]
- Toghyani, S.; Baniasadi, E.; Afshari, E. Numerical simulation and exergoeconomic analysis of a high temperature polymer exchange membrane electrolyzer. Int. J. Hydrogen Energy 2019, 44, 31731–31744. [Google Scholar] [CrossRef]
- Lee, B.; Heo, J.; Kim, S.; Sung, C.; Moon, C.; Moon, S.; Lim, H. Economic feasibility studies of high pressure PEM water electrolysis for distributed H2 refueling stations. Energy Convers. Manag. 2018, 162, 139–144. [Google Scholar] [CrossRef]
- Grigoriev, S.A.; Millet, P.; Korobtsev, S.V.; Porembskiy, V.I.; Pepic, M.; Etievant, C.; Puyenchet, C.; Fateev, V.N. Hydrogen safety aspects related to high-pressure polymer electrolyte membrane water electrolysis. Int. J. Hydrogen Energy 2009, 34, 5986–5991. [Google Scholar] [CrossRef]
- Schalenbach, M.; Carmo, M.; Fritz, D.L.; Mergel, J.; Stolten, D. Pressurized PEM water electrolysis: Efficiency and gas crossover. Int. J. Hydrogen Energy 2013, 38, 14921–14933. [Google Scholar] [CrossRef]
- Grigoriev, S.A.; Porembskiy, V.I.; Korobtsev, S.V.; Fateev, V.N.; Auprêtre, F.; Millet, P. High-pressure PEM water electrolysis and corresponding safety issues. Int. J. Hydrogen Energy 2011, 36, 2721–2728. [Google Scholar] [CrossRef]
- Truc, N.T.; Ito, S.; Fushinobu, K. Numerical and experimental investigation on the reactant gas crossover in a PEM fuel cell. Int. J. Heat Mass Transf. 2018, 127, 447–456. [Google Scholar] [CrossRef]
- Omrani, R.; Shabani, B. Hydrogen crossover in proton exchange membrane electrolysers: The effect of current density, pressure, temperature, and compression. Electrochim. Acta 2021, 377, 138085. [Google Scholar] [CrossRef]
- Afshari, E.; Khodabakhsh, S.; Jahantigh, N.; Toghyani, S. Performance assessment of gas crossover phenomenon and water transport mechanism in high pressure PEM electrolyzer. Int. J. Hydrogen Energy 2021, 46, 11029–11040. [Google Scholar] [CrossRef]
- Hassan, A.H.; Wang, X.; Liao, Z.; Xu, C. Numerical Investigation on the Effects of Design Parameters and Operating Conditions on the Electrochemical Performance of PEM Water Electrolysis. J. Therm. Sci. 2022, accepted. [Google Scholar]
- Toghyani, S.; Afshari, E.; Baniasadi, E.; Atyabi, S.A.; Naterer, G.F. Thermal and electrochemical performance assessment of a high temperature PEM electrolyzer. Energy 2018, 152, 237–246. [Google Scholar] [CrossRef]
- Olesen, A.C.; Rømer, C.; Kær, S.K. A numerical study of the gas-liquid, two-phase flow maldistribution in the anode of a high pressure PEM water electrolysis cell. Int. J. Hydrogen Energy 2016, 41, 52–68. [Google Scholar] [CrossRef]
- Rahim, A.H.A.; Tijani, A.S. Modeling and Analysis the Effects of Temperature and Pressure on the Gas-Crossover in Polymer Electrolyte Membrane Electrolyzer. Int. J. Energy Power Eng. 2016, 10, 1–7. [Google Scholar] [CrossRef]
- Zhang, H.; Su, S.; Lin, G.; Chen, J. Efficiency calculation and configuration design of a PEM electrolyzer system for hydrogen production. Int. J. Electrochem. Sci. 2012, 7, 4143–4157. [Google Scholar]
- Toghyani, S.; Afshari, E.; Baniasadi, E.; Atyabi, S.A. Thermal and electrochemical analysis of different flow field patterns in a PEM electrolyzer. Electrochim. Acta 2018, 267, 234–245. [Google Scholar] [CrossRef]
- Moulthrop, L.; Anderson, E.; Chow, O.; Friedland, R.; Maloney, T.; Schiller, M. Commercial Optimization of a 100 kg/day PEM Based Hydrogen Generator for Energy and Industrial Applications. In Proceedings of the 16th World Hydrogen Energy Conference (WHEC 16), Lyon, France, 13–16 June 2006. [Google Scholar]
- Wang, Z.M.; Xu, C.; Wang, X.Y.; Liao, Z.R.; Du, X.Z. Numerical investigation of water and temperature distributions in a proton exchange membrane electrolysis cell. Sci. China Technol. Sci. 2021, 64, 1555–1566. [Google Scholar] [CrossRef]
- Kaya, M.F.; Demir, N. Numerical Investigation of PEM Water Electrolysis Performance for Different Oxygen Evolution Electrocatalysts. Fuel Cells 2017, 17, 37–47. [Google Scholar] [CrossRef]
- Zinser, A.; Papakonstantinou, G.; Sundmacher, K. Analysis of mass transport processes in the anodic porous transport layer in PEM water electrolysers. Int. J. Hydrogen Energy 2019, 44, 28077–28087. [Google Scholar] [CrossRef]
- Han, B.; Mo, J.; Kang, Z.; Zhang, F.Y. Effects of membrane electrode assembly properties on two-phase transport and performance in proton exchange membrane electrolyzer cells. Electrochim. Acta 2016, 188, 317–326. [Google Scholar] [CrossRef]
- Ito, H.; Maeda, T.; Nakano, A.; Kato, A.; Yoshida, T. Influence of pore structural properties of current collectors on the performance of proton exchange membrane electrolyzer. Electrochim. Acta 2013, 100, 242–248. [Google Scholar] [CrossRef]
- Ruiz, D.; Sasmito, A.P.; Shamim, T. Numerical Investigation of the High Temperature PEM Electrolyzer: Effect of Flow Channel Configurations. ECS Trans. 2013, 58, 99–112. [Google Scholar] [CrossRef]
- Nguyen, T.; Fushinobu, K. Effect of operating conditions and geometric structure on the gas crossover in PEM fuel cell. Sustain. Energy Technol. Assess. 2020, 37, 100584. [Google Scholar] [CrossRef]
- Tsai, S.W.; Chen, Y.S. A mathematical model to study the energy efficiency of a proton exchange membrane fuel cell with a dead-ended anode. Appl. Energy 2017, 188, 151–159. [Google Scholar] [CrossRef]
- Baniasadi, E.; Toghyani, S.; Afshari, E. Exergetic and exergoeconomic evaluation of a trigeneration system based on natural gas-PEM fuel cell. Int. J. Hydrogen Energy 2017, 42, 5327–5339. [Google Scholar] [CrossRef]
- Szargut, J. Exergy Method: Technical and Ecological Applications; WIT Press: Southampton, UK, 2005. [Google Scholar]
- Fragiacomo, P.; Genovese, M. Modeling and energy demand analysis of a scalable green hydrogen production system. Int. J. Hydrogen Energy 2019, 44, 30237–30255. [Google Scholar] [CrossRef]
- Kocha, S.S.; Yang, J.D.; Yi, J.S. Characterization of Gas Crossover and Its Implications in PEM Fuel Cells. AICHE J. 2015, 61, 857–866. [Google Scholar] [CrossRef]
- Gurau, V.; Liu, H.; Kakaç, S. Two-dimensional model for proton exchange membrane fuel cells. AIChE J. 1998, 44, 2410–2422. [Google Scholar] [CrossRef]
- Harrison, K.W.; Martin, G.D.; Ramsden, T.G.; Kramer, W.E.; Novachek, F.J. The Wind-to-Hydrogen Project: Operational Experience, Performance Testing, and Systems Integration; National Renewable Energy Lab (NREL): Golden, CO, USA, 2011. [Google Scholar]
- Bejan, A.; Tsatsaronis, G.; Moran, M. Thermal Design and Optimization; John Wiley & Sons Canada Ltd.: Toronto, ON, Canada, 1996. [Google Scholar]
- Rosen, M.A.; Dincer, I. Exergoeconomic analysis of power plants operating on various fuels. Appl. Therm. Eng. 2003, 23, 643–658. [Google Scholar] [CrossRef]
- Ameri, M.; Ahmadi, P.; Hamidi, A. Energy, exergy and exergoeconomic analysis of a steam power plant: A case study. Int. J. Energy Res. 2002, 33, 499–512. [Google Scholar] [CrossRef]
- Millet, P. Water electrolysis using eme technology: Electric potential distribution inside a nafion membrane during electrolysis. Electrochim. Acta 1994, 39, 2501–2506. [Google Scholar] [CrossRef]
- Chiou, J.S.; Paul, D.R. Gas Permeation in a Dry Nafion Membrane. Ind. Eng. Chem. Res. 1988, 27, 2161–2164. [Google Scholar] [CrossRef]
- Lee, H.; Lee, B.; Byun, M.; Lim, H. Economic and environmental analysis for PEM water electrolysis based on replacement moment and renewable electricity resources. Energy Convers. Manag. 2020, 224, 113477. [Google Scholar] [CrossRef]
Publisher’s Note: MDPI stays neutral with regard to jurisdictional claims in published maps and institutional affiliations. |
© 2022 by the authors. Licensee MDPI, Basel, Switzerland. This article is an open access article distributed under the terms and conditions of the Creative Commons Attribution (CC BY) license (https://creativecommons.org/licenses/by/4.0/).