Article

Characteristics of Liquid-Hydrocarbon Yield and Biomarkers in Various Thermal-Evolution Stages: A Simulation Experiment with the Middle Jurassic Source Rocks in the Northern Margin of the Qaidam Basin

1
Key Laboratory of Petroleum Resources, Northwest Institute of Eco-Environment and Resources, Chinese Academy of Sciences, Lanzhou 730000, China
2
Xi’an Key Laboratory of Tight Oil (Shale Oil) Development, Xi’an Shiyou University, Xi’an 710065, China
3
Technological Service Company, Xinjiang Oilfield Company, PetroChina, Karamay 834000, China
4
Engineering Technology Research Institute, Xinjiang Oilfield Company, PetroChina, Karamay 834000, China
*
Author to whom correspondence should be addressed.
Energies 2022, 15(20), 7793; https://doi.org/10.3390/en15207793
Submission received: 9 September 2022 / Revised: 13 October 2022 / Accepted: 19 October 2022 / Published: 21 October 2022
(This article belongs to the Special Issue Sedimentary Organic Matter in Shale Oil/Gas Systems)

Abstract

:
Although there are many studies on the Jurassic source rocks in the northern margin of the Qaidam Basin, the characteristics of biomarkers and products with the same source rock in different evolutionary stages are still not well understood. Such an understanding is essential for accurately estimating oil and gas resources. In order to explore the hydrocarbon-generation potential of high-quality source rocks of the Middle Jurassic and the evolution of liquid hydrocarbons and biomarkers, we carried out simulation research (under hydrous conditions) at various temperatures (250, 300, 350, 400 and 450 °C) with the mudstone of the Yu 33 well in the Yuka Sag. The results revealed that the “oil window” of the Middle Jurassic source rocks in the Yuka area was 300 °C (simulation temperature, Ro = 0.84%), but this was not the peak of hydrocarbon expulsion, which was gradually reached and stabilized above 350 °C. Overall, the concentration of alkanes and aromatics increased with temperature; although the concentration of alkanes was complex in the low evolutionary stages, temperature (simulated maturity) was still the main factor controlling the change in alkanes and aromatics. Among the maturity parameters of biomarkers, the ratio of ∑tricyclic terpanes/∑hopanes was the most effective parameter for indicating the maturity evolution of the Yuka area, but others were complicated by the increasing temperature. Therefore, when evaluating maturity, the applicability of other parameters needed to be fully considered. The results obtained offer new insights in the research on liquid-hydrocarbon and biomarker evolution of the Middle Jurassic source rocks in the Yuka Sag of the Qaidam Basin.

1. Introduction

Most commercial hydrocarbons are generated by the thermal transformation of kerogen during the burial of source rocks [1,2]. Since the temperature can compensate for the geological effect of time on the hydrocarbon generation of organic source rocks [3,4], the simulation experiment has become an important part of organic geochemistry research. During the past decades, hydrocarbon-generation thermal-simulation experiments have become common methods to solve fundamental issues, such as the evaluation of residual oil in rich source rocks and their hydrocarbon-expulsion efficiency [2,5,6,7,8,9,10,11,12,13,14,15]. Currently, source-rock thermal-simulation experiment is the primary means and basis for hydrocarbon evolution and resource evaluation [8,16]. According to the degree of closure of the system, hydrocarbon-generation-simulation experiments are generally divided into three types, including open system, closed system and semiclosed system [6,17,18,19]. Among these, the closed system has become one of the principal methods for quantitative evaluation of source rocks, since it can simulate hydrocarbon generation in different evolutionary stages, as well as the maximum amount of gas in the source rock [2,6,11]. Since Lewan et al. [2] first applied the hydrous-thermal-simulation experiment, this method has begun to consider the control effect of the water medium and minerals on oil and gas generation in the actual geological process. At present, it is generally believed that the thermal evolution obtained with the hot-pressure-simulation experiment under the water-medium condition is closer to the natural evolution [12,14,19,20].
Biomarkers [21,22] are molecular fossils with complex organic compounds composed of carbon, hydrogen and other elements. These compounds originate from formerly living organisms. They occur in modern and ancient sediments, crude oil and natural gas, and show little or no change in structure from their parent organic molecules in living organisms [23]. In addition, they are stable in the process of organic-matter (OM) evolution, not only retaining all or most of the original carbon skeleton of their natural product, but also recording the special molecular-structure information of the original organisms [24,25]. Therefore, biomarkers can provide rich geochemical information for oil and gas research [22]. Since the advancement of gas chromatography–mass spectrometry (GC–MS) and biomarker methods, they have become widely used in the study of source-rock thermal-simulation experiments [12,14,20,23,26,27,28,29,30,31]. It is generally known that biomarker compositions are not only controlled by OM types, but also related to thermal maturity and source-rock lithology. In different thermal-evolutionary stages, the same source rock releases different concentrations of biomarkers. Consequently, the oil–source correlation and sedimentary environment can be discussed through the combination of characteristics of biomarkers [23].
The Jurassic source rocks in the northern margin of the Qaidam Basin are the main hydrocarbon-generating strata of the basin, involving numerous oil and gas reservoirs [32,33,34,35,36]. In the past, most studies on the source rocks of the northern margin of the Qaidam Basin mainly focused on the OM type, maturity, sedimentary organic facies, original environment, sedimentary reservoir and rock characteristics [33,37,38,39,40,41,42]. Nevertheless, there are few studies on the characteristics of biomarkers and products with the same source rock in different evolutionary stages, which hinders the study of the oil- and gas-generated mechanisms and the oil-and-gas–source correlation. In this research, a hydrous pyrolysis experiment was carried out using the high-quality source rocks of the Middle Jurassic in the northern margin of the Qaidam Basin. Meanwhile, liquid products and residual extracts from the experiment were analyzed with GC–MS to explore the characteristics of liquid-hydrocarbon production and the evolution of the biomarkers in diverse stages of thermal evolution.

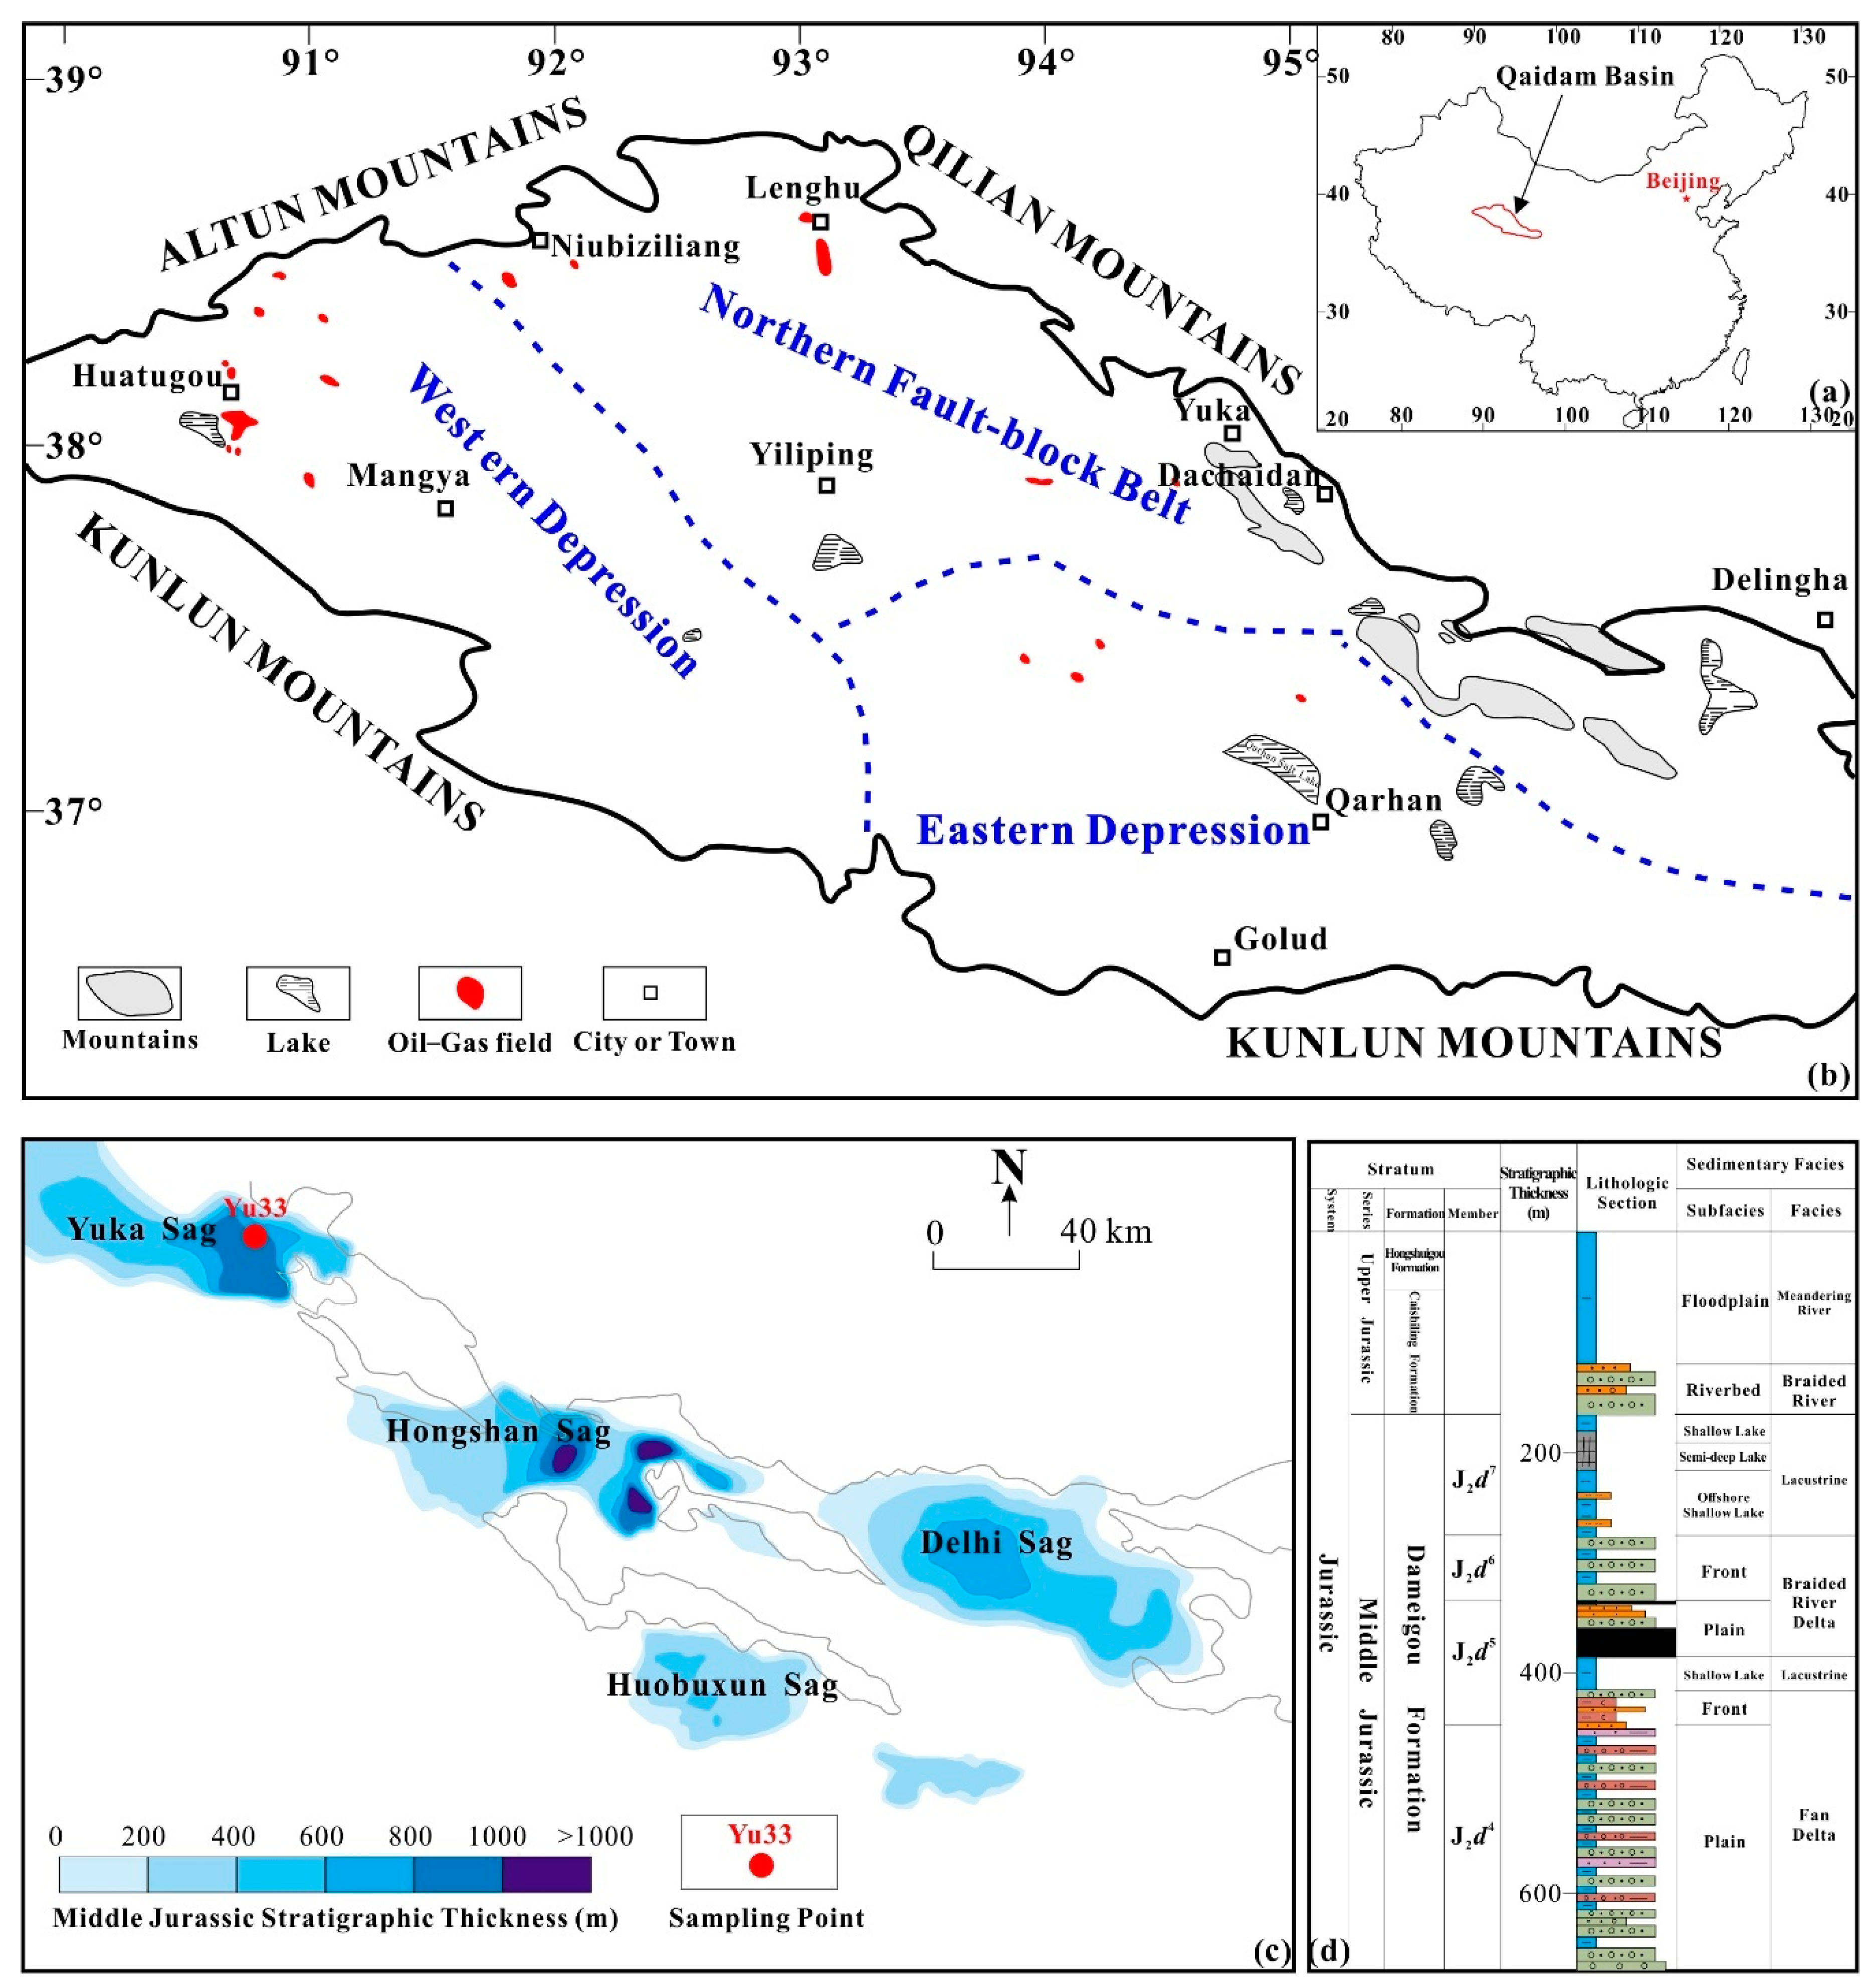
2. Geological Settings

The Qaidam Basin, located in the northeast of the Qinghai–Tibet Plateau (35°00′–39°20′ N; 90°16′–99°16′ E; Figure 1a), is a typical inland closed arid basin and is the highest among the four major basins in China (its altitude is approximately 2600–3500 m) [43]. With a slightly irregular rhombus shape, the Qaidam Basin is surrounded by the Kunlun Mountains, Altun Mountains and Qilian Mountains (Figure 1b), and covers an area of approximately 12.1 × 10⁴ km2 [44]. Based on the basement characteristics, stratigraphic distribution, style of structural deformation, basin-evolution features and distribution of petroleum systems, the basin can be structurally divided into three tectonic units, namely, the northern fault-block belt, the western depression and the eastern depression [36] (Figure 1b). The Jurassic petroleum system in the northern margin of the Qaidam Basin is one of the three major petroleum systems of the Qaidam Basin [36,45,46]. It is the secondary structural unit of the northern fault-block belt, and mainly includes the west of the Qilian uplift, east of the Altun uplift, Maxian uplift, Lenghu structural belt, Eboliang structural belt, Pingdong Sag, Kunteyi Sag, Yibei Sag, Saishenteng Sag, Yuka Sag, Hongshan Sag and other tertiary structural units. The Yuka Sag is located in the middle of the northern margin of the Qaidam Basin, which is distributed in the northwest direction. It is approximately 50 km long from east to west and 30 km wide from north to south and, on average, covers an area of approximately 1500 km2 (Figure 1b,c).
The sedimentary strata developed in the Qaidam Basin include the Jurassic and Cretaceous of the Mesozoic and the Paleogene, Neogene and Quaternary of the Cenozoic from bottom to top [47]. The stratigraphic distribution is strictly controlled by its tectonic evolution and has obvious zoning. The Mesozoic is mainly distributed in the northern margin of the Qaidam Basin, the Paleogene and Neogene are mainly distributed in the west and the Quaternary is mainly distributed in the east. According to the characteristics of surface outcrops, drilling, paleontological data and seismic reflection, the strata of the Huxishan formation, Xiaomeigou formation, Dameigou formation, Caishiling formation, Hongshuigou formation and Shiyagou formation are developed in the Mesozoic of the northern margin of the Qaidam Basin [41]. The Huxishan formation (J1h), Xiaomeigou formation (J1x) and the first to third members of the Dameigou formation (J1d1–3) belong to the Lower Jurassic, the fourth to seventh members of the Dameigou formation (J2d4–7) belong to the Middle Jurassic, the Caishiling formation (J3c) and Hongshuigou formation (J3h) belong to the Upper Jurassic and the Quanyagou formation belongs to the Cretaceous (Figure 1d).
The Middle Jurassic Dameigou formation (J2d), Upper Jurassic Caishiling formation (J3c), Hongshuigou formation (J3h), Cretaceous Shiyagou formation (K) and Paleogene Lulehe formation (E1+2) are developed in the Yuka Sag (Figure 1d). During the sedimentary period of the Middle Jurassic Dameigou formation, the main part of the Yuka Sag was a shore–shallow-lake sedimentary environment (Figure 1c,d). The lithology is dominated by black-gray carbonaceous shale and dark gray mudstone, mixed with gray medium sandstone and siltstone, and oil shale, which is the main layer of shale oil and gas distribution in the Yuka Sag, is seen locally. The burial depth of shale in the seventh member of the Dameigou formation of the Middle Jurassic (J2d7) is less than 2000 m on the whole, and the average thickness is 55 m.

3. Samples and Methods

3.1. Samples

The samples were gray-black mudstones collected from the core of the Yu 33 well located in the Yuka area of the northern margin of the Qaidam Basin. They were at depths of 1470–1475 m and belonged to the 7th member of the Dameigou formation of the Middle Jurassic (J2d7). Previous studies have suggested that J2d7 is the major high-quality source rock for the Yuka Sag, the major hydrocarbon-generation layer in the northern margin of the Qaidam Basin [33,37]. The basic geochemical data of samples are shown in Table 1, which shows that the samples belonged to low-evolution and high-quality source rocks. The samples had a high abundance of OM (TOC = 6.45%), their hydrogen index (HI) reached 582 mg/g, and their hydrocarbon-generation capacity (PG = 37.91 mg/g) was equivalent to the I type of OM. The pyrolysis peak temperature (Tmax) and the vitrinite reflectance (Ro) indicated that the samples were in a low evolutionary stage (immature stage).

3.2. TOC, Rock-Eval and Vitrinite-Reflectance (Ro) Analyses

The total organic carbon (TOC) content was analyzed with a carbon–sulfur analyzer (CS-230, LECO, St. Joseph, MI, USA) and tested according to the Chinese national standard GB/T 19145-2003. The YQ VI manufactured by the Haicheng Petrochemical Instrument Factory in Haicheng, China was employed in this work for Rock-Eval parameters, whose operation methods were strictly based on the Chinese national standard GB/T 18602-2012. The vitrinite reflectance (Ro) was randomly measured under a microscope with an oil-immersion objective lens using similar equipment to Wu et al. [48]. The refraction index of the immersion oil was 1.518 at 23 °C. The incident light of a Zeiss Axion Imager microscope equipped with a tungsten–halogen lamp (12 V, 100 W) and an MPV photometer was adjusted to a magnification of 500× in a dark room. The analyses of TOC, pyrolysis and Ro of the initial sample were conducted in the Research Institute of Exploration and Development, Qinghai Oilfield Company, PetroChina, China.

3.3. Thermal-Simulation Experiments and Product Collection and Separation

In September 2017, the thermal-simulation experiments were carried out under hydrous conditions in a closed system. The samples were first ground into meshes larger than 80, and then 20–50 g of the samples were loaded into an autoclave at different temperatures. After loading the samples, air was removed from the autoclave with a vacuum pump before it was sealed. The autoclave was then successively heated isothermally at each desired temperature (250, 300, 350, 400 and 450 °C) for 72 h. The temperature of the autoclave was controlled with a thermocouple, calibrated to an accuracy of ±1 °C.
At the end of the experiment, the gas and liquid hydrocarbons (expelled oil) were collected and quantified, after which the residues of the experiment were dried at 50 °C. The residual samples were extracted using Soxhlet extraction with chloroform to obtain the extractable organic matter (EOM, i.e., the residual oil) and the residual oil was quantified. After the asphaltene was precipitated in n-hexane, the soluble fraction was further separated into saturated hydrocarbons, aromatic hydrocarbons and resin with SiO2/Al2O3 column chromatography using sequential elution with hexane, dichloromethane (DCM) and methanol (MeOH). Eventually, the separated saturated hydrocarbons and aromatic hydrocarbons were each subjected to analyses using GC and GC–MS.

3.4. Conditions of GC and GC–MS

A gas chromatography (GC) tool for this study was made by the Agilent company (Santa Clara, CA, USA) and hydrocarbons were detected with a flame ionization detector (FID, Kyoto, Japan). The carrier gas was helium (He), and hydrogen gas with compressed air was used for the FID flame. Initial and final temperatures were 80 and 290 °C, respectively, and a temperature program of 4 °C per minute was applied. The GC–MS tool of this analysis was composed of one GC tool (Hewlett-Packard 6890N gas chromatograph, Hewlett-Packard, Palo Alto, CA, USA) and one MS tool (Hewlett-Packard 5973N mass spectrometer) with a mass selective detector (MSD). The column was a J&W HP-5 model (Agilent, Santa Clara, CA, USA), 30 m in length and 0.32 mm in diameter, with a film thickness of 0.25 µm. The oven temperature started at 80 °C (held for 1 min) and was then increased to 290 °C at 4 °C/min (held for 30 min). The ion source was at 230 °C and was operated in the electron-ionization (EI) mode at 70 eV. The types of mass selective detection were full scan (SCAN) and selected ion monitoring (SIM), and the spectra library of American NIST05.L (NIST, Gaithersburg, MD, USA) was used.
The compounds were identified using published mass spectra and retention times based on NIST 08 software (NIST, Gaithersburg, MD, USA). The relative abundances of compounds were determined from the peak areas in the relevant mass chromatograms. The quantifications were achieved by comparing peak areas of the target compounds with that of internal standards. Known concentrations of 1-C18 olefin and D4-C27 cholestane were used to quantify the saturated fractions, and deuterated dibenzothiophene (D8-DBT) was used to measure the aromatic fractions [49].
The thermal-simulation experiments, the quantification of experiments’ products and the biomarker analysis were completed in the Key Laboratory of Petroleum Resources, Gansu Province.

4. Results and Discussion

4.1. Formation and Quantitative Analysis of Liquid Hydrocarbons

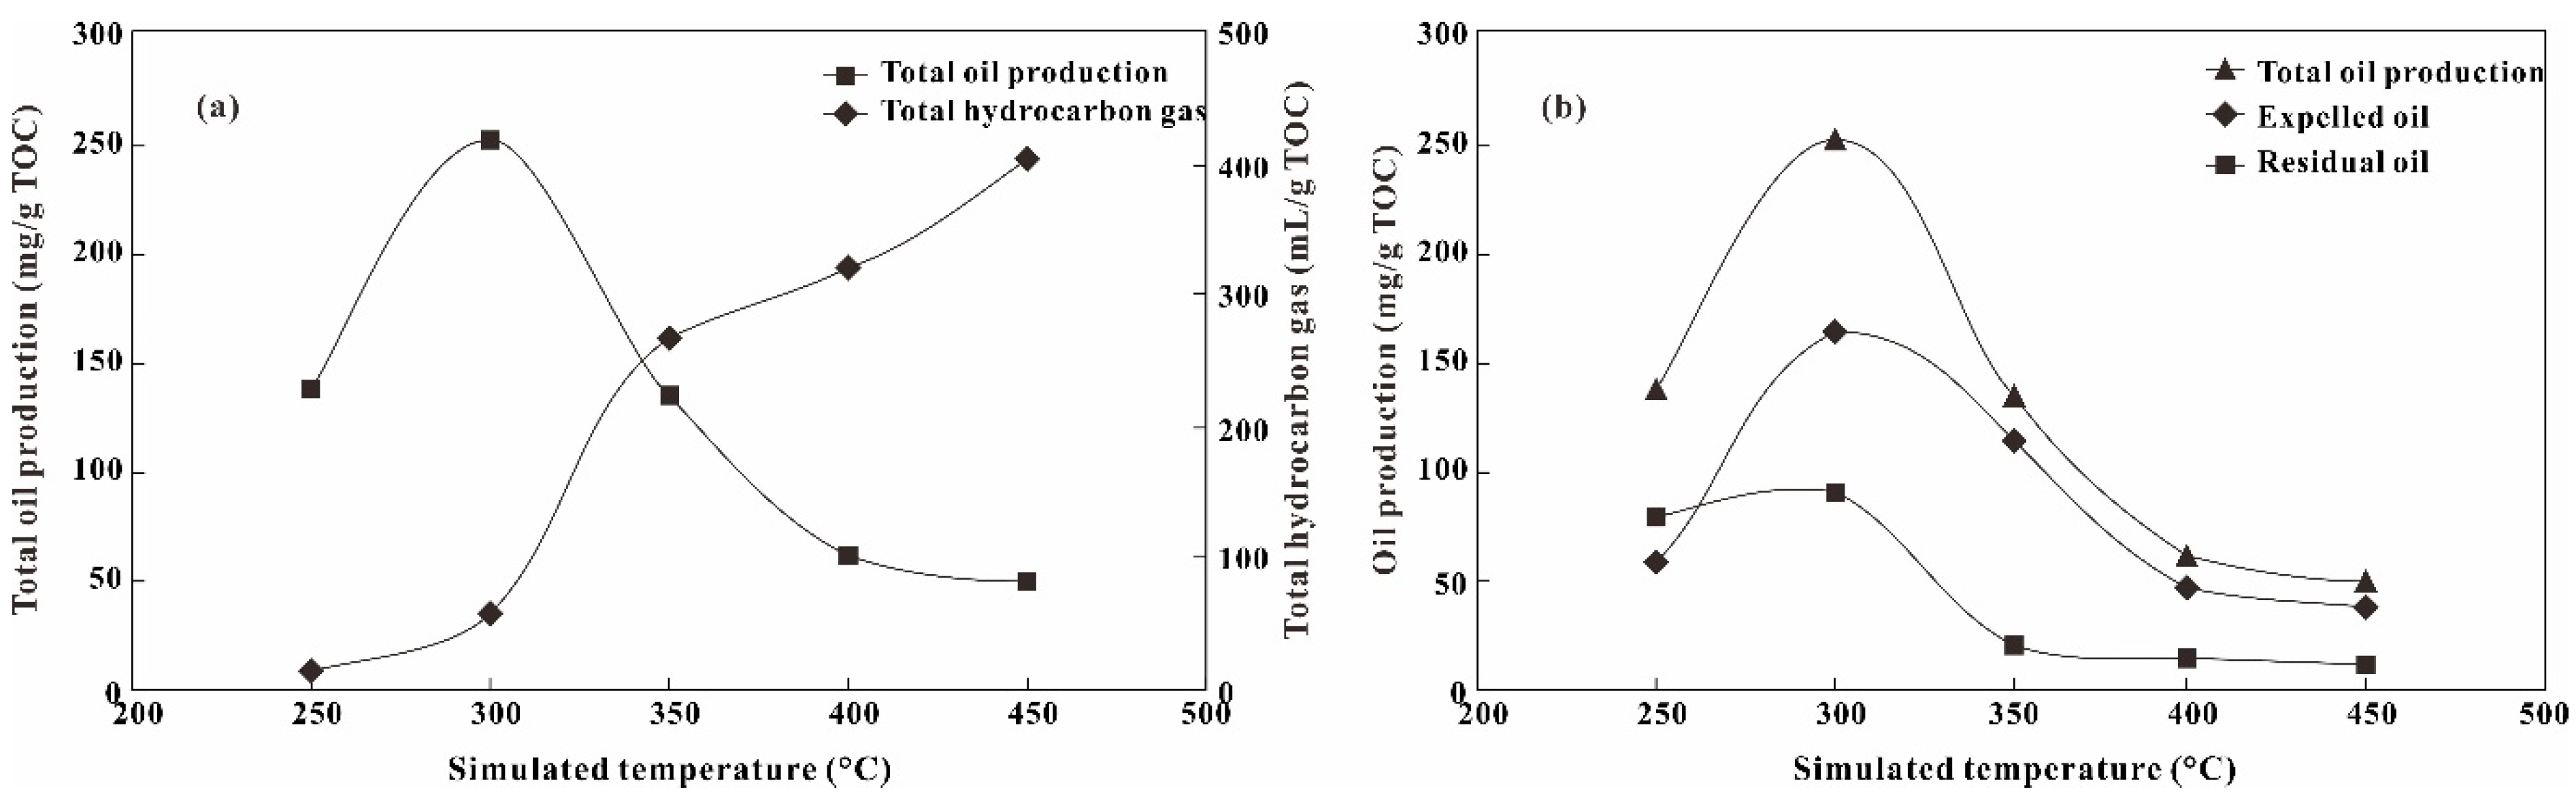
4.1.1. Yield and Composition of Liquid Hydrocarbons

In the thermal-evolution process, OM in the source rocks could not only produce gaseous hydrocarbons, but also liquid hydrocarbons. The level of liquid hydrocarbons was a direct indicator of the potential of the source rocks [50]. The liquid hydrocarbons obtained in the simulation experiment mainly consisted of two parts. One was the expelled oil, including the condensate discharged with the gas and the light oil attached to the inner wall of the autoclave. The other was the residual oil, which was part of the liquid hydrocarbons remaining in the source rock. The total amount of these two liquid hydrocarbons was the total oil production of the source rock.
The total oil production varied significantly with different temperatures in the thermal-simulation experiments (Figure 2). The maximum total oil production peaked at 300 °C, indicating that the oil-generation reaction of kerogen mainly occurred below 300 °C, and that 300 °C (Ro = 0.84%) was the main “oil window”. Above 300 °C, the total amount of oil decreased and the total amount of hydrocarbon gas increased and peaked at 450 °C (402.70 mL/g TOC). This suggested that the main oil-generating process of the source rocks of the Middle Jurassic in the Yuka area occurred in a lower evolutionary stage, whose Ro was in the range of 0.75–0.90% [38]. It is worth noting that the source rock reached the peak of oil generation at 300 °C, and the total oil production began to decrease along with the increasing temperature. Meanwhile, the increasing production of gaseous hydrocarbons was related to the decrease in liquid-hydrocarbon production. This was possibly due to the obvious breaking of carbon–carbon bonds and the cracking of liquid hydrocarbons generated during the high evolutionary stage, at which point the macromolecular liquid hydrocarbons (asphaltenes) were converted into heavy hydrocarbon gases [51].
Compared to the relationship between total oil production, residual oil and expelled oil during all experiments, we found that a considerable part of the oil was left in the rock sample before the peak of the oil generation (Figure 2). The amount of residual oil was higher at 250 °C and 300 °C, which accounted for 57.7% and 35.6% of the total oil production, respectively. Above 300 °C, the residual oil obviously reduced and was equivalent to the total oil production of 15.6–24.8%. Therefore, our results suggested that the Middle Jurassic source rocks in the Yuka area of the northern margin of the Qaidam Basin had very low hydrocarbon-expelling efficiency in the low evolutionary stage, while a large number of hydrocarbons were expelled in the high maturity stage.

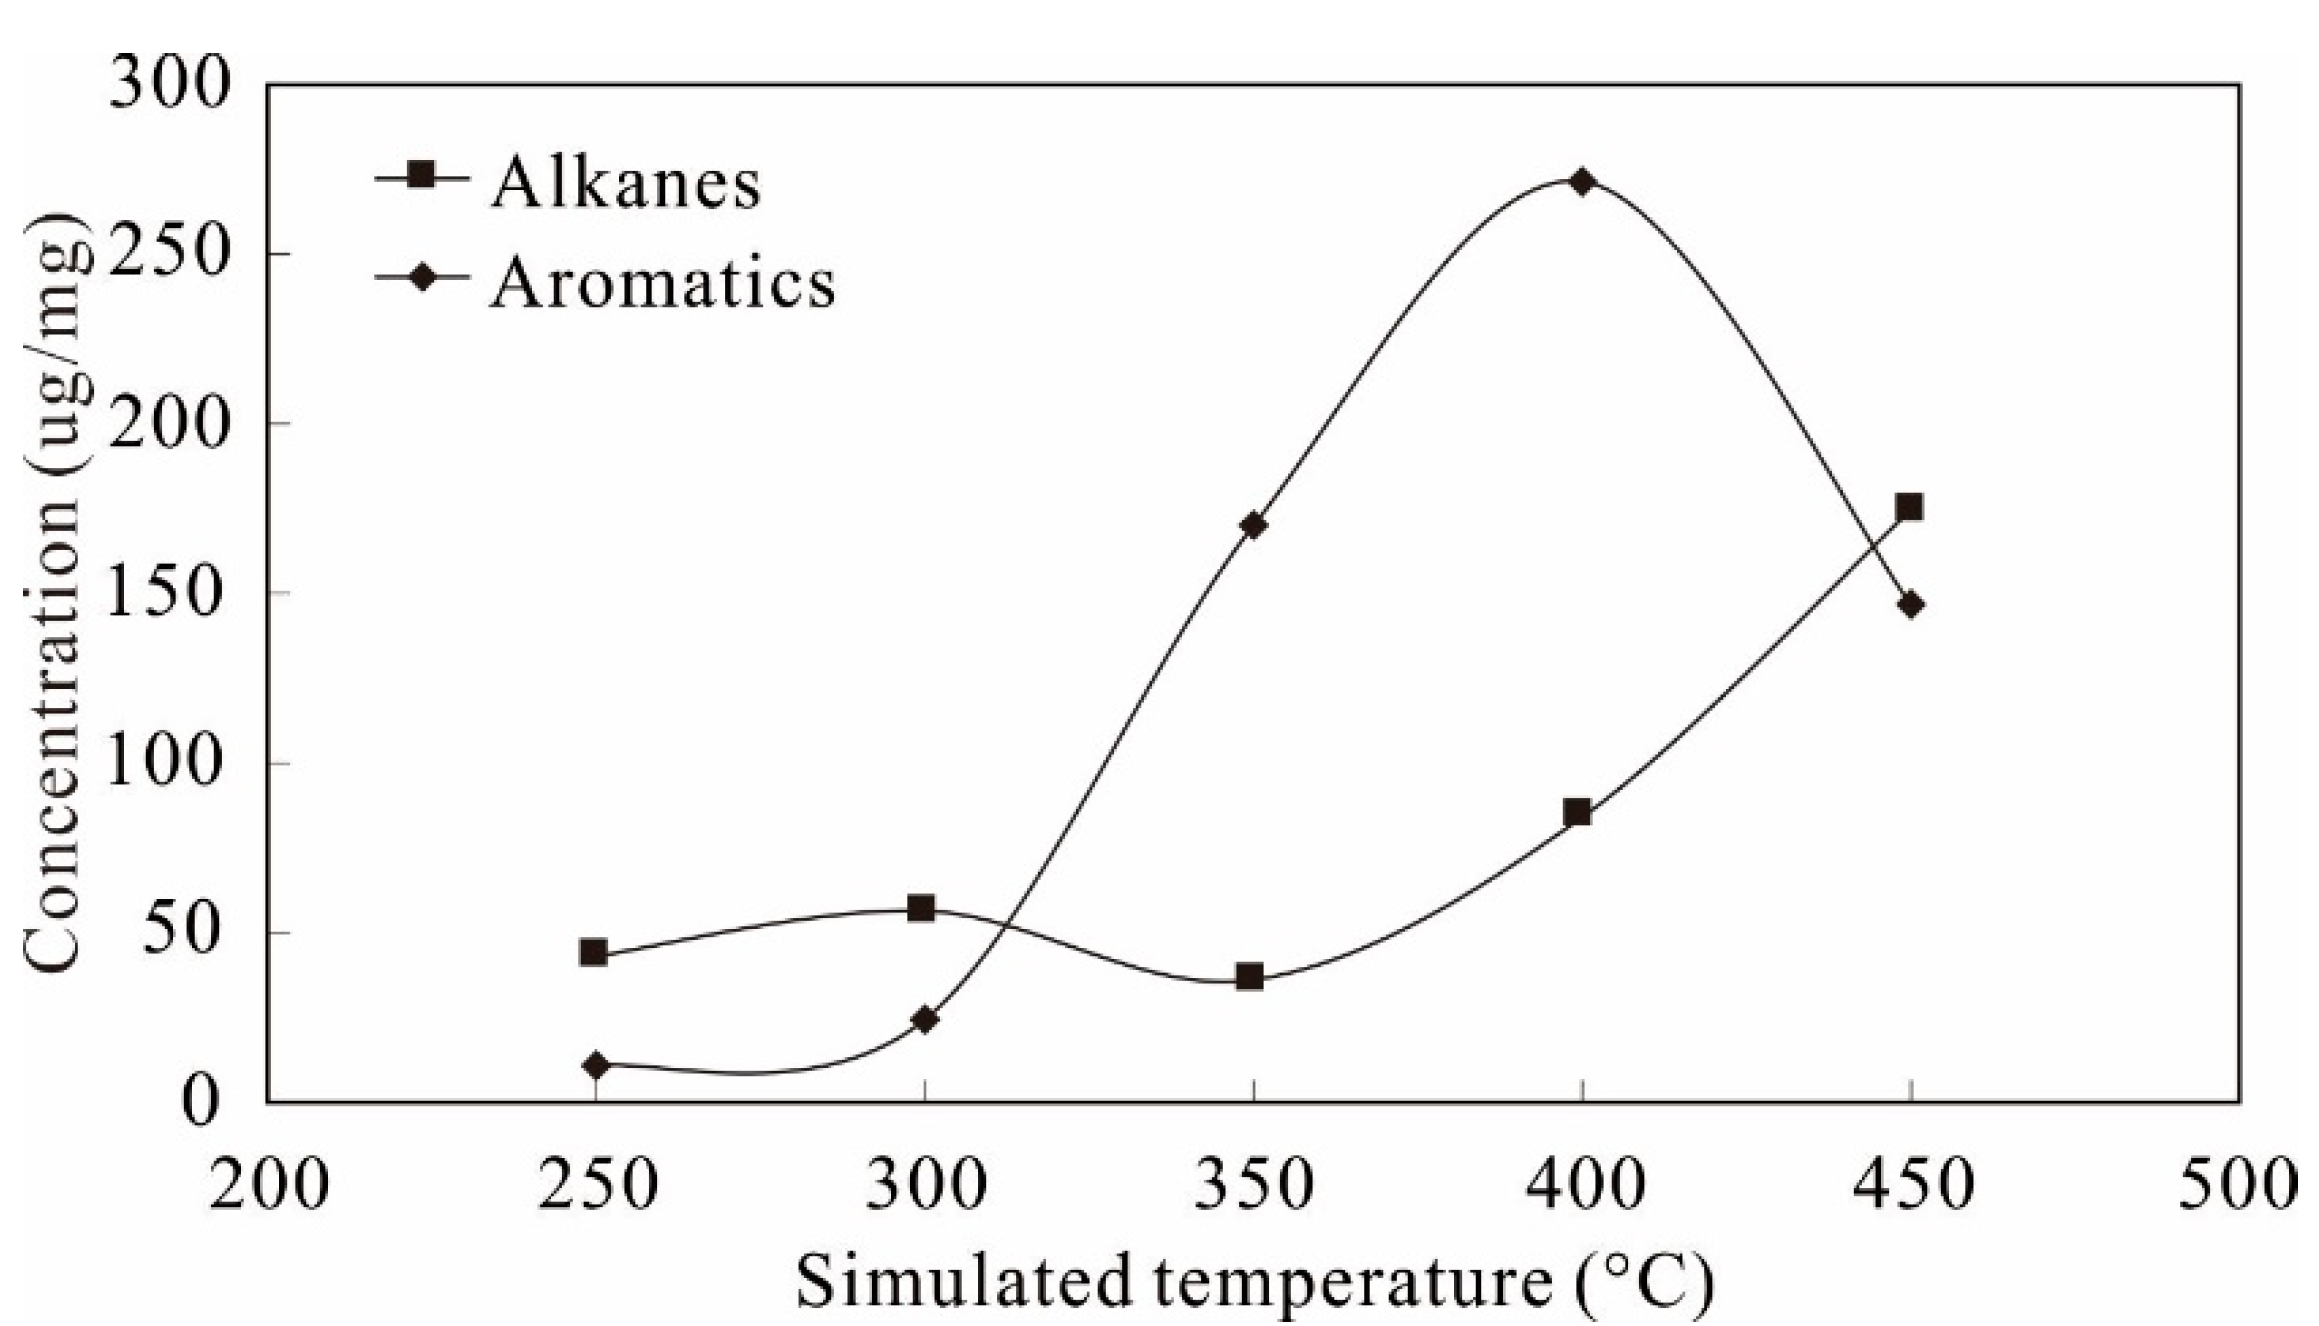
4.1.2. Quantitative Analysis of Saturated and Aromatic Hydrocarbons

During the simulation experiment, the concentration of the alkane series did not show a flat increasing trend with the elevated temperature (Figure 3). It fluctuated in the low evolutionary stage (250–350 °C), while it enhanced rapidly and was positively correlated with the increasing temperature above 350 °C. The variation in the aromatics’ concentrations in the simulated experimental products showed a two-stage characteristic: a regular increase followed by a decrease. The concentration of aromatic hydrocarbons was significantly lower in the range of 250–300 °C and the aromatic series was lower than the alkane series, which indicated that the better the OM type, the lower the aromatic content (Table 1; Figure 3) during the “oil window” (300 °C, Ro = 0.84%). When the simulation temperature was less than 400 °C, the concentration of aromatics showed an increasing tendency with the elevated temperature, and reached its maximum value (271.50 ug/mg) at 400 °C. However, the aromatic concentration decreased rapidly above 400 °C (Figure 3).
Some of the special aromatic hydrocarbons, such as the dibenzofuran series (DBFs), fluorene series (Fs), biphenyl series (Bis), anthracene, benzanthracene, fluoranthene and pyrene, had similar tendencies (Table 2). When the temperature was less than 300 °C, the concentration of these special aromatics was low and stable; when it was higher than 300 °C, their concentrations increased rapidly. Many aromatics could be synthesized with the enhancement of dehydrogenation and aromatization during the higher evolutionary stages [51,52]. Therefore, the maturity was an important factor in controlling the aromatic hydrocarbon concentration and composition characteristics of the OM.

4.2. Evolution Characteristics of Biomarkers

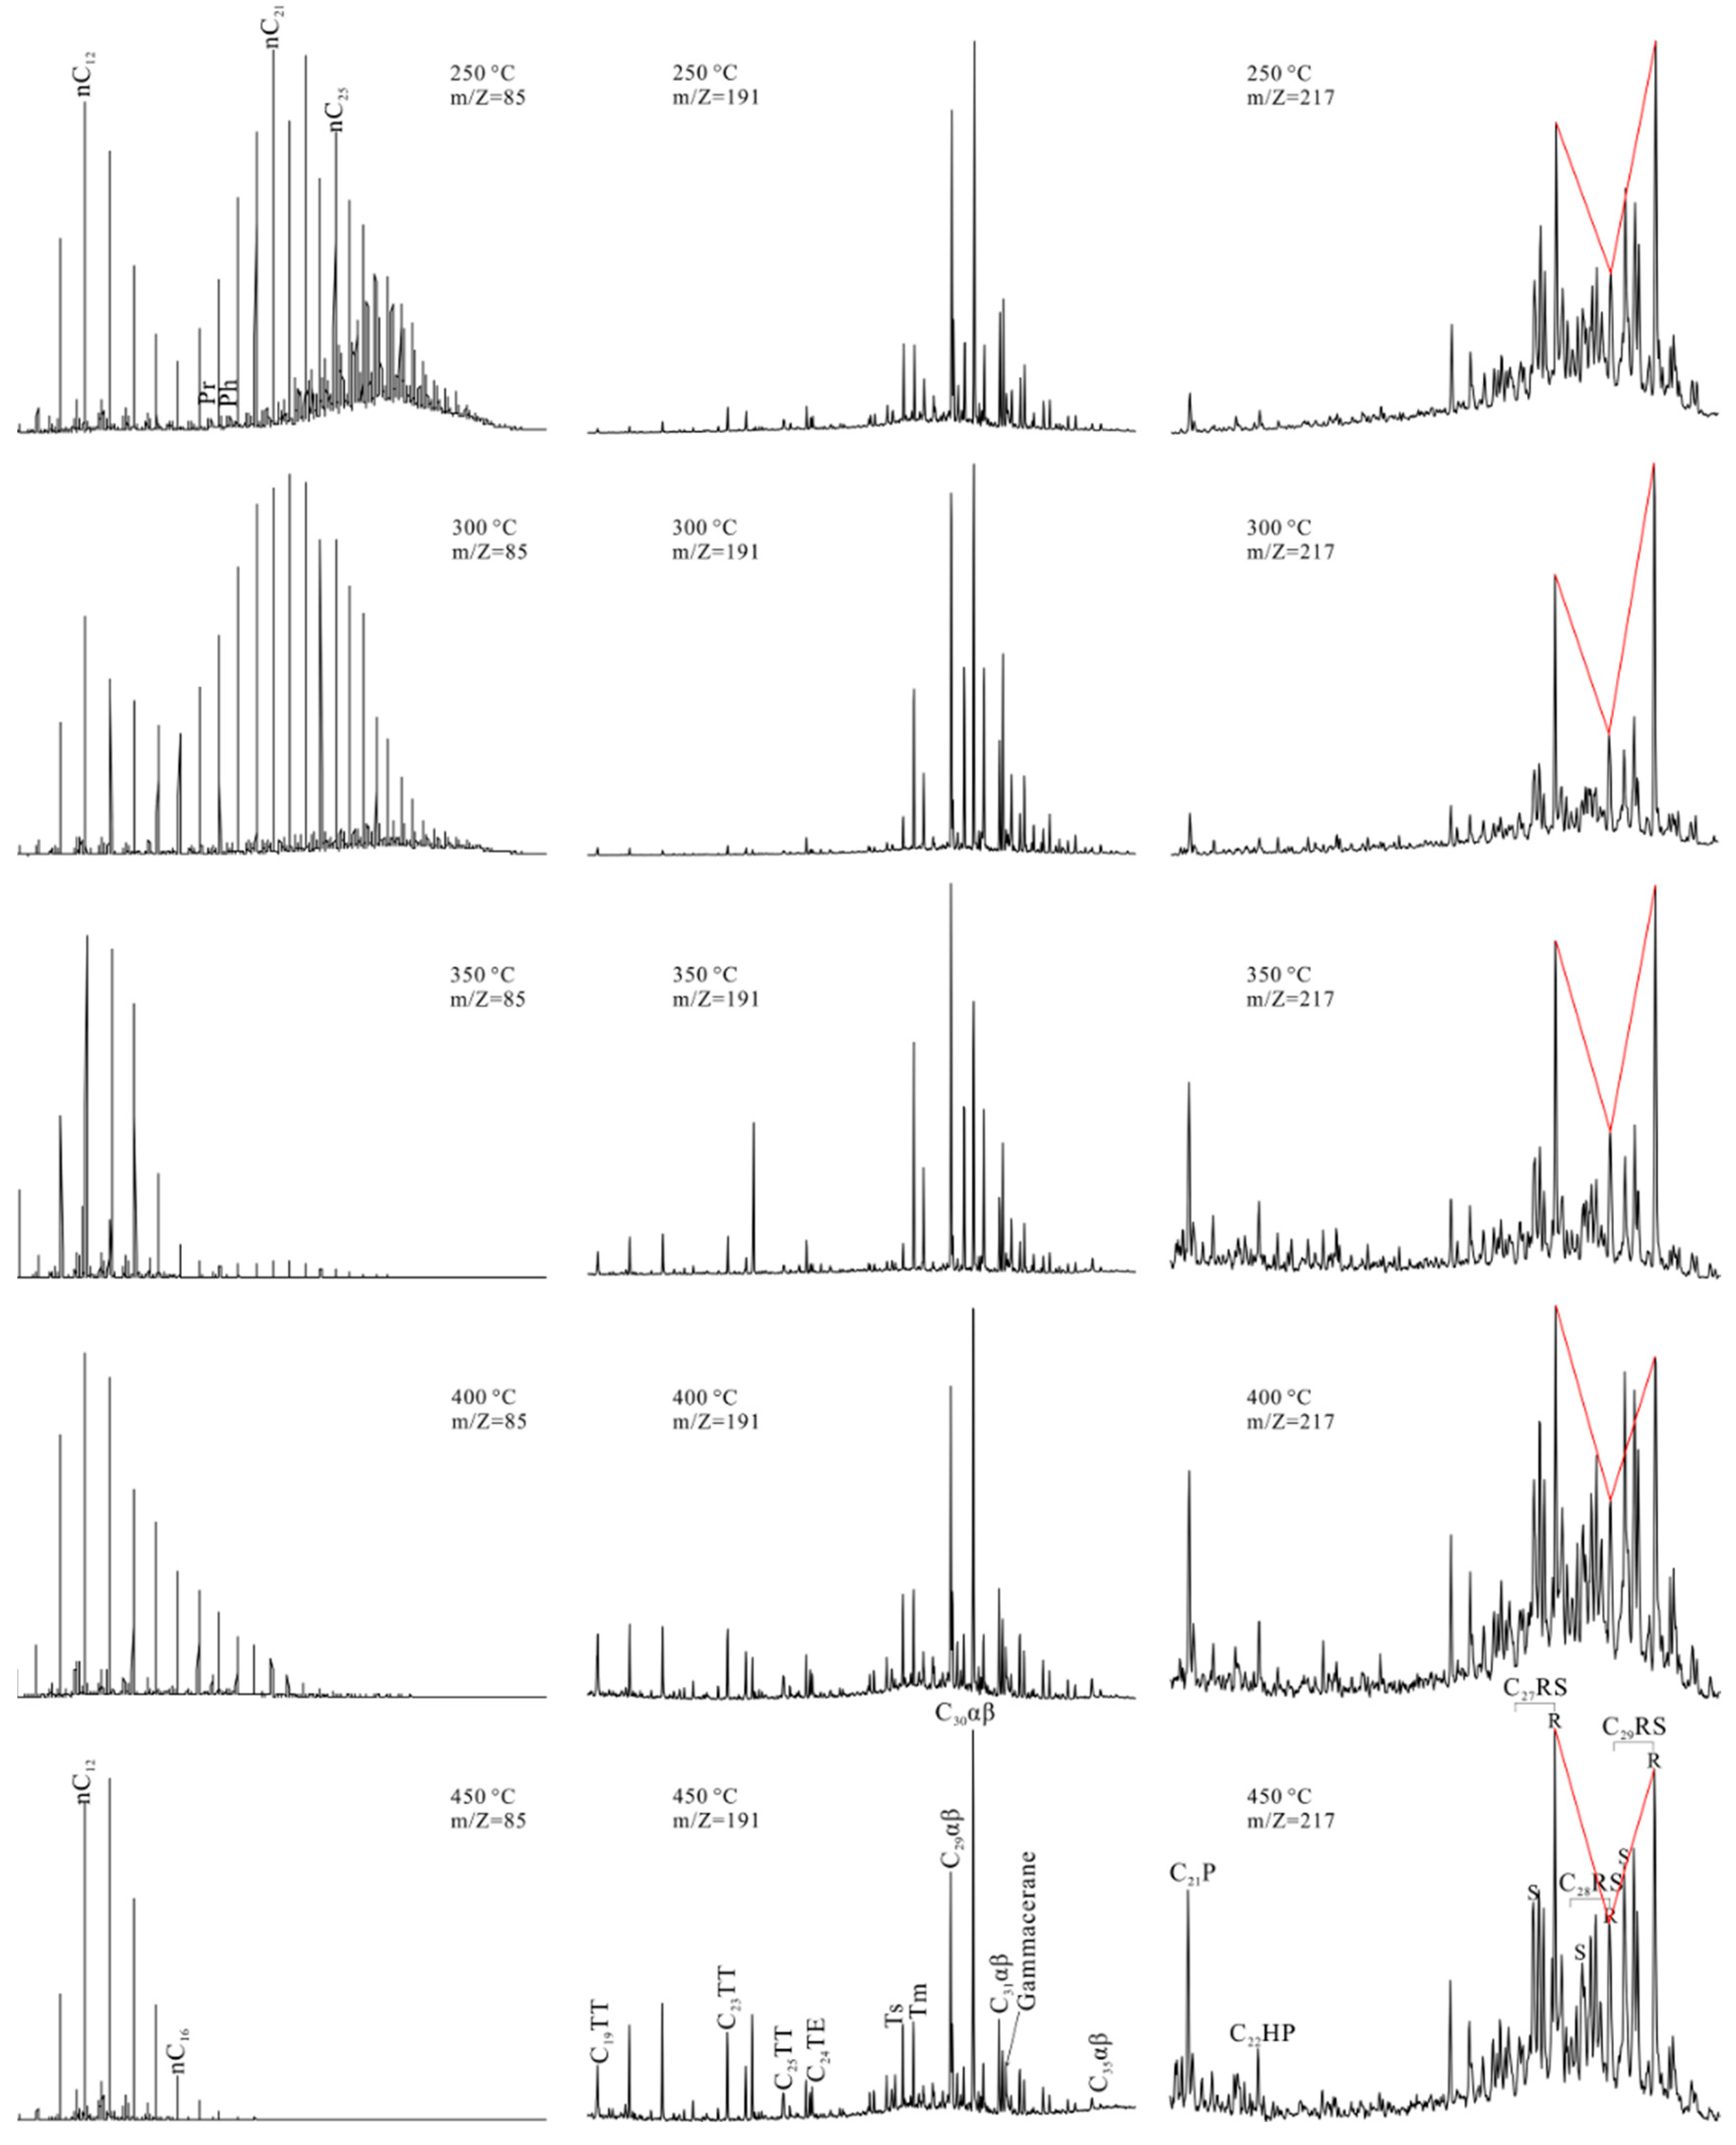
4.2.1. N-Alkanes and Isoprenoids

The carbon number of the experimental sample was distributed from nC9 to nC41 and the main peak carbons were nC15 and nC23, showing a characteristic of a double hump (Figure 4). As the degree of thermal evolution increased (as the simulation temperature increased), the carbon-number distribution range became narrower, the main peak carbon shifted forward significantly, and the peak shape changed from the double hump to the former hump. Above 350 °C, the main peak-carbon change was not obvious (essentially from nC12 to nC13). The carbon-preference index (CPI) of the original samples (unheated) was 1.65, suggesting that they were immature, which was consistent with the vitrinite-reflectance (Ro) results (Table 1). As shown in Table 3, the variation in the odd–evenness of the n-alkanes had good regularity. When the simulation temperature reached 300 °C, the CPI of the n-alkanes was 1.17, indicating that the odd-carbon advantage of the n-alkanes had essentially disappeared and that the OM in the source rocks had matured. Above 300 °C, the CPI was approximately 1.00 and it did not change significantly.
The ∑nC21/∑nC22+ ratio of the original sample was 1.53, revealing a clear low-carbon advantage, which was the result of the significant number of planktons that were deposited [27,28]. As the temperature increased, the ratio generally decreased at first and then increased. Before the simulation temperature reached 350 °C, the ratio had already increased to 8.04; subsequently, it continued to increase rapidly. This was possibly mainly due to the fact that as the temperature continued to rise, the source rocks exhibited intense demethylation of their hydrocarbons, carbon-chain cleavage and ring opening of their naphthenes and produced large amounts of gaseous hydrocarbons, which increased the abundance of the relative low-carbon n-alkanes [1,28,53].
Pristane (Pr) and phytane (Ph) are usually considered to be the products of the diagenesis of the phytyl side chain of chlorophyll [54]. Reducing conditions are favorable for the formation of phytol in the side chain of the phytyl and, finally, the formation of phytane, while the oxidative conditions promote the preferential conversion of phytol to pristane. Therefore, Pr/Ph can clearly reflect the redox conditions of the depositional environment [31,55]. The original sample had the obvious predominance of pristane, as the simulation temperature that increased the Pr/Ph ratio was smaller than that of the original sample and showed a trend of decreasing first and then increasing (Table 3).
The ratio of Pr/nC17 and Ph/nC18 also decreased gradually at first and then increased suddenly at 350 °C, indicating that the phytane series was more stable than the alkane series at higher maturity [28]. The Pr/Ph ratios of all the simulation samples were lower than the original sample, suggesting that the phytane series in the OM were partially cracked during the simulation experiments. At 250–350 °C, the Pr/Ph ratio gradually decreased, which was possibly because the cracking rate of the phytane was lower than that of the pristane at the peak of the liquid-hydrocarbon generation. At 350–450 °C, the Pr/Ph ratio increased gradually, which was probably due to the fact that the precursor of the pristane was preferentially released compared with the phytane [56]. On the other hand, the increase was possibly due to the greater number of precursors of pristane in the kerogen [57]. The ratio of Pr/nC17 and Ph/nC18 decreased at 250–300 °C, which indicated that, with the increasing maturity, the cracking strength of the high-carbon hydrocarbons enhanced gradually and the formation rate of nC17 and nC18 (n-alkanes) also increased. The sudden increase in the two ratios at 350 °C was possibly due to the further cracking of liquid hydrocarbons, resulting in more low-carbon hydrocarbons, which coincided with the sudden drop in the yield of the simulation oil products after this stage. These experimental results reflect the thermal sensitivity of pristane and phytane; therefore, if the influence of maturity is not taken into account when discussing the environmental significance of Pr/Ph, some mistakes inevitably appear [26,58].

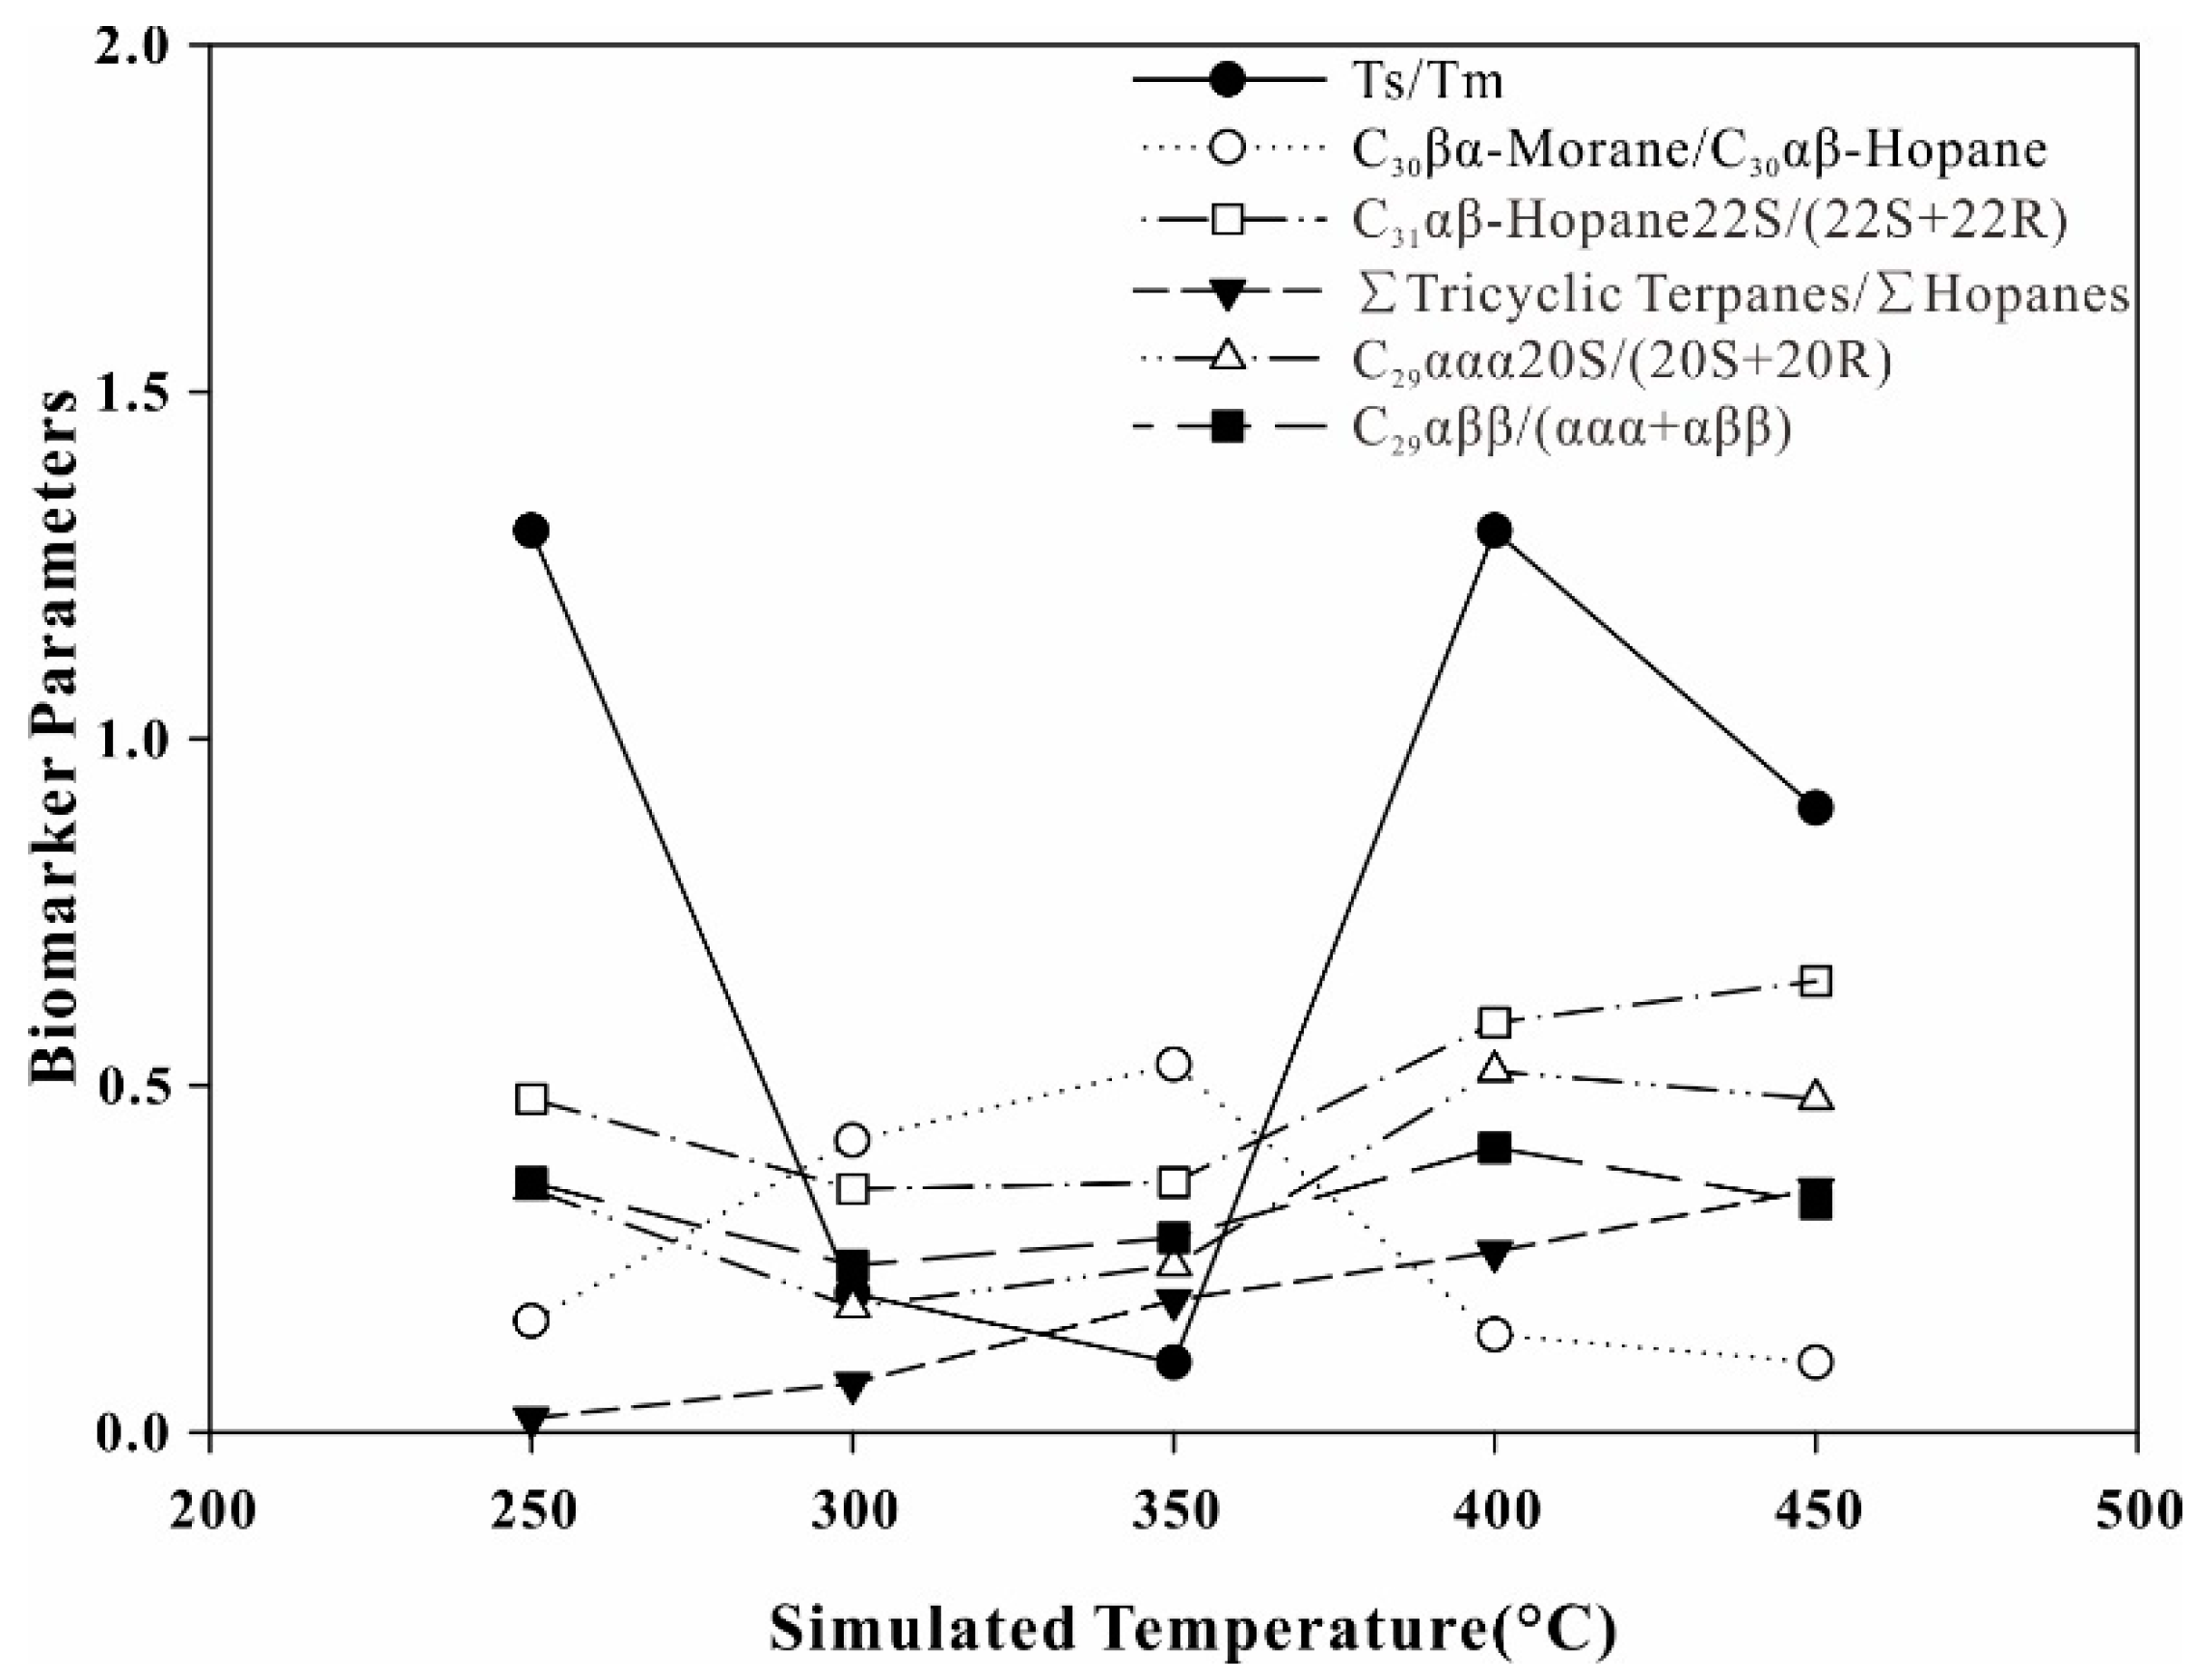
4.2.2. Characteristics of Terpane and Sterane

Tricyclic terpane has a wide distribution in sedimentary samples due to its isoprenoid side chain. Pentacyclic triterpene is also widely present in geological bodies; the pentacyclic triterpene with the hopane structure as the framework is an extensive biomarker [59,60]. Tricyclic terpane has attracted attention because of its high thermal stability and strong anti-biodegradability during evolution; van Graas [25] used the ratio of tricyclic terpanes/(tricyclic terpanes + hopanes) as the maturity index. In Figure 5, the ratio of ∑tricyclic terpanes/∑hopanes increases with the increasing temperature. Because of the small amount of tricyclic terpane in the original sample, the increasing tricyclic terpane was presumably mainly generated during thermal evolution [24,31]. Hence, the ratio of ∑tricyclic terpanes/∑hopanes could be used as a good maturity parameter for Middle Jurassic source rocks in the northern margin of the Qaidam Basin. The thermal stability of Ts (22, 29, 30-trisnorneohopane) is higher than that of Tm (22, 29, 30-trisnorhopane). Thus, the ratio of Ts/Tm can usually be used to indicate the degree of thermal evolution of organic matter [25,31,61]. However, the Ts/Tm value showed a complex variation trend: it increased first (250–300 °C) and then decreased with the increasing simulation temperature before increasing again. This was possibly because the Ts and Tm were cleaved during the heating, and the different ratios of the Ts and Tm suggested that they cracked at different rates. Furthermore, the formation of Ts and Tm might have occurred in the process of some high-molecular compounds cracking, which could have led to a relative content change in Ts and Tm.
The stability of the C30βα-morane was lower than that of the C30αβ-hopane. Thus, the C30βα-morane content decreased rapidly with the increasing maturity. The simulation results showed that the ratio of C30βα-morane/C30αβ-hopane had a good positive correlation with the temperature below 350 °C and then had a negative correlation (Figure 5). The C31-17α-hopane underwent isomerization at the C22 position; that is, the biogenic precursor of the hopane had a 22R configuration, which was gradually converted into a mixture of 22R- and 22S-rearranged stereoisomers [31]. According to the authors of [62], the ratio rose from 0 to 0.6 during thermal evolution and reached an equilibrium at 0.57–0.62. If the equilibrium value was exceeded, the maturity could not be indicated exactly. In general, the isomerization parameters of the different simulation samples did not reach an equilibrium value and the C31αβ22S/(22R + 22S) value (the isomerization parameter of homohopane) was opposite to that of C30βα-morane/C30αβ-hopane under increasing temperatures (Figure 5). Therefore, these two parameters did not truly reflect the thermal maturity in the low evolution stage, while were more effective thermal-evolution parameters during high maturity.
In samples of the simulation experiment, a wide range of steroidal compounds, such as pregnanes, rearranged steranes and regular steranes were detected (Figure 4). The relative abundances of pregnanes (C21 and C22) in the original samples and low-evolution samples (250–300 °C) were relatively low and the values of the ∑pregnanes/∑steranes were in the range of 0.05–0.11 (Table 3). However, after the simulation temperature rose to 350 °C, the ∑pregnane/∑sterane value increased rapidly and finally became stable (0.18–0.23). This implied that pregnanes were not degradation products of steranes; Liu et al. [29] held the same view. With the increasing temperature, the C27ααα20R/C29ααα20R ratio was relatively stable, although it rose to 0.86 at 450 °C. This suggested that the high-carbon sterane skeleton began to undergo a ring-opening cracking reaction. Mackenzie et al. [63] first proposed the ratios of C29ααα20S/(20S + 20R) and C29αββ/(αββ + ααα) to calculate maturity. However, Philp [24] pointed out that they had equilibrium values (0.52–0.55 and 0.67–0.71, respectively); when the balance value was exceeded, the information of maturity change was not reflected correctly. Currently, C29ααα20S/(20S + 20R) values and C29αββ/(αββ + ααα) values are the two most commonly used maturity and isomerization parameters [23,24].
Figure 5 shows that the C29ααα20S/(20S + 20R) values were as high as the original and 250 °C simulation samples and that the variation was not obvious. The reason for the high ratio of the original sample might be that hydrocarbons were slowly generated and accumulated in the long-term geological history. Due to the isomerization of microbes in the early stage of diagenesis, some 20R configurations were transformed into the 20S configurations, which made the value of the C29ααα20S/(20S + 20R) high [24,64]. The conversion rate of the 20R configuration to the 20S configuration was slow due to the lower temperature (250 °C). Meanwhile, the source-rock interstitial adsorption of hydrocarbons and some structural edge hydrocarbons abundant in the biological configuration of the C29ααα20R began to release slowly, resulting in a ratio of C29ααα20S/(20S + 20R) that was a little different from that of the original source rock. At 300–350 °C, the value of C29ααα20S/(20S + 20R) was significantly reduced, which was possibly due to the peaking of the hydrocarbon generation and expulsion. It was also possibly due to the rapid release of C29ααα20R derived from the source-rock-adsorption hydrocarbons and the edge hydrocarbons rich in biological configuration. Above 350 °C, the ratio of C29ααα20S/(20S + 20R) increased rapidly and remained relatively stable. Because of the increasing maturity, the transformation of the 20R biological configuration into the 20S geological configuration was accelerated, which eventually led to a rapid increase in the C29ααα20S/(20S + 20R) value [65]. At 400–450 °C, the source rocks reached a high maturity stage, and a large number of liquid hydrocarbons began to crack to form low-carbon hydrocarbons and gases. In the same stage, the kerogen generated fewer liquid hydrocarbons and most of the light hydrocarbons were discharged, while the residual oil was relatively stable. Thus, the C29ααα20S/(20S + 20R) ratio varied slightly. The ratio of C29ααα20S/(20S + 20R) was lower at 450 °C than at 400 °C, which was probably due to the decline in the source rocks at high maturity [23]. The thermal evolution of the C29αββ/(ααα + αββ) was similar to that of the C29ααα20S/(20S + 20R), both of which had a similar tendency with the increase in temperature. Because none of them exceeded the equilibrium value or had regular variation, they were relatively reliable maturity indicators for the Middle Jurassic high-quality source rocks in the northern margin of the Qaidam Basin.
Due to time constraints, a lack of research information and data and the authors’ limited capacities, this paper features many limitations in terms of its ideas, conclusions and direct measurements. Although we systematically analyzed the variation characteristics of the maturity parameters of saturated hydrocarbon biomarkers in different thermal-evolution stages, the lack of evolution rules for more complex aromatic compounds (such as the maturity parameters of methylphenanthrene compounds, the maturity parameters of methylnaphthalene compounds and the maturity parameters of dibenzothiophene compounds) was a major defect. However, the simulation experiment was jointly controlled using temperature, time, static rock pressure, fluid pressure, pore space, OM type, stratigraphic water and inorganic minerals. Therefore, the high-temperature and high-pressure water-bearing thermal-simulation experiment could become a reference for source-rock hydrocarbon-mechanism research in the future.

5. Conclusions

The “oil window” of the Middle Jurassic source rocks in the Yuka area of the Qaidam Basin was 300 °C (simulation temperature, Ro = 0.84%), and the hydrocarbon-expulsion efficiency was low during this period. As the degree of thermal evolution increased, the oil production decreased, while the gas production and the hydrocarbon-expulsion efficiency increased. Although the concentration of alkanes increased overall during the increasing thermal evolution, it varied in complex ways below the “oil window” (simulation temperature <300 °C or Ro < 0.84%), which implied that the thermal evolution of the OM was complicated. The concentration of aromatics showed a two-stage variation and was affected obviously by the maturity (simulation temperature). The tricyclic terpanes increased with the increase in maturity, which was the result of the conversion of hopanes to tricyclic terpanes. Therefore, the ratio of ∑tricyclic terpanes/∑hopanes was the most reliable thermal-evolution parameter in the Yuka Sag of the Qaidam Basin. The other biomarker parameters were more complicated, with varying maturity. They should, therefore, be used cautiously when evaluating the degree of thermal evolution with biomarkers.

Author Contributions

Conceptualization, X.Z. and Y.C.; methodology, X.Z.; software, X.L.; validation, T.L., Y.S. and Y.C.; formal analysis, Y.S. and G.Z.; investigation, X.L. and T.L.; resources, P.J.; data curation, T.L. and G.Z.; writing—original draft preparation, Y.C.; writing—review and editing, X.Z.; visualization, X.L. and Y.S.; supervision, X.Z.; project administration, X.Z. and Y.C.; funding acquisition, X.Z. All authors have read and agreed to the published version of the manuscript.

Funding

This research was funded by the National Natural Science Foundation of China (42002174, 42102199), the Natural Science Foundation of Gansu Province (20JR10RA030), the Gansu Youth Science and Technology Fund Program (21JR7RA062), the Open Fund (XSTS-202005) of Xi’an Key Laboratory of Tight oil (Shale oil) Development.

Institutional Review Board Statement

Not applicable.

Informed Consent Statement

Not applicable.

Data Availability Statement

Not applicable.

Conflicts of Interest

The authors declare no conflict of interest.

References

  1. Tissot, B.P.; Durand, B.; Espitalie, J.; Combaz, A. Influence of mature and diagenesis of organic matter in the formation of petroleum. AAPG Bull. 1974, 58, 499–506. [Google Scholar]
  2. Lewan, M.D.; Winters, J.C.; McDonald, J.H. Generation of oil-like pyrolyzates from organic-rich shales. Science 1979, 203, 897–899. [Google Scholar] [CrossRef] [PubMed]
  3. Connan, J. Time-temperature relation in oil genesis. AAPG Bull. 1974, 58, 2516–2521. [Google Scholar]
  4. Waples, D.W. Time and temperature in petroleum formation: Application of lopatin’s method to petroleum exploration. AAPG Bull. 1980, 64, 916–926. [Google Scholar]
  5. Monthioux, M.; Landais, P.; Durand, B. Comparison between extracts from natural and artificial maturation series of Mahakam delta coals. Org. Geochem. 1986, 10, 299–311. [Google Scholar] [CrossRef]
  6. Behar, F.; Vandenbroucke, M.; Tang, Y.; Marquis, F.; Espitalie, J. Thermal cracking of kerogen in open and closed systems: Determination of kinetic parameters and stoichiometric coefficients for oil andgas generation. Org. Geochem. 1997, 26, 321–339. [Google Scholar] [CrossRef]
  7. Lewan, M.D. Experiments on the role of water in petroleum formation. Geochim. Cosmochim. Acta 1997, 61, 3691–3723. [Google Scholar] [CrossRef]
  8. Liu, Q.Y.; Liu, W.H.; Qin, S.F.; Meng, Q.X.; Wang., W.C. Geochemical study of thermal simulation on coal and coal with different mediums: Yeilding rate of gaseous and organic liquid products and their evolution. Acta Sedimentol. Sin. 2001, 19, 465–468. (In Chinese) [Google Scholar]
  9. Ruble, T.E.; Lewan, M.D.; Philp, R.P. New Insights on the Green River petroleum system in the Uinta Basin from hydrous pyrolysis experiments. AAPG Bull. 2001, 85, 1333–1371. [Google Scholar] [CrossRef]
  10. Pan, C.C.; Jiang, L.L.; Liu, J.Z.; Zhang, S.C.; Zhu, G.Y. The effects of calcite and montmorillonite on oil cracking in confined pyrolysis experiments. Org. Geochem. 2010, 41, 611–626. [Google Scholar] [CrossRef]
  11. Bayon, R.L.; Brey, G.P.; Ernst, W.G.; Mählmann, R.F. Experimental kinetic study of organic matter maturation: Time and pressure effects on vitrinite reflectance at 400 °C. Org. Geochem. 2011, 42, 340–355. [Google Scholar] [CrossRef]
  12. Lewan, M.D.; Roy, S. Role of water in hydrocarbon generation from Type-I kerogen in Mahogany oil shale of the Green River Formation. Org. Geochem. 2011, 42, 31–41. [Google Scholar] [CrossRef]
  13. Tian, H.; Xiao, X.M.; Wilkins, R.W.T.; Tang, Y.C. An experimental comparison of gas generation from three oil fractions: Implications for the chemical and stable carbon isotopic signatures of oil cracking gas. Org. Geochem. 2012, 46, 96–112. [Google Scholar] [CrossRef]
  14. Wu, L.L.; Fang, X.Y.; Ji, S.H.; Geng, A.S. Thermal alteration of biomarkers in the presence of elemental sulfur and sulfur-bearing minerals during hydrous and anhydrous pyrolysis. Org. Geochem. 2018, 41, 74–89. [Google Scholar] [CrossRef]
  15. Song, D.J.; Wang, X.Q.; Wu, C.J.; Meng, S.W.; Zhang, M.F.; Li, H.D.; Jiao, H.; Liu, X.D.; Jin, X.; Tuo, J.C. Petroleum Generation, Retention, and Expulsion in Lacustrine Shales Using an Artificial Thermal Maturation Approach: Implications for the In-Situ Conversion of Shale Oil. Energy Fuels 2021, 35, 358–373. [Google Scholar] [CrossRef]
  16. Tang, Q.Y.; Zhang, M.J.; Zhang, T.W.; Shang, H.; Lin, Y. A Review on Pyrolysis Experimentation on Hydrocarbon Generation. J. Southwest Pet. Univ. Sci. Technol. Ed. 2013, 35, 52–62. (In Chinese) [Google Scholar]
  17. Behar, F.; Kressmann, S.; Rudkiewicz, J.L.; Vandenbroucke, M. Experimental simulation in a confined system and kinetics modelling of kerogen and oil cracking. Org. Geochem. 1992, 19, 173–189. [Google Scholar] [CrossRef]
  18. Dieckmann, V.; Schenk, H.J.; Horsfield, B. Assessing the overlap of primary and secondary reactions by closed-versus open-system pyrolysis of marine kerogens. J. Anal. Appl. Pyrol. 2000, 56, 33–46. [Google Scholar] [CrossRef]
  19. Qin, L.M.; Zhang, Z.H.; Zhu, L.; Liu, H.J.; Xi, W.J. Productions of closed system experiments for Middle Permian source rock in southern Junggar Basin. Nat. Gas Geosci. 2011, 22, 860–865. (In Chinese) [Google Scholar]
  20. Zhang, X.L.; Yang, X.; Zhou, F.; Ju, P.F.; Chen, Y.X.; Cao, Z.Y.; Xia, Y.Q.; Zhang, X.B. Hydrocarbon yield evolution characteristics and geological significance in temperature-pressure controlled simulation experiment. Nat. Gas Geosci. 2022, 33, 1460–1475. (In Chinese) [Google Scholar]
  21. Eglinton, G.; Calvin, M. Chemical fossils. Sci. Am. 1967, 216, 32–43. [Google Scholar] [CrossRef]
  22. Eglinton, G.; Scott, P.M.; Besky, T.; Burlingame, A.L.; Calvin, M. Hydrocarbons of biological origin from a one-billion-year-old sediment. Science 1964, 145, 263–264. [Google Scholar] [CrossRef] [PubMed] [Green Version]
  23. Peters, K.E.; Moldowan, J.M. The Biomarker Guide: Interpreting Molecular Fossils in Petroleum and Ancient Sediments; Prentice Hall: Englewood Cliffs, NJ, USA, 1993; pp. 1–236. [Google Scholar]
  24. Philp, R.P. Fossil Fuel Biomarkers. In Methods in Geochemistry and Geophysics; Elsevier: New York, NY, USA, 1985; Volume 23, pp. 1–294. [Google Scholar]
  25. Van Grass, G.W. Biomarker maturity parameters for high maturities: Calibration of the working range up to the oil/condensate threshold. Org. Geochem. 1990, 16, 1025–1032. [Google Scholar] [CrossRef]
  26. Wang, Y.T. Biomarkers from Pingdiquan (P2) shale by thermal modelling experiments. Xinjiang Pet. Geol. 1992, 13, 240–250. (In Chinese) [Google Scholar]
  27. Duan, Y.; Zhou, S.X. Study on thermal simulation of carboniferous source rocks in Tarim Basin: II Composition and evolution of biomarkers. Oil Gas Geol. 2001, 22, 13–16. (In Chinese) [Google Scholar]
  28. Liu, Q.Y.; Liu, W.H.; Liu, Z.Z.; Bi, C.C. Geochemical characteristics of n-alkanes from the pyrolysis of macerals in coals in close system. Bull. Miner. Pet. Geochem. 2007, 26, 234–239. (In Chinese) [Google Scholar]
  29. Liu, Q.Y.; Liu, W.H.; Meng, Q.X. Geochemical characteristics of steranes in saturated hydrocatbons from coal and exinite in pyrolysis under closed systems. Nat. Gas Geosci. 2007, 18, 249–253. (In Chinese) [Google Scholar]
  30. Meng, Q.X.; Sun, M.Z.; Fang, X.; Wang, Z.D.; Wang, G.C.; Xu, X. Hydrocarbon generation mechanism and evolution characteristics of biomarkers on low-evolutionary source rocks of the salt lacustrine facies. Acta Sedimentol. Sin. 2007, 25, 800–807. (In Chinese) [Google Scholar]
  31. Sun, L.N.; Zhang, Z.N.; Wu, Y.D.; Su, L.; Xia, Y.Q.; Wang, Z.X.; Zheng, Y.W. Evolution patterns and their significances of biomarker maturity parameters—A case study on liquid hydrocarbons from type III source rock under HTHP hydrous pyrolysis. Oil Gas Geol. 2015, 36, 573–580. (In Chinese) [Google Scholar]
  32. Zhang, M.; Yin, C.M.; Chen, Y. Strategy of hydrocarbon exploration in the petroleum system of the northern Qaidam Basin. Acta Sedimentol. Sin. 2005, 23, 143–149. (In Chinese) [Google Scholar]
  33. Liu, Y.T.; Yang, S.Y.; Hu, K.; Cao, J.; Bian, L.Z.; Wang, L.Q.; Chen, Y. Organic geochemical features of mudstone source rock from member 7 strata of Middle Jurassic age in the northern margin of Qaidam Basin and its hydrocarbon-generation potential. Geol. J. Chi. Univ. 2007, 13, 703–713. (In Chinese) [Google Scholar]
  34. Cao, J.; Bian, L.Z.; Hu, K.; Liu, Y.T.; Wang, L.Q.; Yang, S.Y.; Chen, Y. Biomarker features of Jurassic mudstone source rock from different sedimentary environments in the northern Qaidam Basin and its applications. Acta Geol. Sin. 2008, 82, 1121–1128. (In Chinese) [Google Scholar]
  35. Cao, J.; Wu, M.; Chen, Y.; Hu, K.; Bian, L.Z.; Wang, L.G.; Zhang, Y. Trace and rare earth element geochemistry of Jurassic mudstones in the northern Qaidam Basin, northwest China. Chem. Erde-Geochem. 2012, 72, 245–252. [Google Scholar] [CrossRef]
  36. Tian, J.X.; Li, J.; Pan, C.F.; Tan, Z.; Zeng, X.; Guo, Z.Q.; Wang, B.; Zhou, F. Geochemical characteristics and factors controlling natural gas accumulation in the northern margin of the Qaidam Basin. J. Pet. Sci. Eng. 2018, 160, 219–228. [Google Scholar] [CrossRef]
  37. Yan, C.F.; Yuan, J.Y.; Chen, Q.L.; Shao, H.S.; Zhang, Z.G. Discovery of the high-quality source rock of the first member of Dameigou Formation in the east part of the northern Qaidam Basin. Acta Pet. Sin. 2011, 32, 49–53. (In Chinese) [Google Scholar]
  38. Zhai, Z.W.; Zhang, Y.S.; Yang, H.M.; Sha, W.; Nian, X.Q.; Hao, X.M.; Ren, Q.; Zhang, J.J. Characteristics of effective source rocks in the Jurassic and hydrocarbon accumulation patterns in the areas near the northern margin of the Qaidam Basin. Nat. Gas Ind. 2013, 33, 36–42. (In Chinese) [Google Scholar]
  39. Tang, Y.; Zhang, Y.P.; Li, Y.H. The potential evaluation of shale oil in the seventh member of Dameigou Formation (J2d7) on the northern margin of Qaidam Basin: A case study of Dameigou area. Geol. China 2016, 43, 575–584. (In Chinese) [Google Scholar]
  40. Qin, J.; Wang, S.Q.; Sanei, H.; Jiang, C.Q.; Chen, Z.H.; Ren, S.M.; Xu, X.M.; Yang, J.J.; Zhong, N.N. Revelation of organic matter sources and sedimentary environment characteristics for shale gas formation by petrographic analysis of middle Jurassic Dameigou formation, northern Qaidam Basin, China. Int. J. Coal Geol. 2018, 195, 373–385. [Google Scholar] [CrossRef]
  41. Zhang, X.L. Hydrocarbon Generation Mechanism and Resource Potential of Jurassic Source Rocks in Qaidam Basin; University of Chinese Academy of Sciences: Beijing, China, 2019. (In Chinese) [Google Scholar]
  42. Bai, Y.Y.; Lv, Q.T.; Liu, Z.J.; Simon, C.G.; Sun, P.C.; Meng, Q.T.; Xie, W.Q.; Song, Q.L.; Wang, J.X.; Xu, C. An analysis of sedimentary organic facies in the coal-bearing member of Middle Jurassic Shimengou Formation, Yuqia area, Qaidam Basin. Acta Geosci. Sin. 2021, 42, 501–513. (In Chinese) [Google Scholar]
  43. Nian, X.Q. Geochemical Characteristics of the Rich Strontium Stratum in Western Qaidam Basin and It’s Geological Significance; University of Chinese Academy of Sciences: Beijing, China, 2018. (In Chinese) [Google Scholar]
  44. Fang, X.M.; Zhang, W.L.; Meng, Q.Q.; Gao, J.P.; Wang, X.M.; King, J.; Song, C.H.; Dai, S.; Miao, Y.F. High-resolution magnetostratigraphy of the Neogene Huaitoutala section in the eastern Qaidam Basin on the NE Tibetan Plateau, Qinghai Province, China and its implication on tectonic uplift of the NE Tibetan Plateau. Earth Planet. Sci. Lett. 2007, 258, 293–306. [Google Scholar] [CrossRef]
  45. Dai, J.X.; Ye, X.S.; Tang, L.J.; Jin, Z.J.; Shao, W.B.; Hu, Y.; Zhang, B.S. Tectonic units and oil–gas potential of the Qaidam Basin. Chin. J. Geol. 2003, 38, 291–296. (In Chinese) [Google Scholar]
  46. Fu, S.T. Natural gas exploration in Qaidam basin. China Pet. Explor. 2014, 19, 1–10. (In Chinese) [Google Scholar]
  47. Fu, S.T.; Ma, D.D.; Guo, Z.Y.; Feng, C. Strike-slip superimposed Qaidam basin and its control on oil and gas accumulation, NW China. Pet. Explor. Dev. 2015, 42, 778–789. [Google Scholar] [CrossRef]
  48. Wu, Y.D.; Zhang, Z.N.; Sun, L.N.; Li, Y.; He, C.; Ji, L.M.; Su, L.; Zhang, D.W. Hydrocarbon generation and potential in continental organic-rich shales at the highly-mature stage, as determined by hydrous pyrolysis under supercritical conditions. Int. J. Coal Geol. 2018, 187, 83–93. [Google Scholar] [CrossRef]
  49. Zhang, Q.; Song, X.Y.; Zhang, Z.R.; Teng, G.E. Quantitative characteristics of biomarkers of crude oils of the Tahe Oil Filed. Pet. Geol. Exp. 2014, 36, 206–210. (In Chinese) [Google Scholar]
  50. Xiao, Z.H.; Hu, G.Y.; Li, Z.S. An analysis of characteristics of hydrocarbon generation from pyrolysis experiment of source rock. Nat. Gas Geosci. 2008, 19, 544–547. (In Chinese) [Google Scholar]
  51. Zhang, Z.H.; Zhang, H.F.; Gao, X.Z. Effect of clay minerals on hydrocarbon formation during kerogen pyrolysis. Pet. Explor. Dev. 1994, 21, 29–37. (In Chinese) [Google Scholar]
  52. Lu, S.F.; Zhao, X.G.; Wang, Z.W.; Liu, X.Y. The characteristic of aromatic products of hydrocarbon generated from coal. Acta Pet. Sin. 1996, 17, 48–52. (In Chinese) [Google Scholar]
  53. Liu, D.Y.; Peng, P.A.; Yu, C.L. Molecular characterization of flash pyrolysates of Jurassic vitrinites in Northwest China and its geological implications. Coal Geol. Explor. 2009, 37, 1–5. (In Chinese) [Google Scholar]
  54. Powell, T.; Mackirdy, D. Relationship between ratio of pristane to phytane, crude oil composition and geological environment in Australia. Nature 1973, 243, 37–39. [Google Scholar] [CrossRef]
  55. Lin, J.H.; Yi, H.S.; Li, Y.; Wang, C.S.; Peng, P.A. Characteristics of biomarker compounds and its implication of Middle Jurassic oil shale seguence in Shuanghu area, northern Tibet Plateau. Acta Sedimentol. Sin. 2001, 19, 287–292. (In Chinese) [Google Scholar]
  56. Burnham, A.K.; Braun, R.L. Development of a detailed model of petroleum formation, destruction and expulsion from lacustrine and marine source rocks. Org. Geochem. 1990, 16, 27–39. [Google Scholar] [CrossRef]
  57. Koopmans, M.P.; Rijpstra, W.I.C.; Klapwijk, M.M.; de Leeuw, J.W.; Lewan, M.D.; DamsteÂ, J.S.S. A thermal and chemical degradation approach to decipher pristane and phytane precursors in sedimentary organic matter. Org. Geochem. 1999, 30, 1089–1104. [Google Scholar] [CrossRef]
  58. Xia, Y.Q.; Luo, B.J.; Wang, C.J. The geochemical significance of alkane parameters in the products from pyrolytic simulation experiments. Acta Pet. Sin. 1996, 17, 36–40. (In Chinese) [Google Scholar]
  59. Ourisson, G.; Albrecht, P.; Rohmer, M. Predictive microbial biochemistry from molecular fossils to procaryotic membranes. Trends Biochem. Sci. 1982, 7, 236–239. [Google Scholar] [CrossRef]
  60. Wang, T.G. Approach to Biomarker Geochemistry; China University of Geosciences Press: Wuhan, China, 1990; pp. 1–154. [Google Scholar]
  61. Kolaczkowska, E.; Slougui, N.-E.; Watt, D.S.; Maruca, R.E.; Moldowan, J.M. Thermodynamic stability of various alkylated, dealkylated and rearranged 17α- and 17β-hopane isomers using molecular mechanics calculations. Org. Geochem. 1990, 16, 1033–1038. [Google Scholar] [CrossRef]
  62. Seifert, W.K.; Moldowan, J.M. The effect of thermal stress on source-rock quality as measured by hopane stereochemistry. Phys. Chem. Earth 1980, 12, 229–237. [Google Scholar] [CrossRef]
  63. Mackenzie, A.; Patience, R.; Maxwell, J. Molecular parameters of maturation in the Toarcian shales, Paris Basin, France-I. Changes in the configurations of acyclic isoprenoid alkanes, steranes and triterpanes. Geochim. Cosmochim. Acta 1980, 44, 1709–1721. [Google Scholar] [CrossRef]
  64. Serifer, W.K.; Moldowan, J.M.; Demaison, G.J. Source correlation of biodegraded oils. Org. Geochem. 1984, 6, 633–643. [Google Scholar]
  65. Radke, M.; Horsfield, B.; Littke, R.; Rullkötter, J. Maturation and petroleum generation. In Petroleum and Basin Evolution; Welte, D.H., Horsfield, B., Backer, D.R., Eds.; Springer: Berlin/Heidelberg, Germany, 1997; pp. 169–229. [Google Scholar]
Figure 1. Location and geological features of the Yuka Sag, Qaidam Basin. (a,b) Location of the Qaidam Basin and distribution of the Qaidam Basin’s northern margin; (c) strata thickness of the Middle Jurassic in northern margin of the Qaidam Basin; (d) Jurassic lithostratigraphic section of the Qaidam Basin.
Energies 15 07793 g001
Figure 2. The diagram of simulated products: (a) changes in total oil production and total hydrocarbon-gas production during the simulation experiment and (b) comparison of total hydrocarbon, expelled oil and remaining oil.
Energies 15 07793 g002
Figure 3. The distribution of alkanes and aromatics with increasing temperature.
Energies 15 07793 g003
Figure 4. The biomarker characteristics of different simulation-experiment temperatures.
Energies 15 07793 g004
Figure 5. The biomarker parameters of different simulation temperatures.
Energies 15 07793 g005
Table 1. Basic geochemical data of simulation-experiment sample.
WellLithologyTOC
(%)
S0
(mg/g)
S1
(mg/g)
S2
(mg/g)
PG
(mg/g)
HI
(mg/g)
PC
(%)
D
(%)
Tmax
°C
Ro
(%)
Yu33Mudstone6.450.060.3137.5437.915823.15494350.43
Note: PG = S0 + S1 + S2, HI = S2/TOC × 100, PC = 0.083 × (S0 + S1 + S2) and D = PC/TOC × 100%.
Table 2. Characteristics of concentration distribution of alkanes and aromatics in simulated experimental products.
TemperatureRoIsoprenoidsn-AlkanesNasPhsDBFsFsBisAnBeFlPy
(°C)(%)(ug/mg)
Unheated0.4510.53137.4126.461.891.741.692.230.190.010.140.12
2500.670.7442.418.841.150.530.430.490.090.050.040.06
3000.840.7055.8218.962.890.690.610.760.290.150.090.26
3501.211.4934.64126.3319.294.544.747.732.741.021.073.14
4001.662.8481.25107.7892.419.7318.366.9713.663.838.1013.20
4502.296.21168.84102.0818.164.267.267.871.850.452.102.89
Note: Alkanes = isoprenoids + n-alkanes, Nas = naphthalene series, Phs = phenanthrene series, DBFs = dibenzofuran series, Fs = fluorene series, Bis = biphenyl series, An = anthracene, Be = benzanthracene, Fl = fluoranthene and Py = pyrene.
Table 3. Composition characteristics of biomarkers in simulated experimental products.
Temperature (°C)Ro
(%)
Pr/
Ph
Pr/
nC17
Ph/
nC18
CPI∑nC21/
∑nC22+
C19T/
C23T
C24Te/
C26T
C29Ts/
C29H
diaC30H/C30HC29H/
C30H
∑Pregnanes/
∑Steranes
C27ααα20R/
C29ααα20R
Unheated0.451.920.490.271.650.410.150.820.350.140.730.070.81
2500.671.140.160.121.250.350.180.790.270.120.890.050.73
3000.841.050.070.041.170.261.200.750.130.061.010.110.62
3501.210.930.240.331.068.040.970.930.080.041.350.180.74
4001.661.070.090.101.043.610.841.030.350.130.690.230.63
4502.291.340.150.261.0328.570.700.970.330.120.680.210.86
Publisher’s Note: MDPI stays neutral with regard to jurisdictional claims in published maps and institutional affiliations.

