1. Introduction
Formaldehyde (HCHO) is a highly toxic carbonyl compound that has been categorized as carcinogenic group 1 (i.e., carcinogenic to humans) by the IARC [
1]. The Commission adopted a Binding Occupational Exposure Limit (OEL) for formaldehyde (inhalation) of 0.3 ppm as the 8 h Time-Weighted Average and 0.6 ppm as the Short-Term Exposure Limit (STEL) (15 min) in 2019 [
2]. In addition to negatively impacting air quality, HCHO is also a precursor of tropospheric ozone and peroxyacetyl nitrates (PAN) [
3,
4,
5]. The transport sector is an important source of HCHO. HCHO is found in vehicle exhaust as a result of incomplete combustion of fuels [
6]. HCHO emissions from transport have been often associated with the use of methanol or CNG as fuel [
7,
8]. Nonetheless, some recent studies have also shown non-negligible emissions of HCHO coming from Diesel vehicles [
9]. It has been suggested that in Diesel-fuelled engines HCHO is largely formed in the combustion process from fuel fragments produced in the initial oxidative combustion of the fuel [
9].
While some HCHO vehicle emission factors have been reported [
6,
7,
8,
9,
10], the overall contribution from the transport sector remains poorly understood. This is mainly due to the difficulty to measure real-time and real-world emissions of HCHO. In fact, vehicular HCHO emissions are commonly quantified using off-line techniques (namely high-pressure liquid chromatography (HPLC) coupled with ultraviolet diode array detector (UV-DAD)) on samples extracted during tests performed in the laboratory over a driving cycle [
6]. This methodology, described in CARB Method 1004 and the UNECE Global Technical Regulation No15, provides an overall picture of the emissions of a vehicle over the full test, but it does not allow to assess its real-time emissions. This leads to large discrepancies on the HCHO emission factors reported by the different studies [
10]. In turn, this results in high uncertainty in the actual HCHO emissions, decreasing the reliability of the O
3 simulated by air quality models [
11].
In a previous study, we addressed this knowledge gap by investigating real-time measurement techniques that measured HCHO in the laboratory [
12]. The study showed that FTIR and proton transfer reaction mass spectrometry (PTR-MS) can accurately measure HCHO from diluted exhaust sampled from a constant volume sampler (CVS). The measurements were in good agreement with the reference method CARB Method 1004. Geng et al. [
8] also suggested using FTIR for vehicle emission applications during laboratory testing.
The introduction of Portable Emission Measurement Systems (PEMS) during type-approval and in-service conformity of heavy-duty and light-duty vehicles shows a clear tendency to move from pure laboratory testing towards real-time real-world tailpipe emission measurement. When compared to a laboratory diluted measurement from a CVS, measuring directly from the vehicle’s tailpipe comes with a series of challenges, the most important of which is for the instruments to accurately measure the target compounds at higher water concentrations from very dynamic exhaust flow [
13].
In a recent study, Zhu et al. [
10] presented a portable system to measure HCHO with a limit of detection as low as 25 ppmv for a 10 min measurement under typical sampling conditions. However, the time resolution was approximately 100 s. In order to properly quantify the emissions, a current EU (European Union) regulation [
14] requires that PEMS presents a measurement rate of at least 1 Hz and rise times lower than 3 s. This allows a reasonable alignment of the vehicle exhaust flow and the measured concentration.
The present study compares the real-time HCHO measurements at different ambient conditions of three Fourier Transform InfraRed spectrometers (FTIRs) and one Quantum Cascade Laser InfraRed spectrometer (QCL-IR) sampling from the tailpipe of one gasoline passenger car, one Diesel light-duty commercial vehicle and a Diesel heavy-duty vehicle, all meeting recent EU emission standards (i.e., Euro 6 and Euro VI). Finally, we characterized real-time real-world emissions of HCHO measuring on the road with the QCL-IR.
2. Methods
Three vehicles were tested at the Vehicle Emissions Laboratories (VELA) of the Joint Research Centre (JRC) in Ispra, Italy, including one gasoline passenger car (hereinafter GV), one Diesel light-duty commercial vehicle (DV) and one N3 heavy-duty Diesel vehicle (hereinafter HDV). The specifications of the three vehicles can be found in
Table 1. The vehicles met recent emission standards. Thus, the GV and the DV were Euro 6d and the HDV was a Euro VI-E. DV and HDV were tested using B7 commercial fuel and the GV used commercial E10. It must be noted that the GV was equipped with a pristine (i.e., not degreened) three-way catalyst (TWC).
The GV and the DV were tested at VELA2 over the type-approval Worldwide harmonised Light-duty vehicles Test Cycle (WLTC) at 23 °C and 0 °C. For the tests with the GV and the DV the road load coefficients were estimated to be F0 = 35.64 N, F1= 0.449 N (km/h) and F2 = 0.0311 N/(km/h)
2 (inertia 1334 kg) and F0 = 51.2 N, F1 = 0.169 N (km/h) and F2 = 0.0533 N/(km/h)
2 (inertia 2116 kg), respectively. Moreover, the DV was also tested on the road following the Real Driving Emissions (RDE) procedure [
14]. On the other hand, the HDV was tested at VELA7 over the World Harmonised Heavy-duty Vehicle Cycle (WHVC). The WHVC is a transposition on the chassis dyno of the homologation type-approval cycle of the heavy-duty engines (WHTC—World Harmonized Transient Cycle). Due to the presence inside the test cell of devices sensitive to cold temperatures, the minimum temperature that was possible to reach with the HDV was 5 °C. Thus, the HDV was tested over the WHVC at 23 °C and 5 °C. Furthermore, the HDV was also tested in the laboratory over a cycle that mimics a real-world on-road test (hereinafter RWT). This real-world test was previously performed with a vehicle presenting similar features, and during the test the vehicle speed and the road grade were recorded. This information was then inserted in the in-house automation software of the test cell, which allowed replicating the real-world route parameters in the laboratory.
Figure 1 illustrates the speed and altitude (when relevant) profiles for each test performed, namely: WLTC, RDE, WHVC and the RWT.
The road load coefficients for the HDV were estimated to be F0 = 1460 N and F2 = 0.247 N/(km/h)2 for inertia of 29,000 kg, corresponding to ~59% of maximum payload. The WLTC and WHVC were performed in cold- and hot-start conditions. Cold-start tests should be understood as tests starting with the vehicle coolant temperature comparable to the ambient one and hot-start tests as tests where the vehicle coolant temperature is >70 °C. Unless otherwise stated, duplicated tests were carried out over all the test cycles and on the road and the emissions reported are the average of the tests performed.
Each laboratory was equipped with different FTIR instruments (Nicolet Antaris IGS Analyzer—Thermo Electron Scientific Instruments LLC, Madison, WI, USA)—SESAM— (SESAM FTIR v4—hereinafter FTIR-1—for VELA2, and SESAM i60 FT—hereinafter FTIR-2—for VELA7) comprising a multipath gas cell with a 2 m optical path, downstream sampling pump (6.5 L/min sampling rate), Michelson interferometer (spectral resolution: 0.5 cm−1, spectral range: 650–4000 cm−1), a liquid-nitrogen-cooled mercury cadmium telluride detector, a sampling system consisting of heated pre-filter and PTFE sampling line (191 °C). These instruments, sampling directly from the vehicles’ tailpipe, had an acquisition frequency of 1 Hz, allowing for real-time measurement of HCHO emissions. Although both instruments presented similar basic characteristics, the FTIR-2 was an improved version of FTIR-1, with a better signal to noise ratio at its detector. For instance, FTIR-2 had the same optical path but a newer optical bench controller board with an improved digitizer to obtain better signal processing for cleaner quantification during dynamic measurements. In addition, FTIR-2 had a shorter service life (i.e., total period of use since its purchase) with respect to FTIR-1 and its components (source, detectors, etc.). The FTIR-1 and FTIR-2 estimated LoDs, 3× standard deviation, of the instrument used in this test were ~1.8 ppm and ~0.6 ppm, respectively, at an acquisition frequency of 1 Hz. All the used FTIR instruments were specifically designed for vehicle emissions measurement and include dedicated libraries for the components measured.
HCHO emissions of all the tests performed with the three vehicles were also measured using a dedicated laboratory-grade QCL-IR instrument (HORIBA XLA-13H, Horiba, Kyoto, Japan —hereinafter QCL-IR). The QCL-IR implements Infrared Laser Absorption Modulation (IRLAM) technology, which is based on infrared absorption spectroscopy, and exploits a Quantum Cascade Laser (QCL) as a light source. More information can be found in Shibuya et al. [
15]. It was made of three main units—a sampling system, analyser and PC (user interface). The sampling system consisted of a 6 m long heated line at 113 °C, to ensure fast response time, low adsorption and no condensation and to prevent unnecessary chemical reactions. It featured a polytetrafluoroethylene (PTFE) inner tube with an in-line filter. The analyser was equipped with a compact gas sampling cell, called the Herriott Cell, with an optical path length of 12.4 m and an internal volume of 250 cm
3, which was operated at 113 °C and 26 kPa. The wavelength of the QCL for measuring HCHO was around 5.7 μm. The QCL modulates the wavelength over a range of about 0.5 cm
−1 and acquires an absorption signal with a spectral resolution of about 0.001 cm
−1, corresponding to the laser linewidth. It included a non-cooled InAsSb photovoltaic detector. A dedicated pump provided a sampling flow rate of approximately 8 L/min. This system setup was characterized by a measurement range between 0–100 ppm. The instrument used an acquisition frequency of 10 z [
16] and the estimated LoD, 3× standard deviation, of the instrument used in this test was 0.1.
Although this is a laboratory-grade instrument, the QCL-IR was also used during the tests performed on the road with the DV. The DV, being a light commercial vehicle, allowed carrying the needed setup without problems of space or payload. The setup included the QCL-IR and its heated filter, the heated sampling line and the power supply, which comprised a set of batteries and two dedicated power inverters. The vehicle exhaust flow was acquired using a Portable Emissions Measurement Systems (PEMS) AVL MOVE (AVL, Graz, Austria). Before each on-road test the QCL-IR was conditioned using the grid to optimize the minimize usage.
The tests performed with the HDV also included a third FTIR (SESAM i60 FT SII, Nicolet Antaris IGS Analyzer—Thermo Electron Scientific Instruments LLC, Madison, WI, USA—hereinafter FTIR-3). The FTIR-3 was based on the same spectrometer platform of the FTIR-2 instrument, but with faster 5 Hz scan mode, multi-reflection gas cell with 3.2 m optical path length and a volume of 140 cm3 to ensure an 8 L/min sample flow rate and analyser response time of 1.2 s at 80 kPa. The calibration range of the instrument was set to 0–500 ppm for HCHO to also cover pre-catalyst emission measurements. With the use of multivariate classical least squares algorithm between 2600–2850 cm−1, the spectra evaluation method could distinguish and quantify between formaldehyde and acetaldehyde with an estimated LoD for HCHO of 0.3 ppm at 5 Hz concentration data update frequency.
The four instruments (FTIR-1, FTIR-2, FTIR-3 and QCL-IR) were factory-calibrated. In particular, FTIR-3 and QCL-IR were calibrated in their respective factories right before the start of the experimental campaign.
The HCHO calibration function in the FTIR evaluation methods are proofed and known to be linear, therefore FTIR-3 was checked and adjusted with a calibration gas cylinder of 21 ppm with ±10% analytical uncertainty form Air Liquide (Paris, France) at one calibration point. The formaldehyde compound is a reactive gas, and the reference gas cylinder is available with a best measurement uncertainty of only ±10% from the gas suppliers.
The relative high calibration stability of the FTIR technique was used to validate and reject unstable HCHO gas cylinder standards in comparison with existing reference library spectra. A pure fresh formaldehyde solution (wt. 37%) and a syringe pump vaporizer were used to generate and calibrate higher concentration standard spectra between 50–500 ppm in a nitrogen gas flow.
For the QCL-IR, a gas cylinder of 100 ppm HCHO from Air Liquide and manufactured by Airgas (Radnor, PA, USA) was used to generate the calibration curve. With formaldehyde being an unstable gas, to increase the stability, AirLiquide provide cylinders which undergo a special treatment on the inside. Additionally, the absorption spectrum of the cylinder is measured periodically by HORIBA to confirm the gas stability.
The FTIR-1 and the QCL-IR were used for test performed with the DV and the GV, while the tests with the HDV were carried out with the FTIR-2, FTIR-3 and QCL-IR. The instruments were zeroed daily, however, no further day-to-day calibration was conducted during the experimental campaigns. This was due to the difficulties to obtain stable calibration gas cylinders. Although studies indicate that HCHO gas mixtures in cylinders showed stability, a threshold of <1% for 1 year [
17], it was not possible to obtain a calibration gas with at least 50 ppm of HCHO by the time the campaign was performed.
Emission rates (g/s) were calculated following the RDE regulation, hence, the data were not filtered. In the case that the final emission was negative it was reported as zero.
For compounds such as HCHO it is common to see that a dedicated threshold is applied to the concentration reading to eliminate the contribution of the background noise to the emissions. In the case of the instruments used in the present study, these thresholds, which correspond to 3× standard deviation of the concentrations measured during those tests where HCHO was not present in the exhaust (e.g., hot tests), were QCL-IR: 0.2 ppm; FTIR-1: 1.8 ppm; FTIR-2: 0.6 ppm and FTIR-3: 0.3 ppm. In order to evaluate the differences resulting from this different data-processing approach, the calculations were also performed using this approach.
Giving the good correlation obtained between the different instruments, and since the QCL-IR was the only instrument present in all the tests performed, the emissions presented in the next section are those obtained using this instrument. The HCHO masses used in the discussion were obtained using the concentration as measured, i.e., without applying the described threshold just mentioned.
3. Results and Discussion
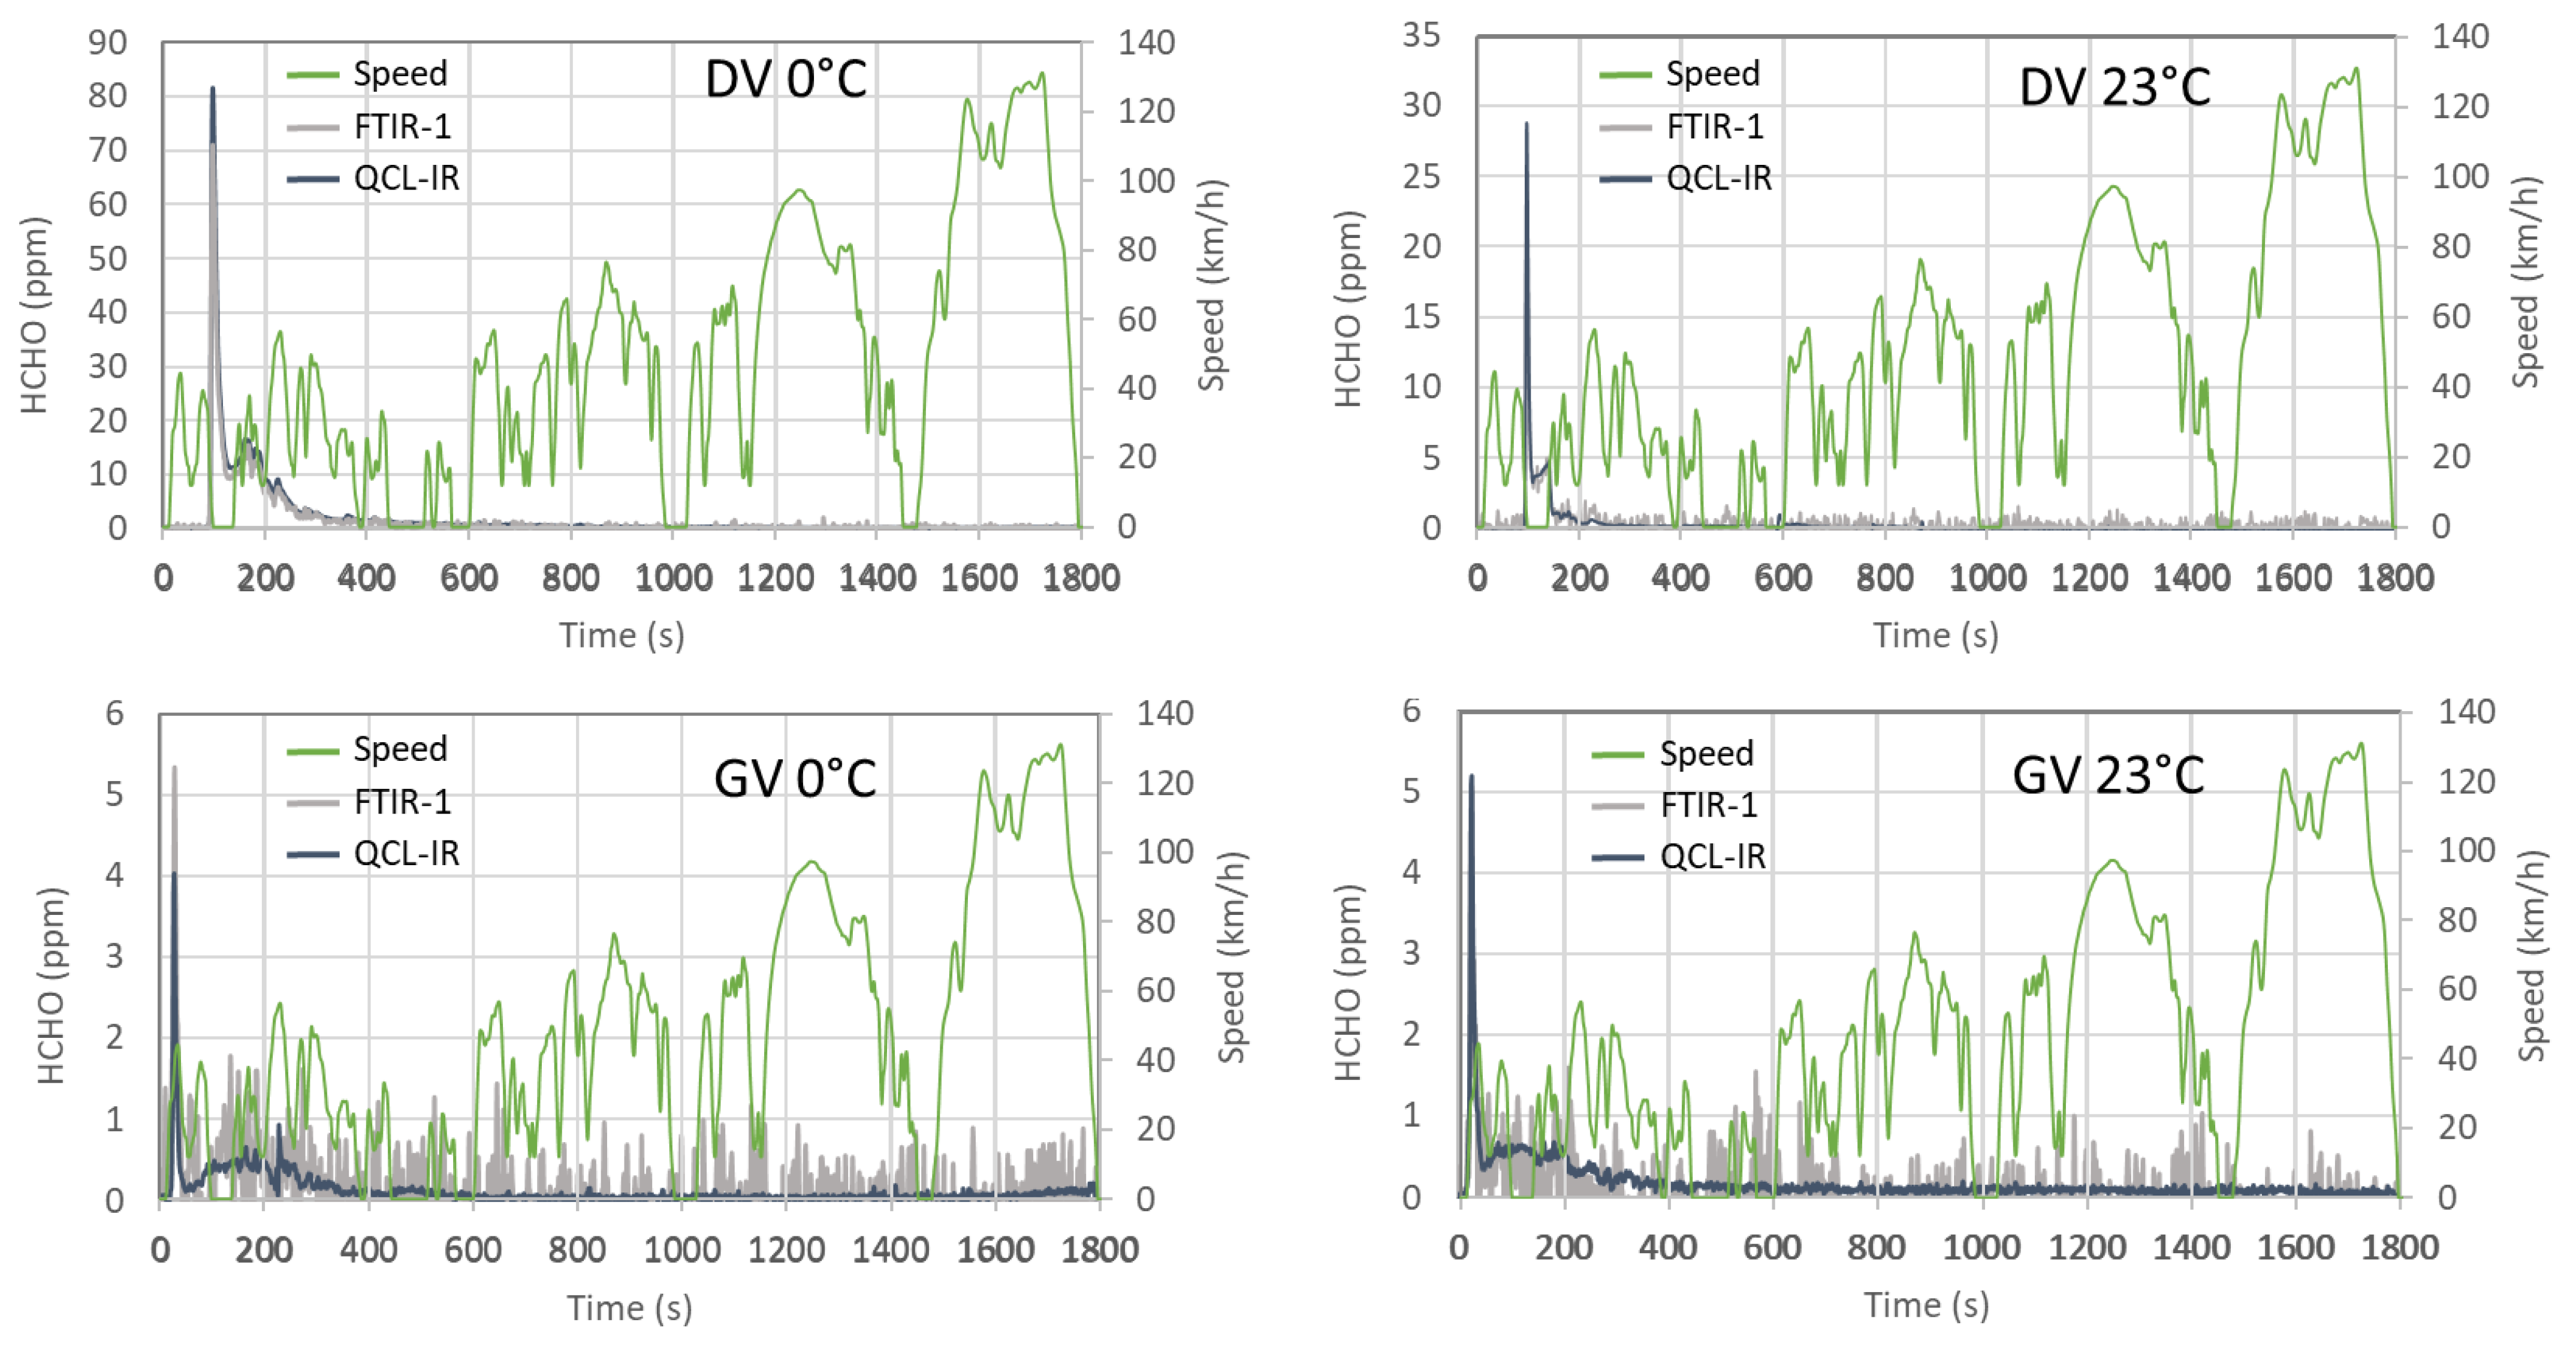
Figure 2 shows the HCHO emission profiles of the DV and GV during the WLTC at 23 and 0 °C measured with the FTIR-1 and the QCL-IR. It illustrates that the initial HCHO peak reaches ~25 ppm and ~80 ppm for the DV at 23 and 0 °C, respectively, and ~5 ppm for the GV at both temperatures.
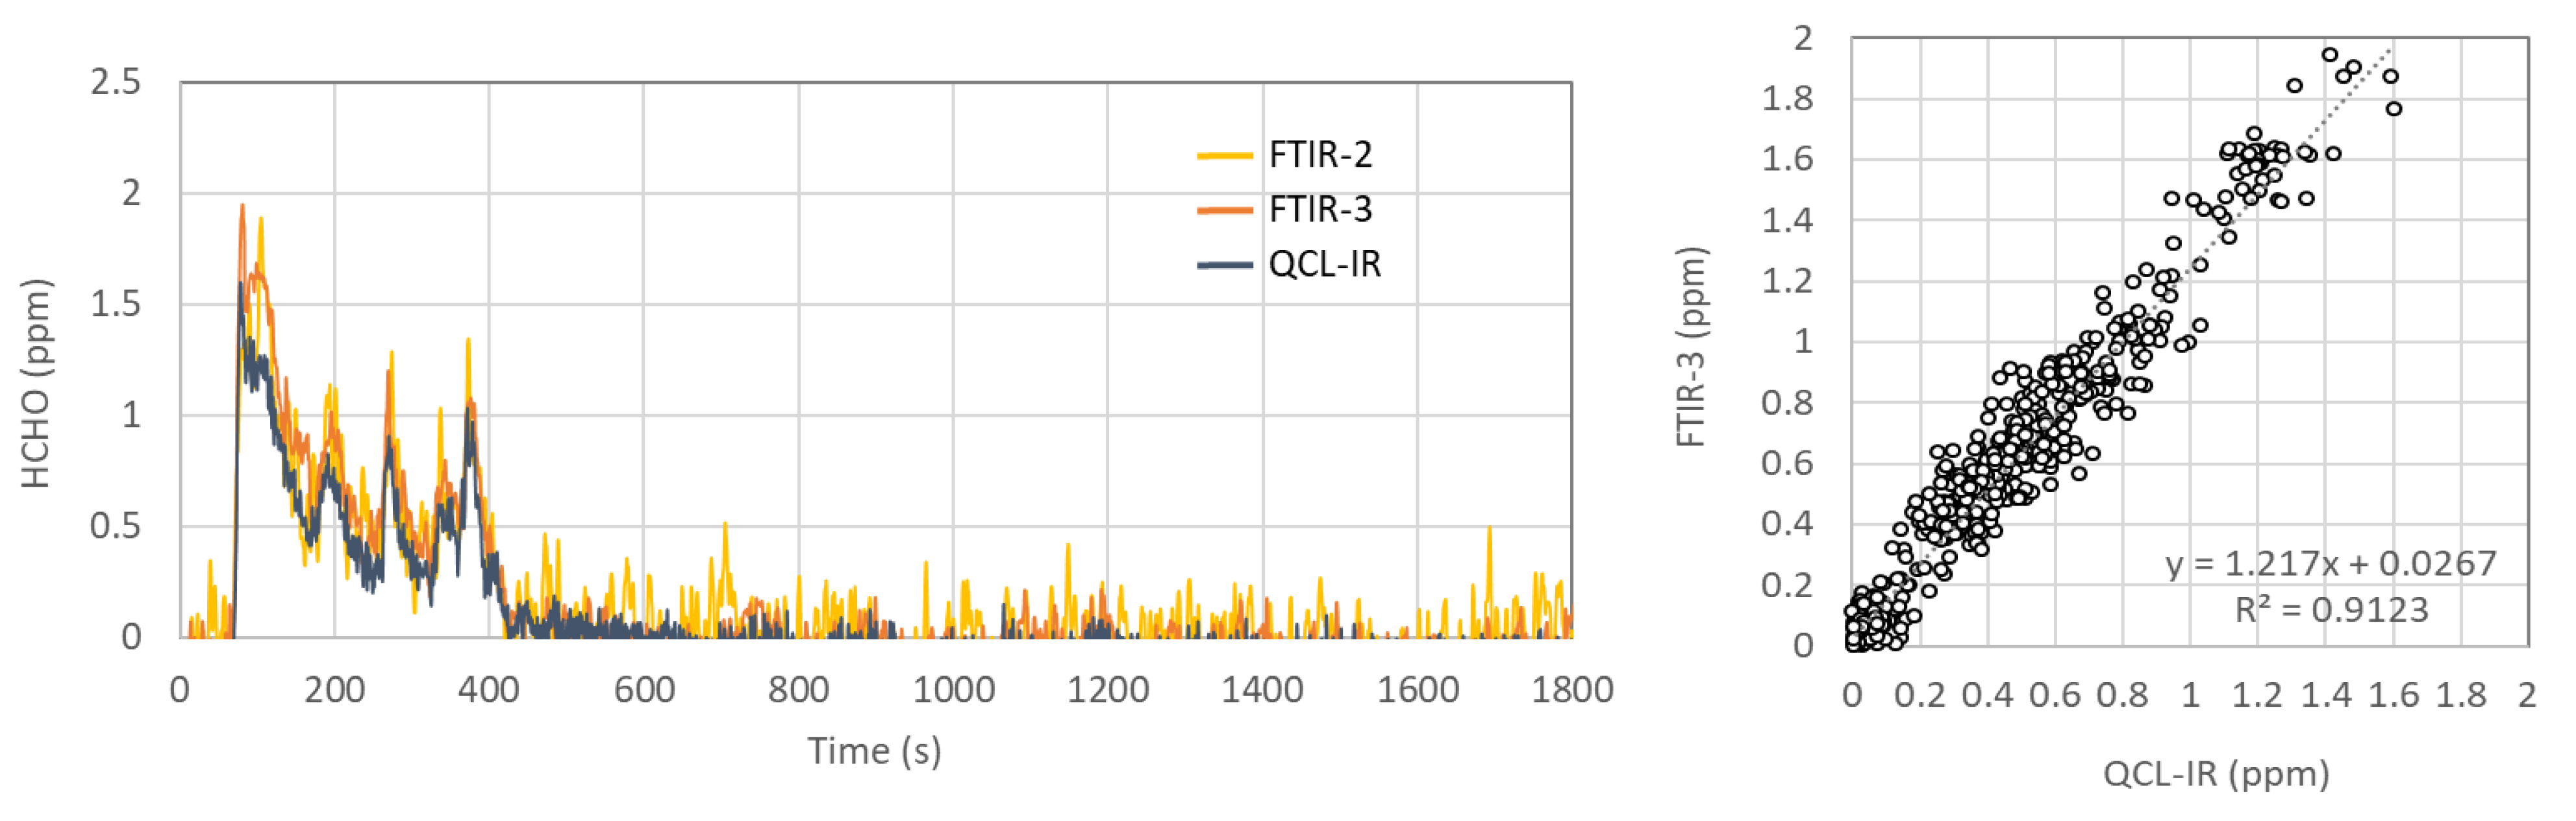
Figure 3, on the other hand, shows the good correlation (R
2 > 0.9) of the HCHO concentrations measured by the QCL-IR and the FTIR-1 from the GV and the DV during the WLTC tests. The concentrations measured presented an ~8% difference (based on the slope).
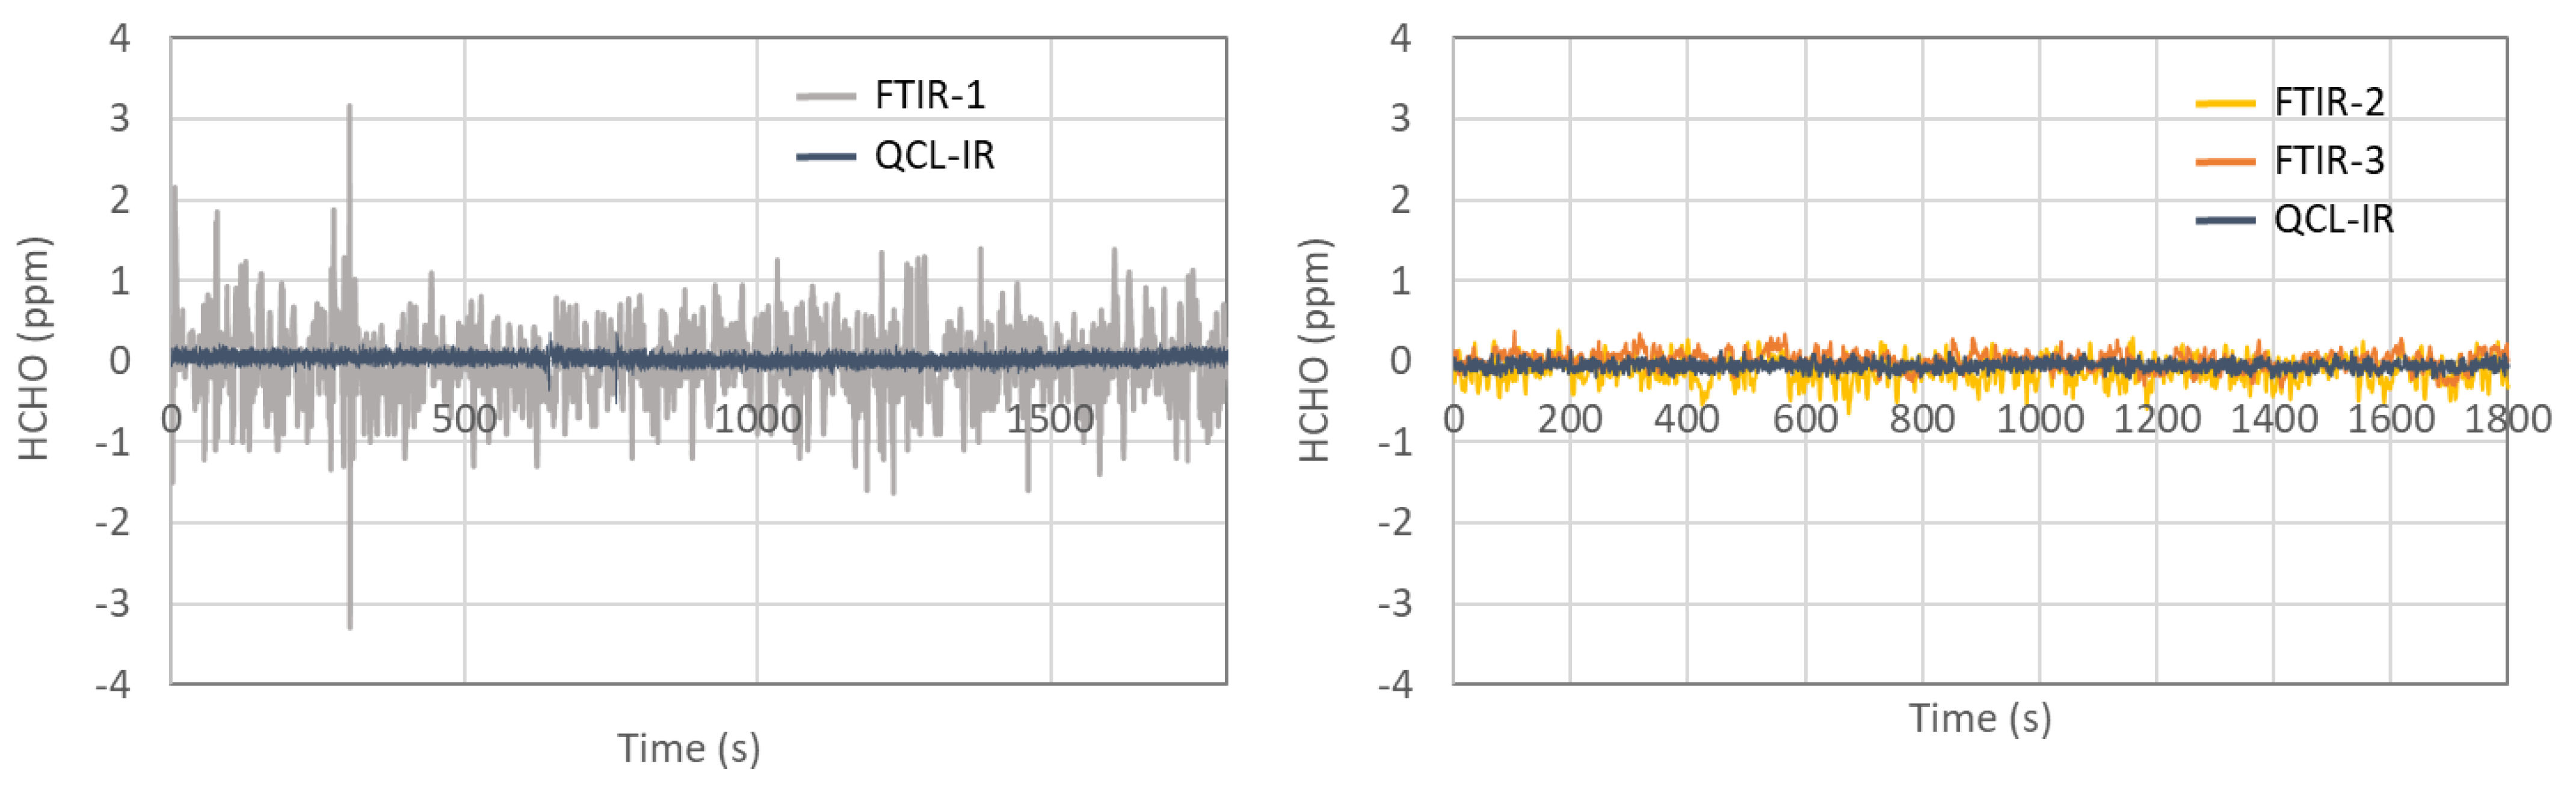
Although the instruments presented a very good correlation, it is clear from
Figure 2, and also for the hot tests shown in
Figure 4, that the FTIR-1 presented a noisier signal (approx. ±1.2 ppm) of the instruments used. This made it impossible to distinguish between the FTIR-1 noise and the GV’s HCHO emissions reported by the QCL-IR at around time ~50–200 s, right after the catalyst light-off. The noisier emission profile can be related to a combination of reasons, including but not limited to the older FTIR instrument dated from 2007 with not up-to-date electronics and components compared to the current FTIR spectrometer version to achieve low HCHO detection limits.
Emissions of HCHO are linked to oxidation processes of unburned fuel on exhaust after-treatment systems, TWC for gasoline vehicles and mainly the Diesel oxidation catalyst (DOC) for Diesel vehicles. The extent of HCHO emissions will depend on the after-treatment efficiency and light-off time.
Figure 2 shows that, for the DV, colder ambient temperature leads to higher emissions and for a longer period of time. Higher emissions of unburned HC at sub-zero temperatures have been widely reported for both gasoline and Diesel vehicles [
18,
19,
20,
21]. The reason for these higher emissions may be worse combustion and less efficiency with longer light-off times of the after-treatment systems.
In addition to being very low (max peak ~5 ppm), the HCHO measured from the GV presented some interesting features. The emissions did not increase when decreasing the ambient temperature, which is a pattern commonly observed for gasoline vehicles equipped with TWC [
22,
23]. This may be linked to the pristine (not degreened) TWC mounted on the GV that ensured a higher oxidation efficiency of the unburned fuel gases. Additionally, an interesting observation was the continuous presence of HCHO following the cold-start peak and right after the catalyst light-off, between ~50–200 s, while for all other hydrocarbons, these emissions are expected to be absent after the TWC light-off. The HCHO was only noticed between ~50–200 s thanks to the low noise presented by the QCL-IR.
The DV emitted 5 mg of HCHO over the entire WLTC at 23 °C. However, the emissions increased to 56 mg when tested at 0 °C, 46 mg of which was released in the first 400 s. As illustrated in the example provided in
Figure 4, for the DG and the HDV, no HCHO emissions were measured during hot operation. The figure also shows the different profiles recorded with the QCL-IR and the FTIR-1 when measuring Diesel exhaust. The DV’s HCHO emissions were at least one order of magnitude lower than those reported for a series of 2012–2015 light-duty Diesel vehicles tested over the Federal Test Procedure (FTP) using different fuel blends [
24]. Nonetheless, the emissions were comparable with those reported for Euro 6 Diesel vehicles [
25,
26].
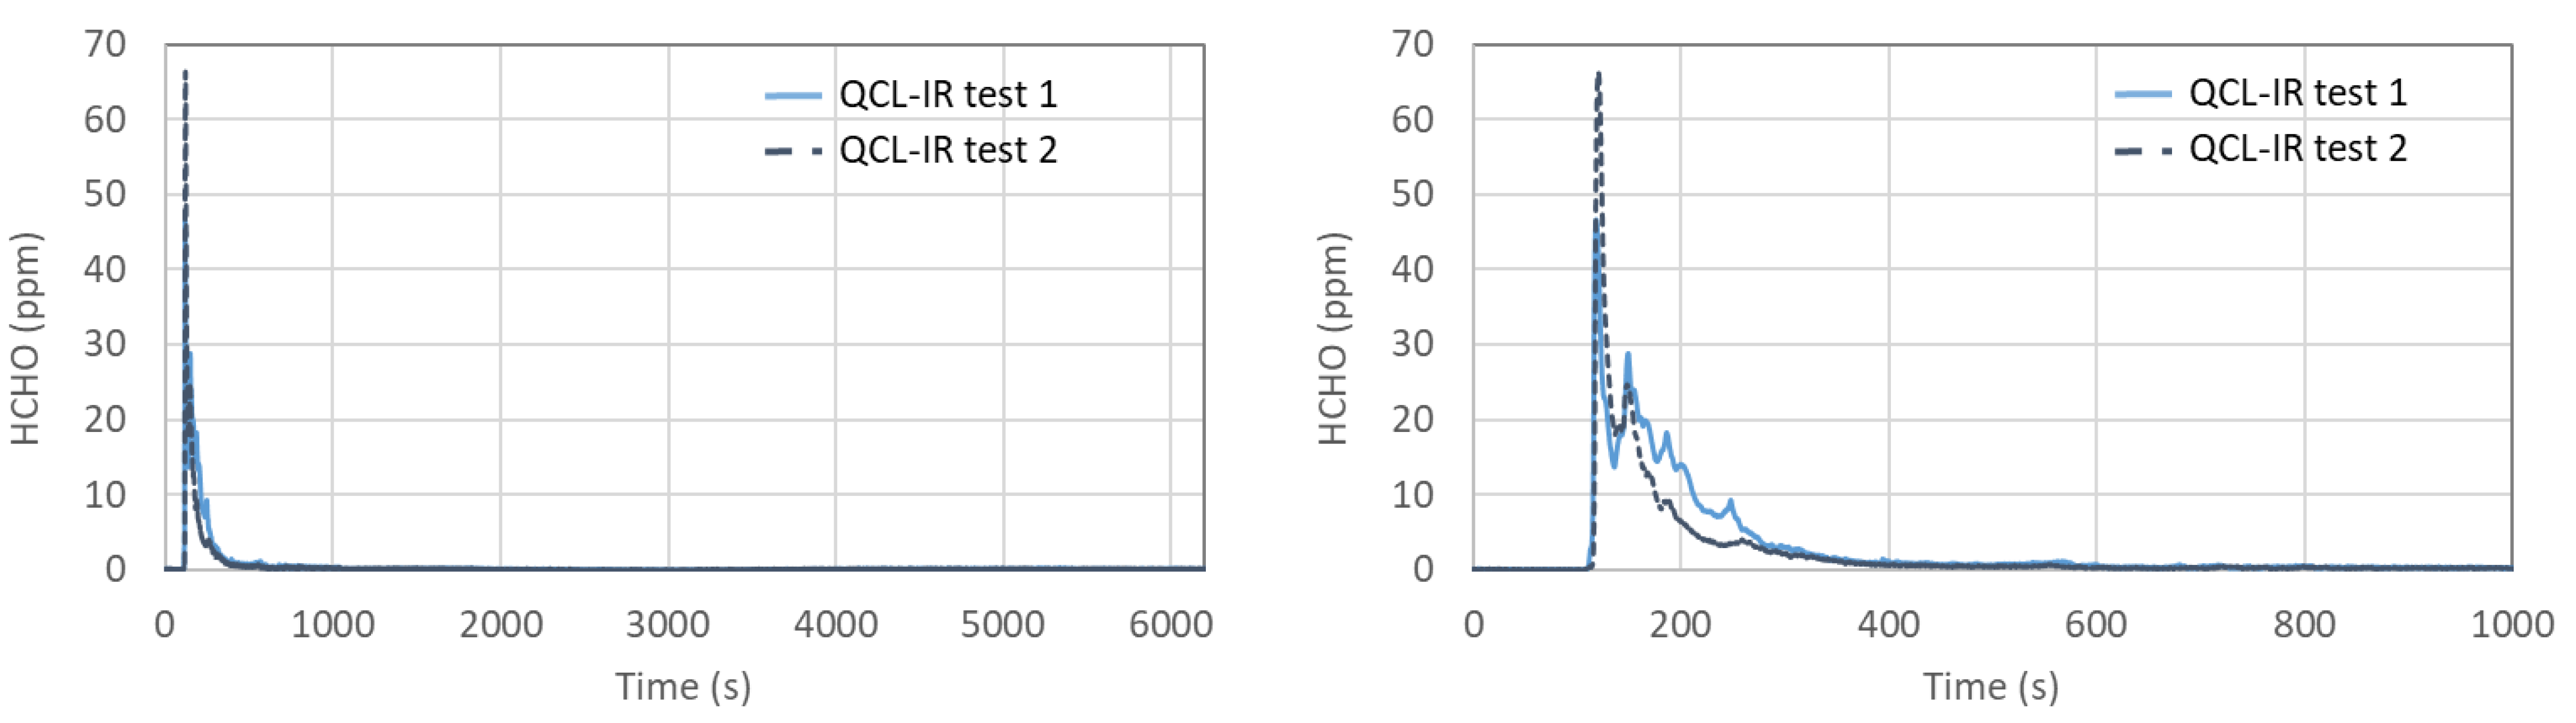
During the real-world on-road tests performed, DV presented a similar emission profile (see
Figure 5) as the one measured during the laboratory testing at 0 °C. The instrument did not show drift during the entire length of the tests, and the two on-road tests performed showed consistent and comparable HCHO emissions. All this suggests that, if scaled down to an appropriate dimension and weight, the instrument could also be used for on-road applications with light-duty vehicles.
The on-road tests were performed at an ambient temperature of ~11 °C. As expected, the maximum concentrations of HCHO (~68 ppm) fall within those obtained during the tests performed in the laboratory at 0°C and at 23 °C. The vehicle emitted 50 mg over the ~100 min of the on-road test (89 km), most of which (37 mg, i.e., 74% of the total) was emitted in the first 400 s (~2.5 km).
The HCHO concentrations measured from the HDV during the WHVC at 5 °C and 23 °C were lower than those measured from the DV. As indicated in
Section 2, during the tests performed with the HDV, the emissions of HCHO were measured with two FTIR systems (FTIR-2 and FTIR-3) and the QCL-IR. As shown in
Figure 6 by the emission profile illustrated and the example of the correlation plot, there is good agreement between the FTIR-2, the FTIR-3 and the QCL-IR, even at these very low concentrations. Although a ~20% average deviation from linearity was obtained when comparing the HCHO concentrations from the FTIR-3 and the QCL-IR, the absolute difference is lower than 0.5 ppm. Comparing the concentrations measured by FTIR-3 and the QCL-IR, we obtained an R
2 > 0.9 R
2 > 0.8, achieved when the FTIR-3 and the QCL-IR were individually compared to the FTIR-2. A comparable agreement was obtained in the RWT, in which similar emission concentrations were recorded.
Overall, HCHO from the HDV was relatively low, in agreement with a previous study on a heavy-duty Diesel Euro VII demonstrator [
27] and ~50% lower than a 2010 Diesel engine only equipped with DOC/DPF as after-treatment [
28]. Nonetheless, although the concentrations measured from the HDV at 23 °C were lower than those measured from the DV at the same ambient temperature, the total mass of HCHO emitted by the HDV during the first 400 s (17 mg) was higher than the one of its light commercial counterpart (2 mg), due to the higher exhaust flow of the HDV and its longer emitting period (about 400 s for the HDV and less than 100 s for DV). As the ambient temperature decreased to 5 °C, the emissions of the HDV during the first 450 s increased to 25 mg. As shown in
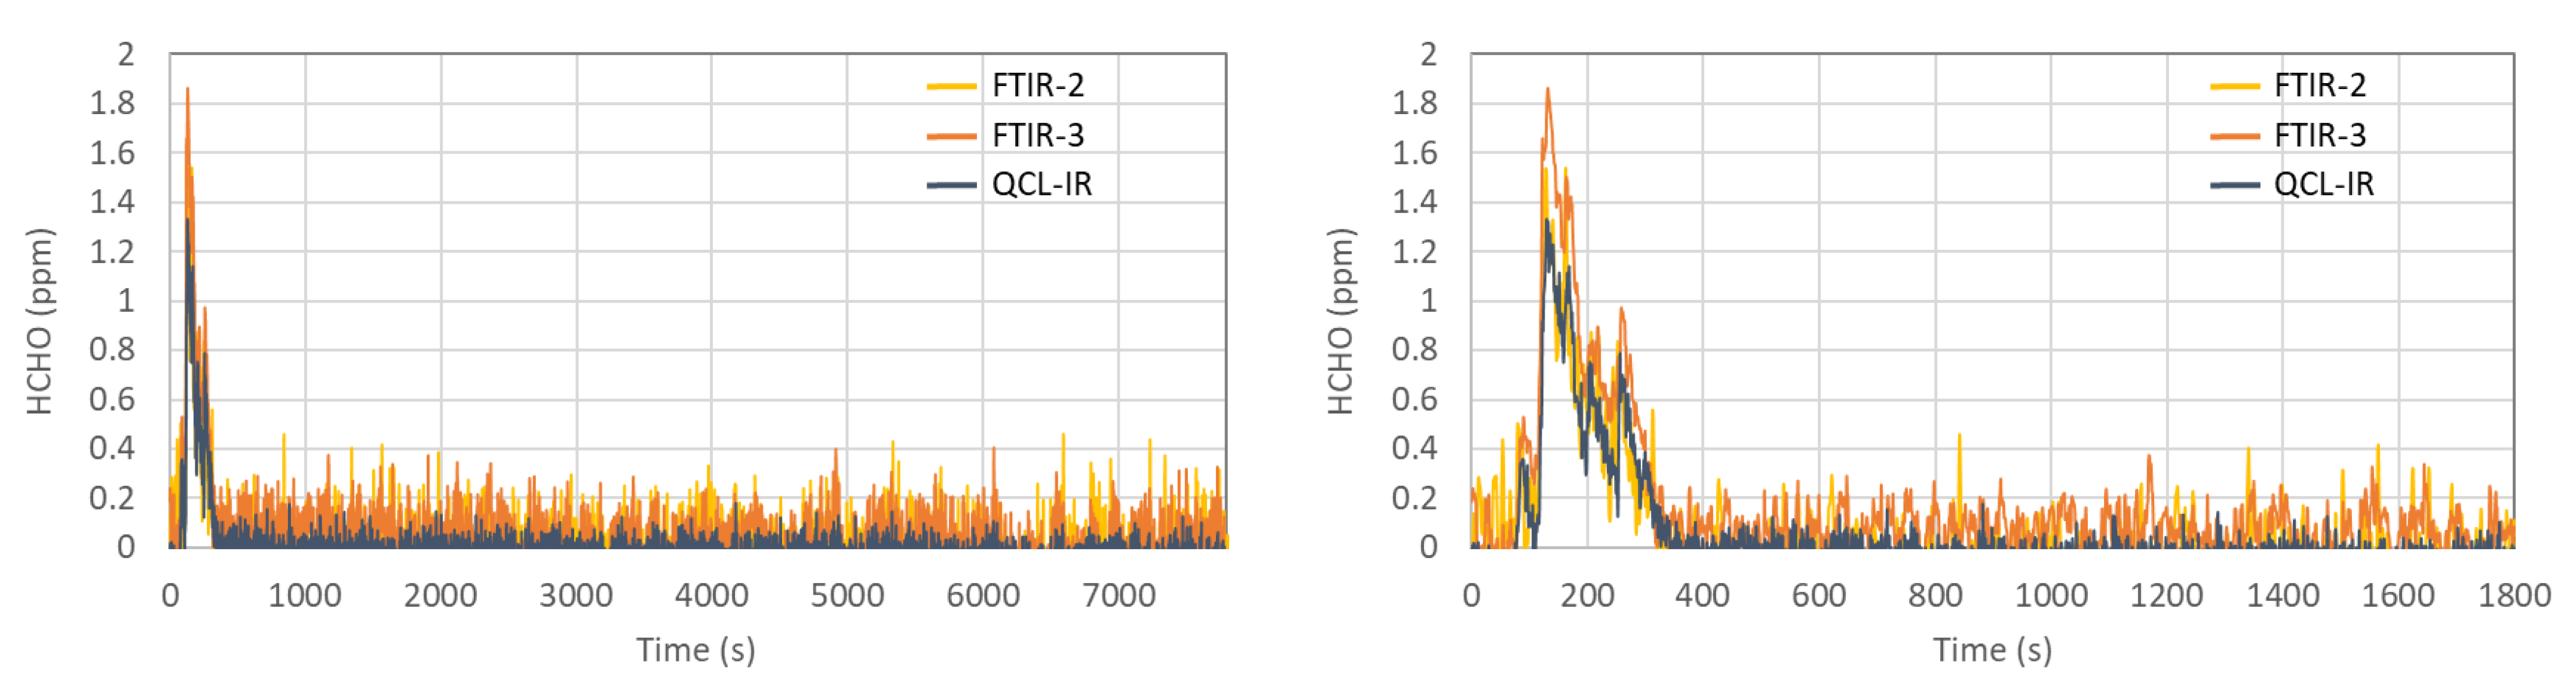
Figure 7, most of the HCHO measured during the RWT test performed at 5 °C also took place within the first 400 s, reaching 20 mg. Interestingly, in this case the emissions of the HDV were lower than those measured from the DV during the on-road test, even if the latter started at a higher ambient temperature. During hot-start tests, no HCHO emissions were measured.
The three instruments presented a similar agreement during the RWT (
Figure 7), and as for the QCL-IR during the RDE test, none of them showed drift issues during this long test. In line with what was observed during the RDE tests performed with the DV using the QCL-IR, this suggests that similar systems could be used on heavy-duty vehicles during analogous tests performed on the road without losing accuracy.
The RDE test procedure [
14], which includes tailpipe measurement of pollutants, prescribes all concentrations measured (including those with a negative sign) to be used during the calculation of the emission factors. In the case that the obtained value is negative, the emission factor is considered to be zero. In cases such as the HCHO, and as displayed in
Table 2, the noise of the measurement could artificially impact the final emitted mass even for small values such as the one of the QCL-IR (0.2 ppm) if it is systematically positive or negative. If the noise is systematically positive, it would add mass to the final result (e.g., DV HOT QCL-IR 2 mg instead of 0 mg applying the threshold). Likewise, if it is systematically negative, it would subtract mass from the final result (e.g., all HDV tests when comparing total mass and the mass obtained during the first 400 s, which are shown in brackets in
Table 2). On the other hand, calculating the mass emitted using a threshold value on the concentration would only consider actual emission peaks. However, it would require the threshold value to be obtained for each individual instrument and often over time, as this could change due to source aging, for instance. Moreover, if the applied threshold is a large value, it could result in the underestimation of the final emissions.
Overall, the differences in the emission factors (units: mg/km or mg/kWh) obtained across the four instruments used for all the tests performed were small, within 1 mg/km (or mg/kWh).
4. Conclusions
Real-time HCHO emissions were measured using three Fourier Transform InfraRed spectrometers (FTIRs) and one Quantum Cascade Laser InfraRed spectrometer (QCL-IR) from the exhaust of three vehicles, one gasoline passenger car (GV), one Diesel light-duty commercial vehicle (DV) and one Diesel heavy-duty vehicle (HDV), all three meeting the latest European emission standards (i.e., Euro 6d and Euro VI-E).
While emissions from the GV were low under all the studied conditions, non-negligible emissions of HCHO were measured from the DV and HDV, mainly occurring in the first 400 s of operation. The DV and HDV yielded higher emissions when tested at colder temperatures than 23 °C.
The concentrations of HCHO measured with the four instruments resulted in a good correlation, in most cases with R2 > 0.9. The concentrations measured presented ~8% deviation for the measurements carried out with the FTIR-1 and the QCL-IR on the DV and the GV. In the case of the HDV, where the measurements were performed with the FTIR-2, the FTIR-3 and the QCL-IR, the difference was 20% but in a 1–2 ppm range.
Both technologies, FTIR and QCL-IR, showed the capability to accurately measure HCHO real-time emissions during real-world-like tests performed with heavy-duty vehicles in the laboratory. Moreover, it was also shown that the QCL-IR can be used to measure HCHO during on-road testing of light commercial vehicles that can accommodate this laboratory-grade instrument and carry its weight. In order to be used in passenger cars, the instrument would need to be downscaled and equipped with a dedicated power supply. Such instruments would also need to be tested for vibrations and could need better thermal protection for the wide ambient temperatures that can be encountered.


 ,
, 


