Abstract
Green energy sources are implemented for the generation of power due to their substantial advantages. Wind generation is the best among renewable options for power generation. Generally, the wind system is directly connected with the power network for supplying power. In direct connection, there is an issue of managing power quality (PQ) concerns such as voltage sag, swells, flickers, harmonics, etc. In order to enhance the PQ in a power network with a wind energy conversion system (WECS), peripheral compensation is needed. In this paper, we highlight a novel control technique to improve the PQ in WECS by adopting an Artificial Neural Network (ANN)-based Distribution Static Compensator (DSTATCOM). In our proposed approach, an online learning-based ANN Back Propagation (BP) model is used to generate the gate pulses of the DSTATCOM, which mitigate the harmonics at the grid side. It is modelled using the MATLAB platform and the total harmonic distortion (THD) of the system is compared with and without DSTATCOM. The harmonics at the source side decreased to less than 5% and are within the IEEE limits. The results obtained reveal that the proposed online learning-based ANN-BP is superior in nature.
1. Introduction
In recent years, the power generated from wind has been utilized to operate ships, mix grain, and pump water. There is proof that wind power drove small ships along the Nile River around 5000 BC. Many centuries ago, small windmills were installed in China to collect/store water [1].
One of the highlighted benefits of wind energy is its internal potential to help rural people and enhance their economy. Additionally, contrasting all other sources of power, wind does not require water to generate power. Therefore, the progress of wind power in our country is exponential as energy safety and self-guarding are recognized as the main factors [2]. The main benefit with wind power is that the fuel is cost independent; additionally, wind generation does not release CO2. (Numerical Data Source: CEA, NIWE, MNRE). With the generation of 39,248 MW (March 2021) of wind power, renewable power presently accounts for 24.7% of India’s total available power of 382,151 MW. Wind power accounts for the majority of RE production (94,434 MW), at 41.5%, and is treated as the chief provider of eco-friendly energy [3].
The heating of the Earth by the sun will continually create wind as temperature deviations drive air flow. The wind blows as the rate of the heating of the Earth varies; therefore, as the rate of the vaporization of air varies from one area to the another, a pressure difference will be created as shown Figure 1, which causes the wind to flow from one area to another [4].
Figure 1.
Wind energy at the coastal area.
Winds occur because of the irregular heating of the Earth’s layer by the Sun. Wind power density is a helpful parameter in assessing the wind resource availability at a possible site. The wind power density, calculated in watts per square meter, reflects the amount of energy existing at the site for power generation by a wind turbine. Varieties of wind power density for two reference wind dimension heights are shown in the Table 1. The wind power density is related to the wind speed raised to the 3rd power. For power generation, class 4 or above is generally considered [5,6,7].
Table 1.
Classes of wind power density.
In addition, the increasing use of sensitive devices and different industrial loads related with various power patterns that are integrated in the grid produces harmonic effluence at the grid side of an ac supply. The harmonics and reactive currents created by sensitive loads move the grid towards a low power factor, decreased energy efficiency, poor power managing capacity and produce vulnerable disturbances in the devices linked at the distribution side.
Custom power devices (CPDs) play a key role in the mitigation of PQ concerns. Of the available solutions to PQ concerns, the Distributed Static Compensator (DSTATCOM) is a better option in reducing power factor and harmonics. It acts as a filter, voltage controller at the distribution side and also as a load balancer.
Artificial neural network (ANN)-based DSTATCOM controllers enhance the quality of power in a much better way when compared to proportional-integral (PI) controllers. A novel approach has been presented in this paper to control the DSTATCOM using an ANN-BP algorithm.
2. Modelling of the Wind Energy Conversion System
The wind energy conversion system (WECS) is made up of the following parts: a wind turbine, maximum power point tracking (MPPT) controller (speed controller), permanent magnet synchronous generator (PMSG), alternating current to direct current (AC-DC) converter, DC-DC system, and a DC-AC Grid connected converter. The block diagram is divided into three modules, namely the aerodynamic, mechanical and electrical modules, as shown in Figure 2.
Figure 2.
Major components of Wind system.
The electrical module of WECS can be partitioned into three major machineries, which are PMSGs, power converters and the grid, as sown in Figure 3. Using MPPT methods such as Tip-Speed Ratio, the maximum power can be extracted from the variable speed wind and this is converted to AC power using PMSG, which itself is converted back to DC-DC so that it can be stored in batteries; if connected to the grid, the DC needs to be converted back to AC using an inverter [8,9,10].
Figure 3.
Electrical components of WECS.
The information of both wind velocities and its direction was obtained with an anemometer(s) and stored on integrated chips of a mini computer, a data logger, which operates for a long period of time using a battery. The logger should be checked regularly to obtain the chips and new chips should be used for the next season’s data. Wind velocities are generally obtained as 10 min averages to ensure the intervals are suitable for popular basic software tools [11,12,13].
In general, the mechanical power output of a wind turbine, Pm, is given as:
Here, Cp is the aerodynamic power coefficient, which represents the turbine’s competence. The peak value of Cp is 16/27 = 0.593. This peak value of 16/27 was first obtained by Betz and is usually recognized as the saturation point for wind turbine operation.
Usually, the generator does not start producing electricity until the existing power in the wind reaches the power required to fulfil the losses related to the windage and friction available in the considered system. As the wind turbine speed increases, the generator’s output power increases until the generator produces its rated power output.
Wind turbines were considered as similar to the classical induction motor, as shown in Figure 4, which we modelled using the following equations [14,15]:
where 𝑃in and 𝑇in reflect the power and torque of the turbine at the supply, respectively; 𝐶p is the power coefficient of the turbine (=0.593 is max); 𝐽r is the turbine’s moment of inertia; 𝜔r is the turbine’s speed; A is the area covered by the turbine’s rotor; λ represents the tip speed ratio (TSR); and β reflects the pitch angle, which is anticipated to be a null value as the turbine is developed at a lower wind speed. The signals at the input of the system are the wind speed, inertia of rotor, and synchronous machine speed. The outcome is the turbine’s torque. Wind turbines of variable speed are dominant due to their ability to extract high voltages from the wind. This can be attained using MPPT methods such as TSR with a PI regulator which also enhances efficacy.
Figure 4.
Wind turbine Emulator.
TSR-PI MPPT is an approach in which turbine and wind speeds are continuously observed by instruments and are measured via real parameters [16]. This method means the module can function continuously at the optimum reading of TSR at variable wind velocities. When TSR is optimal, tracking of the peak value of power can be achieved. Due to the state of attaining continuous MPP information, it result in better performance and efficiency.
The prime speed ‘wr’ of the generator is attained using the TSR method and ‘wr*’ is the reference speed is presented in Figure 5. Furthermore, a PI controller is linked to maintain the generator operation at the desired velocity. The outcome of a PI regulator is subtracted from a switching wave when a converter’s duty ratio is obtained. Gate pulses drive the control of the switching devices of the rectifier at a suitable firing angle via a control network. Hence, maximum power is achieved by varying the value of D. The simulation results of WECS are shown in Figure 6.
Figure 5.
TSR based MPPT.
Figure 6.
Simulation results of the WECS.
The AC-DC-AC flow process uses a common synchronous machine as presented in the modelling circuit of WECS. The operation of the turbines varies with changeable velocities; thus, the changeable voltage and variable frequency are the outcomes of the generating machine. To ensure that they are stable, a rectifier can be implemented to vary AC-DC; following this, the DC potential is changed to AC with a fixed frequency and amplitude. This method is advantageous; the control action is efficient because there exists an electronical mechanism rather than hydraulic. By changing the output of the turbine, the rotor velocity is no longer a concern; therefore, an intricate control module is not required. Another advantage of changing the voltage at output is that the DC can be stored in a battery bank for later use when the wind load is not sufficient. The battery bank will be integrated into the DC bus. DC is converted back to AC using DSTATCOM to funnel power to the grid [17,18].
3. Proposed ANN Controller for the VSI of the Grid Interactive Wind DG System
ANNs are widely used in power system monitoring and control [19]. Back propagation is quick, responsive, easy to write code for and simple among the available neural network models. It competently performs tasks layer by layer, unlike a conventional computation algorithm. It calculates the gradient, but it does not reflect how the gradient is applied. It simplifies the computation in the delta rule. It has no variables to tune other than the input data. It is adaptive in nature as it does not require prior information about the system. It is already well known that this technique is superior to other algorithms. In this paper, its advantages have been demonstrated in the form of results which clearly show its efficacy. Figure 6 presents the simulation results of WECS.
The power generated from the wind system needs to be directed to the grid. To achieve this, a shunt-connected to the VSI is needed which will transfer the power to the grid at the PCC. The same shunt-connected VSI can be used for the mitigation of power quality issues of the non-linear loads available at the same grid. This paper discusses a scenario formulated to test the proposed controller, i.e., we investigate the performance of the ANN controller for the voltage control of VSI and also in mitigating the harmonics generated by the non-linear loads [20]. The harmonic reduction and power load for the solar PV system [21] and the wind pressure systematic models [22,23,24] are highlighted by many authors. The ANN neural model is shown in Figure 7. It contains three layers of input, the hidden layer and the output.
Figure 7.
Configuration of the Proposed ANN based Back-propagation algorithm for VSI.
The back-propagation algorithm is used here to generate the reference components of the currents which can be compared with the obtained load currents and can be used to generate the switching pulses of the VSI. The proposed model shown in Figure 7 is explained in detail using the equations below.
The mathematics behind the investigation of the backpropagation approach for obtaining the reference values of the active and reactive power are presented in detail.
The base voltage (VB) at PCC is determined as,
In-phase homogenous waveforms of supply side voltages are obtained with the help of th following equation:
An ANN control scheme predicts the synaptic spikes of real constituent (WAp) and the quadrature component (WAq) of the phase-A load current as explained in (4)–(15). The nonlinear currents of three phase’s loads, i.e., ilA, ilB, ilC are recognized using measuring devices, and the values obtained from all sampling periods are provided to the DSP regulator (as inputs). The initial layer of the ANN-BP approach for determining the reference components is based on Equations (4)–(6).
where Wm is the starting weight. The reference components of currents IlAp of the phase-A load are handled using a sigmoidal based activation-module shown in (7) to (9). Then, they are further utilized to obtain the resultant feed-forward block.
The output ZAp of the initial leg is taken as intake for the next step in the ANN model. The hidden layer produces the output signal, which is presented via Equations (10)–(12).
where Wm1, WAp is the starting spike of the hidden layer. The updated value of the spike of phase A of real components is determined with the help of Equations (13)–(15).
Here, Wp(k) is the middling spike of the real axis component of load currents, WAp(k) is the updated spike of A leg at the k-th time instant. WAp1(k) and ZAp(k) are the amplitudes of the basic spike of the real axis component of currents of the A leg load and result at the k-th instant of the feed-forward module. f’(iAp1) is the differential of iAp1. The learning rate of the developed control approach of the neural network is ‘η’. Similarly, the updated spikes of real axis components of currents of phases B and C associated loads are determined as per Equations (14) and (15).
The predicted values of iAp1, iBp1, iCp1 are found using the sigmoid module, which is considered as an activation set of the ANN network used to determine the fundamental components of real axis currents (WAp1, WBp1, WCp1) at the load as follows:
The average spike of fundamental real axis component (Wp) is attained as follows:
The result of this block is passed through a low pass filter (LPF) and the scaling coefficient (ξ) is multiplied to obtain the final value of the spike of the active axis constituent Wlpt. Similarly, the spikes of the quadrature axis constituents of the currents (Wq, WAq, WBq, WCq) at v are obtained and passed through the LPF. Finally, the scaling constant ‘α’ is multiplied to obtain the final value of the spike of the imaginary axis constituent (Wlqt).
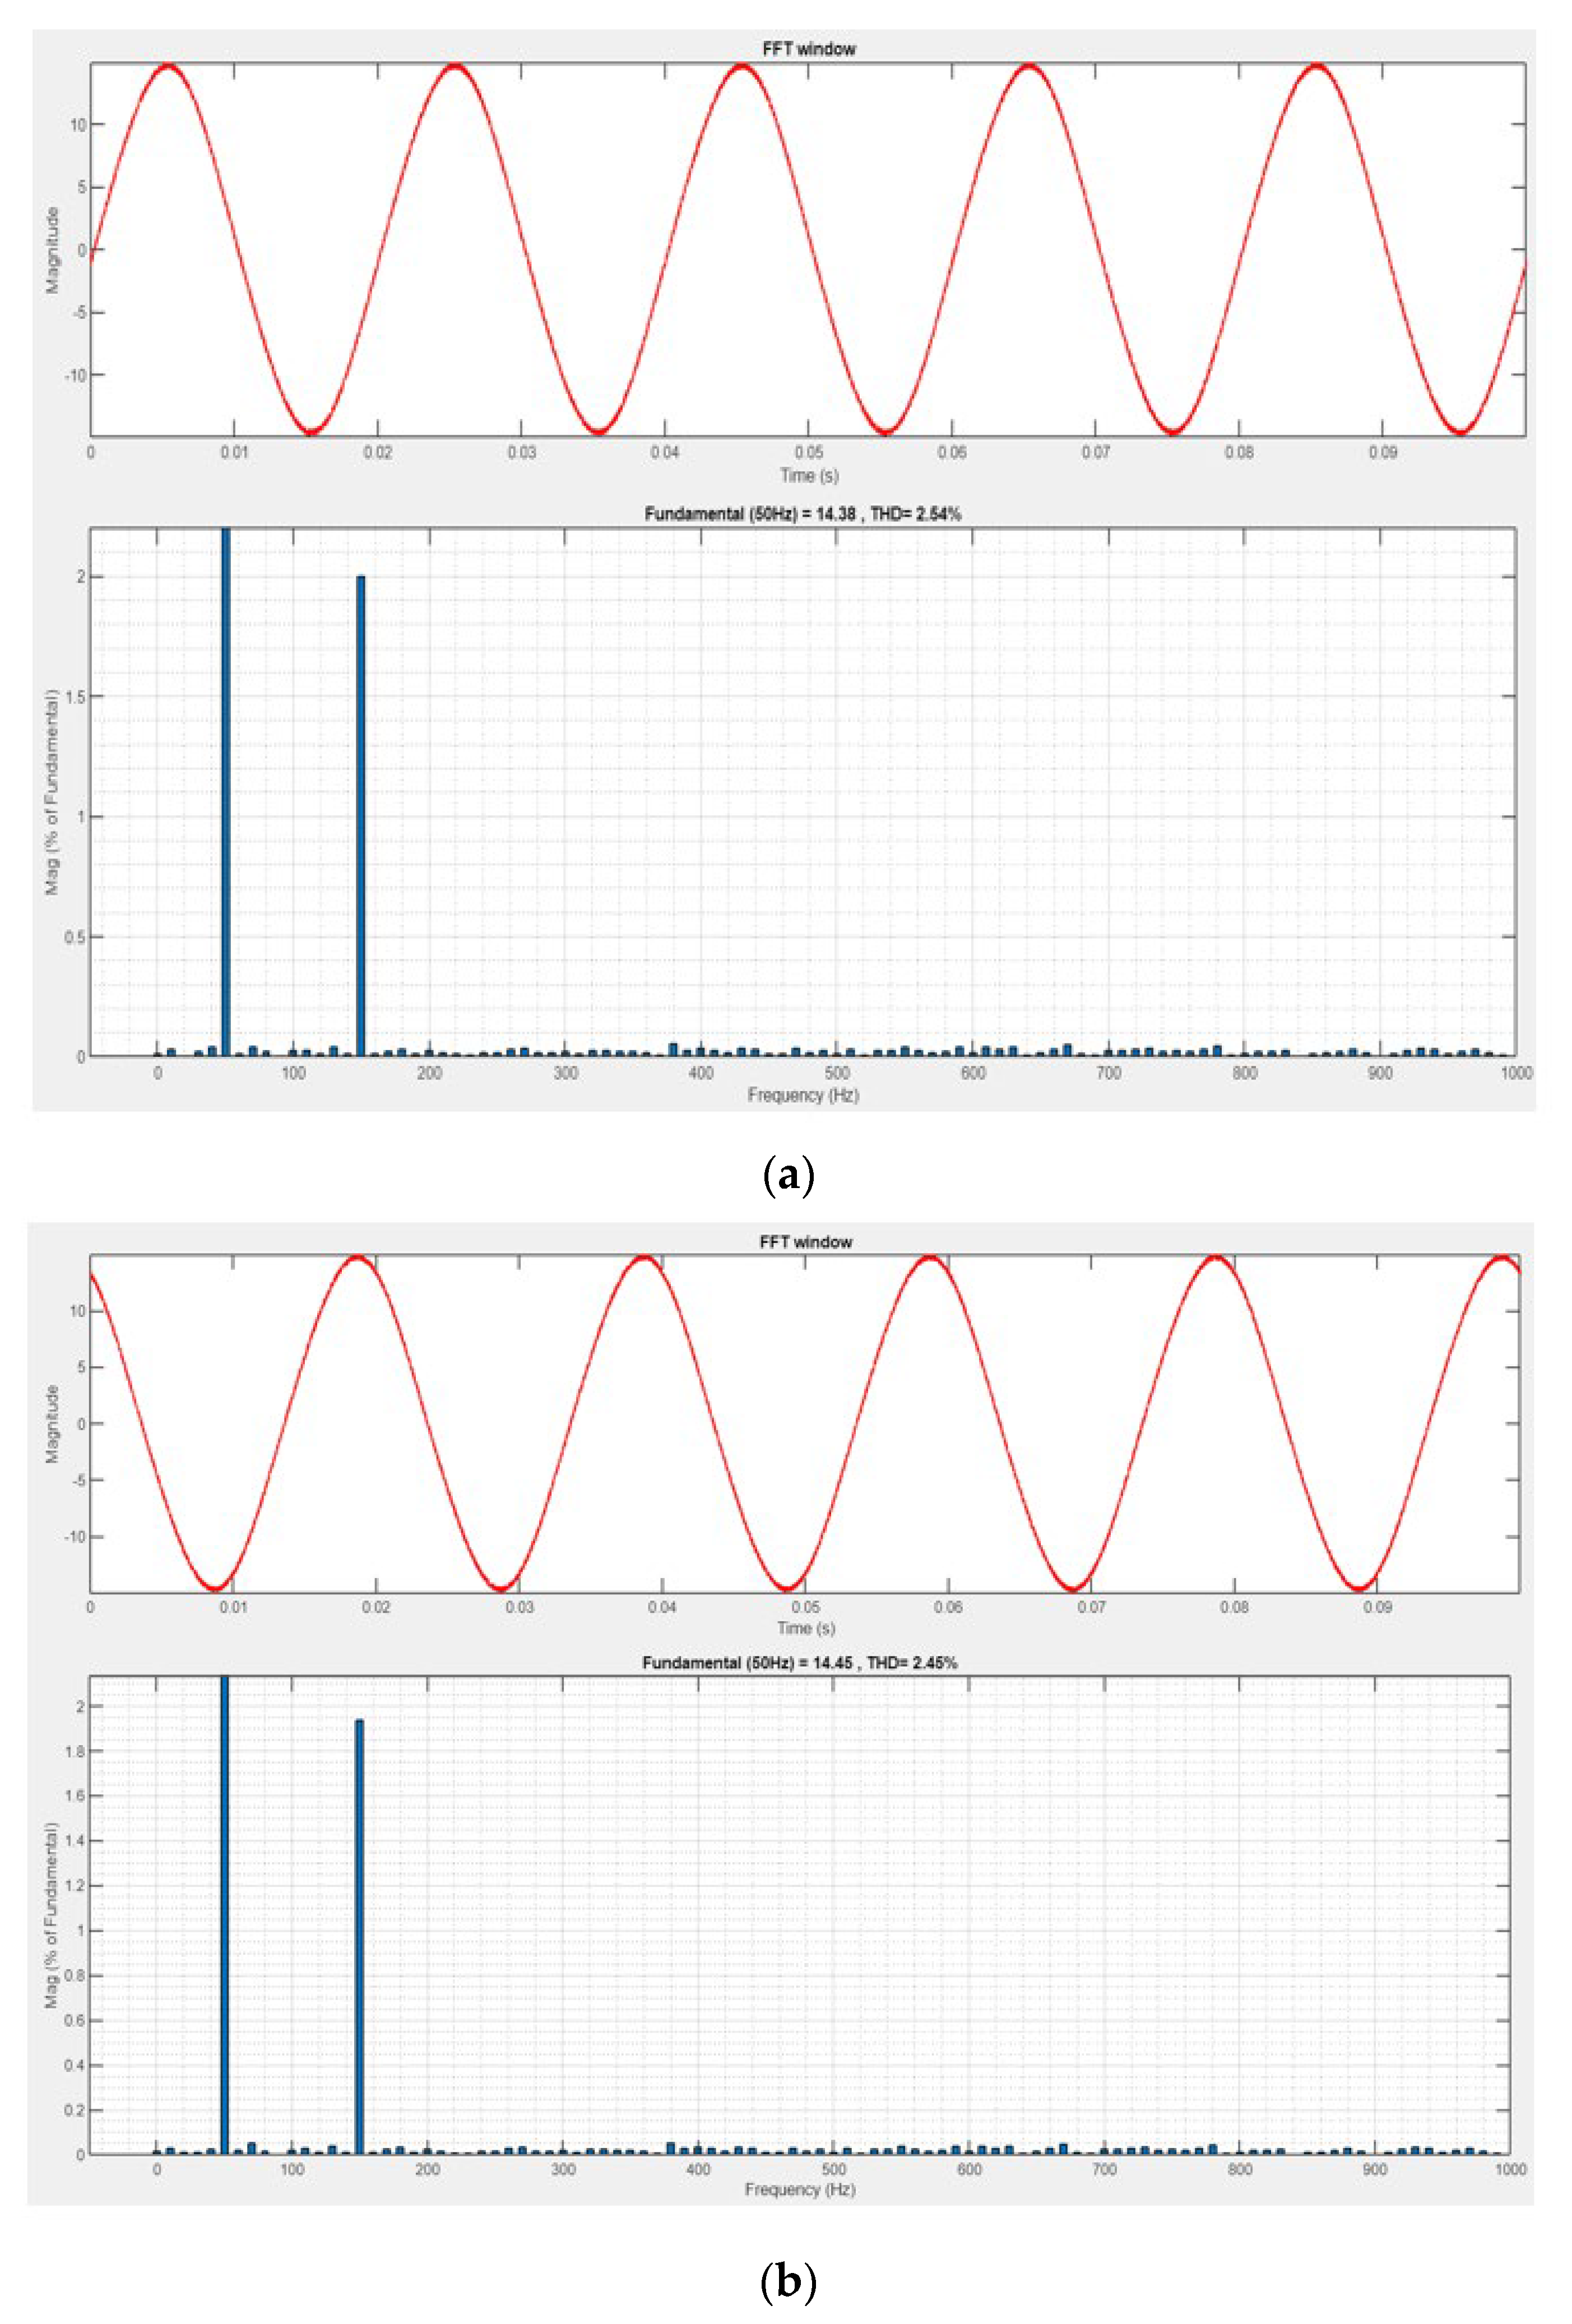
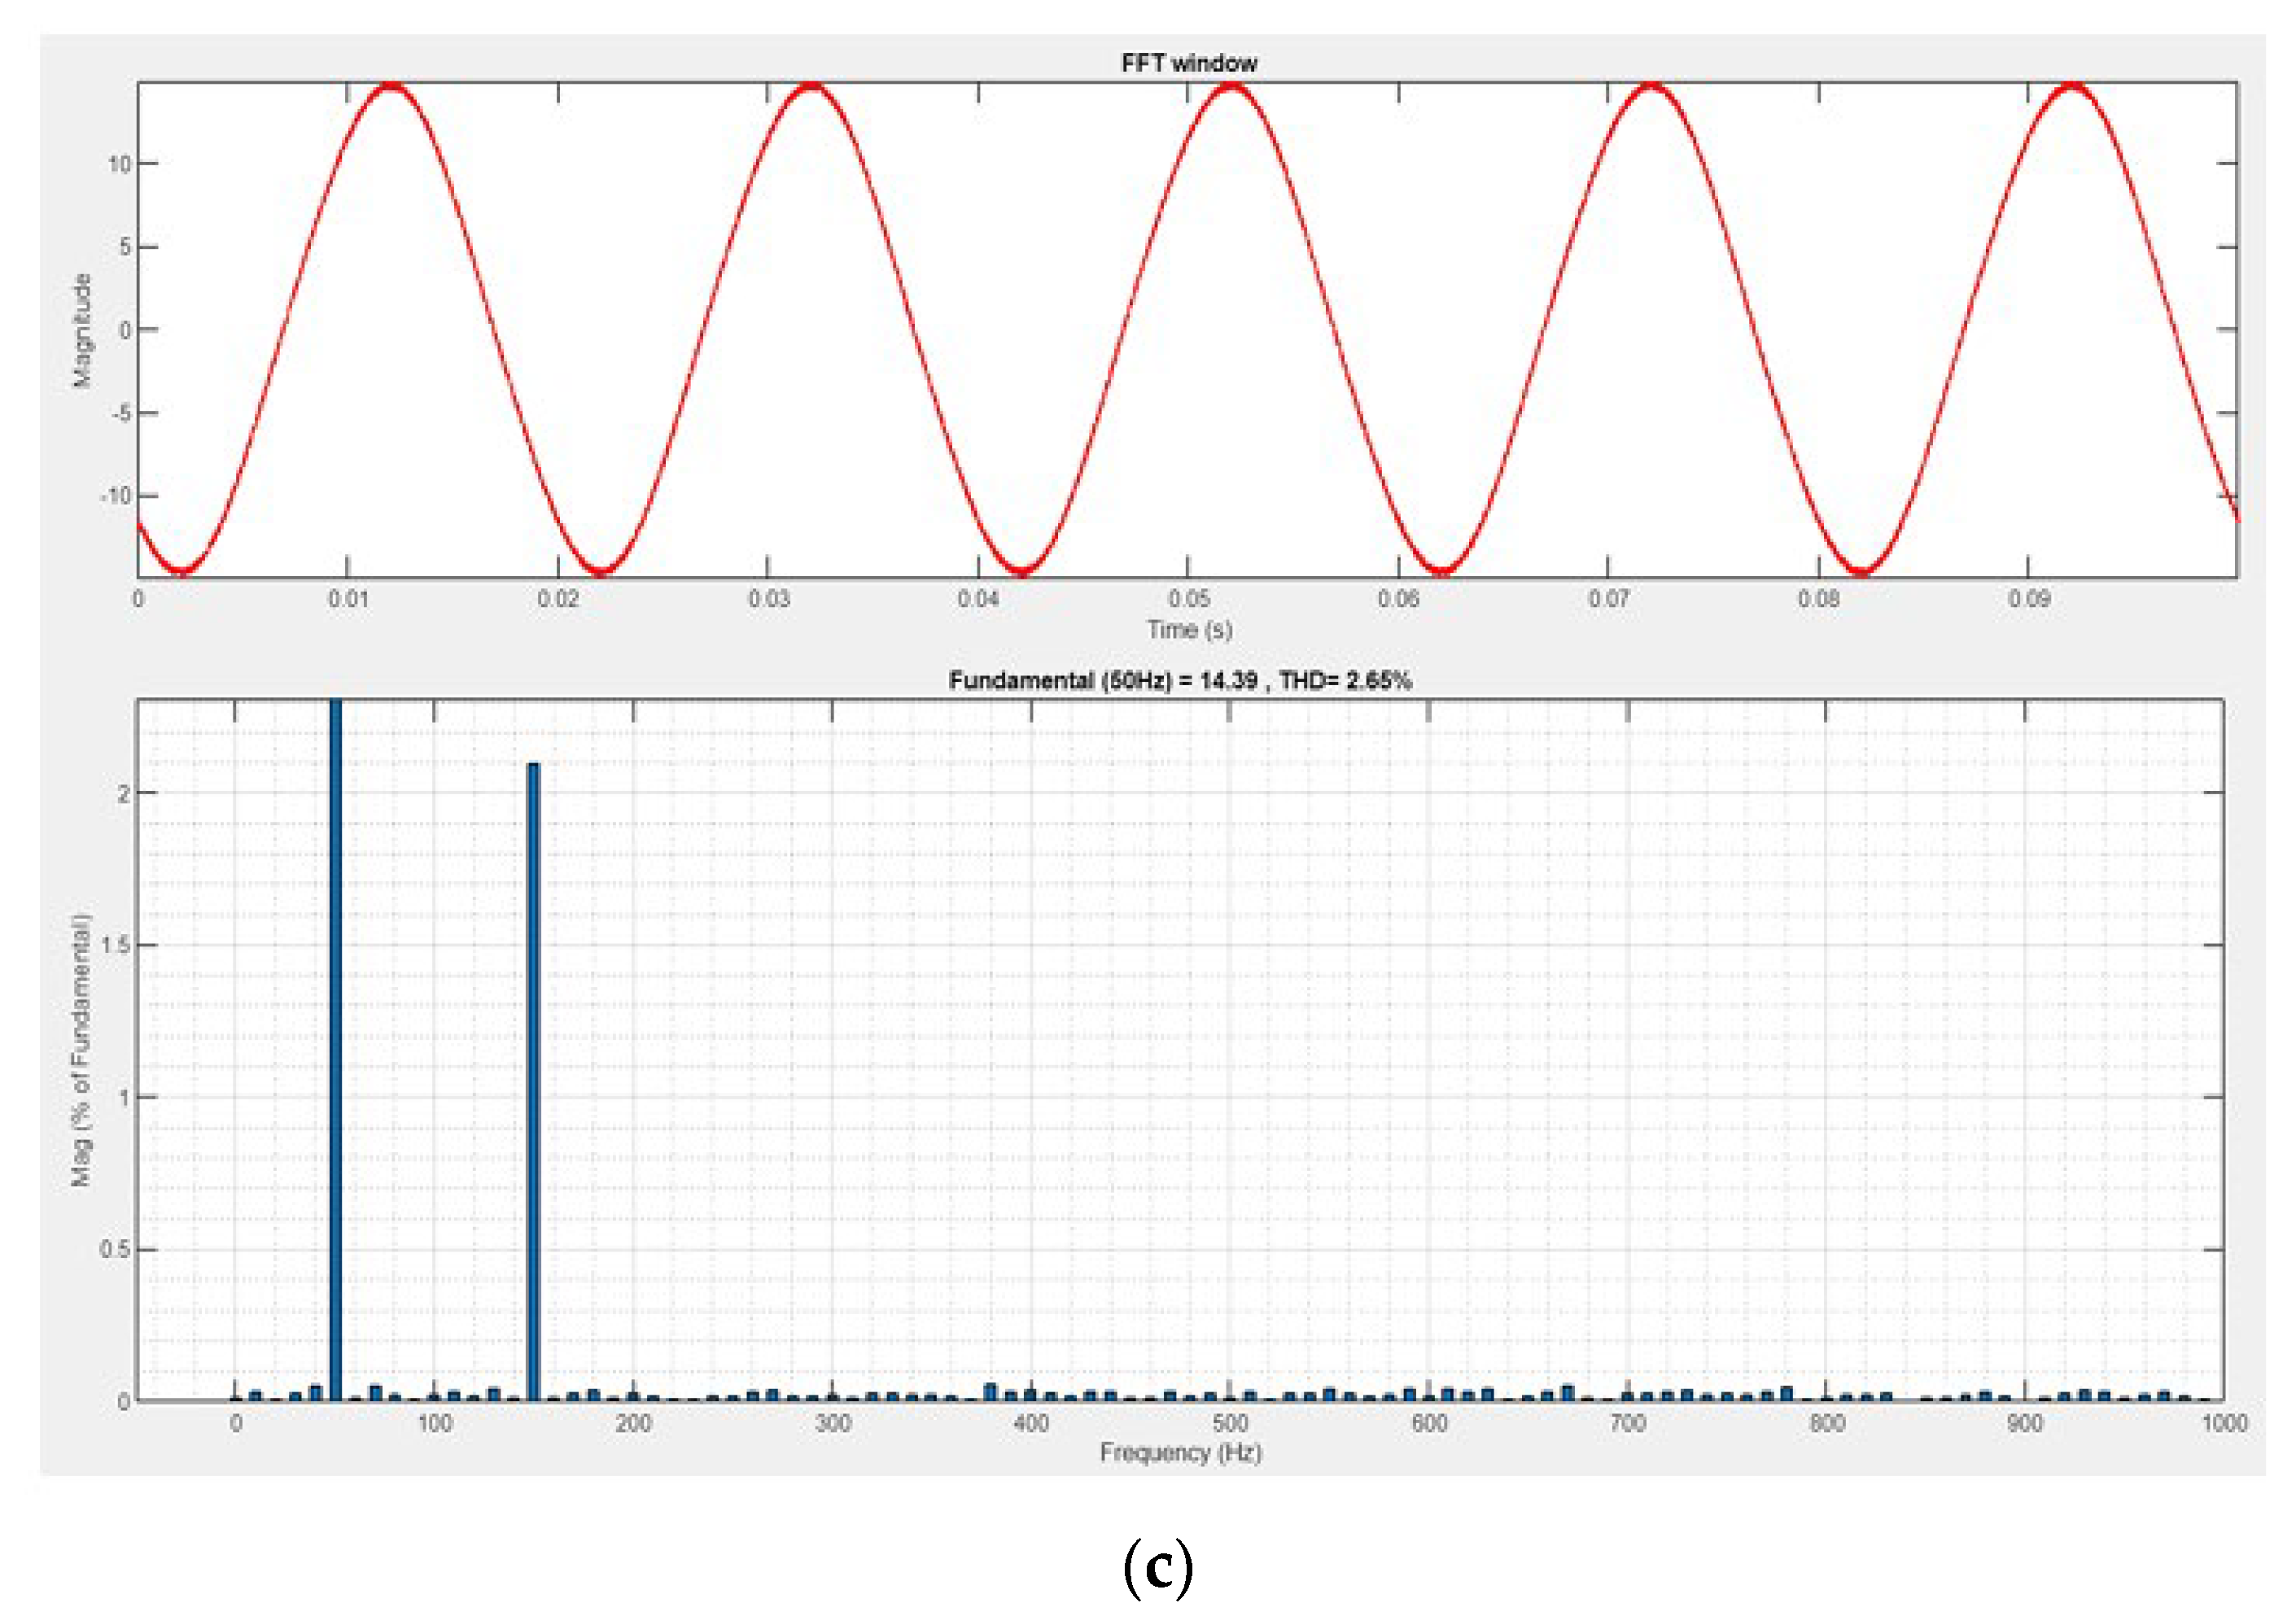
4. Performance of the Wind Based DG System with Unbalanced Non-Linear Load
Wind energy will become the most in-demand renewable energy source in the next few decades. The relevance of WECS will become increasingly apparent, and the prices are decreasing due to the huge production push and innovations in advance converters.
Wind turbines are crucial in the clean renewable energy revolution occurring across the world. The greatest benefit of the wind turbine is that it can be employed to direct power to areas that are distant in the grid. Wind energy experiences periodic changes, in that the optimal result is obtained in the period of winter and the worst in the period of summer; hence, it has contrasting characteristics to solar energy.
The modelling block of a grid injected wind system is displayed in Figure 8. The wind system is composed of the fan blades, mechanical turbine, PMSG, AC-DC converter, dc link capacitor and VSI.
Figure 8.
(a) THD of A-phase Load current; (b) THD of B-phase Load current; (c) THD of C-phase Load current.
An ANN-BP controller is modelled to obtain the gate pulses of the wind-grid tied inverter. The VSI linked in parallel is considered as a DSTATCOM and so directs the required reactive power to the grid-associated load and then reduces the harmonics produced at the load terminals. The THD at the supply terminal is illustrated in Figure 8.
Figure 8a–c project the graphs of the load currents and the associated THD bars. Figure 9a–c demonstrate that the simulation performance and the THD at the source terminal were lower than 3%. So, the developed model adheres to the IEEE 519 protocol. A 19% THD is obtained at an A-ph load, 32% THD is observed at the B-phase and 6% THD is observed at the C-phase. In contrast, the THDs of the three legs at the supply terminals are nearly 2%, enhancing the source side PQ with varied loads with an ANN controller.

Figure 9.
(a) THD of A-phase Source current (b) THD of B-phase Source current (c) THD of C-phase Source current.
The evaluation of the currents before the control action and after employing the controller are presented in Table 2. It projects the PQ enhancement with the application of compensation.
Table 2.
THD Comparison before and after compensation.
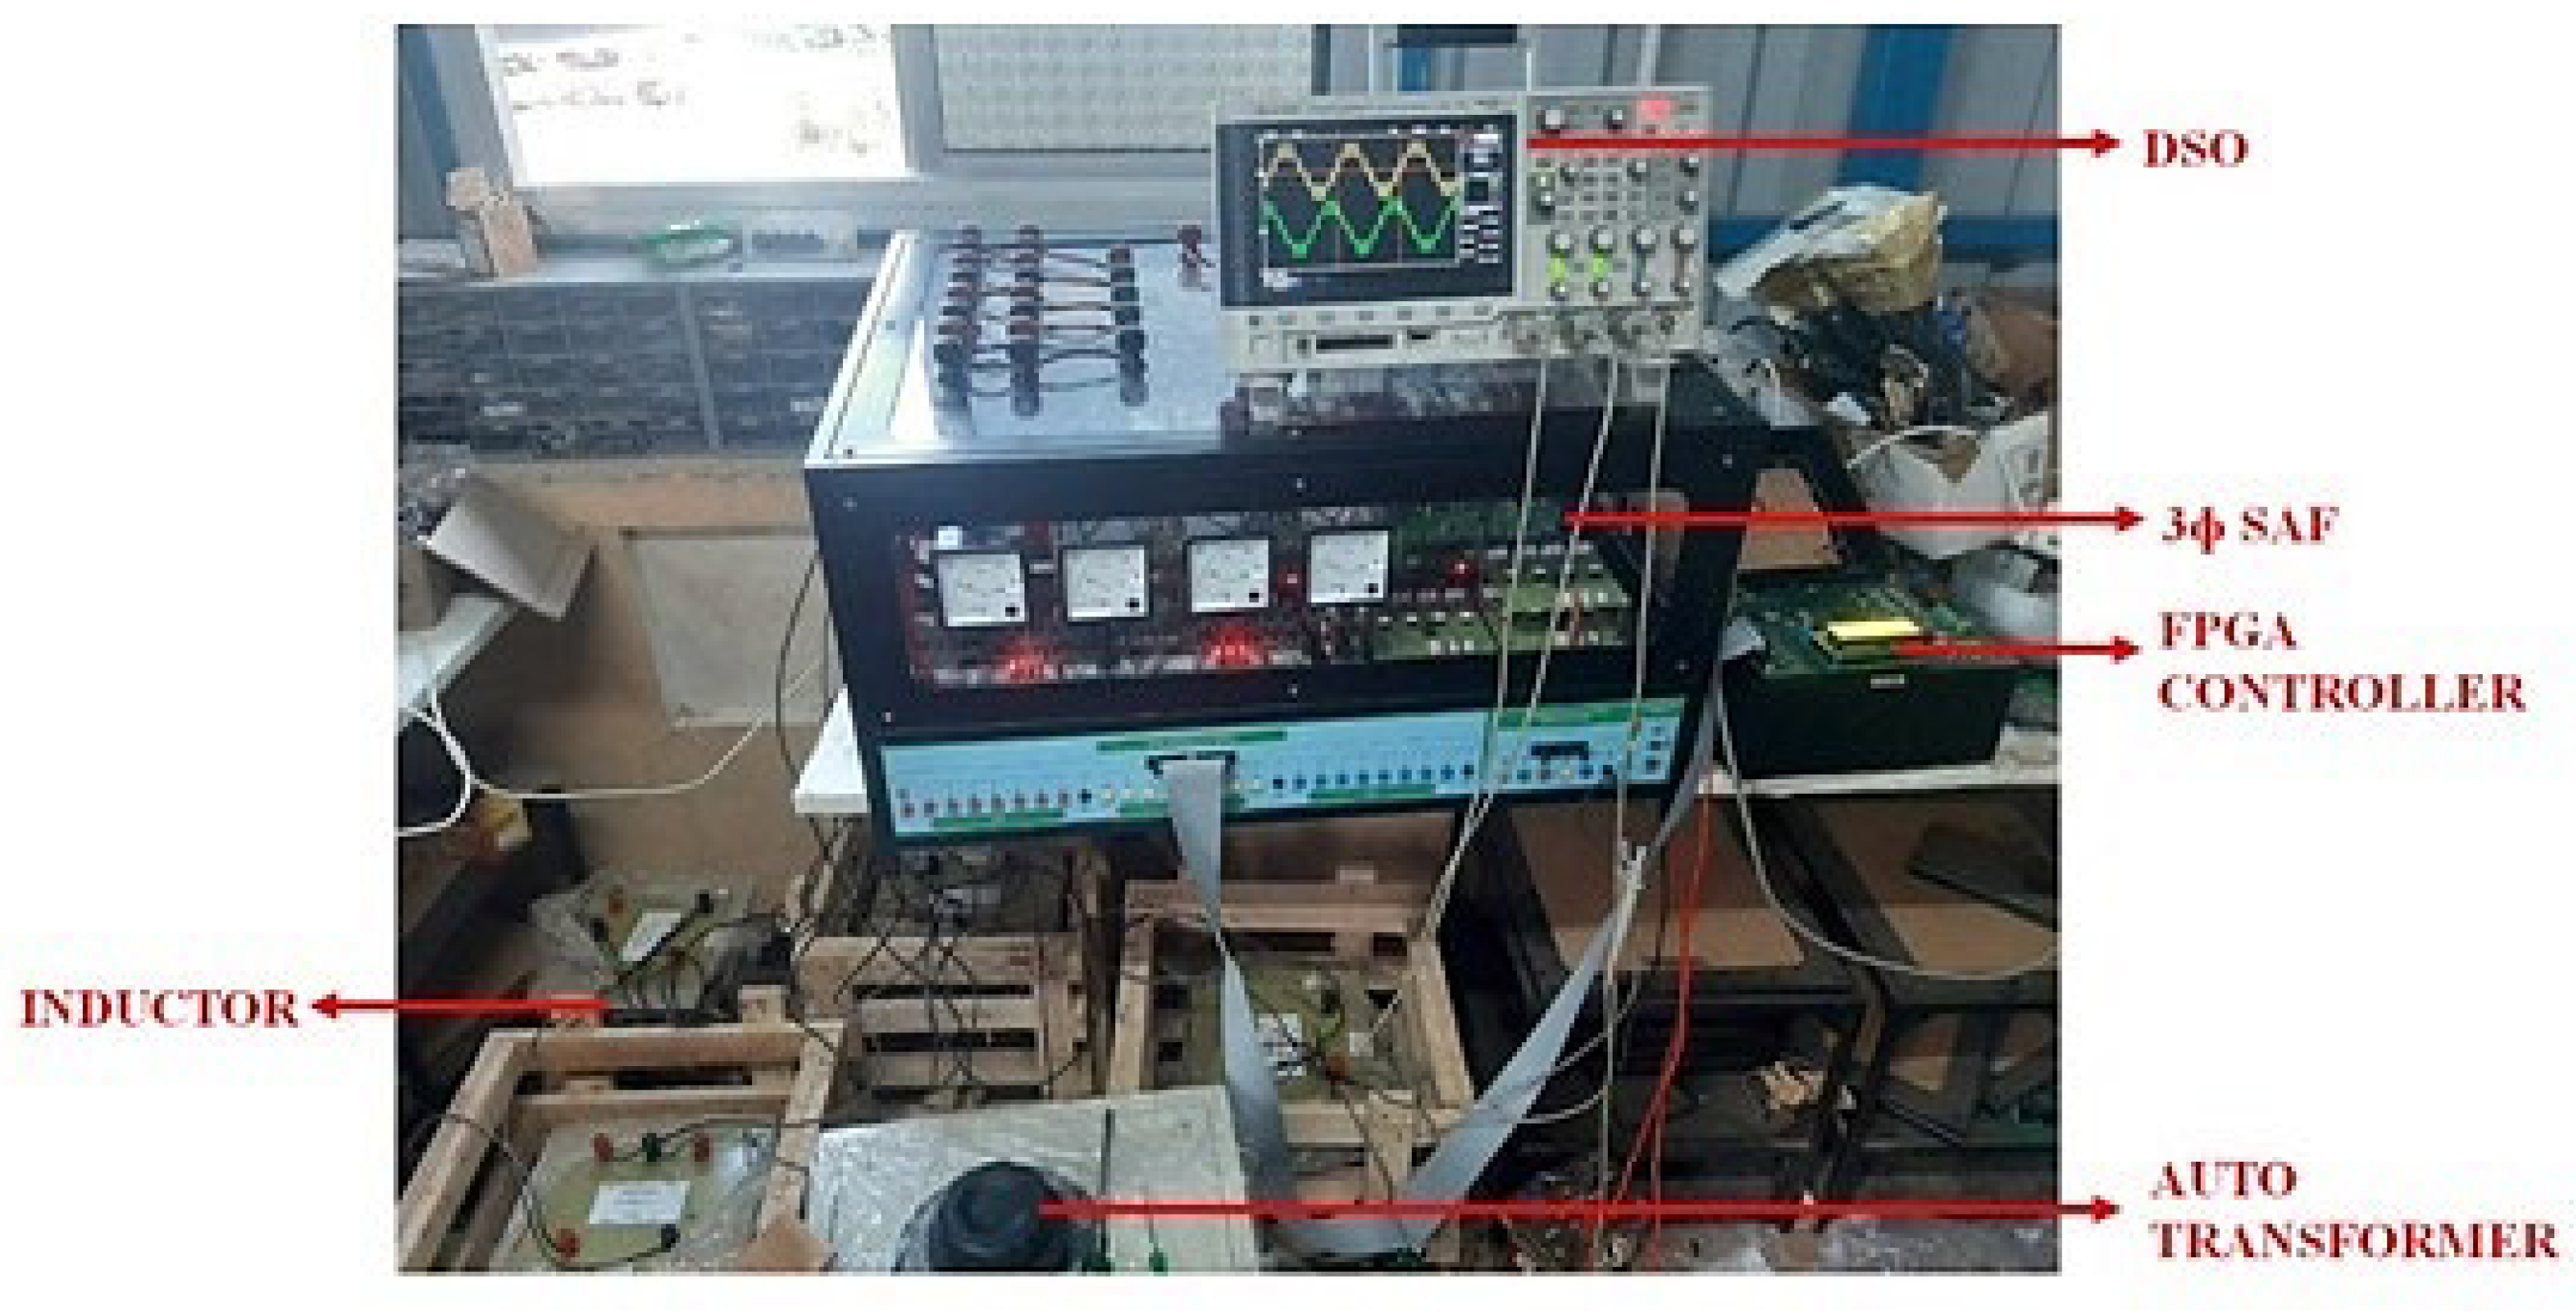
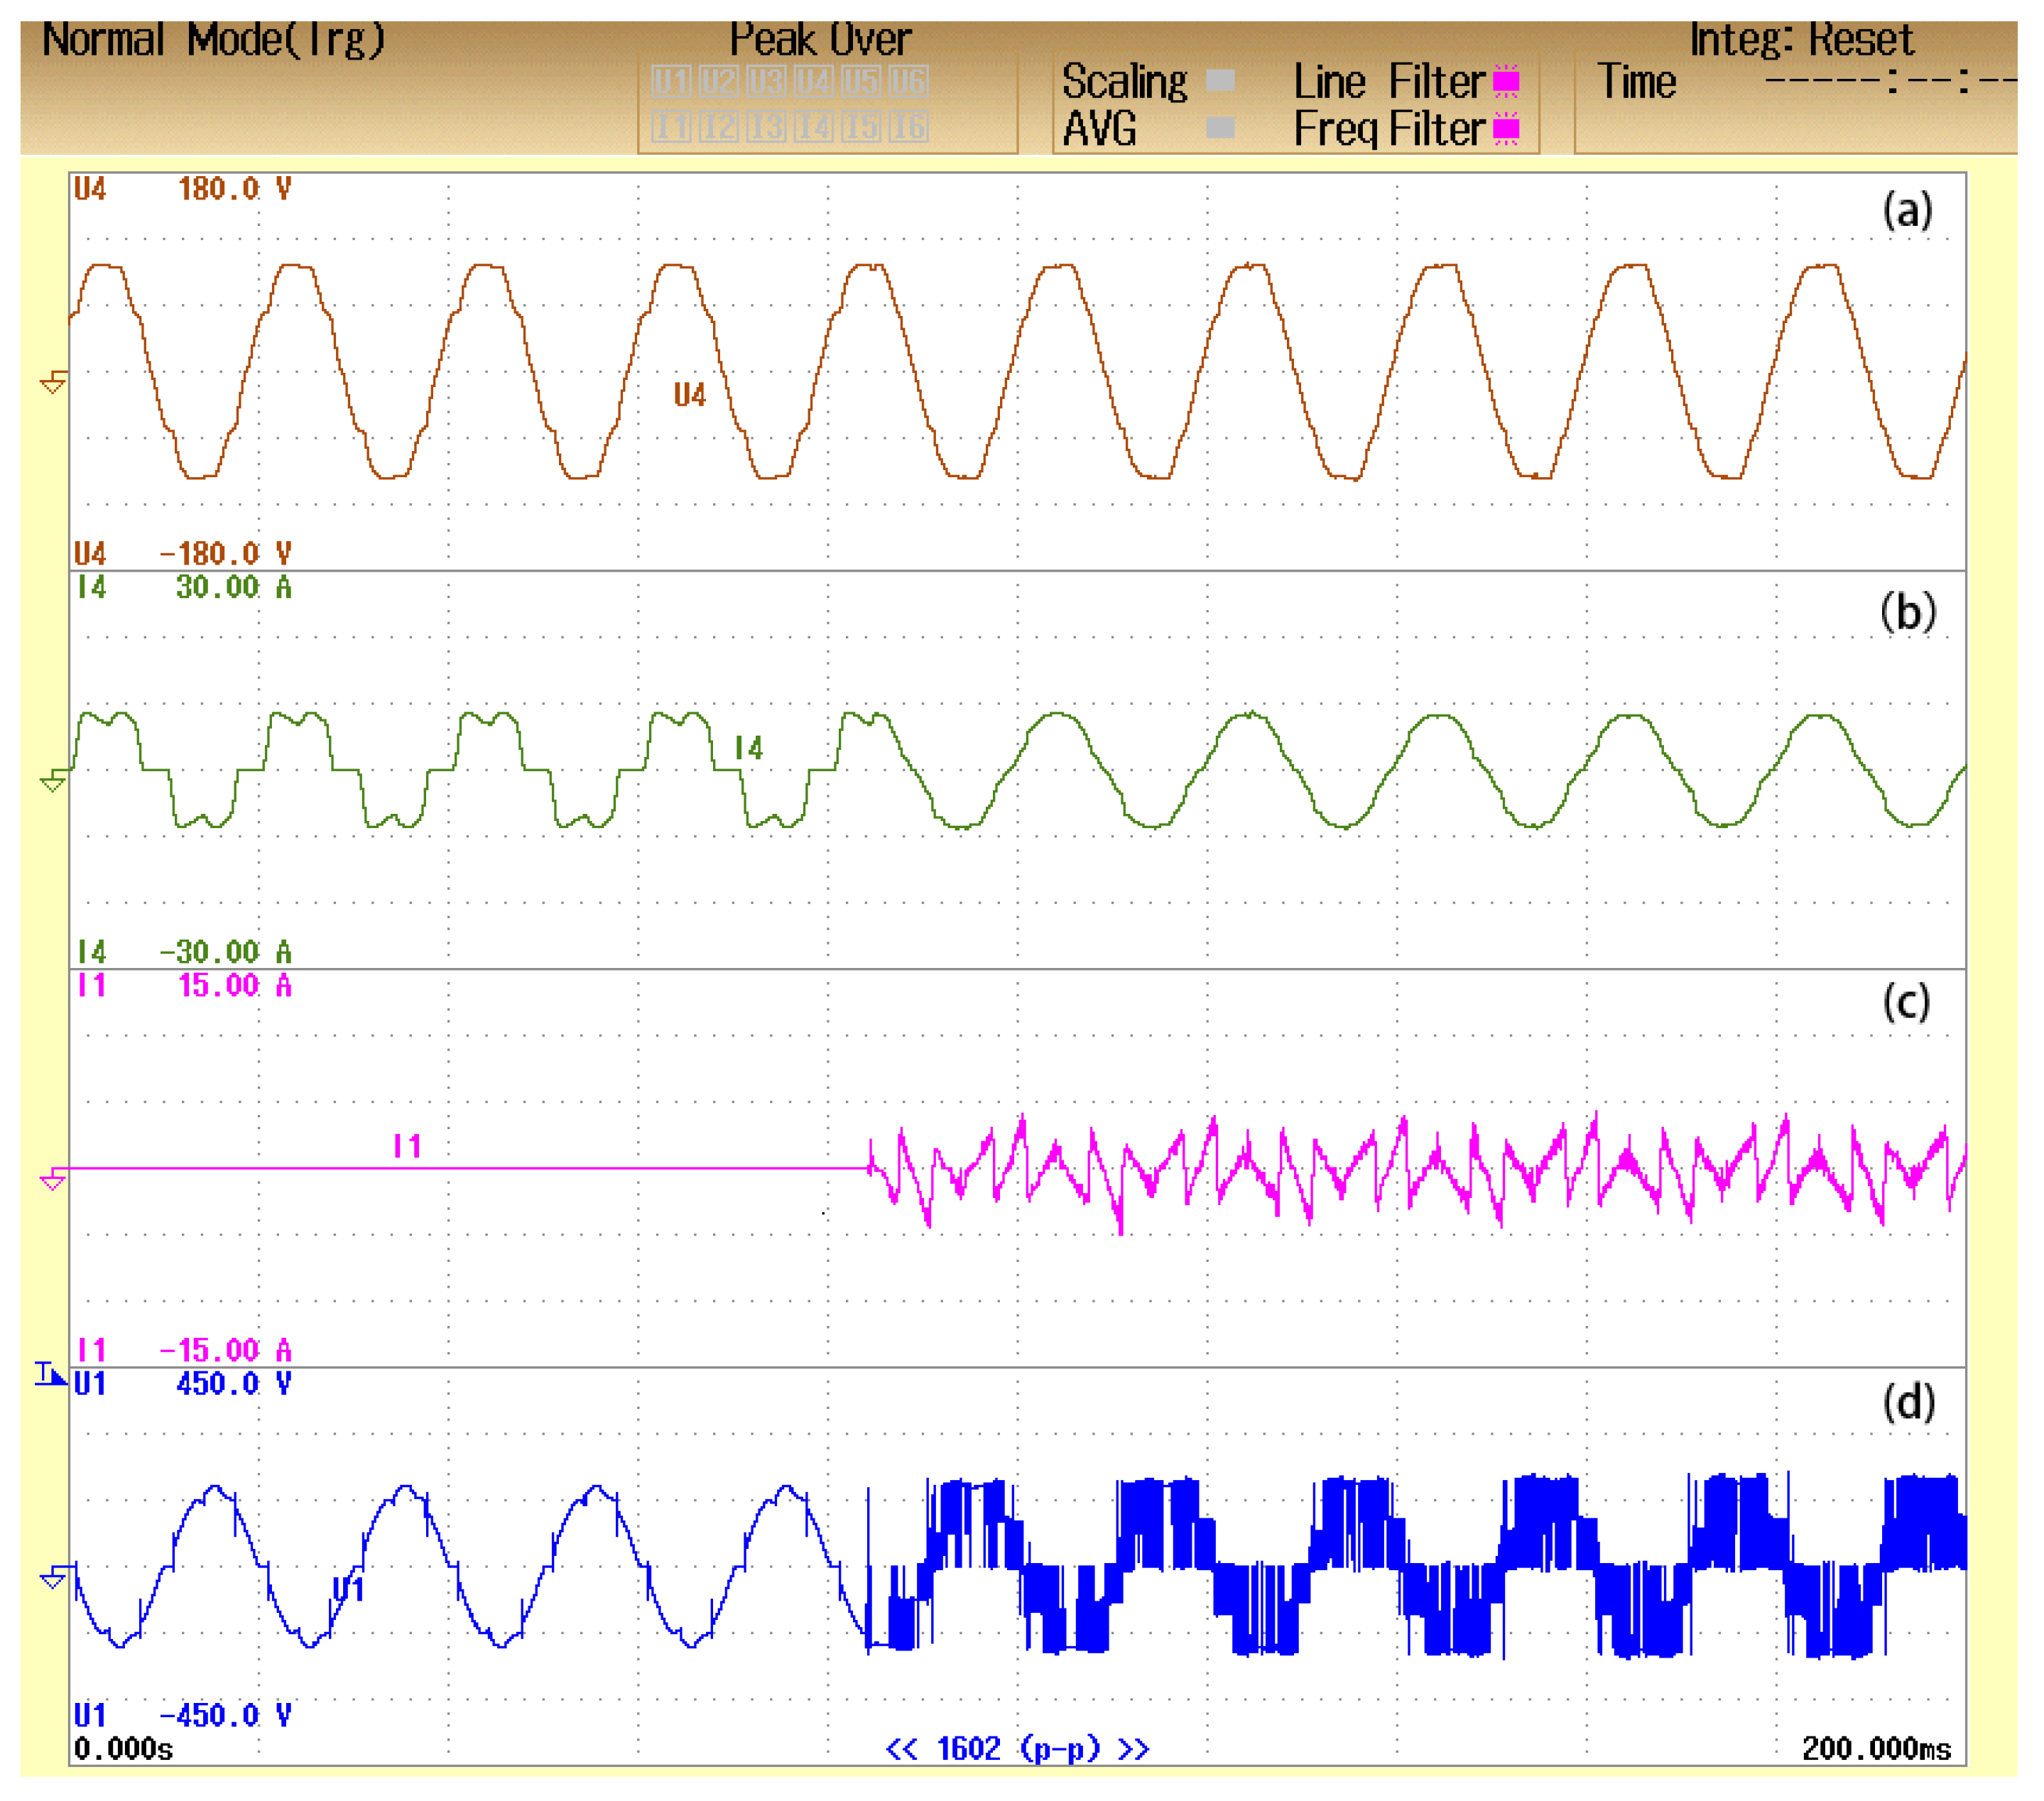
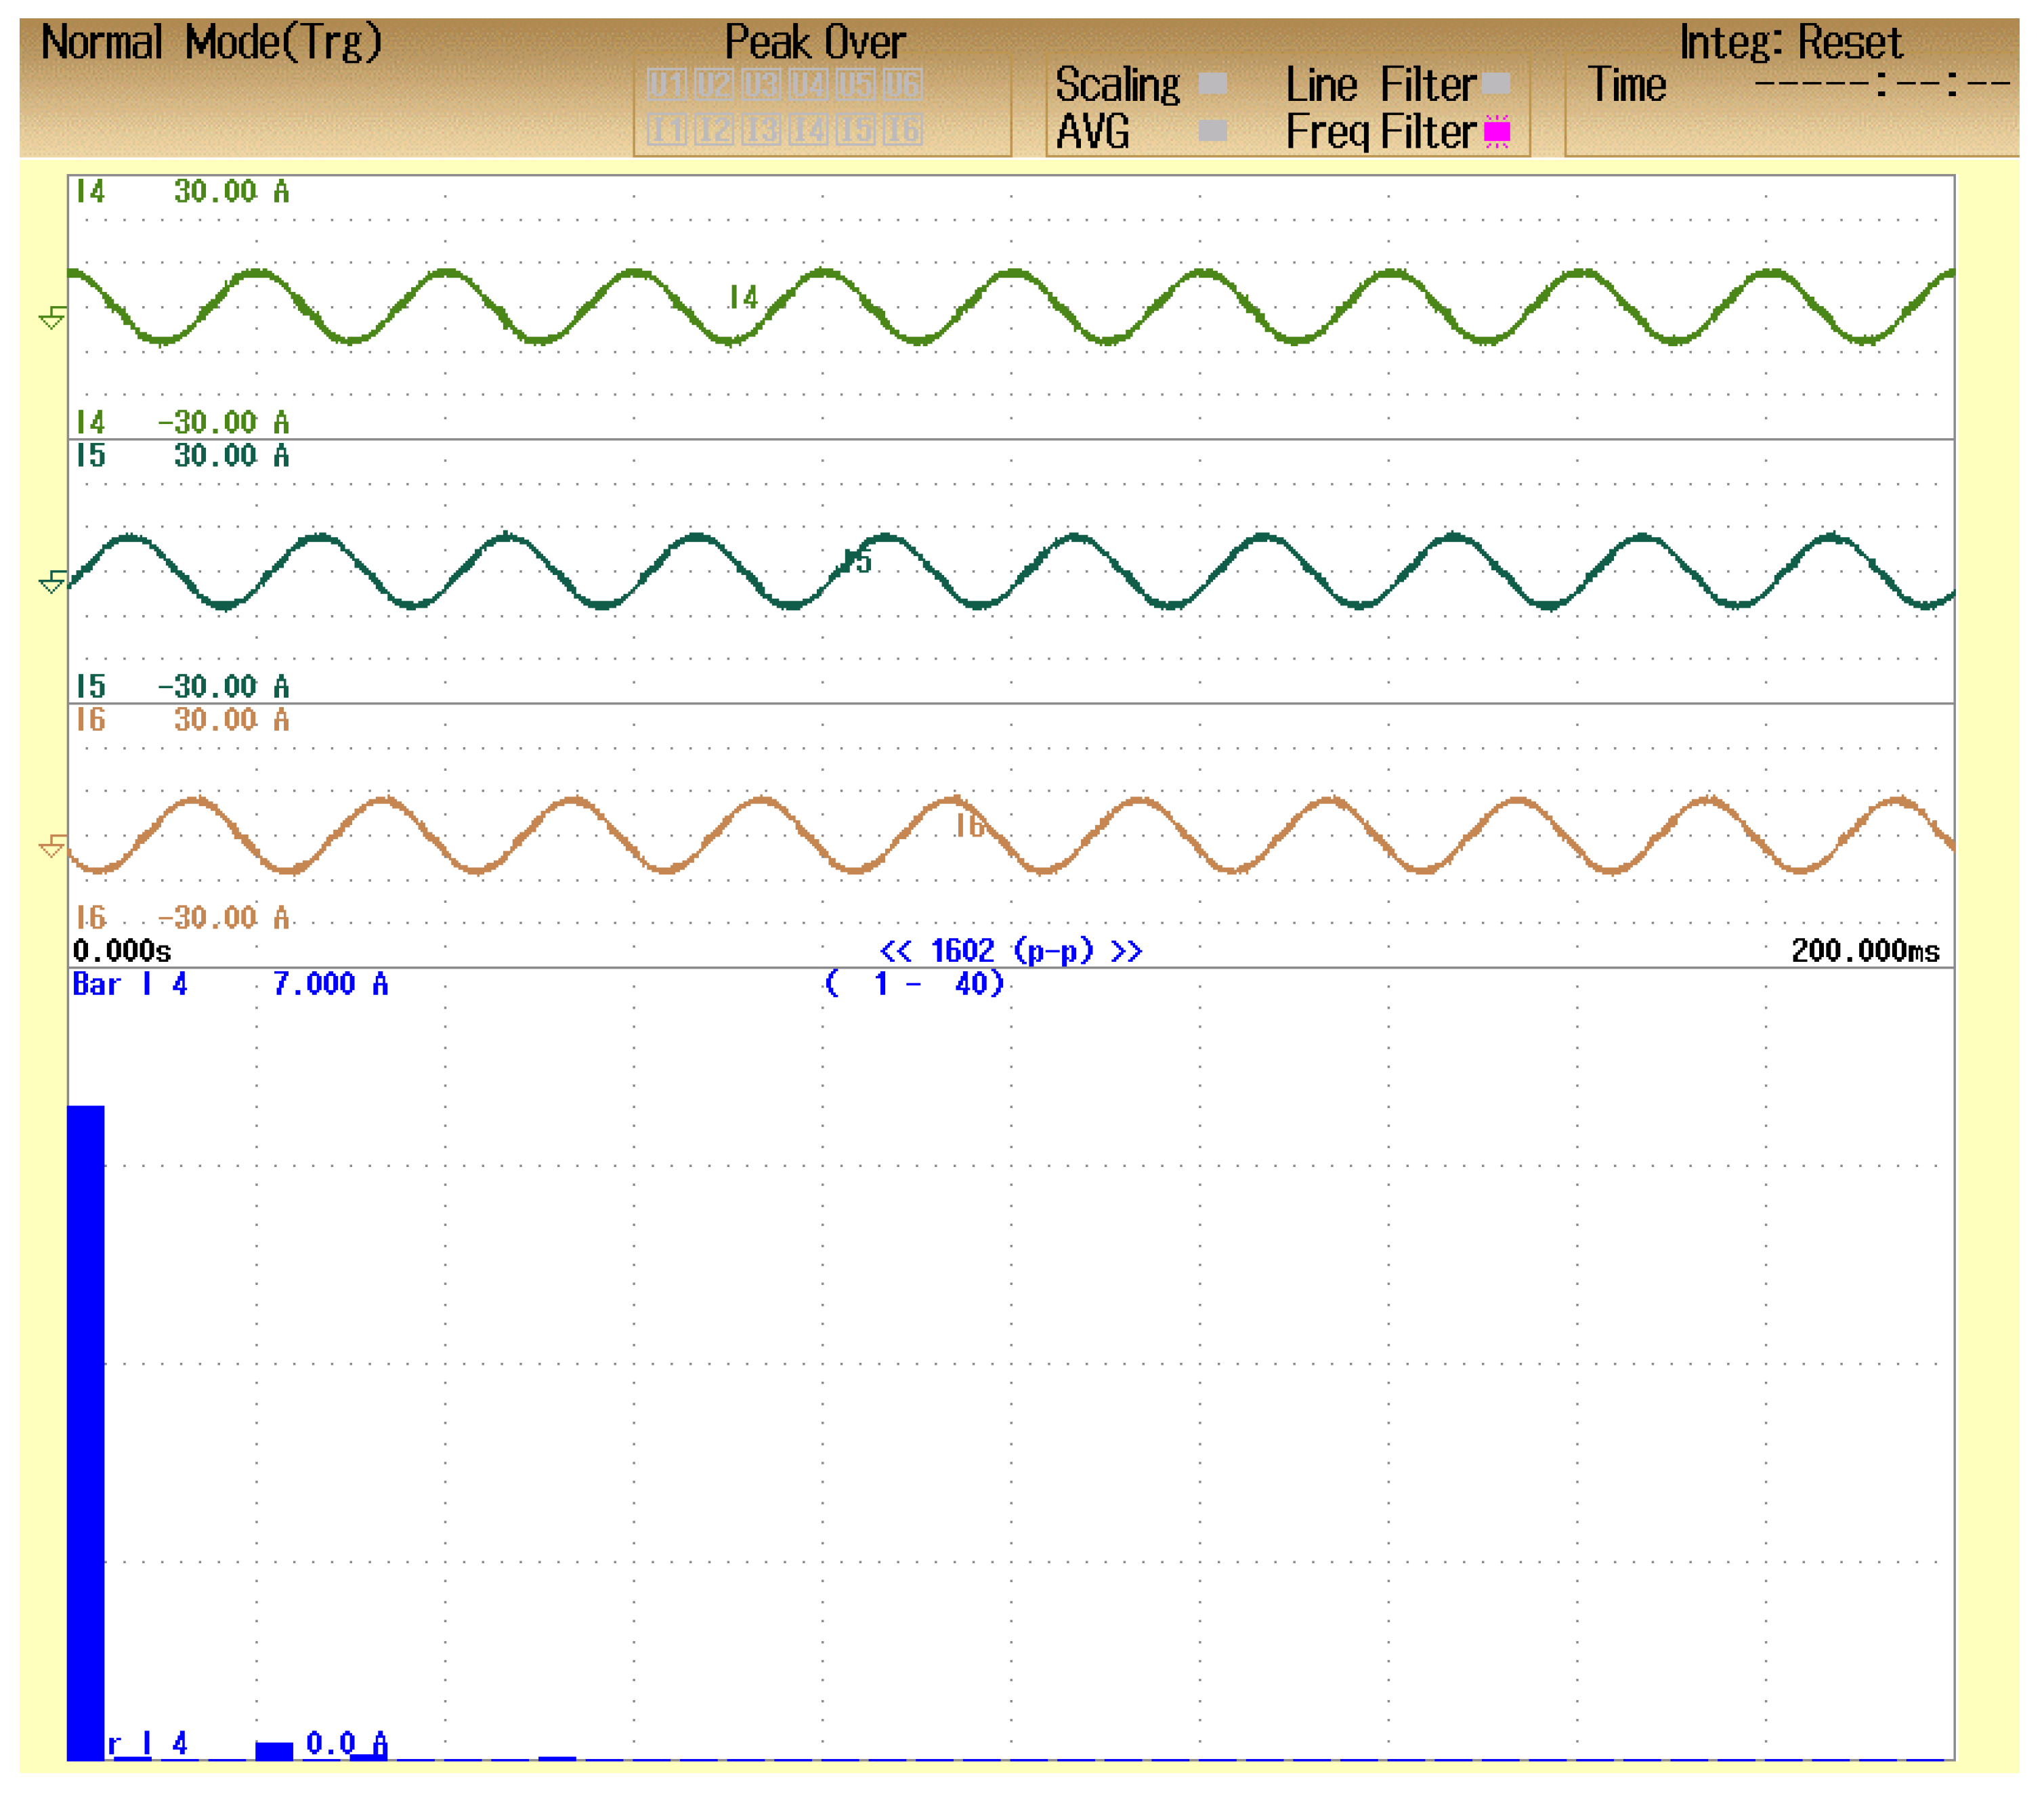
5. Hardware Implementation: Balanced Non-Linear Load
The established scheme was formulated using a dSPACE setup for a balanced loading scenario, as reflected in Figure 10. The FPGA controller generates the required gate commands for all six IGBT switches of the grid inverter to accomplish the desired performance, with a sampling time of 10 microseconds which is required to execute the developed control algorithm. This unit includes the hardware outputs of the Adaptive Learning Back Propagation-Based Control Algorithm for a three-phase three-wire system addressing a non-linear balanced load. The specifications of the experimental setup are presented in Table 3.
Figure 10.
Experimental setup of DSTATCOM.
Table 3.
Hardware Components and their details.
The prototype setup used for validating the ANN-BP controller consists of the following four major components: DSTATCOM, FPGA board, dSPACE board and two computers. Quartus software was used to model the controller for execution on the FPGA board. The model setup designed in MATLAB/SIMULINK was copied to the dSPACE board via interface. The testing dataset was transferred between the dSPACE and FPGA through a serial link and the results are monitored using DSO (Digital Storage Oscilloscope).
From Figure 11, it can be seen that when DSTATCOM was activated, it started sending the compensation current; hence, the source current became sinusoidal. Before using DSTATCOM, the non-sinusoidal current can be observed at the source side, which is similar to the currents drawn by the non-linear load. The variation in the quality of the source current reflects the enhancement of THD at the supply side.
Figure 11.
Single Phase (a) Supply Voltage (b) Supply Current (c) Compensator Current (d) Compensator Voltage.
The load currents of the three phases are shown in Figure 12, which are non-sinusoidal as the load is non-linear. The three supply currents are shown in Figure 13, which are perfectly sinusoidal. The simulation results were authenticated using the hardware setup and the values are presented in Table 4 for comparison. The DSTATCOM using the ANN-BP based controller was implemented using the hardware setup and the results are satisfactory.
Figure 12.
Load currents of three phases.
Figure 13.
Supply currents of 3 phases.
Table 4.
THD of simulated and experimented models.
6. Conclusions
In this paper, a wind energy conversion system was modelled and simulated using MATLAB. The proposed ANN-based controller was modelled and tested within the wind system. The performance was analyzed by improving the power quality of the system for non-linear unbalanced loading conditions. The THD obtained after applying the ANN-based VSI adhered to the IEEE-519 standard.
Author Contributions
Conceptualization, M.M.I. and S.M.; methodology, M.M.I., S.M., C.P., S.S.R. and S.M.S.H.; software, M.M.I.; validation, M.M.I. and S.M.S.H.; formal analysis, M.M.I., S.M., C.P., S.S.R. and S.M.S.H.; investigation, M.M.I., S.M., C.P., S.S.R. and S.M.S.H.; writing—original draft preparation, M.M.I.; writing—review and editing, S.M. and S.M.S.H.; supervision, S.M., C.P., S.S.R. and S.M.S.H.; project administration, S.M.S.H.; funding acquisition, S.M.S.H. All authors have read and agreed to the published version of the manuscript.
Funding
This research received no external funding.
Institutional Review Board Statement
Not applicable.
Informed Consent Statement
Not applicable.
Conflicts of Interest
The authors declare no conflict of interest.
Abbreviations
| PQ | Power Quality |
| WECS | Wind Energy Conversion System |
| DSTATCOM | Distribution Static Compensator |
| THD | Total Harmonic Distortion |
| ANN | Artificial Neural Network |
| BP | Back Propagation |
| MPPT | Maximum Power Point Tracking |
| PMSG | Permanent Magnet Synchronous Generator |
| CPD | Custom Power Devices |
| PV | Photo Voltaic |
References
- Zhang, W.; Wang, G.; Qi, J.; Wang, G.; Zhang, T. Research on the Extraction of Wind Turbine all over the China Based on Domestic Satellite Remote Sensing Data. In Proceedings of the 2021 IEEE International Geoscience and Remote Sensing Symposium IGARSS, Brussels, Belgium, 11–16 July 2021; pp. 4167–4170. [Google Scholar] [CrossRef]
- Sitharthan, R.; Swaminathan, J.N.; Parthasarathy, T. Exploration of Wind Energy in India: A Short Review. In Proceedings of the 2018 National Power Engineering Conference (NPEC), Madurai, India, 9–10 March 2018; pp. 1–5. [Google Scholar] [CrossRef]
- Available online: https://mnre.gov.in/solar/current-status/ (accessed on 20 May 2022).
- Erlich, I.; Shewarega, F. Introduction of Wind Power Generation into the First Course in Power Systems. In Proceedings of the 2007 IEEE Power Engineering Society General Meeting, Tampa, FL, USA, 24–28 June 2007; pp. 1–8. [Google Scholar] [CrossRef]
- Luo, F.L. Design of wind-turbine energy system. In Proceedings of the 2010 Conference Proceedings IPEC, Singapore, 27–29 October 2010; pp. 110–115. [Google Scholar] [CrossRef]
- Muljadi, E.; Ellis, A. Validation of wind power plant models. In Proceedings of the 2008 IEEE Power and Energy Society General Meeting—Conversion and Delivery of Electrical Energy in the 21st Century, Pittsburgh, PA, USA, 20–24 July 2008; pp. 1–7. [Google Scholar] [CrossRef]
- Al-Majed, S.I.; Fujigaki, T. Wind power generation: An overview. In Proceedings of the 2010 Modern Electric Power Systems, Wroclaw, Poland, 20–22 September 2010; pp. 1–6. [Google Scholar]
- Yang, C.; Liang, H.; Jiang, J. Modeling and simulation of AC-DC-AC converter system for MW-level direct-drive wind turbine grid interface. In Proceedings of the 2016 37th IEEE Power Electronics Specialists Conference, Jeju, Korea, 18–22 June 2006; pp. 1–4. [Google Scholar] [CrossRef]
- Nouri, S.; Babaei, E.; Hosseini, S.H. A New AC/DC Converter for the Interconnections between Wind Farms and HVDC Transmission Lines. J. Power Electron. 2014, 14, 592–597. [Google Scholar] [CrossRef]
- Santos, N.I.L.; Costa, L.A.L.d.A.C.; Corrêa, M.B.R.; Vitorino, M.A. Three-Phase Hybrid AC-DC-AC Voltage/Current Source Converter for Wind Energy Conversion Systems. In Proceedings of the 2019 IEEE Energy Conversion Congress and Exposition (ECCE), Baltimore, MD, USA, 29 September–3 October 2019; pp. 3579–3586. [Google Scholar] [CrossRef]
- Debnath, S.B.C.; Barua, B.; Karim, R.; Faisal, M.U. Design & implementation of an efficient windmill anemometer for wind speed measurement using microcontroller. In Proceedings of the 2016 3rd International Conference on Electrical Engineering and Information Communication Technology (ICEEICT), Dhaka, Bangladesh, 22–24 September 2016; pp. 1–5. [Google Scholar] [CrossRef]
- Fernandes, D.; Gomes, L.; Costa, A. Wind speed and direction measurement based on time-of-flight ultrasonic anemometer. In Proceedings of the 2017 IEEE 26th International Symposium on Industrial Electronics (ISIE), Edinburgh, UK, 19–21 June 2017; pp. 1417–1422. [Google Scholar] [CrossRef]
- Abichandani, P.; Lobo, D.; Ford, G.; Bucci, D.; Kam, M. Wind Measurement and Simulation Techniques in Multi-Rotor Small Unmanned Aerial Vehicles. IEEE Access 2020, 8, 54910–54927. [Google Scholar] [CrossRef]
- Abo-Khalil, A.G.; Alyami, S.; Sayed, K.; Alhejji, A. Dynamic Modeling of Wind Turbines Based on Estimated Wind Speed under Turbulent Conditions. Energies 2019, 12, 1907. [Google Scholar] [CrossRef]
- Yomchinda, T. A Method of Wind Velocity Estimation Using a Tethered, Spherical Balloon with Standard Aviation Sensors. In Proceedings of the 2017 International Conference on Vision, Image and Signal Processing (ICVISP), Osaka, Japan, 22–24 September 2017; pp. 130–133. [Google Scholar] [CrossRef]
- Rathi, R.; Sandhu, K.S. Comparative analysis of MPPT algorithms using wind turbines with different dimensions & ratings. In Proceedings of the 2016 IEEE 1st International Conference on Power Electronics, Intelligent Control and Energy Systems (ICPEICES), Delhi, India, 4–6 July 2016; pp. 1–4. [Google Scholar] [CrossRef]
- Ranjan, S.; Das, D.C.; Sinha, N.; Latif, A.; Hussain, S.M.S.; Ustun, T.S. Voltage stability assessment of isolated hybrid dish-stirling solar thermal-diesel microgrid with STATCOM using mine blast algorithm. Electr. Power Syst. Res. 2021, 196, 107239. [Google Scholar] [CrossRef]
- Vemuganti, H.; Reddy, R.; Deshmukh, A. Simulink implementation of Nine-level Cascaded T-type RSC-MLI for 3P3W DSTACOM application. IOP Conf. Ser. Mater. Sci. Eng. 2020, 981, 042045. [Google Scholar] [CrossRef]
- Veeramsetty, V.; Deshmukh, R. Electric power load forecasting on a 33/11 kV substation using artificial neural networks. SN Appl. Sci. 2020, 2, 855. [Google Scholar] [CrossRef]
- Rakesh Chandra, D.; Salkuti, S.R.; Veeramsetty, V. Transient Stability Enhancement of Power System with Grid Connected DFIG Based Wind Turbine. In Next Generation Smart Grids: Modeling, Control and Optimization. Lecture Notes in Electrical Engineering; Salkuti, S.R., Ray, P., Eds.; Springer: Singapore, 2022; Volume 824. [Google Scholar] [CrossRef]
- Rajkumar, R.; Ragupathy, U. S. An ANN-based harmonic mitigation and power injection technique for solar-fed distributed generation system. Soft Comput. 2020, 24, 15763–15772. [Google Scholar] [CrossRef]
- Zhang, H.; Zhou, L.; Tim, K.T. Mode-based energy transfer analysis of flow-induced vibration of two rigidly coupled tandem cylinders. Int. J. Mech. Sci. 2022, 228, 107468. [Google Scholar] [CrossRef]
- Zhou, L.; Tim, K.T.; Hu, G.; Li, Y. Higher order dynamic mode decomposition of wind pressures on square buildings. J. Wind Eng. Ind. Aerodyn. 2021, 211, 104545. [Google Scholar] [CrossRef]
- Abdolrasol, M.G.M.; Hussain, S.M.S.; Ustun, T.S.; Sarker, M.R.; Hannan, M.A.; Mohamed, R.; Ali, J.A.; Mekhilef, S.; Milad, A. Artificial Neural Networks Based Optimization Techniques: A Review. Electronics 2021, 10, 2689. [Google Scholar] [CrossRef]
Publisher’s Note: MDPI stays neutral with regard to jurisdictional claims in published maps and institutional affiliations. |
© 2022 by the authors. Licensee MDPI, Basel, Switzerland. This article is an open access article distributed under the terms and conditions of the Creative Commons Attribution (CC BY) license (https://creativecommons.org/licenses/by/4.0/).