Abstract
A deep review of the state of the electromobility in urban public transport by bus was conducted from all different charging strategies, types of chargers, and e-buses with a general overview and SWOT analysis. A review of five case studies worldwide was also conducted and a real case study with real data was shown in depth: EMT Madrid, where all chargers and charging systems were developed in a single operation center. Total Cost of Ownership (TCO) from the literature and from the case study for e-buses were shown as compared with different bus technologies.
1. Introduction
Public transport is necessary for a sustainable planet, since transport and urban planning are key for reaching great standards in terms of air quality, healthy cities, traffic decongestion, and accessibility. Following UITP (International Association of Public Transport), 80% of all public transportation worldwide is carried out by buses [1]. The main current challenge for public transportation by bus is electrification, i.e., e-buses and their infrastructure [2].
Be it quickly or slowly, cities around the world are increasingly electrifying their public transport fleet. However, the pace of implementation is not the only parameter that differentiates electrification projects.
There are several decisions that a public transport operator (PTO) or a public transport authority (PTA) must make when undertaking an electrification process for its fleet and depots, including charging strategy and charging technology. Charging strategy refers to when the bus will be charged (much influenced by the operation type), while charging technology refers to how the bus will be charged in terms of the equipment/infrastructure used. This decision must precede the acquisition of buses, since they must be compatible with the selected technology and optimized with the strategy to be implemented. For example, opportunity charging will allow the acquisition of buses with smaller batteries.
This article aimed to review trends in e-bus electromobility. An international overview with specific cases was also conducted, with a special focus on the TCO (total cost of operations) of different technologies. A specific case study (Municipal Transport Company of Madrid, hereinafter EMT Madrid Madrid) was shown, related with its electromobility strategy, infrastructure development, and charging systems, showing real data and the TCO to discuss and compare with the current state of knowledge. EMT Madrid is at the forefront of the latest technological solutions, improving the comfort of its passengers and making its activity compatible with the least possible interference with the environment [3]. EMT Madrid started operating fully electric microbuses in 2007 and began its conventional (12 m long) bus electrification process in 2018 with the inauguration of the first inductive charging bus line in the city of Madrid. Since then, to date, it has an effective fleet of 181 electric buses divided into 151 12 m buses, 25 minibuses, and 5 opportunity charge induction buses. Additionally, the purchase of 150 more e-buses has just been conducted, and work is already underway on a new tender for the purchase of 10 fuel cell buses (H2). By the end of 2022 a new tender will probably be published for the purchase of between 100 and 200 more e-buses, to be added to the fleet by 2024–2025.
The target is to reach a 25% electric fleet by 2025 and a 33% by 2027 (around 667 e-buses).
Fortunately, the market has evolved quite quickly. It can even be said that it is already somewhat mature, since it offers several options that are adapted to the individual requirements and needs of public transport operators and authorities. This article serves to update the state of the art but also shares a real case of a PTO compared with general trends.
The present paper has the main goal of sharing a real case study where in a single operation center (depot +300 buses) all typologies of charging exist, so real investment costs (infrastructure + e-bus) and operation costs can be shared and compared with the state of knowledge to contribute for improving best practices in this great energy transition in bus public transport.
2. State of the Art and Trends
The rapid growth of the market entails a higher risk of obsolescence and a higher opportunity cost considering the amortization times of buses, chargers, and warehouses. Therefore, it is necessary to analyze the trends and potential next developments of the main components that make up the electrical system to assess the viability of fleet electrification projects. On the other hand, the experience that some PTOs (such as EMT Madrid) and PTAs have gained after the first pilot projects and implementation helps the rest to have a stronger understanding of the benefits and threats that this technology can bring.
There are currently different dimensions and barriers for the adoption of more sustainable buses: technologies, infrastructure needed, chargers, and charging strategies [4].
2.1. Charging Strategies
Following traditional gas and fuel refueling strategies, the first approach introduced to charging electric fleets was to introduce depot charging. However, the limited range of the batteries brought the need to introduce additional charging along some routes. This is known as opportunity charging.
Charging at the bus depot (Table 1. Advantages and Disavantages): Under this scheme, fleet charging operations are carried out only at the depot. Charging is usually conducted overnight due to the cheaper power prices and to avoid interfering with operating hours. With a single time possibility of charging, the operation of the transport units must be planned to ensure that the autonomy of the buses is sufficient to cope with the daily scheduled operating conditions. Warehouse cargo may also include the following subdivision:
- Charge only overnight. Buses are charged only at night.
- Night + intermediate charge. Buses are charged mainly at night. However, some lines may experience a daytime charge between shifts to address limited range issues.

Table 1.
Advantages and disadvantages of depot charging.
Table 1.
Advantages and disadvantages of depot charging.
| ADVANTAGES | |
|---|---|
|
|
| DISADVANTAGES | |
|
|
Opportunity charge (Table 2. Advantages and Disadvantages): Under this scheme, the fleet’s charging operations are carried out at the depot itself and/or at additional points in the bus network. Typically, these additional charges are matched to bus stops or line headers/ends. The operational needs of the service are somewhat unrelated to the autonomy of the vehicles due to greater access to charging on the network. For this reason, smaller-capacity (and therefore cheaper) batteries can be used. However, as the number of battery charge cycles per year increases, the lifespan of the battery decreases.
Table 2.
Advantages and disadvantages of opportunity charging.
2.2. Chargers
Like vehicles, charging equipment manufacturers have consolidated their portfolios with a variety of products, primarily focusing on increasing power output and diversifying the technologies offered. Basically, there are two main types of chargers: column chargers, which are the ones that integrate all the components inside a container (mainly with cable connectors) and modular chargers that are made up of several units, a power module, and a connector (conductive or inductive) as central elements. The first approach to charging electric buses was to use column chargers that were normally supplied by the bus manufacturers themselves; however, in the interest of optimization, modular chargers are taking over and charging equipment manufacturers have taken a major role. This shift from individual charging columns to high-power modular chargers with multiple outlets has been seen in cities such as Amsterdam and Hamburg, which are currently at the forefront of electric public transport systems. High-power modules (above 150 kW) allow these modular systems that optimize space consumption as they allow several outputs to be connected to a single power module, space limitations being a common issue in depots throughout Europe.
Lately, power modules greater than 1MW have been introduced on the market. Nevertheless, although high-power modules bring many benefits, they also have their own drawbacks. In fact, even though charging powers are increasing, charging speeds are still limited as the maximum battery voltage and C-rate determine the minimum charge time required.
In addition, a great step has also been taken with the standardization of communication technologies and protocols, specifically ISO15118, IEC 61851, Oppcharge, or OCPP. In fact, standardization has proven to be essential in the expansion of electric fleets and the implementation of large-scale charging infrastructure systems.
Early pilots had a limited number of buses and chargers, so charging operations could be conducted mostly manually. However, with the introduction of opportunity charging and the improvement of electric fleets, automated charging becomes essential. For this, intelligent charging systems are paramount. These systems make it possible to monitor and control the power that is transferred to the vehicles in a way that optimizes operation and maintenance. For the transition to automated charging procedures, the selected charging technology or connector type plays a key role.
Regardless of the charging strategy, any available charging technology can be used. However, some charging technologies are better suited to certain strategies. For example, automatic quick-change technologies are more advantageous for opportunity charging than wire (cable) charging.
Multiple technologies have been developed for both electric cars and electric buses. However, the following are the most common for battery electric buses: (i) wire charging; (ii) induction charging, and (iii) contact charging, including traditional pantograph and inverted pantograph.
 | Wire charging |
This charging technology consists of a physical connection between the bus and the charger by means of a cable. It can be classified by the type of current that passes through the cable. In this sense, alternating current (AC) or direct current (DC) can be used. AC requires the vehicle to be equipped with an on-board inverter that converts current to DC (batteries run on DC), which adds weight to the bus (hence more power consumption) and complicates on-board electronic systems (more maintenance). On the other hand, when DC is used directly, the inverter is located inside the charger. AC is mainly used for private vehicles, as modern electric buses are shifting towards using DC, allowing safer and more efficient fast charging.
In addition to the cable, a connector is needed. The connectors provide a secure connection between the vehicle and the cable. The connector consists of a terminal for the different cables that are grouped within the main cable (phases, earth, neutral, proximity and communication). Wired charging has two main disadvantages: the need to plug in the connector manually and the lack of standardization of connectors. Regarding the latter, each manufacturer may have a different type of connector, so the chargers are not universal, that is, the connector would not work for all bus models. In the Table 3 is shown a SWOT analysis of wire charging
Table 3.
SWOT analysis of Wire Charging.
Despite being the most mature technology available, it has several shortcomings that have caused the need for operators to keep looking for better technology. The main limitation is the lack of standardization of the connectors, since the fleets are usually made up of several brands of buses. In addition, the need for a manual connection can lead to high personnel costs, increased electrical risks, and a lower efficiency of the charging procedure. These two problems outweigh the chargers’ lower cost and high efficiency.
This technology is recommended for small bus fleets, when there is a low proportion of electric buses in the entire fleet and when there is opportunity charging, so fast charging is conducted en-route.
 | Inductive charging |
This charging technology consists of a wireless connection between the charger and the vehicle based on magnetic induction where energy is exchanged between two pads, one located at the bottom of the bus floor and the other located on the ground. In this way, the pad located on the ground consists of several coils that transmit the electrical energy supplied to the receiver located on the pad bus. Therefore, a magnetic field is created that allows the bus to be charged.
Inductive charging can be conducted statically or dynamically. In the case of static charging, charging platforms are placed in bus parking lots, at bus stops, or at the head/end of the line.
In contrast, dynamic charging does not use a given parking spot; charging platforms are placed on the road along corridors. Dynamic charging is a semi-continuous technology similar to a trolleybus, so it allows for lower battery capacity, making buses lighter, more efficient, and cheaper. However, inductive dynamics requires a considerable amount of equipment on the road and implies a greater interaction with other road users. In the Table 4 is shown a SWOT analysis of inductive charging
Table 4.
SWOT analysis of Inductive Charging.
The main attraction of this technology is the absence of any type of physical connection between the charger and the bus, so there are less parts subject to failure and maintenance. Until today, in most cases, this technology has only been used as part of pilot tests, so its performance has not been tested under large-scale conditions. Considering how scarcely it has been implemented, the market for this type of technology is still very small, resulting in a lack of available solutions around the world.
Additionally, the electromagnetic field is generated by an alternating current, so the buses must be equipped with an inverter to transform from AC to DC to power the battery, lowering the overall charging efficiency.
EMT Madrid has implemented this technology as part of a pilot and has decided not to develop this technology further. The reason for this decision is that the technology is still not providing adequate performance for EMT Madrid operations, in addition to the limited availability of underground space in the city of Madrid.
CONTACT/CONDUCTIVE LOAD
This charging technology consists of the physical connection between the charger and the bus through a conductive element other than a cable. As a result of this somewhat open definition, there are different configurations. The most common are the traditional and the inverted pantograph.
 | Traditional pantograph or panto-up |
The traditional pantograph or “Panto Up” consists of a pantograph located on the roof of the bus. When the bus reaches its charging position, the pantograph is uplifted by means of internal hydraulic pumps until it is connected to a receiver. In the Table 5 is shown a SWOT analysis of iTraditional pantograph or panto-up.
Table 5.
SWOT analysis of Traditional pantograph or panto-up.
Pantographs have significant advantages over cable charging. They highlight the possibility of automating the charger-vehicle connection and the greater energy input capacity. On the other hand, this charging technology is more expensive.
In addition, the weight that the pantograph adds to the bus translates into higher energy consumption and lower passenger capacity. However, its biggest drawback is that the pantograph is continually exposed to the elements (rain, wind, dust, etc.) as well as vibrations and shocks due to rough roads, potholes, etc. This increases the risk of breakdown, and therefore the maintenance needs. Ultimately, a pantograph failure results in an inoperative bus, which can compromise the viability and service level of the operation.
 | Inverted pantograph or panto-down |
The inverted pantograph or “Panto-Down” consists of a pantograph located on a pylon or structure. When the bus reaches its charging position, the pantograph is downlifted by means of internal hydraulic pumps until it connects with a receiver located on the roof of the bus. In the Table 6 is shown a SWOT analysis of iTraditional invwrted pantograph or panto-down.
Table 6.
SWOT analysis of Traditional inverted pantograph or panto-down.
As mentioned, pantographs have significant advantages and some disadvantages over cable charging. In addition to that, inverted pantographs aim to solve some of the shortcomings of “Panto-Up” ones.
The list of strengths of this technology is remarkably long; however, one of the biggest advantages of inverted pantographs is that they are universal, requiring only a couple of connecting rods to be installed on top of buses. Thus, it enables a full decoupling of charging infrastructure and buses, allowing the implementation of new operating models.
The transfer of the pantograph from the vehicle to the tank represents a significant saving in weight in buses, which translates into better energy consumption. Since the weight of the pantograph is no longer a penalty, they can be designed to be stronger and larger if required.
Although few in number, they still have certain disadvantages. With a limited number of chargers, in the event of a breakdown, this can affect all vehicles on a given line. However, this is not a problem in the case of La Elipa since there will be one pantograph per bus. Therefore, in case of failure, other pantographs can be used under fast charging to charge more than one bus. Overall, this system is robust and even the risk of getting stuck in the “down” position can be overcome by ropes.
For the context of La Elipa OC, the main weakness is the lack of comparable experiences. This technology is still being introduced or is part of pilot projects, so its performance on a large scale has not yet been assured.
2.3. E-Buses
As mentioned above, PTOs or PTAs must first make a decision on the charging strategy and technology to use, and then compatible electric buses must be procured. Electric buses have improved very remarkably, not only in terms of performance but also reliability. Improved batteries have been the main trigger for some to finally switch to electric fleets. However, the contracting of electric buses is generally carried out through public tenders, so the final technical specifications of the vehicles depend on the proposals of the bidders and not all brands are able to meet the requirements to participate in all tenders. For example, the EMT Madrid currently has five different bus brands as a result of previous tenders. In Europe, different projects have helped the implementation of electric buses, such as ZeEUS: Zero Emission Urban Bus System. This project fostered market acceptance and prompted European bus manufacturers to introduce more electric vehicles into their portfolio. Overall, as the use of this technology becomes more common, the number of brands offering electric buses in the world is increasing and prices are decreasing. Having electric buses is a goal for almost every city in Europe and all around the world, considerably increasing the number of pilot projects and scaling e-buses in every city [5]. In 2015 there were 1000 e-buses operating in Europe [6] and more than double that in 2019, 2200 [5]. The Figure 1 presents the current number of e-buses in Europe and the forecast for the next 20 years worldwide, and the Table 7 shows the bus brands with electric buses in their catalogues
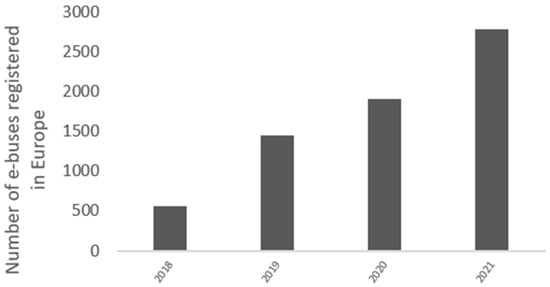
Figure 1.
Number of electric buses introduced in Europe (Based on: Sustainable Bus [7,8] and European Automobile Manufacturers Association [9,10].
Table 7.
Bus brands with electric buses in their catalogue. Based on: ZETI tool [11], ZeEUS [12] and ZEBRA [13].
In conclusion, there are a variety of charging technologies available on the market and each of them brings different benefits and limitations. There is no perfect technology, and therefore careful planning is essential to determine the most appropriate charging technology and power requirements to achieve the desired state of charge of the fleet based on the charging strategy that best suits individual operating and maintenance plans. Thus, PTOs and PTAs must choose the charging strategy and technology that best suits their operational needs at the start of operation and in the future and whenever possible, taking into account market trends.
In this sense, EMT Madrid has its own requirements and internal decisions based on its extensive experience in the operation of buses with all types of fuels, including electric buses. These requirements are: (i) the acquisition of buses and chargers must be decoupled; (ii) chargers must be “universal”, that is, interoperability must be guaranteed; (iii) chargers must be able to adjust input power and charge at high powers (>400kW); (iv) all buses will be charged at the depot; (v) charging operations must be automatic; and (vi) the charging infrastructure must be managed by a Smart Charging System. Consequently, the inverted pantograph is the technology that provides the most benefits and that best adapts to the needs and requirements of the company.
3. Benchmarking: International Experiences
There are some approaches analyzing sustainability strategies for sustainable mobility by bus for 10 cities [14]. In this section, several international experiences in the electrification of bus depots are analyzed. The main objective was to identify the actions carried out by other cities and transport operators in their search for a cleaner public transport sector, for which the electrification of the fleet is fundamental. For each new technology there is great uncertainty about its performance under real-life conditions, so learning from the successes and mistakes of others contributes to greater efficiency and optimization of a fleet electrification project.
In total, five cities, which appear located in the Figure 2, were chosen based on the following criteria:
- Geography
- Charging technology used
- Size and type of fleet
- Strategy for the electrification of the fleet
- International relevance
(In case there are several operators in the city, only one was analyzed).
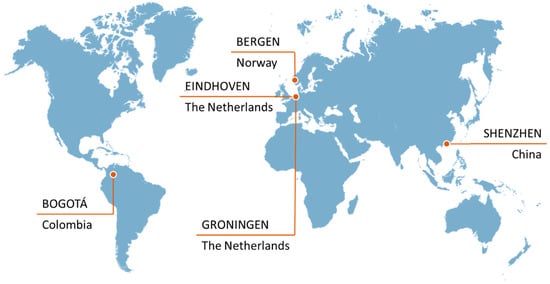
Figure 2.
Location of the cities selected for the identification of warehouse electrification experiences.
It should be noted that fleet electrification is a continuous process and the figures presented below may have suffered variations.
3.1. Asia—Shenzhen (China)
Shenzhen is a natural choice for any comparison of international experience, as this city is a pioneer with its 100% electric public transport system and the most experienced (12 years). The city began introducing electric buses in 2009 and has now become the first city to electrify 100% of its public buses [15].
Home to the Chinese manufacturer BYD, this brand represents around 80% of all electric buses in the city. Shenzhen electric bus system continuously sets the standard in electric bus operation, capacity range and charging strategy.
Shenzhen Bus Group (SBG) Company Limited operates a fleet of city and long-distance buses, minibuses and taxis. The company was founded in 2005 and is headquartered in Shenzhen, China.
Shenzhen Bus Group completed the electrification of its fleet in 2018, operating 6053 electric buses and 4681 electric taxis, becoming the world’s largest clean energy public transport operator. Taking a step forward, Shenzhen Bus Group is already testing and developing autonomous electric buses.
This company has chosen to change its routes so that each bus leaves from one depot and ends at a different one, with charging available at both depots. Shenzhen Bus Group has been one of the first to move from traditional depots to modern depots with additional facilities for its drivers.
Regarding the charging strategy, SBG (and the rest of the bus operators in Shenzhen) have opted for cable charging with 150kW, mostly overnight. The charging infrastructure system is outsourced; this third party even provides the staff to manually connect the bus to the charging point.
Shenzhen’s business model is characterized by “financial leasing, separation of vehicles and batteries, and integration of charging and maintenance.” Potevio Ltd. obtained the construction right and franchise for the new power charging facility in Shenzhen and became the operator of the vehicle charging facility in charge of operating and maintaining the vehicle charging service and batteries, as well as paying and managing electricity costs with Qihang Zhang Electric Company [16].
Main lessons learned:
- Bus depots need to be friendlier to their environment and to the people who work there, especially drivers.
- The bus lines need to be tightened slightly when the fleet is fully electrified.
- Solar power integration is a challenge as most charging is conducted overnight.
- Batteries have a lifespan of around 7–8 years, so their management needs to be planned from the start.
3.2. America—Bogotá (Colombia)
After Chile, Colombia is the country in Latin America with the largest number of electric buses and will continue to grow with the introduction of new 100% electric public transport concessions. In general, TRANSMILENIO, the administrative entity of public transport in Bogotá, is carrying out an electrification of the fleet in coordination with the renewal of the concessions.
In particular, the first complete electrical depot (Fontibón I) will be analyzed, which has already accumulated significant experience so far. Gran Américas (Fontibón bus operator) operates a fleet of 120 buses of two different types: 60 Padrón (12 m) and 60 Busetón (9 m). This fleet will serve nine lines in a specific area of Bogotá, including the airport area.
In this case, Gran Américas has contracted the maintenance of the fleet during the first year of operation. Under this contract, BYD provides maintenance staff and skills development for the operator’s maintenance team.
Gran Américas has opted for depot slow overnight charging with 75 kW if two buses are connected to the charging post and 150 kW if only one bus is connected to the double connector post.
TRANSMILENIO’s business models have changed in recent years. However, the most recent and chosen for the electric fleet is the separation of operation and storage provision in two different contracts. The depot provider is in charge of acquiring the land on which the depot is built and installing and maintaining the charging infrastructure. However, it is the operator who is responsible for contracting the electric company and paying for the electricity, as well as installing a backup power system.
Lessons learned:
- Energy losses were significant (reactive power is close to 10%).
- Electric buses require less maintenance and were easier to maintain than initially expected.
- It is of the utmost importance to adhere to the manufacturer’s specifications.
- The energy efficiency of the electric bus was as expected.
- Bus availability was over 80%
3.3. Europe
Three European cities were selected because of their conditions, available knowledge, and resources (materials, manufacturers, etc.). In particular, Bergen in Norway was selected as this country has been at the forefront of electric mobility since 2010, albeit mainly in private vehicles. On the other hand, the Netherlands has taken the lead in electrifying its public transport, so two cities were selected: Eindhoven and Groningen.
3.3.1. Bergen (Norway)
Despite the wide global adoption of private electric vehicles in Norway, the country has not followed the same trend in terms of public transport.
At the end of 2020, Bergen introduced a 100% fossil fuel-free bus network fleet, with 102 electric vehicles (eighty-eight 12 m buses and fourteen 15 m buses) running only on renewable resources [17].
This massive fleet upgrade involved an upgrade of Bergen’s Mannsverk bus station to allocate 48 double charging points.
Keolis, Bergen’s bus operator, was awarded a private contract for the MOBILEcharge charging management system [18]. MOBILEcharge not only controls the connection and charging time, but also has a monitoring function to ensure that Keolis Norge at Depot Mannsverk always has a complete overview and control of the entire charging infrastructure and that the network is ready for burden. In addition, this system is integrated with the operation control software to guarantee real-time monitoring of the state of charge of each vehicle, as well as the efficiency of the vehicle.
Bergen’s current business model allows Skyss, Bergen’s public transport authority, to award Keolis Norge an electric bus operation contract. This 9.5-year bus contract includes the operation and maintenance of the Keolis electric buses. In this way, to have control over the charging process, Keolis used an intelligent charging management system called MOBILEcharge from CarMedialab of INIT Group that helps the bus operator to manage the bus charging process. This means that Keolis has full control over the charging infrastructure.
Lessons learned:
- Charging management is a key element in optimizing operations and operating costs.
- Smart management can provide additional services such as bus heating for colder climates or cooling for warmer temperatures.
- The state of charge must be integrated into the operation control.
3.3.2. Eindhoven (The Netherlands)
Following the Netherlands’ ambition to achieve zero-emission public transport by 2025, the city of Eindhoven, together with the international operator Transdev, has advanced the implementation of 43 articulated electric buses. An additional 160 electric buses are planned by 2024.
Connexxion/Transdev partnered with charging infrastructure company Heliox to install charging infrastructure consisting of roof-mounted pantographs and contactor gantries.
In North Brabant, the province where Eindhoven is located, the business model is based on transferring the operation of public transport to commercial companies. Thus, the operation of public buses is divided into two main actors: the North Brabant government, which oversees the procurement and public bidding of the operator, and a private sector operator, which is responsible for operating the buses and maintaining the rolling stock.
The Eindhoven experience, a pioneer in Europe, has been replicated in places such as the Amsterdam Schiphol Airport area, demonstrating the need to take advantage of existing experiences due to the novelty of the electric bus market.
Lessons learned:
- A one-for-one replacement (an e-bus replacing a diesel) does not work; the operation needs to be redefined.
- Traffic conditions and cold weather can reduce the range by 25% (approx.), so intermediate charging may be required.
- Depots close to the city center can ease range anxiety and ensure smooth operation.
- The energy of the rail transport network could be harnessed.
- Battery temperature is an important parameter when choosing fast-charging and air-cooled batteries.
3.3.3. Groningen (The Netherlands)
Groningen and Drenthe (same concession) are by far the most electrified provinces in terms of public bus transport in the Netherlands with 164 electric buses. This concession has a significant number of regional routes, so greater distances are traveled, and an opportunity charge is needed to ensure the technical viability of the operation.
Although electric buses are doing well, the operator is now introducing hydrogen fuel-cell buses for larger routes. The objective is to show the compatibility of the technologies within a deposit and to maximize the operation.
On the basis that all bus contracts are awarded as a concession, the business model for electric buses is awarded in the Groningen/Drenthe concession. In this case, the public transport operator that won the concession and supervises the operation is Qbuzz, which is in charge of operating the buses and supplying the charging stations.
Learned lessons:
- Interoperability between multiple bus brands was a key requirement for the charging infrastructure.
- Batteries are reliable. Manufacturers’ technical specifications can be taken for granted.
- Some special technical specifications must be agreed on with manufacturers depending on charging operations, tank design, etc, for example, the location of the connector.
- Long routes need opportunity charging or new technologies such as H2.
4. Total Cost of Ownership (TCO)
As cities around the world migrate to electric fleets, there are an increasing number of PTOs and PTAs amassing data and insights that contribute to understanding start-up and operating costs. Differences in costs between operations in various countries may be due not only to investment costs or energy consumption, but also to a host of underlying costs that are highly dependent on charging technology, operating characteristics, availability of spare parts supply, warehouse costs, labor costs, and other additional costs of the local context.
The Total Cost of Ownership (TCO) methodology is typically used to help bus owners, PTOs, and PTAs determine the direct and indirect costs of owning and operating that vehicle or transportation system [19,20]. Evaluating TCO helps identify the costs of acquiring, operating, maintaining, and disposing of a product over time. The TCO analysis includes the purchase price of an asset, adding the costs of operation, maintenance, and any other financial cost during its life cycle [21,22]. In addition to financial costs, a TCO analysis may consider economic costs involving monetary expenditures from greenhouse gas emissions, local air pollutants, and noise pollution.
The total cost over the lifetime of the e-bus depends on local or national operating customs and accounting methods, as these items may vary from place to place. The TCO allows estimating the trade-offs that exist in each unique situation for each city. Investment and operational planning based on a TCO approach allows PTOs and PTAs to plan to improve factors that represent an opportunity to outperform other bus technologies (Diesel, CNG, LNG, etc.)
A TCO is usually reflected on a cost-per-km basis (i.e., an operating plan is needed to calculate the TCO) and can be in monthly or yearly periods. What is included in the TCO may vary; for example, some cities and organizations may include charging infrastructure and/or financing costs, while others may not. However, there are three (3) general categories that include the different items that can be evaluated in the TCO: CAPEX Costs, OPEX Costs, and Economic Costs (social and environmental). These are explained in more detail in Table 8.
Table 8.
Total cost of ownership categories (based on IDOM and ITDP [23]).
The capital investments (CAPEX), the operating costs (OPEX), the monetized economic costs, and the useful life cycle of the various types of internal combustion buses and electric motors are analyzed for the different combinations of charging technologies and charging strategies. burden. Capital expenditures (CAPEX) include vehicle costs and infrastructure acquisition costs (including all purchase taxes), as well as financing costs over the entire period of the debt in case a loan has been used. The sale value of the vehicle at the end of its useful life is also included to take into account the residual value of the bus and the battery. Operating expenses (OPEX) include costs over the life of the vehicle, including energy costs, vehicle maintenance, and other expenses such as insurance and periodic tire (or wheel) changes every certain number of kilometers.
TCO evaluations are useful for comparison purposes. It is possible to compare between charging technologies (e.g., plug-in or cable charging vs. inductive charging) or between charging strategies (e.g., depot charging vs. opportunity charging), as these options entail different economic and financial impacts. To develop a robust comparison based on the TCO methodology, the following aspects and possible variations should be considered:
- ▪
- A number of buses that meet the same operational needs must be assigned for each charging technology or charging strategy.
- ▪
- The lifetime of the e-bus must remain constant
- ▪
- Battery life may vary
- ▪
- Number of chargers
- ▪
- Accounting and tax regime
- ▪
- Electric bus performance (motor efficiency) that depends on:
- ○
- Vehicle occupancy
- ○
- Air conditioning
A small variation in these parameters can affect the TCO of e-bus operations, which explains the possible differences in TCO that can exist between two countries, even if they share similar charging technologies and operating plans. Some publications have presented a comparison between different technologies (CNG, hydrogen, diesel, and electric) considering the previous elements [19,24,25].
Table 9 shows data related to some publications on TCO.
Table 9.
TCO of different bus technologies based on literature referenced.
Final considerations of the TCO:
- The goal of the TCO concept is to have a defined and shared TCO method (a “common language”) for all stakeholders in an e-bus project and to provide a comparable metric for different PTOs and PTAs around the world.
- It is critical to note that TCO assessments can vary between locations, as the distribution of costs can be quite different.
- The TCO approach allows PTOs and PTAs to assess the full life cycle costs of different technologies and charging strategies that are available in the local market, avoiding ruling out an option due to its high initial cost.
- TCO analysis evidences that more expensive charging technologies, such as conductive and inductive charging infrastructure, have lower costs over time when the number of kilometers is maximized, as they have lower labor costs per kilometer.
- Lower electricity costs can also make a difference over time between charging technologies despite higher initial costs. Energy consumption savings increase when using a bus.
- Social and economic benefits can be compared between charging technologies, including well-to-tank emissions, as power generation can vary depending on the type and location of charging infrastructure to be installed.
5. Case Study: Charging Modalities in EMT of Madrid: Carabanchel Depot
Of the entire electric fleet indicated in the introduction of 331 buses in 2023, 280 of them will correspond to the Carabanchel Operations Center (hereinafter Carabanchel OC), in which three charging infrastructures, different in concept and technology, will coexist from 2022 onwards. The experience that will be obtained from these different charging infrastructures will allow EMT Madrid to set the most optimal and flexible model for the electrification of 100% of the fleet in the following years.
EMT Madrid currently uses or plans to use in its Carabanchel Operations Center almost all of those existing solutions on the market.
5.1. Fast Induction Charging
Fast induction charging is carried out at the two headings of one of the bus lines that provide service in the south of Madrid (L76) and where up to five vehicles carry out charging by opportunity throughout the day, charging by cable at night in Carabanchel OC. In Figure 3 pictures of induction charging are shown
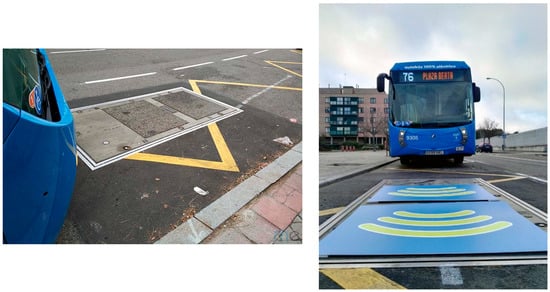
Figure 3.
Pictures of induction charging in the street: line 76 (Madrid).
The EMT Madrid induction line arises as part of a pilot project where the retrofitting of five hybrid buses from CNG to electric was carried out in 2018. These are vehicles that have a certain limitation of energy storage on board and whose consumption is approximately 1 kWh/km. During operation throughout the day, they carry out opportunity charging by induction at a maximum power of 100 KW at the head of the line. At night they charge by cable in the Operations Center.
This project involved an investment of €471,494 for the acquisition and €366,344.54 for the bus-charging infrastructure.
5.2. Wired Charging
In addition to the five buses of the induction line and the CNG hybrids, which charge at night in the Operations Center, there are currently 63 buses of 12 m lenght buses and 25 electric minibuses (6 m) whose charging systems are carried out by cable, but that have charging infrastructures with different characteristics:
- The one corresponding to conventional 12 m buses made up of chargers with powers between 100 and 120 kW. In Figure 4 pictures of them are shown
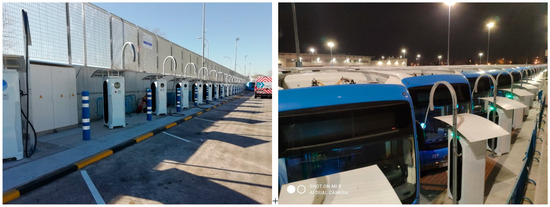 Figure 4. Pictures of wired charging in Carabanchel OC (Madrid), funded by FEDER funds, EU.
- The one corresponding to electric minibuses that has 80 kW chargers
Both infrastructures are powered by a 15 kV electrical supply and by 15 kV/400 V transformers with between 2000 and 2500 kVA power, distributing the low voltage by channeling in a gallery or tray complemented by the existence of line protections through several General and Secondary Tables.
The investments corresponding to this type of charging are as follows:
- ○
- For 12 m buses, €550,050 for purchase and €50,876.48 for charging infrastructure for each bus
- ○
- For electric minibuses, €242,212.50 for acquisition and €48,938.60 for infrastructure for each bus. In Figure 5 pictures of them are shown
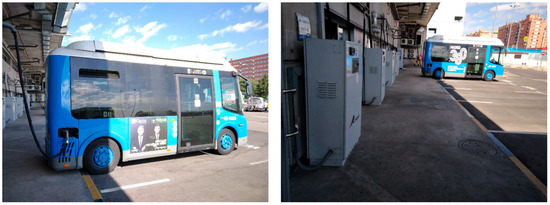 Figure 5. Pictures of wired charging for minibuses in Carabanchel OC (Madrid).
5.3. Inverted Pantograph Charging
Additionally, work is being carried out to define the electrical infrastructure for charging by inverted pantograph through two phases, i.e., a first for the implementation of 52 charging points for 50 buses that are arriving in 2022, and a second that is intended to be replicated in 2023 consisting of 118 charging points for another 150 buses of 12 m lenght electric buses planned for that year.
This will mean having a total of 233 compatible charging points (63 per socket and 170 per pantograph) for a total of 250 buses of 12 m lenght buses by the end of 2023.
As general characteristics, these are electrical infrastructures where the energy supply is carried out at 400 V through underground transformation transformers, 15 kV/400 V and 2500 KVA of power (six in total, one for every 25 buses approximately). The distribution in low voltage is carried out by means of hanging prefabricated trunking (blindosbarra) capable of distributing up to 4000 A.
As it is necessary to support the inverted pantographs, the execution of a canopy in two heights is planned, the first one for support and anchoring of the pantographs and the armored bar, which also serves to protect the buses against climatological agents, extending their useful life, and a second one to house the charging equipment that will feed the pantographs. The entire surface of the canopy will be used for the installation of photovoltaic panels that will allow the residual charge that is carried out during the day to be through self-consumption. The power of the photovoltaic installation will be approximately 300 kW for every 50 places electrified by pantograph (more than 1000 kW in total).
At a particular level, the infrastructures of each of the phases differ in the maximum power to be supplied to each of the pantographs by the charging equipment, as well as their layout.
In phase 1, designed for 52 buses, there is a charger or pantograph charging equipment with a maximum power available in the installation of up to 275 KW (400 A) per bus individually, and a charging power of between 80 and 100 kW per bus for all 52 points charging at the same time.
For phase 2, it is planned to have charging equipment for several pantographs so that the maximum power of the charging equipment can be given to just one of the pantographs or buses or distributed among all the units it feeds. The minimum power to be able to supply a single pantograph will be 300 kW and the minimum to be supplied with all the vehicles associated with that charging equipment, charging simultaneously, will be 75 kW. The maximum power of the equipment will not exceed 720 kW.
Both solutions allow the possibility of having multipurpose points in the Operations Center that allow slow or uniform charging for 2–3 hours at night, where the electricity rate is cheaper, and also allow fast charging at any of the points so that emergency situations, unforeseen events, or service needs can be dealt with. In the Figure 6 and Figure 7 some Real designs of the infrastructure are shown.
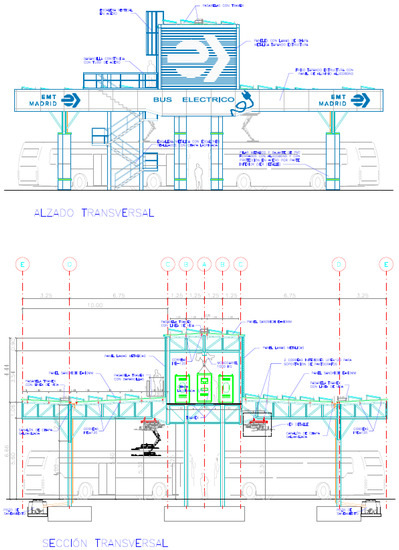
Figure 6.
Real designs of inverted pantographs under construction for 25 buses of 12 m lenght e-buses in Carabanchel OC (Madrid).
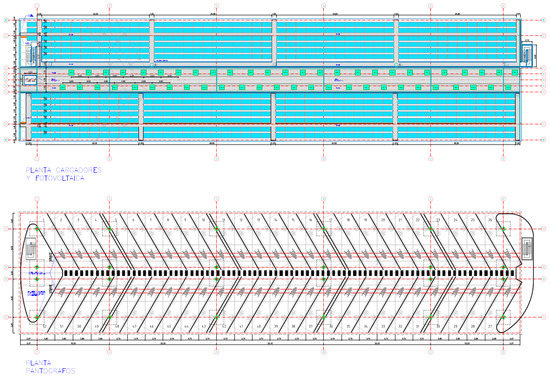
Figure 7.
Distribution of inverted pantographs under construction for 25 buses of 12 m lenght e-buses in Carabanchel OC (Madrid).
The planned investment in this mode of charging in execution will be:
- €540,960 for purchase and €93,629.57 for charging infrastructure for each bbus.
In Table 10 a summary of actual charge systems is shown
Table 10.
Summary of actual charge systems in Carabanchel OC.
6. TCO EMT of Madrid
Based on the cost of the electrical infrastructure previously exposed based on the charging modes, the data for the total cost of ownership (TCO) of EMT Madrid are shown below based on the fuel used and considering a useful life of the vehicles of 10 years, which is about 500,000 km. In Figure 8 TCO of EMT is shown compared with other TCO publications
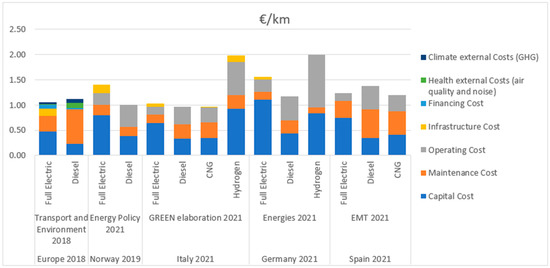
Figure 8.
TCO of EMT of Madrid compared with other TCO publications.
Additionally, the environmental impact of each of the technologies must be taken into account, in which the electric modality totally eliminates the local emission of NOx, CO2, and particle matter.
The charging strategy shown in this case study has allowed EMT to design fully optimized charging infrastructures, with simultaneity coefficients that are not very high, avoiding the creation of oversized and consequently more expensive infrastructures. In order to charge with these characteristics, an intelligent charging system “Smart Charging” is essential to manage the charging process based on the different objectives that are to be achieved during said process, which are detailed below and which EMT Madrid explored in its studies:
- ○
- Minimum power per bus (increased battery life). Based on the available charging time per bus, the buses are charged with the minimum energy input. In this way, the maximum power peak in the electrical network is reduced since all the available charging time is used. However, a smart charging strategy can introduce changes in power input based on other variables, such as the cost of contingencies. Changes in power input do not affect battery health, as long as the power is medium to low.
- ○
- Maximum fleet availability. Configure the charging process so that at a certain time all the buses are loaded regardless of their departure time. This increases the power needed and the charging power of each battery but reduces the risk of a bus not being available at the required time.
- ○
- Cost reduction. Optimize the charging schedule based on energy costs. This strategy allows buses to be charged at low-energy-cost schedules, seeking the optimal point between schedules, electricity rates, and necessary power.
- ○
- Balance. This strategy combines charging power, availability, and least-cost strategies. The buses are charged in hours of low energy cost with an available power higher than the strictly necessary and which allows the buses to be safely charged well in advance of their departure time.
Each of these strategies is considered feasible in EMT Madrid, since there is one charging point per bus; any other option would lead to a maximum power charging strategy available in each charger with more than one vehicle during the entire bus availability period. in the bus depot.
7. Conclusions
Overall, the following points can be drawn as a conclusion:
The best charging technology depends on operational needs. There is no single solution and each bus company will study the one that best suits their needs. According to the analysis, the most innovative cities choose solutions with a combination of pantographs and cable.
- ▪
- According to international experience, the greater the number of kilometers travelled, the greater the benefits of pantograph-type solutions.
- ▪
- A combination of technologies can be used to optimize resources, so a charging strategy should be designed before implementation.
- ▪
- The choice of charging technology should be based on the maturity of the market. It is important to know the existing solutions in the market.
- ▪
- European countries are, in general, betting on a combination of slow overnight charging and fast opportunity, so the combination of cable charging and pantographs has proven to be the most appropriate technological solution. It is important to note here that the pantograph solution provides better forms of automation, while the cable needs a person to plug in the connection, which could increase costs.
- ▪
- The mix of charging technologies requires interoperable interfaces and system integration, which complicates the implementation of the charging infrastructure by the bus company itself.
- ▪
- In most cases, the installation and maintenance of the charging infrastructure has been contracted separately from the main contract (either depot construction, operation, or other).
- ▪
- In some cases, the batteries are managed in installment contracts. However, as bus manufacturers are the main manufacturers of batteries, it is common for them to be purchased together with buses under a single contract with extended warranty to account for one battery replacement during the entire life cycle of the buses. In this way, the operator will not need to make any additional investment to purchase the vehicle.
- ▪
- Electric buses work as a complete system. We need systems integration (IT, vehicles, chargers, etc.). Procurement procedures need to change as we need to think about our operation and collection strategy.
- ▪
- IT is as strategic as infrastructure and must be integrated into the operation.
- ▪
- Close collaboration with all partners is key to ensuring interoperability. In particular, communication with industry and manufacturers is of paramount importance to follow the latest technology and avoid the risk of obsolescence. The maintenance of the infrastructure and the charging protocol and innovation become essential.
- ▪
- Bus and charging infrastructure manufacturers are providing technical assistance, as there is still a lack of general technical knowledge.
- ▪
- Some operational changes are needed. For example: slight modifications in routes and frequencies can ensure the viability of a 100% electric fleet with current technology.
- ▪
- Bus depots need to be friendlier to their environment and to the people who work there, especially drivers. By eliminating the externalities caused by fossil fuel buses (noise, oil leaks, etc.), new architectural opportunities arise to integrate bus depots into the urban environment (including buildings) and ever-growing cities.
- ▪
- The goal of the TCO concept is to have a defined and shared TCO method (a “common language”) for all stakeholders in an electric bus project and to provide a comparable metric for different PTOs and PTAs around the world.
- ▪
- Particularly in EMT Madrid, electric mobility is considered to be somehow consolidated for the present. Despite the fact that it is hard to come by with reliable data, and even though the main TCO is not favorable, the climate change and air quality challenge is a justification in itself for choosing the electric motor as the most suitable for public bus transport in the city of Madrid.
- ▪
- Based on the exposed analysis of the different electric charging modalities, and the characteristics, benefits, and experience of EMT Madrid in each one of them, EMT Madrid considers that:
- ○
- Inductive or opportunity charging should not be further developed because the technology is not providing adequate performance for EMT operations, in addition to the limited availability of space on public roads and the difficulty of setting underground infrastructure in the city of Madrid, and also due to the lack of versatility of this type of charging against external agents, mainly events, which affect daily operations and bus routes in Madrid.
- ○
- Cable charging is a good solution for EMT due to the large number of bus manufacturers that support this solution.
- ○
- Charging by pantograph at the bus depot, especially since the advancement of electric mobility technology in recent years, which makes it possible to start having electric urban buses with autonomy characteristics that can be used on practically all the bus lines it operates, is considered the most optimal battery charging model, being susceptible to optimization and improvement through overnight charging by pantograph with intelligent management of the infrastructure to minimize the amount of power.
- ○
- With a limited number of pantographs, such as in fast street pantograph charging, a breakdown can affect all vehicles on a given line. However, this is not a problem in the case of the EMT Madrid since there will be one pantograph per bus at the depots. Therefore, in case of failure, other pantographs can be used under fast charging to charge more than one bus.
- ▪
- The design of the charging infrastructure that EMT Madrid is carrying out has been dimensioned based on an analysis of the energy demand and charging availability schedules per vehicle and with a charging strategy to be carried out during the maximum possible hours at the lowest possible power, with the aim of extending the useful life of the batteries, establishing a maximum power demand as low as possible, and distributing the load in the hours when the cost of electricity consumption is much lower.
To conclude, in the words of Joseph Ma, Deputy General Manager of Shenzhen Bus Group: “Buying the buses is one thing, but electrification requires you to change your entire business model and network”.
Author Contributions
Conceptualization, I.L. and G.F.-S.; methodology, F.B., I.L. and G.F.-S.; validation, C.S., P.L.C., R.C. and C.O.C.; formal analysis, I.L., F.B. and R.C.; investigation, C.d.J., D.R., F.B., I.L. and G.F.-S.; resources, I.L. and G.F.-S.; writing—original draft preparation, I.L., F.B., C.d.J., D.R. and G.F.-S.; supervision, C.S., R.C. and P.L.C. All authors have read and agreed to the published version of the manuscript.
Funding
This research received no external funding but the execution of the infrastructure projects and the e-buses were founded by Municipality of Madrid, by FEDER EU funds and NextGen EU funds through Minister of Transport, Mobility and Urban Agenda of Spain.
Institutional Review Board Statement
Not applicable.
Informed Consent Statement
Not applicable.
Acknowledgments
Special thanks to EMT for sharing real information about the projects and the operation and all employees involved as the main operator in Madrid. Also to IDOM as an international company expert in Sustainable Mobility & Transport.
Conflicts of Interest
The authors declare no conflict of interest.
References
- Cascajo, R.; Monzon, A. Assessment of innovative measures implemented in European bus systems using key performance indicators. Public Transp. 2014, 6, 257–282. [Google Scholar] [CrossRef]
- Wang, S.; Lu, C.; Liu, C.; Zhou, Y.; Bi, J.; Zhao, X. Understanding the Energy Consumption of Battery Electric Buses in Urban Public Transport System. Sustainability 2020, 12, 10007. [Google Scholar] [CrossRef]
- Fernández-Sánchez, G.; Terrón, J.A.; Fernández, A. Evolution Towards a Sustainable Public Transport in the City of Madrid. Chapter 2. In Sustainable Mobility; Llamas, B., Ortega, M.F., And Sillero, E., Eds.; Intechopen: London, UK, 2020. [Google Scholar]
- Kim, H.; Hartmann, N.; Zeller, M.; Luise, R.; Soylu, T. Comparative TCO Analysis of Battery Electric and Hydrogen Fuel Cell Buses for Public Transport System in Small and Midsize Cities. Energies 2021, 14, 4384. [Google Scholar] [CrossRef]
- Thorne, R.J.; Hovi, I.B.; Figenbaum, E.; Pinchasik, D.R.; Amundsen, A.H.; Hagman, R. Facilitating adoption of electric buses through policy: Learnings from a trial in Norway. Energy Policy 2021, 155, 112310. [Google Scholar] [CrossRef]
- Bakker, S.; Konings, R. The transition to zero-emissions buses in public transport—The need for institutional innovation. Transport. Res. Transp. Environ. 2018, 64, 204–215. [Google Scholar]
- Sustainable Bus. 2019. Available online: https://www.sustainable-bus.com/news/5-per-cent-of-city-buses-registered-in-2018-in-europe-were-electric-buses/ (accessed on 22 April 2022).
- Sustainable Bus. 2022. Available online: https://www.sustainable-bus.com/news/eu-electric-bus-market-2021/ (accessed on 22 April 2022).
- European Association of Automobile Manufacturers. 2021. Available online: https://www.acea.auto/files/ACEA_buses_by_fuel_type_full-year_2020.pdf (accessed on 22 April 2022).
- Statista. 2022. Available online: https://www.statista.com/statistics/577685/forecast-for-global-transit-bus-sales/ (accessed on 11 May 2022).
- Zero Emissions Technology Inventory Tool (ZETI). 2020. Available online: https://globaldrivetozero.org/tools/zero-emission-technology-inventory/ (accessed on 2 November 2021).
- Zero Emissions Urban Bus System (ZeEUS). 2018. Available online: https://zeeus.eu/ (accessed on 2 November 2021).
- Zero Emission Bus Rapid Deployment Accelerator (ZEBRA). 2019. Available online: https://www.c40.org/what-we-do/scaling-up-climate-action/transportation/zero-emission-rapid-deployment-accelerator-zebra-partnership/ (accessed on 2 November 2021).
- Fernández-Sánchez, G.; Fernández, A. Strategic Thinking for Sustainability: A Review of 10 Strategies for Sustainable Mobility by Bus for Cities. Sustainability 2018, 10, 4282. [Google Scholar] [CrossRef]
- Bloomberg City Lab. 2018. Available online: https://www.bloomberg.com/news/articles/2018-05-08/in-china-shenzhen-electrified-its-entire-bus-fleet (accessed on 22 June 2021).
- Zhang, Q. Analysis of the “Shenzhen Model” for the Promotion of New Energy Vehicles in Public Transport. In Proceedings of the IOP Conference Series, Earth and Environmental Science, Moscow, Russia, 27 May–6 June 2019. [Google Scholar]
- Keolis. 2020. Available online: https://www.keolis.co.uk/2020/keolis-begin-operating-large-100-fossil-free-bus-network-in-bergen/ (accessed on 22 June 2021).
- Marketscreener. 2021. Available online: https://www.marketscreener.com/quote/stock/INIT-INNOVATION-IN-TRAFFI-451128/news/init-innovation-in-traffic-nbsp-Lighthouse-project-for-electric-mobility-in-public-transport-32235772/ (accessed on 22 June 2021).
- Basma, H.; Haddad, M.; Mansour, C.; Nemer, M.; Stabat, P. Evaluation of the techno-economic performance of battery electric buses: Case study of a bus line in Paris. Res. Transp. Econ. 2022, 101207, in press. [Google Scholar] [CrossRef]
- Onat, N.; Ahmed Khan, M.J. Total Cost of Ownership Framework for Procurement of buses used in Public Transportation. In Proceedings of the International Conference on Industrial Engineering and Operations Management, Istanbul, Turkey, 7–10 March 2022. [Google Scholar]
- IFC and World Bank. 2020. Available online: https://www.ifc.org/wps/wcm/connect/2feab98d-96de-4bb9-a03c-85e3a9793c5a/IFC-TransportNotes-FuzzyMath-final.pdf?MOD=AJPERES&CVID=m-Ln.tz (accessed on 17 May 2022).
- Szumska, E.M.; Pawelczyk, M.; Jurecky, R. Total Cost of Ownership analysis and energy efficiency of electric, hybrid and conventional urban buses. Eksploatacja i Niezawodność 2022, 24, 7–14. [Google Scholar] [CrossRef]
- ITDP. From Santiago to Shenzhen: How Electric Buses Move Cities. 2021. Available online: https://www.itdp.org/publication/from-santiago-to-shenzhen-how-electric-buses-are-moving-cities/ (accessed on 17 May 2022).
- Topal, O.; Nakir, Ï. Total Cost of Ownership Based Economic Analysis of Diesel, CNG and Electric Bus Concepts for the Public Transport in Istanbul City. Energies 2018, 11, 2369. [Google Scholar] [CrossRef]
- Jefferies, D.; Göhlich, D. A Comprehensive TCO Evaluation Method for Electric Bus Systems Based on Discrete-Event Simulation Including Bus Scheduling and Charging Infrastructure Optimisation. World Electr. Veh. J. 2020, 11, 56. [Google Scholar]
- European Bank for Reconstruction and Development (EBRD). Policy Paper. Going Electric—A Pathway to Zero-Emission Buses. 2021. [Google Scholar]
- Transport and Environment. 2018. Available online: https://www.transportenvironment.org/discover/just-one-10-urban-buses-sold-europe-now-fully-electric-analysis/ (accessed on 2 November 2021).
- Green. Scenari e Prospettive dell’ Elettrificazione del Trasporto Pubblico su Strada. Un’ Innovativa Analisi de Benchmark: II TCRO—Total Cost and Revenues of Ownership nel Mercato Italiano; Università Bocconi: Milano, Italy; GREEN: Milano, Italy, 2021. [Google Scholar]
Publisher’s Note: MDPI stays neutral with regard to jurisdictional claims in published maps and institutional affiliations. |
© 2022 by the authors. Licensee MDPI, Basel, Switzerland. This article is an open access article distributed under the terms and conditions of the Creative Commons Attribution (CC BY) license (https://creativecommons.org/licenses/by/4.0/).