Abstract
We investigated the effective use of cross-flow wind turbines for small-scale wind power generation to increase the output power by using a casing, which is a kind of wind-collecting device, composed of three flow deflector plates having the shape of a circular-arc airfoil. Drag-type vertical-axis wind turbines have an undesirable part of about half of the swept area where the inflow of wind results in low output performance. To solve this problem, we devised a casing consisting of three flow deflector plates, two of which were to block the unwanted inflow of wind and the remaining flow deflector plate having an angle of attack with respect to the wind direction to increase the flow toward the rotor. In this study, output performance experiments using a wind tunnel and numerical fluid analysis were conducted on a cross-flow wind turbine with three flow deflector plates to evaluate the effectiveness of the casing on output performance improvement. As a result, it was confirmed that the casing could improve the output performance of the cross-flow wind turbine by approximately 60% at the maximum performance point and could also maintain the output performance about 50% higher compared to the bare cross-flow wind turbine without the casing within a deviation angle of ±10 degrees, even when the casing direction was inclined against the wind direction due to changes in wind direction.
1. Introduction
For the type of wind turbine [1], wind turbines are classified by the difference in fluid force acting on the wind turbine blade into lift-type wind turbines and drag-type wind turbines. The propeller-type wind turbines, which can be seen everywhere, are representative of lift-type wind turbines. Other lift-type wind turbines include the Darrieus wind turbine. On the other hand, Savonius wind turbines and the cross-flow wind turbines are representative of drag-type wind turbines. Furthermore, wind turbines can also be classified by the relationship between the direction of wind and the direction of rotor axis into horizontal-axis wind turbine (HAWTs) and vertical-axis wind turbine (VAWTs). The propeller-type wind turbine is a kind of HAWT and Darrieus wind turbine, and the Savonius wind turbine and cross-flow wind turbine are classified into VAWT. Lift-type wind turbines have the advantages of high rotating speed and high output so these are widely used, while drag-type wind turbines have not been widely used because of the disadvantages of low speed and low output. However, VAWTs such as the Savonius wind turbine and the cross-flow wind turbine do not require yaw control, and therefore have a simple structure and are less affected by changes in wind direction.
In addition, the usage of wind turbines for power generation began in Denmark. In the 1890s, Poul La Cour incorporated aerodynamic design principles in the blade design of the wind turbine [2]. For a while after that, wind power generation was far from being a successful business. After the oil crisis of the 1970s, the development and introduction of wind turbines were vigorously promoted mainly in Europe and United States. Now, the movement toward decarbonization due to global warming is accelerating the use of wind energy.
Despite such circumstances, Japan is an island nation with many mountainous regions, so the land areas where large-scale wind power generation is feasible are limited in Japan. Therefore, offshore wind power generation is expected as a promising technology, and various studies are being conducted to introduce it [3]. In addition, the Agency for Natural Resources and Energy has proposed a vigorous and strategic target for the introduction of the wind power generation of 30% of the total domestic power generation capacity requiring approximately 130 GW of the installed capacity [4]. In order to achieve the goal, the spread of medium- and small-scale wind power generation is also needed. In particular, medium- and small-scale wind power generation is expected to be used in urban and mountain areas where wind conditions, such as wind direction and speed, are highly variable, so it is expected that not only horizontal propeller-type wind turbines but also vertical Darrius, Savonius, and the cross-flow wind turbine will be used. However, as mentioned above, Savonius and the cross-flow wind turbine have a disadvantage of low power output in spite of the advantage of low starting torque, so the output performance of these wind turbines needs to be improved. For these reasons, we began our study on the output performance improvement for the cross-flow wind turbines.
As shown in Figure 1 and Figure 2, a cross-flow wind turbine consists of many small blades which are arranged in a circle, and the structure is simple. In Japan, relatively many studies on the cross-flow wind turbine have been conducted. Ushiyama et al. [5] and Tan et al. [6] studied the relations between the design factors, such as the number of blades and blade pitch angle, and the wind turbine performance. Additionally, we conducted similar studies using a cross-flow wind turbine with a diameter of 114 mm; as a result, it was shown that the optimal solidity and blade pitch angle are σ = 0.76 and β = 45°, respectively [7]. Moreover, we studied upscaling of cross-flow wind turbines using scale-up models with a 1.5 times larger diameter [8]. Two types of the cross-flow wind turbine of which the solidity and the blade pitch angle were same but the size of the blade airfoil and the number of blades were different were investigated, and it was confirmed that the output performance characteristics of three types of cross-flow wind turbines including the wind turbine with a diameter of 114 mm were almost equivalent. In any case, all of the studies for cross-flow wind turbines described here [5,6,7,8] have shown that the maximum power coefficient is as low as about 0.1, and these results indicate the necessity to devise some way to achieve higher output performance.
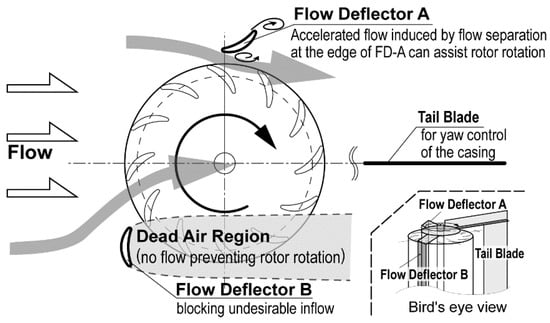
Figure 1.
Schematic illustration of the flow of cross-flow wind turbine with wind-collecting casing with two flow deflectors.
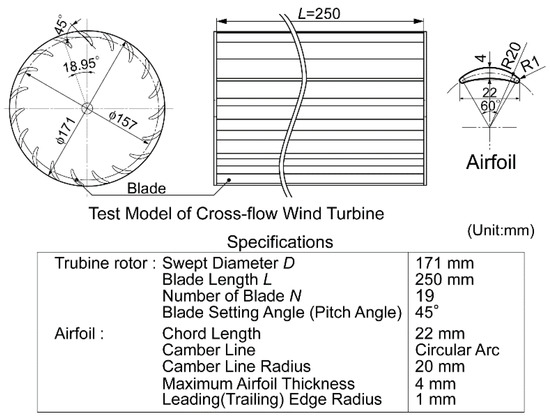
Figure 2.
Cross-flow wind turbine test model and airfoil.
Cross-flow wind turbines have a characteristic that the wind turbine can rotate by the wind from any direction. The half swept area catching the wind is useful to rotate the wind turbine itself, but for the rest half swept area, the entering flow into the area prevents from the rotor rotation. Therefore, the key to improving output performance is to prevent undesirable wind from entering the rotor and to allow some of the prevented wind to enter the effective half swept area. With this in mind, we studied a more effective use of cross-flow wind turbines, which are expected to be used for small-scale wind power generation, by improving the output performance of cross-flow wind turbines. In other words, we studied methods of improving the flow of cross-flow wind turbines to achieve high output, for example, a method of using the flow at the edge of a structure such as a building, a method of using a wind-collecting device as a casing composed of two deflector plates, and so on. For the effective use of cross-flow wind turbines, not only us but also various unique studies have been conducted on suitable installation locations for cross-flow wind turbines and additional devices that improve the ambient wind flow suitable for cross-flow wind turbines. These studies have focused on improving the output performance of the cross-flow wind turbine because of its low output performance. Shimizu et al. developed a ring diffuser with guide vanes for higher performance of a cross-flow wind turbine [9]. The ring diffuser consisted of multiple guide vanes, and these guide vanes were arranged radially and with an inclination angle, which guided the entering wind flow to the rotor favorably around the wind turbine rotor. They showed that the ring diffuser with a diameter of 1150 mm, 18 vanes, and vane inclination angles of 30° to 60° was applied to a cross-flow wind turbine with a diameter of 350 mm and an axial length of 360 mm, and the ring diffuser could improve the output performance of the cross-flow wind turbine by about 1.5 to 2 times. Kiwata et al. studied a cross-flow wind turbine installed at the top of a windbreak fence [10]. In their research, a cross-flow wind turbine with a diameter of 80 mm installed above a windbreak fence having a height of 500 mm and a geometric shielding rate of 60% and 100% was examined, and the relations among the output performance of the cross-flow wind turbine and the rotating direction of the rotor, the clearance between the rotor and the top edge of the fence, and the geometric shielding rate were investigated. In the case of the geometric shielding rate of 100%, the flow above the fence was clearly increased so the maximum power coefficient reached about 0.6, whereas when the wind turbine was located above the fence having a geometric shielding rate of 60%, the increase in the flow above the fence decreased and the maximum power coefficient was reduced to about 0.3. However, it was still higher than that of the bare cross-flow wind turbine. Their results indicated that installing cross-flow wind turbines above the windbreak fence is one of the effective uses of cross-flow wind turbines. Mohamed et al. proposed the wind concentrator for cross-flow wind turbines to improve the output performance [11]. The wind concentrator consists of an arc-shaped windshield device and a wind augmentation device, which is a type of wind lens [12] as mentioned later. As mentioned above, cross-flow wind turbines have an undesirable swept area where the blades are moving in the upstream direction, and the wind flow entering this area prevents the rotor rotation. The arc-shaped windshield device was used to block this undesirable flow. In addition, the wind augmentation device was used to increase the flow rate by the wind-lens effect. In their research, using a cross-flow wind turbine with a diameter of 80 mm, an arc-shaped windshield device of an inner radius of 43.5 mm which covered 1/4 of the rotor where the blades were moving to the upstream side and a wind augmentation device of a wind lens type which was two parallel plates with flanges having a height of 50 mm and covered the rear side of the rotor were added as a wind concentrator to the cross-flow wind turbine. As a result, it was shown that the addition of the wind augmentation device to the arc-shaped windshield device could improve the power coefficient of the wind turbine by 88% and more, and the maximum power coefficient became higher by about 108%. Shigemitsu et al. focused on the two-directional prevailing winds generated by the land breeze and the sea breeze such as in coastal areas and investigated the use of cross-flow wind turbines in a prevailing wind environment. In order to improve the performance of cross-flow wind turbines, symmetrical casings combining a nozzle and a diffuser with the same shape, which could use the prevailing winds effectively, have been proposed [13,14]. A nozzle was arranged on the side where the blades were rotating along with the direction of the wind to make a flow path like a spiral casing, and a diffuser, the shape of which is the same as the nozzle, was arranged symmetrically to the nozzle, making an outlet flow path. The symmetrical casing with the nozzle and the diffuser was applied to a cross-flow wind turbine with a diameter of 150 mm, and the relations between the performance of the cross-flow wind turbine and the inclination angles of the casing against the wind flow direction were investigated. They showed that the symmetrical casing with an inclination angle of 15° could improve the performance of the wind turbine by 70% in the power coefficient. In addition, the effect of adding the side boards, which were standing perpendicular to the wind direction, on the nozzle and the diffuser was also examined. It was shown that the performance of the wind turbine became higher by about 1.9 times compared with the bare wind turbine when the side board was placed on the most upstream side of the nozzle (another side board was placed on the most downstream side of the diffuser) and the inclination angle of the casing was 30°.
In the studies [9,10,11,13,14] mentioned above, a device to improve the inflow of the cross-flow wind turbine has been added to the turbine rotor to increase the power output of the wind turbine. Similar to these studies, our study aimed to achieve higher power output by improving the flow into the cross-flow turbine rotor by the addition of surrounding structures. The wind-collecting casing studied in this study is a device that covers the rotor of a cross-flow wind turbine and here is called a wind-collecting casing (simply called a casing). Figure 1 shows the schematic of a cross-flow wind turbine with a wind-collecting casing that was studied [8] and the flow of the cross-flow wind turbine with the casing. The casing consists of several flow deflector plates (hereinafter a “flow deflector”) and a tail blade [15]. In Figure 1, the casing has two flow deflectors with the shape of a circular-arc airfoil. One of the flow deflectors is located very close to the top of the rotor with a negative angle of attack with respect to the direction of the incoming wind (called FD-A), and the other is located upstream of the lower half of the rotor in the figure (called FD-B). These flow deflectors of FD-A and FD-B have different effects on flow improvement, and the combination of these flow deflectors is a feature of the proposed wind-collecting casing. In addition, compared to the ring diffuser introduced above by Shimizu et al. [9], the additional structure composed of two flow deflectors is smaller than that of the ring diffuser. This contributes to reducing the upstream flow velocity reduction and can make the structure of the casing simple.
According to the study of a wind turbine with a shroud, which has a diffuser shape, by Ohya et al. [12], when a diffuser was set in a uniform flow, the flow speed at the inlet of the diffuser was increased compared with that of the ambient wind. Moreover, by adding a brim (flange) to the diffuser at the rear edge of the diffuser, the flow-accelerating effect was enhanced extremely. In their research, using a propeller-type wind turbine with a diameter D = 720 mm, the optimal form of the flanged diffuser (called a wind lens) with an axial length of 1.25D was examined. From the results, a flanged diffuser with an axial length of 1.25D, a diffuser opening angle of 12°, and a flange height of 0.5D were applied to the wind turbine, and the output performance of the wind turbine increased by about 4 to 5 times compared to that of the bare wind turbine. Furthermore, Ohya et al. also examined the compact type of the flanged diffuser [16]. Even with a compacted flanged diffuser with an axial length of 0.22D and a flange height of 0.1D, the output performance of the wind turbine could be increased by about 2.5 times, and the wind turbine with the compacted flanged diffuser was proposed as a more practical one. In addition, in the continuous study of the wind turbine with the compact flanged diffuser shortened in the axial direction by Oka et al. [17], it was shown that the accelerated flow caused by the flanged diffuser was particularly strong near the inner surface of the flanged diffuser from the results of the numerical study. Based on the results of these studies, the position of the flow deflector of FD-A was determined to obtain an accelerated flow to the rotor of a cross-flow wind turbine. This accelerated flow assists the rotor to rotate in the vicinity of the flow deflector of FD-A.
In addition, considering the flow of a cross-flow wind turbine without a wind-collecting casing based on Figure 1, the blades on the upper side of the rotor in the figure move in the direction of the wind flow into the rotor. On the other hand, the blades on the lower side of the rotor move in the opposite direction of the wind direction. Therefore, the flow into the lower half of the rotor is undesirable for the wind turbine. In our previous study of a cross-flow wind turbine using the separation flow near the edge of a structure such as a building [18], the power output of a cross-flow wind turbine was obviously improved by arranging the position of the rotor to be near the edge of a structure where the flow separation generated, and only the blades moving in the upwind direction in the half swept area of the rotor were in the separation zone. Based on these results, we considered the arrangement of the flow deflectors of FD-B so that the lower half of the rotor in Figure 1 was in the dead air region. The flow deflectors of FD-B are for blocking the inflow of wind into the lower half of the rotor and reducing the aerodynamic resistance to the blade moving upstream.
As shown in the lower right of Figure 1, the actual wind-collecting casing added to the cross-flow rotor proposed by us is a type of casing consisting of multiple flow deflectors and a tail blade. This casing was fixed to the rotating shaft of the wind turbine by bearings above and below the rotor. As mentioned above, the structure was designed to improve the flow suitable for a cross-flow rotor by flow deflectors to increase the power output of the wind turbine and to maintain the improved flow condition for the wind turbine in any wind direction by a tail blade to change the orientation of the casing only in response to changes in wind direction. In the previous study of high power output by utilizing the separation flow at the edge of a building or other structure, the wind direction was limited to one direction, but the introduction of the tail blade solved the problem of wind direction limitation. With the aim of further improving the casing, in this study, we examined the possibility of increasing the power output of a cross-flow wind turbine by using a wind-collecting casing with three flow deflectors. This casing is an improvement over the previous casing with two flow deflectors as shown in Figure 1. As mentioned above, the flow deflectors rotate with the tail blade so that the casing faces the wind in the correct direction even when the wind direction changes. However, when the wind direction changes rapidly, there is likely to be a misalignment between the wind direction and the orientation of the casing, and the misalignment causes a reduction in the effect of output performance improvement. The reduction in output performance increases as the width of the flow deflector shortens [19,20]. Therefore, to maintain a high output performance improvement effect even when the wind direction changes, the number of flow deflectors was increased in this casing.
In this study, a test model of cross-flow wind turbine with a casing composed of three flow deflectors was created by using a 3D printer and using a wind tunnel, the output performance tests were conducted by changing the casing orientation with respect to the wind direction in several ways. In addition, numerical fluid analyses using OpenFOAM were conducted under the same conditions as the output performance test. The obtained results are discussed in terms of the effectiveness of the proposed casing in improving output performance and also its superiority over the casing with two flow deflectors in our previous study against changes in wind direction.
2. Test Model of Cross-Flow Wind Turbine with Three Flow Deflectors
Figure 2 shows the geometry and dimensions of the tested cross-flow wind turbine model and airfoils. The typical diameter of the test cross-flow turbine was 171 mm, and the number of blades was 19. The airfoil was a circular-arc airfoil with a 22 mm chord length, a blade length of 250 mm, and an angle of attachment of 45°.
Figure 3 shows the shape and dimensions of the cross-flow wind turbine test model with three flow deflectors. In the experimental investigation of the performance improvement effect of the casing, only the three flow deflectors were added to the cross-flow rotor, and for simplicity, no tail blade was added. All the shapes of the three flow deflectors added to the rotor were the same, and a similar figure to the circular-arc airfoil used for the wind turbine blades, with dimensions 1.5 times larger. The arrangement of the flow deflectors in the figure is in the case when the wind flows from the left side of the figure same as in Figure 1, and this arrangement was used as the reference condition.
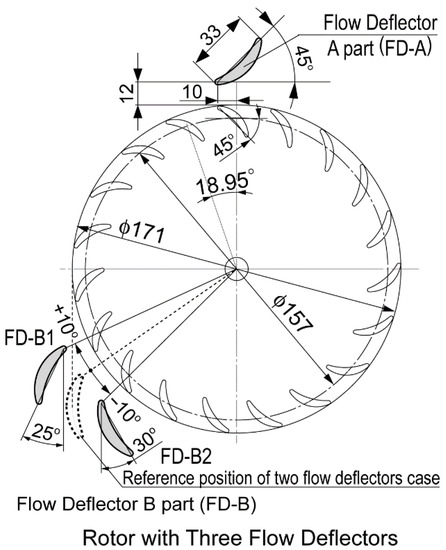
Figure 3.
Cross-flow wind turbine with a casing having three flow deflectors.
As shown in Figure 3, the position of the flow deflector of FD-A is the same as in Figure 1. Each of the two flow deflectors of FD-B was positioned back and forth with respect to the position of the single flow deflector of FD-B in the casing shown in Figure 1. In Figure 3, the position of the flow deflector of FD-B in Figure 1 is also indicated by a dashed line. The two flow deflectors of FD-B were one flow deflector B1 on the upstream side and the other one B2 on the downstream side. As shown in Figure 3, the position of the flow deflector B1 was shifted upstream around the center of the wind turbine axis to reduce the deceleration of incoming wind based on the position of the flow deflector indicated by the dashed line. Another flow deflector B2 was shifted downstream around the center of the rotor axis. This was to block the inflow of wind that would prevent the rotor from rotating, considering the case that the wind direction changes to from the lower left direction in the figure.
3. Output Performance Test and Numerical Flow Analysis
3.1. Geometric and Inlet Flow Conditions
In this study, we evaluated the effect of the misalignment between the wind direction and the direction of the casing (the inclination angle of the casing as a set of three flow deflectors relative to the wind direction) on the performance improvement effect of the casing composed of three flow deflectors by means of output performance test and numerical fluid analysis. Figure 4 shows a schematic of the method used to change the inclination angles of the three flow deflectors (hereinafter an “inclination angle”) in the output performance test. The three flow deflectors in gray indicate the reference positions (inclination angle 0°) shown in Figure 3.
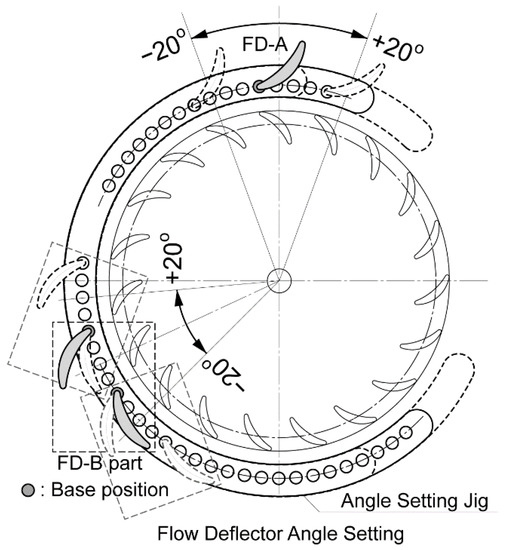
Figure 4.
Inclination angle setting of three flow deflectors by jig and range of inclination angles for output performance test experiments.
A total of nine inclination angle conditions around the axis of the wind turbine rotor were examined from −20° to +20° at 5-degree intervals. Since the three flow deflectors must be rotated together around the wind turbine axis to change the inclination angle, a jig as shown in Figure 4 was used to fix the three flow deflectors in the experiment easily, and the inclination angle was set by rotating the jig. Table 1 shows all the conditions for the output performance test and numerical fluid analysis.

Table 1.
Conditions of inlet wind speed and inclination angles of wind-collecting casing for output performance test experiment and numerical flow simulation.
Even for the numerical fluid analysis, the conditions of inclination angle and inlet flow velocity were the same as in the output performance test described earlier, as shown in Table 1.
3.2. Experimental Method for Output Performance Test
Figure 5 shows the blower-type wind tunnel and test section used for the output performance test. Figure 6 shows a test model of a cross-flow wind turbine with three flow deflectors fixed to the test section. The cross-sectional dimensions of the outlet section of the wind tunnel were 680 mm × 680 mm, and in the rectifier section, two wire meshes with an aperture ratio of 60% and a wire diameter of 0.14 mm, a honeycomb grid with a cell size of 6.35 mm, and a thin household non-woven filter were installed to rectify the flow at the exit of the wind tunnel. The wind turbine test model was installed at a position where the center of the wind turbine rotor was 500 mm downstream of the wind tunnel exit. Torque and rotation detectors (SS-050 and MP-981, respectively, Ono Sokki Co., Ltd., Yokohama, Japan) and a rotation control motor (P50B0502DXS00, Sanyo Denki Co., Ltd., Tokyo, Japan) were connected to the rotor shaft. The rotor speed was controlled, and torque and rotation speed measurements were collected by PC for measurement. Torque and rotation speed were measured with a sampling time of 3 s and a sampling frequency of 100 Hz.
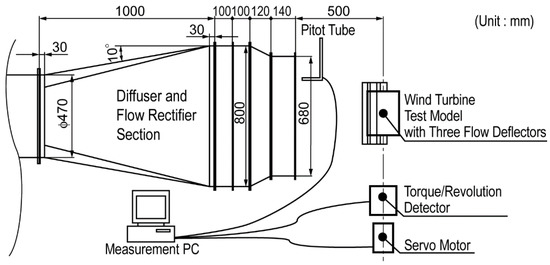
Figure 5.
Schematic of output performance test equipment and the test section.
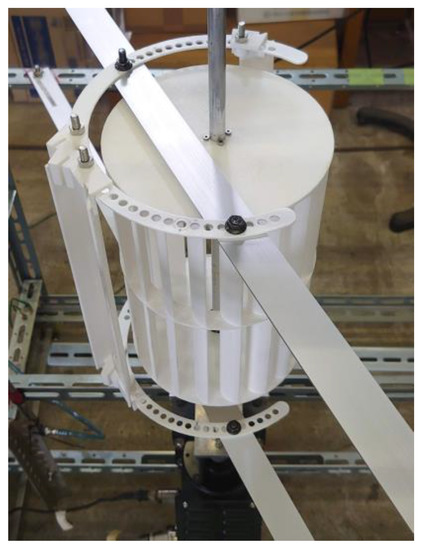
Figure 6.
Setting appearance of a cross-flow wind turbine test model with three flow deflectors.
The torque value measured in the output performance test included the friction torque such as at the bearings, so the torque value T was corrected by the friction torque of the shaft friction measurement conducted as a preliminary experiment under the same wind speed condition as in the output performance test. The tip speed ratio λ and power coefficient Cp shown in Equations (1) and (2), respectively, were used to evaluate the output performance of the wind turbine test model.
where r is the rotor radius, ω is the rotation angular velocity, U∞ is the inlet wind speed, T is the rotor torque, ρ is the air density, and A (=D × L) is the rotor swept area.
For the output performance test, as shown in Table 1, the wind speed at the inlet of the wind turbine was set to 6 m/s, the rotor speed was reduced in steps from a near no-load rotation speed to 0 rpm, and the torque and rotation measurements were measured at each step. As shown in Figure 2 and Figure 3, the dimensions of the wind turbine test model for this study were small; that is, because this output performance test was conducted on a small scale, the measured data were easily affected by the setting at the time. For this reason, measurements for all conditions listed in Table 1 were conducted together at one time (in one day). Each condition was measured three times, and the average of these measurements was obtained. For reference, Figure 7 shows the result of the output performance test for the bare cross-flow wind turbine with no flow deflector shown in Figure 2 obtained by eight measurements from 2020 to 2021. The vertical axis is the power coefficient and the horizontal axis is the tip speed ratio. The averaged output performance curve of eight measurements with standard deviation bars was compared with the output performance curve obtained from the measurement for this study. There was a slight difference between these curves near the peak points but except there, these curves were nearly coincident.
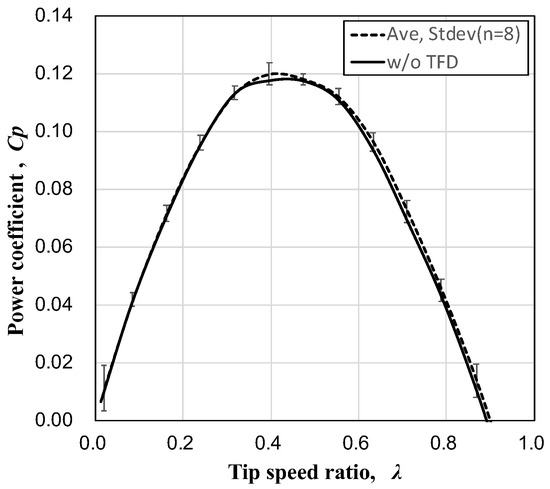
Figure 7.
Averaged performance curve with standard deviation bars of bare cross-flow wind turbine (n = 8, without three flow deflectors (TFD)) compared with the performance curve of same wind turbine for this study (without TFD).
3.3. Numerical Flow Analysis Method and Conditions
The unsteady incompressible turbulence solver pimpleDyMFoam of OpenFOAM Ver. 1.6-ext, a general purpose fluid solver, was used for the numerical fluid analysis. Since the cross-flow wind turbines had the same cross-sectional geometry along the axial direction, a two-dimensional model was used for the analysis. The k-ω SST model was used as the turbulence model. Figure 8 shows an example of the computational domain and numerical mesh of a wind turbine test model with three flow deflectors. Figure 8a shows the whole mesh and computational domain, and Figure 8b is the zoomed-in view of the mesh near the wind turbine rotor. The computational domain dimensions were 1500 mm × 1850 mm, and the wind turbine was positioned with the rotor center 750 mm from the upstream boundary. For the boundary setting, only the left side boundary face was set as inlet, and the other three boundary faces were set as outlet. Unstructured mesh was used as shown in the figure. A fine mesh was applied over the surfaces of the blades and the flow deflectors, and a coarse mesh was used farther away from them to reduce the computational load. The total number of meshes was approximately 190,000. The size of the coarsest mesh was about three times the chord length of the blade airfoil. For the mesh on the surface of the blades and flow deflectors, the size was clearly fine for which the averaged y+ value was about 1, but the fine meshes were layered around the blades and flow deflectors. The reason for the fine meshing on the objects was to give priority to the calculation stability. In our previous studies [20,21], the numerical analyses of the wind turbines with a diameter of 171 mm as shown in Figure 2 and a diameter of 114 mm which is two-thirds of the former one were conducted, and when a coarser mesh was used on the object surfaces, the calculation often diverged. For the analyses applying the fine mesh to the wind turbine with a diameter of 114 mm, Figure 9 shows photos of smoke streamlines of the cross-flow wind turbine (with no flow deflectors, inlet wind speed 6 m/s, and λ = 0.4) in our previous study [22], and Figure 10 shows velocity distribution and streamlines of the same wind turbine (inlet wind speed 6 m/s, λ = 0.436) obtained by the numerical analysis [20]. The momentary smoke streamlines shot with a shutter speed of 1/4000 s are shown in Figure 9a, while the averaged smoke streamlines with a shutter speed of 1 s are in Figure 9b. In Figure 9a, it can be seen that the flow pattern was obviously complicated by a lot of flow separation in the rotor and around the blades on the downstream side of the rotor, but from the comparison of the flow patterns between the averaged smoke streamlines in Figure 9b and the streamlines in Figure 10, the flow pattern of the streamlines by the numerical analysis with OpenFOAM was very similar to that of the averaged smoke streamlines by the flow visualization experiment so the numerical analysis by OpenFOAM can capture the averaged flow behavior of the cross-flow wind turbine.
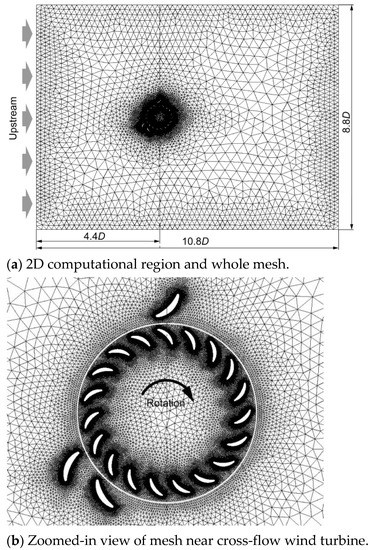
Figure 8.
2D computational region, whole mesh, and zoomed-in view of the mesh near the cross-flow wind turbine with three flow deflectors (in case of reference setting positions of flow deflectors).
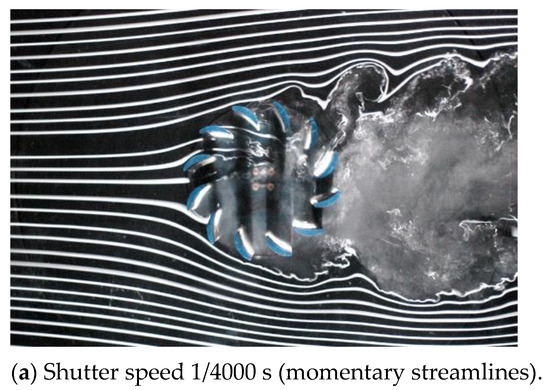
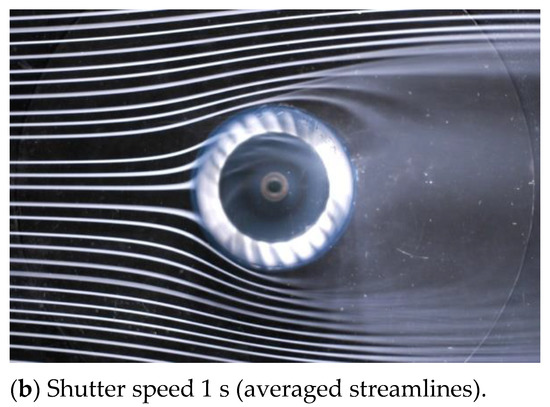
Figure 9.
Smoke streamlines of a cross-flow wind turbine (D = 114 mm, λ = 0.4, and U∞ = 6 m/s).
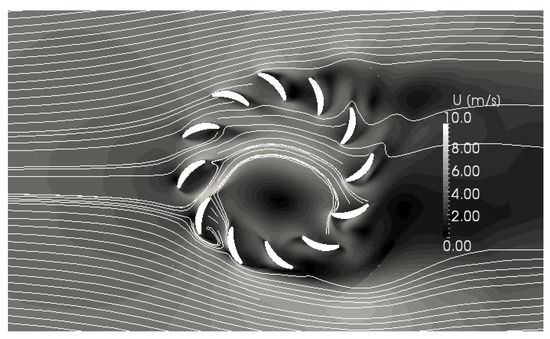
Figure 10.
Velocity distribution and streamlines of a cross-flow wind turbine obtained by OpenFOAM numerical calculation (D = 114 mm, λ = 0.436, and U∞ = 6 m/s).
As the operating condition of the wind turbine in this analysis, the tip speed ratio was set to λ = 0.497 (rotation speed 333 rpm), which was near the maximum point of the power coefficient in the power coefficient curves obtained in the output performance test described below. The inlet wind speed was 6 m/s, the same as in the output performance test.
4. Results and Consideration
4.1. Results of Output Performance Test
Figure 11a,b show the performance curves of the test model of a cross-flow wind turbine with three flow deflectors (hereinafter “TFD”) obtained from the output performance test conducted under the conditions shown in Table 1. Figure 11a compares the performance curves of the wind turbine with TFD at inclination angles from 0° to +20°, and Figure 11b compares the performance curves at inclination angles from −20° to 0°. In each figure, the performance curve of the bare cross-flow wind turbine without TFD is also shown for comparison. In each figure, the vertical axis is the power coefficient, and the horizontal axis is the tip speed ratio.
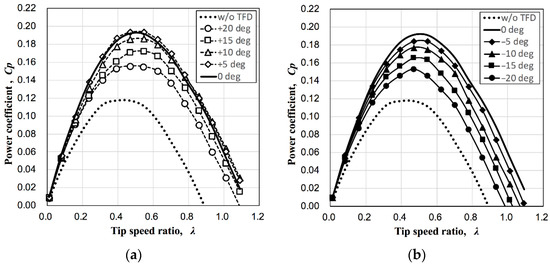
Figure 11.
Performance curves of cross-flow wind turbine with three flow deflectors compared with the case with no flow deflector (w/o TFD), (a) inclination angles 0° to +20°; (b) inclination angles −20° to 0°.
Figure 11a,b show that the output performance of the cross-flow wind turbine with TFD was clearly better than that of the bare cross-flow wind turbine for all inclination angle conditions. That is, the maximum value of the power coefficient Cpmax was higher, and the range of tip speed ratios λ over which the power coefficient Cp is positive became wider. When the inclination angle was positive in Figure 11a, the maximum power coefficient Cpmax was the highest at an inclination angle of +5° followed by an inclination angle of 0°, and for other angles, Cpmax decreased as the inclination angle increased. At an inclination angle of +5°, Cpmax = 0.194, which is about 64% higher than Cpmax = 0.118 for the bare cross-flow wind turbine. The no-load tip speed ratio also exceeded 1.0 at all inclination angle cases. On the other hand, when the inclination angle was negative in Figure 11b, Cpmax was the highest at 0° and decreased as the inclination angle decreased. However, even in these cases, the maximum power coefficient was more than 30% higher than that of the bare cross-flow wind turbine.
Figure 12 shows the relationship between the maximum power coefficient Cpmax and the inclination angle obtained from the output performance curves of the cross-flow wind turbine with TFD shown in Figure 11a,b. As a comparison, the maximum power coefficient of the bare cross-flow wind turbine without TFD is shown as a dashed line, and the results of the cross-flow wind turbine with two (dual) flow deflectors (hereinafter “DFD”) [8] shown in Figure 1 are also shown as a dotted line. Note that the results for DFD case were obtained through new experiments for this study. The experiments in the case with DFD were conducted together with the experiments with TFD using the same measurement system as in the case with TFD.
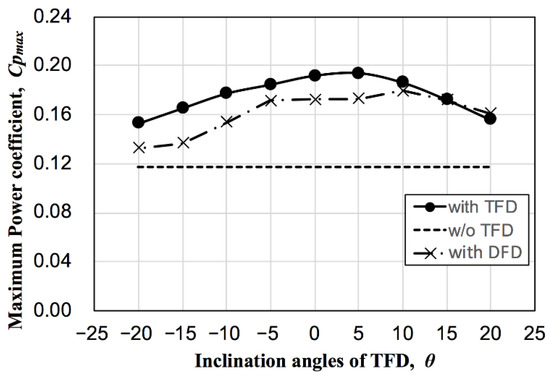
Figure 12.
Relation between power coefficient Cpmax and inclination angles of three flow deflectors θ by output performance test experiment.
Comparing the TFD case and the DFD case, it was clear that the TFD was more effective in improving the output performance of the cross-flow wind turbine than the DFD. Especially when the inclination angle was negative, the TFD case showed superiority in output performance improvement, so the additional flow deflector is expected to extend the range of inclination angle where the output performance of the cross-flow wind turbine can be improved. As described in Figure 11, the maximum power coefficient Cpmax was highest at an inclination angle of +5°, and the highest Cpmax was between inclination angles of 0° and +5°. The degree of decrease in the maximum power coefficient was different between the positive and negative inclination angles, and the decrease in the maximum power coefficient for the negative inclination angle was more gradual than that for the positive angle. In addition, the maximum power coefficient at an inclination angle of −10° to +10° was 90% or more of the maximum power coefficient at an inclination angle of +5°. Within this inclination angle range, the maximum power coefficient was able to be kept 50% to 60% higher than that of the bare cross-flow wind turbine with no flow deflector.
4.2. Results of Numerical Flow Analysis
Figure 13 shows the power coefficients Cp for each inclination angle at a tip speed ratio λ = 0.497 obtained from the numerical fluid analysis, with the inclination angle on the horizontal axis as in Figure 12. As shown in Figure 11, the maximum power coefficient of the cross-flow wind turbine with the three flow deflectors (TFDs) was around λ = 0.497 for all inclination angles. Therefore, the numerical results shown in Figure 13 were considered to capture the trend in the variation of the maximum power coefficient for each inclination angle shown in Figure 12 obtained by experiment at the same tip speed ratio λ = 0.497, and in Figure 13, the output performance test results shown in Figure 12 are also compared.
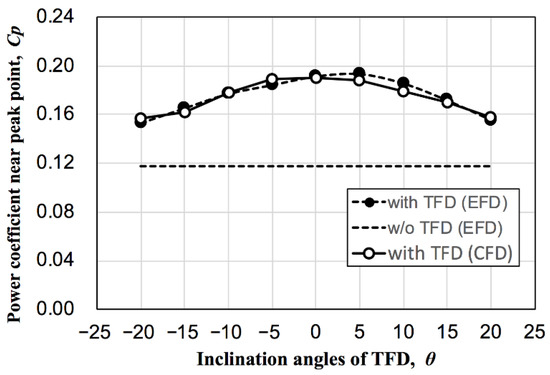
Figure 13.
Relation between power coefficient Cp near peak point and inclination angles of three flow deflectors θ by CFD comparing with EFD results (maximum power coefficient, Cpmax).
Comparing the numerical analysis results (CFD) and the output performance test results (EFD) in Figure 13, the distribution of power coefficients by the CFD results was very close to the EFD results, so it was considered that the numerical analysis could simulate the flow of the cross-flow wind turbine with three flow deflectors adequately. However, the power coefficient of CFD was slightly higher than that of EFD for an inclination angle of −5° (the deviation was about 1.4%), and that of CFD was slightly lower than that of EFD for an inclination angle of +5° and +10° (the deviation was about 1.3% to 1.8%). Otherwise, the results of CFD and EFD were almost the same. Next, the flow fields, that is, velocity and pressure distributions, are shown in Figure 14, Figure 15, Figure 16 and Figure 17. Figure 14 shows the flow fields of the bare cross-flow wind turbine with no flow deflector, and Figure 15, Figure 16 and Figure 17 show the flow fields of the cross-flow wind turbine with three flow deflectors (TFD) for the inclination angles of 0° and ±15°. For these inclination angles, the effect of the flow deflectors clearly differs depending on the inclination angle as shown in Figure 13. Figure 15 shows the case of inclination angle 0°, Figure 16 of inclination angle +15°, and Figure 17 of inclination angle −15°. In addition, in Figure 14, each blade is numbered.
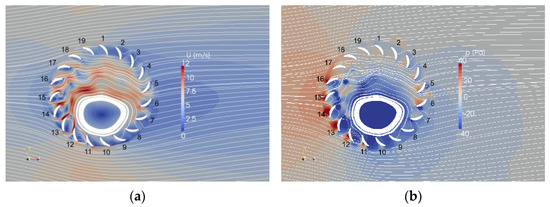
Figure 14.
Velocity and pressure distribution and streamlines in case of the bare cross-flow wind turbine with no flow deflector, (a) velocity distribution, U; (b) pressure distribution, p.
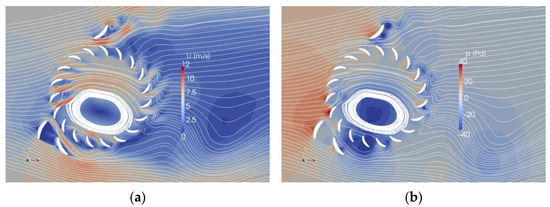
Figure 15.
Velocity and pressure distribution and streamlines of the cross-flow wind turbine with TFD of inclination angle θ = 0 deg. (a) velocity distribution, U; (b) pressure distribution, p.
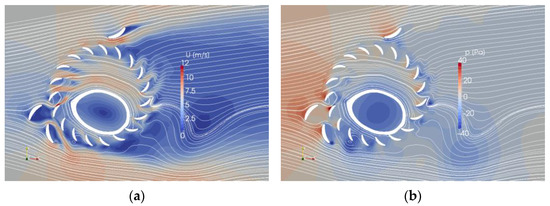
Figure 16.
Velocity and pressure distribution and streamlines of the cross-flow wind turbine with TFD of inclination angle θ = +15 deg. (a) velocity distribution, U; (b) pressure distribution, p.
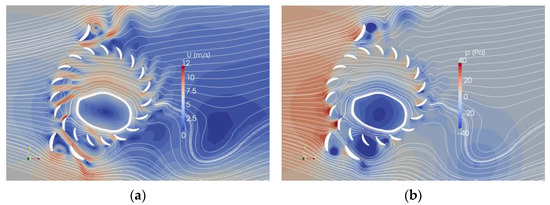
Figure 17.
Velocity and pressure distribution and streamlines of the cross-flow wind turbine with TFD of inclination angle θ = −15 deg. (a) velocity distribution, U; (b) pressure distribution, p.
Comparing the flow velocity distributions in Figure 14 for the case with no flow deflector and Figure 15, Figure 16 and Figure 17 for the cases with TFD, the effect of three flow deflectors is seen as a difference in the velocity of the flow downstream from the rotor. In Figure 15, Figure 16 and Figure 17, relatively high velocity flow out of the rotor can be seen between blades 3 and 7, while such high velocity flow can hardly be seen in Figure 14. Based on this, a comparison of the pressure distribution shows that in Figure 15, Figure 16 and Figure 17 for the cases with TFD, the pressure difference between the inside and outside of the rotor on each blade surface along the boundary of the zigzag lines is clear between blades 3 and 7 in the downstream section of the rotor, with higher pressure on the inside and lower pressure on the outside. Next, focusing on the upstream side of the rotor, in the pressure distribution, there is a very high pressure distribution on the upper (rotor outside) surface side of blades 11 to 16 or 17 in Figure 14, except for some blades (blades 18 and 19) on the upper side of the rotor in the upstream section. On the other hand, the same high pressure distribution in Figure 15, Figure 16 and Figure 17 is observed for about 3 blades only between blades 14 and 16 in the upstream section in Figure 15 and Figure 16, and for about 4 blades only (blades 13 to 16) in the upstream section in Figure 17. Accordingly, we can see that the flow entering the rotor in Figure 15, Figure 16 and Figure 17 flows downstream without significant meandering compared to Figure 14.
Next, focusing on the flow around the flow deflectors of FD-A and FD-B each, an accelerated flow on the rotor side of the flow deflector FD-A clearly appears in Figure 15, Figure 16 and Figure 17. In particular, in Figure 15 and Figure 17, where the inclination angles are 0° and −15°, respectively, the pressure distribution on the blade surface near the FD-A is clearly higher on the inside of the rotor and lower on the outside (blade 1 in Figure 15 and blade 19 in Figure 17); these pressure distributions contribute to the rotor rotation. In addition, the direction of the streamline toward the leading edge of the FD-A changes from a flow away from the rotor in Figure 14, which is the case without TFD, to a flow slightly toward the rotor in Figure 15 and Figure 17. It can be inferred that this flow contributes to the fast flow toward the rear side of the rotor without meandering the flow in the rotor. In Figure 16, where the FD-A has shifted toward the downstream side, the pressure difference on both sides of the blade (blades 1 and 2) near the flow deflector is smaller than in Figure 15 and Figure 17, and the contribution of this pressure difference to the rotor rotation is also lower.
For the flow deflectors of FD-B, focusing on the flow velocity distribution in front of the rotor in each Figure, the vertical position in the Figure, where the velocity is slowed down the most, differs depending on whether the rotor has the FD-B or not. In Figure 14 for the bare cross-flow wind turbine, the position is almost at the center of the rotor (in front of blade 15), but in Figure 15, Figure 16 and Figure 17 for the cases with the FD-B, the position is shifted to the lower side of the rotor. Similarly, the position of the streamlines flowing almost horizontally into the rotor on the upstream side is near the center of the rotor (in front of blade 15) in Figure 14, while in Figure 15, Figure 16 and Figure 17, it is moved to the lower side (near between blades 14 and 15) from the center of the rotor and near the center of the rotor the streamlines are flowing slightly upward. It is considered that this helps the flow of wind entering into the blade rows on the upstream side of the rotor in flowing into the blade rows on the downstream side without meandering in the rotor. On the contrary, in Figure 14, the entering flow into the blade rows on the upstream side is clearly turbulent and the flow in the rotor is meandering.
In particular, in Figure 15 and Figure 16 with inclination angles of 0° and +15°, respectively, there are two flow deflectors (FD-B) upstream of the blades (blades 11 to 13 in Figure 15, blades 12 to 14 in Figure 16) moving in the upwind direction in the lower half of the rotor, these flow deflectors are blocking the entering flow that usually prevents the rotor from rotating. In the flow velocity distribution in Figure 14, local high velocity flow is observed on the outer edges of the blades (blades 11 to 14) moving upstream, which corresponds to the position just downstream of the FD-B in Figure 15 and Figure 16, and such local high velocity flow on the outer edges of the blades is not seen in Figure 15 and Figure 16 for the cases with the FD-B and the blades are moving without flow resistance in the lowest flow velocity region. While, in the pressure distributions in Figure 15 and Figure 16, those blades (blades 11, 12, and 13) are in a large low pressure region and there is almost no pressure difference between both sides of each blade. However, in Figure 17 with an inclination angle of −15 degrees, the FD-B moves to the lower side compared to Figure 15 and Figure 16 so that one or two blades on the upstream side and the lower half of the rotor are exposed to undesirable incoming wind that prevents the rotor from rotating. As the pressure distribution in Figure 17 shows, the pressure on the upper surface of blade 13 where the wind strikes directly is clearly high. In Figure 13 mentioned before, as the negative inclination angle increases, the power coefficient becomes lower than for the positive inclination angle, and this is considered to be due to the reduction of the FD-B effect.
From the above discussion of the flow field, it can be said that to improve the power output of a cross-flow wind turbine, the inflow into the upper half of the rotor should be improved by properly blocking the inflow in the lower half of the rotor, and the flow should be sent directly to the blade rows on the downstream side of the rotor. In addition, the results shown in Figure 13 indicate that the flow of the cross-flow wind turbine becomes optimum at an inclination angle of 0° to +5° for the casing consisting of a flow deflector of FD-A and two flow deflectors of FD-B, resulting in a high output performance improvement effect. Furthermore, the effect could be kept at a wide range of casing inclination angles by increasing the number of the flow deflector from two to three.
5. Conclusions
In this study, we examined the possibility of increasing the output power of a cross-flow wind turbine by adding a casing consisting of three flow deflectors. Output performance experiments and numerical flow analyses were conducted on a wind turbine with three flow deflectors, and the relationships among the output performance, the flow field, and the inclination angle of the casing against the wind direction within a range of ±20 degrees were discussed. As a result, the following conclusions were obtained.
- (1)
- The casing composed of three flow deflectors could improve the output performance of the cross-flow wind turbine by about 60% at the maximum output point.
- (2)
- It was shown that a higher output performance improvement effect was obtained by increasing the number of flow deflectors from two to three compared to our previous study and that a higher output performance improvement effect was maintained even when the misalignment between the wind direction and the direction of the casing, i.e., the inclination angle, was increased. The inclination angle at which a high output performance improvement effect (approximately 50% or more) could be obtained with a casing with three flow deflector plates was in the range of −10 to +10 degrees.
- (3)
- From a comparison of the flow fields obtained by numerical flow analyses for the inclination angles, it can be said that the direction of flow improvement for obtaining higher output performance from a cross-flow wind turbine is to change the flow direction slightly upward so that the inflow flows smoothly into the blade row on the upstream side of the rotor, and in the rotor to send the flow to the downstream blade row without meandering to increase the work of the downstream blade row.
Author Contributions
Conceptualization, T.T.; methodology, T.T., R.Y., and T.M.; validation, T.T., R.Y., and T.M.; resources, T.T.; data curation, T.T. and R.Y.; writing—original draft preparation, T.T.; writing—review and editing, T.T. and T.M.; visualization, T.T.; supervision, T.T.; project administration, T.T.; funding acquisition, T.T. All authors have read and agreed to the published version of the manuscript.
Funding
This study was possible partially thanks to the support of JSPS the Grants-in-Aid for Scientific Research (C) number JP21K03887.
Institutional Review Board Statement
Not applicable.
Informed Consent Statement
Not applicable.
Data Availability Statement
Not applicable.
Acknowledgments
The authors are grateful to Yuta Kawahara for assistance with experiments and numerical analyses at the time of his enrollment at National Institute of Technology, Kurume College.
Conflicts of Interest
The authors declare no conflict of interest.
Nomenclature
| A | Rotor swept area |
| Cp | Power coefficient |
| Cpmax | Maximum power coefficient |
| D | Rotor diameter |
| DFD | Two (dual) flow deflectors |
| FD-A | Flow deflector A part |
| FD-B | Flow deflector B part |
| FD-B1 | Upstream flow deflector of FD-B |
| FD-B2 | Downstream flow deflector of FD-B |
| L | Blade length |
| N | Number of blade |
| p | Pressure |
| r | Rotor radius |
| T | Rotor shaft torque |
| TFD | Three flow deflectors |
| U∞ | Inlet wind speed |
| U | Flow velocity |
| β | Blade pitch angle |
| θ | Inclination angles of a set of three flow deflectors |
| λ | Tip speed ratio |
| ρ | Air density |
| σ | Solidity (blade chord length/blade pitch) |
| ω | Rotation angular velocity of rotor |
References
- Eldridge, F.R. Wind Machines; Van Nostrand Reinhold Co.: New York, NY, USA, 1980. [Google Scholar]
- Johnson, G.L. Wind Energy Systems; Prentice-Hall, Inc.: Englewood Cliffs, NJ, USA, 1985. [Google Scholar]
- Yoshimoto, H.; Awashima, Y.; Kitakoji, Y.; Suzuki, H. Development of floating offshore substation and wind turbine for Fukushima FORWARD. In Proceedings of the International Symposium on Marine and Offshore Renewable Energy, Tokyo, Japan, 28–30 October 2013; p. 28. [Google Scholar]
- Report of Japan Wind Power Association (In Japanese), Agency for Natural Resources and Energy, March 2021. Available online: https://www.meti.go.jp/shingikai/enecho/denryoku_gas/saisei_kano/pdf/028_05_00.pdf (accessed on 10 August 2022).
- Izumi, U.; Naotsugu, I.; Guo-zhong, C. Design Configuration and Performance Evaluation of Cross-flow Wind Rotors. J. Jpn. Sol. Energy Soc. 1998, 20, 36–41. (In Japanese) [Google Scholar]
- Shoichi, T.; Yukimaru, S.; Izumi, U. An Experimental Study of Cross Flow Wind Turbine. Proc. 75th Regul. Meet. Jpn. Soc. Mech. Eng. 1998, 98, 291–292. (In Japanese) [Google Scholar]
- Tadakazu, T.; Shinichiro, N. Influence of Number of Blade and Blade Setting Angle on the Performance of a Cross-flow Wind Turbine. Trans. Jpn. Soc. Mech. Eng. 2007, 73, 225–230. (In Japanese) [Google Scholar] [CrossRef][Green Version]
- Tadakazu, T.; Hiroo, M.; Masayuki, F. Study on Upscaling of Cross-flow Wind Turbine with Two Flow Deflectors as Wind Collector. In Proceedings of the Japan Council for Renewable Energy, Yokohama, Japan, 1–4 June 2018. [Google Scholar] [CrossRef]
- Yukimaru, S.; Minoru, T.; Jinsaku, S. Development of a High-Performance Cross-Flow Wind Turbine (On the Effects of Ring-Diffusers and Multiple-Guide Vanes on the Power Augmentation for a Cross-Flow Wind Turbine). Trans. Jpn. Soc. Mech. Eng. 1998, 64, 202–207. (In Japanese) [Google Scholar] [CrossRef][Green Version]
- Takahiro, K.; Hiroaki, N.; Tomohiro, K.; Hiroko, F.; Akito, N.; Nobuyosho, K. Study of Performance of a Cross-Flow Wind Turbine Located Above a Windbreak Fence and the Associated Flow Field. Proc. 21st Natl. Symp. Wind. Eng. 2010, 21, 221–226. [Google Scholar] [CrossRef]
- Mohamed, H.; Takaaki, K.; Takahiro, K. Investigating the effects of wind concentrator on power performance improvement of crossflow wind turbine. Energy Convers. Manag. 2022, 255, 115326. [Google Scholar] [CrossRef]
- Yuji, O.; Takashi, K.; Akira, S.; Kenichi, A.; Masahiro, I. Development of a shrouded wind turbine with a flanged diffuser. J. Wind. Eng. Ind. Aerodyn. 2008, 96, 524–539. [Google Scholar] [CrossRef]
- Toru, S.; Junichiro, F.; Yuichi, T. Study on Performance Improvement of Cross-Flow Wind Turbine with Symmetrical Casing. J. Environ. Eng. 2009, 4, 490–501. [Google Scholar] [CrossRef]
- Toru, S.; Junichiro, F.; Masaaki, T. Performance and Flow Condition of Cross-Flow Wind Turbine with a Symmetrical Casing Having Side Boards. Int. J. Fluid Mach. Syst. 2016, 9, 169–174. [Google Scholar] [CrossRef][Green Version]
- Tadakazu, T.; Kohki, S. Design of the Tail Blade composing Wind Collector Casing without Mechanical Control to improve the Performance of Cross-flow Wind Turbine. Proc. Jpn. Wind. Energy Symp. 2018, 40, 405–408. (In Japanese) [Google Scholar] [CrossRef]
- Yuji, O.; Takashi, K. A Shrouded Wind Turbine Generating High Output Power with Wind-lens Technology. Energies 2010, 3, 634–649. [Google Scholar] [CrossRef]
- Nobuhiro, O.; Masato, F.; Kenta, K.; Kazutoyo, Y. Optimum aerodynamic design for wind-lens turbine. J. Fluid Sci. Technol. 2016, 11, JFST0011. [Google Scholar] [CrossRef]
- Tadakazu, T.; Shinichiro, N.; Genki, U. Improving ambient wind environments of a cross-flow wind turbine near a structure by using an Inlet Guide Structure and a Flow Deflector. J. Therm. Sci. 2005, 14, 242–248. [Google Scholar]
- Tadakazu, T.; Takeshi, M. Dual Flow Deflector Casing for Performance Improvement of Cross-flow Wind Turbine. In Proceedings of the Japan Council for Renewable Energy, Yokohama, Japan, 1–4 June 2014. [Google Scholar]
- Tadakazu, T.; Takeshi, M. Study of a Casing with Two Flow Deflector Plates for Performance Improvement of a Cross-flow Wind Turbine by CFD Analyses. In Proceedings of the 15th World Wind Energy Conference (WWEC2016), Small wind and hybrid system, Tokyo, Japan, 1–4 November 2016. [Google Scholar]
- Tadakazu, T.; Hiroo, M.; Masayuki, F. Comparative Study on Upscaling of Cross-flow Wind Turbine with Two Flow Deflectors of Wind Collector Casing. Wind Energy 2018, 42, 25–31. (In Japanese) [Google Scholar] [CrossRef]
- Tadakazu, T.; Takeshi, M.; Shinichiro, N. Flow Patterns of a Cross-flow Wind Turbine by Flow Visualization Measurements on the Performance Curves. Proc. Jpn. Soc. Mech. Eng. Annu. Meet. 2007, 2, 369–370. (In Japanese) [Google Scholar]
Publisher’s Note: MDPI stays neutral with regard to jurisdictional claims in published maps and institutional affiliations. |
© 2022 by the authors. Licensee MDPI, Basel, Switzerland. This article is an open access article distributed under the terms and conditions of the Creative Commons Attribution (CC BY) license (https://creativecommons.org/licenses/by/4.0/).