Abstract
DFIG (Doubly Fed Induction Generator)-based WPP (Wind Power Plant) is the most popular type of wind-driven electric power generation configuration. The main reason for its popularity is that the DFIG system can capture wind energy more optimally than other WPP configurations. Due to the increasing penetration of WPP in power systems, the need to study its impact on power system performance is becoming increasingly important. To enable such a study to be conducted properly, the first and probably the most crucial step is to model all system components (including the WPP). This paper proposes a new steady state model of DFIG-based WPP for load flow analysis. The proposed model is derived based on DFIG power formulas (i.e., DFIG stator and rotor power formulas). The model in the present work is simple and can easily be incorporated into load flow analysis. Representation of the DFIG in both sub-synchronous and super-synchronous conditions can be carried out by using a single mathematical model. Furthermore, since DFIG can be operated at a constant power factor (i.e., unity, leading, or lagging power factor), this important feature is also considered in the proposed model development.
1. Introduction
It has been acknowledged that the most popular types of generators used in variable speed WPP structures are induction and synchronous generators. However, due to its lower price and simpler design, the induction generator is currently more popular than the synchronous generator. Induction generators are also used in fixed speed WPP schemes. In fixed speed WPP, the frequency of the power system or grid will determine the rotational speed of the WPP generator. Therefore, the generator speed of this WPP type is only allowed to vary within a very narrow interval (around 1–2% above the synchronous speed). Since the allowed speed variation is very limited, the wind energy captured by fixed speed WPP is also not optimal. The basic structure of a fixed speed WPP usually consists of SCIG (Squirrel Cage Induction Generator) that is directly connected to the power grid via a step-up transformer [1,2,3].
Due to the disadvantage of fixed speed WPP, the application of variable speed WPP has significantly increased in recent years. The variable speed operation of a WPP can be obtained through the application of DFIG or PMSG (Permanent Magnet Synchronous Generator). However, since the cost of PMSG is relatively higher, the application of DFIG is currently more popular. Compared with fixed speed WPP, DFIG-based WPP operates at a much wider speed range. In its operation, the speed of DFIG is allowed to vary between 40% below synchronous speed and 30% above synchronous speed. This is the reason why the DFIG-based WPP can capture more wind energy than fixed speed WPP [3,4].
Since the penetration of WPP in power systems has been increasing, the need to study its impact on power system performance is becoming increasingly important. To enable such a study to be conducted properly, the first and probably the most crucial step is to model all system components (including the WPP). Regarding the WPP steady state load flow modeling, several techniques have been introduced and reported in [5,6,7,8,9,10,11,12,13,14,15,16,17,18,19,20,21,22]. In [5,6,7,8,9,10,11,12,13], the methods to incorporate fixed speed WPP into load flow analysis have been investigated. On the other hand, in [14,15,16,17,18,19,20,21,22], steady state models of DFIG-based variable speed WPP for load flow analysis have also been proposed. It is to be noted that most of the methods discussed in [14,15,16,17,18,19,20] assume that the DFIG was operated at the unity power factor.
Moreover, in [15,16,17,18], the DFIG has been represented by two different models. One model was used to describe the DFIG in sub-synchronous conditions, and another was used in super-synchronous conditions [15,16,17,18]. In [21,22], steady state load flow models of DFIG-based WPP have also been proposed. The models presented in [21,22] were applicable for DFIG operating in voltage control mode, where during the WPP operation, its voltage magnitude can be kept constant at a specified value. However, the DFIG power factor cannot be regulated in these control modes of operations.
The present work proposes a simple steady state model of variable speed (i.e., DFIG-based) WPP for load flow analysis. The model is obtained using formulas that calculate the DFIG stator and rotor powers. The important contribution of the method in the present work can be described as follows:
- (i)
- In contrast to the methods discussed in [14,15,16,17,18,19,20] where the DFIG power factor was assumed to be constant at unity, he proposed model allows the DFIG power factor to be controlled. In addition, it can be applied not only to the unity power factor but also to lagging and leading power factor operation modes. This contribution is particularly important since DFIG-based WPP in power factor control operation mode is also often adopted in practice.
- (ii)
- Another important feature of the present paper is that representation of the DFIG in both sub-synchronous and super-synchronous conditions can be carried out by using a single mathematical model. It is to be noted that in the previously published methods [15,16,17,18], two models have to be used to represent the conditions.
An extensive case study based on a representative test system (i.e., IEEE 14-bus power system) is also carried out and presented in this paper to validate the method proposed. The rest of the paper is structured as follows. Section 2 presents the turbine mechanical power formula as a wind speed function. Section 3 discusses the derivation of DFIG stator and rotor power formulas. The proposed model of DFIG-based WPP and its incorporation into load flow analysis is also discussed in this section. In Section 4, an investigation of the proposed method’s capability in solving load flow analysis of power systems containing DFIG-based WPP is carried out. Finally, in Section 5, some important conclusions of the present work are given.
2. Wind Turbine Power
The amount of energy or mechanical power captured by the turbine from the wind depends highly on the wind speed, as represented in the following equation [1,2,19]:
where:
| Pm | : | turbine mechanical power (Watt) |
| ρ | : | air density (kg/m3) |
| R | : | turbine blade length (m) |
| Vw | : | wind speed (m/s) |
| Cp | : | turbine performance coefficient |
The turbine performance coefficient (Cp) in (1) is usually expressed as a function of tip speed ratio (λ) and pitch angle (θ) as follows [2,19]:
where:
The tip speed ratio in (3) can be determined using the following relationship:
where:
| ag | : | turbine gear ratio |
| ωs | : | synchronous speed (rad/s) |
| s | : | induction generator slip |
| p | : | number of pole pairs of induction generator |
In practice, the values of turbine performance coefficients are usually in the range 0.4 to 0.5, and those of tip speed ratios have typical values of 6 to 8 [1,19].
3. DFIG Structure and Power Calculations
3.1. DFIG Structure and Equivalent Circuit
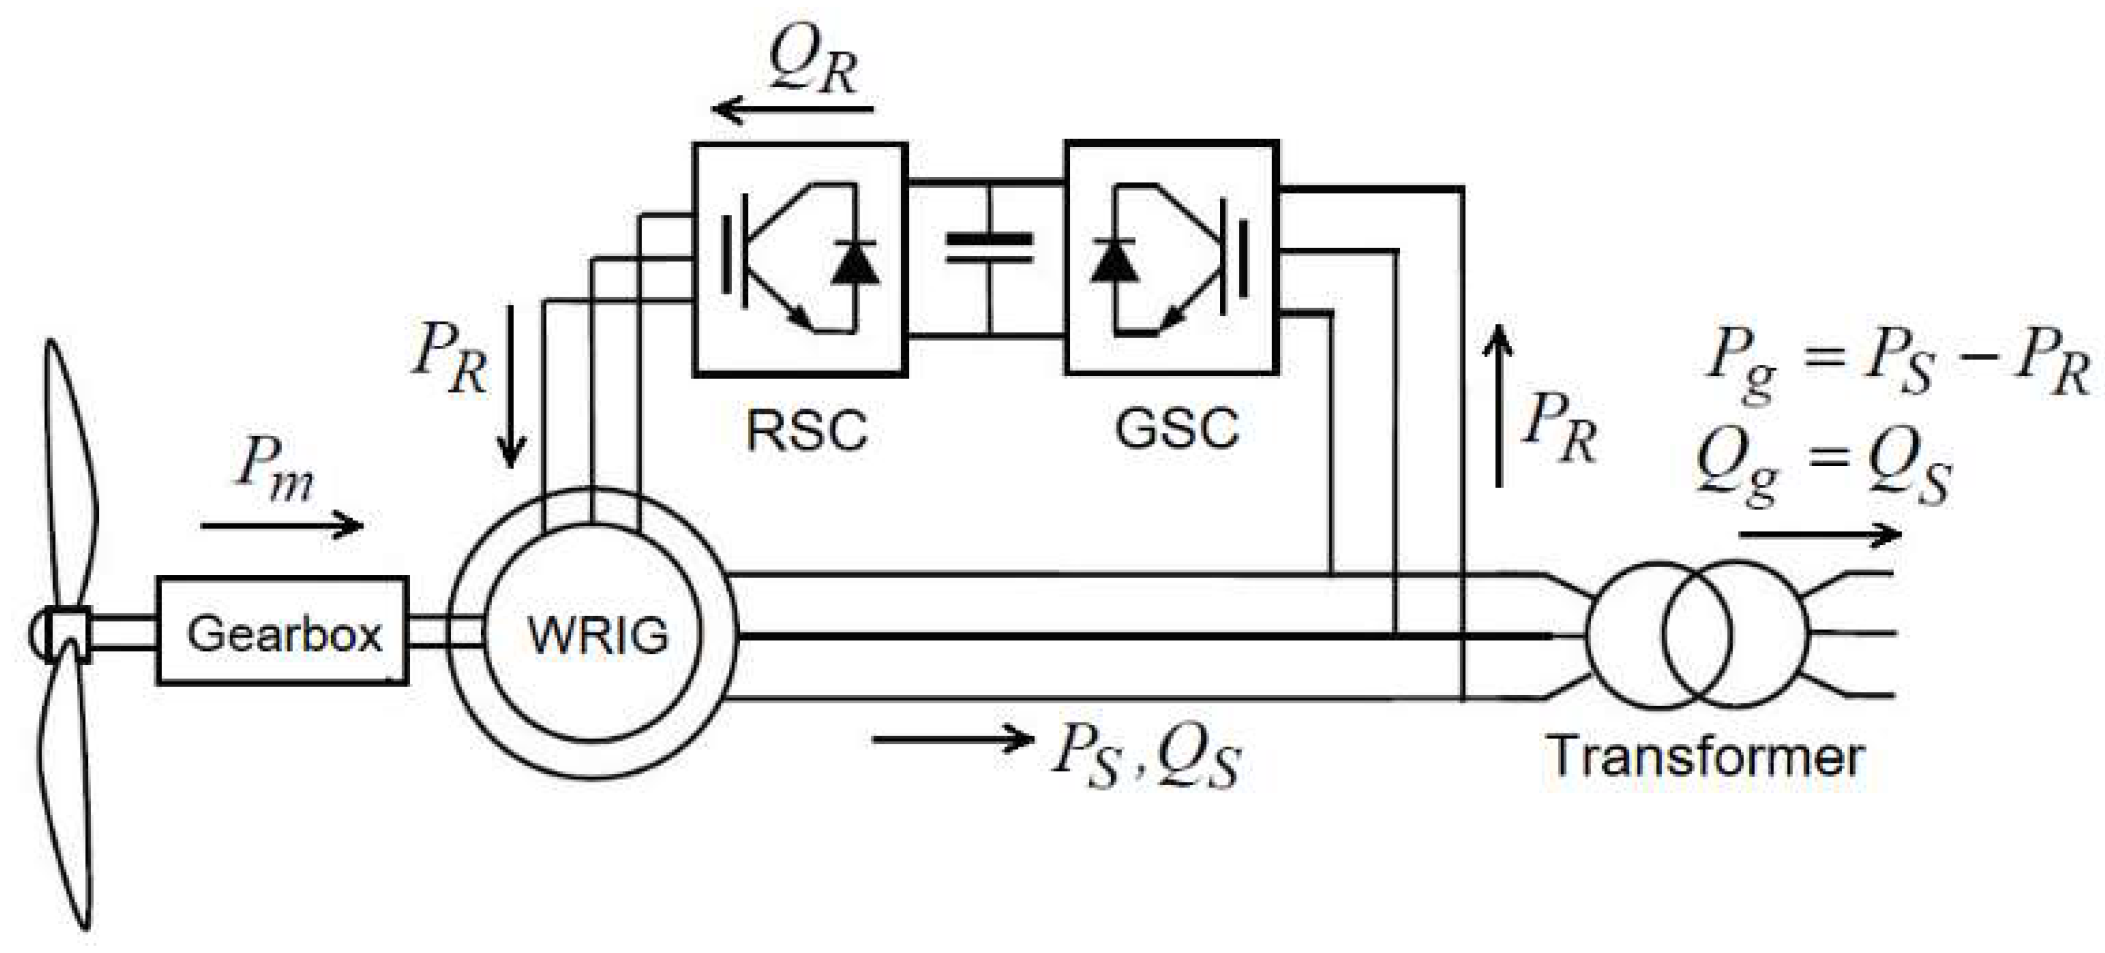
Figure 1 shows the basic structure of a DFIG-based WPP [19,20,21,22,23,24,25,26]. It is currently the most popular and widely used type of WPP. In DFIG-based WPP, the main component for electric power generation is WRIG (Wound Rotor Induction Generator). It can be seen from Figure 1 that WRIG stator winding is directly connected to the power system or grid. On the other hand, its rotor winding is connected to the grid through a PEC (Power Electronic Converter) via slip rings. This PEC consists of RSC (Rotor Side Converter), DC link, and GSC (Grid Side Converter). Since the rotor circuit is controlled by a PEC, DFIG has the ability to import or export reactive power.
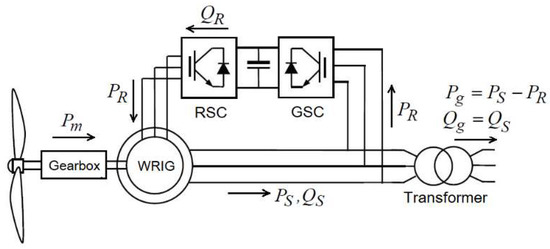
Figure 1.
The basic structure of DFIG-based WPP.
In Figure 1, Pm is turbine mechanical power, PS and QS are active and reactive powers in WRIG stator, Pg and Qg are active and reactive power outputs of DFIG. It is to be noted that the direction of the reactive power output (Qg) depends on the DFIG operation mode as follows: (i) in leading power factor operation mode, DFIG will export reactive power (Qg is positive), (ii) in lagging power factor operation mode, DFIG will import reactive power (Qg is negative), and (iii) in unity power factor operation mode, no reactive power will be imported or exported by the DFIG (Qg is zero). In addition, in Figure 1, PR is rotor active power (power injected to WRIG rotor). In super-synchronous conditions, PR will be negative (power is delivered by the rotor). However, in sub-synchronous conditions, PR will be positive (power is absorbed by the rotor). QR in Figure 1 is the reactive power produced by WRIG rotor. This reactive power is used to compensate for the reactive power consumed by WRIG and to support the reactive power needed during the leading power factor operation mode.
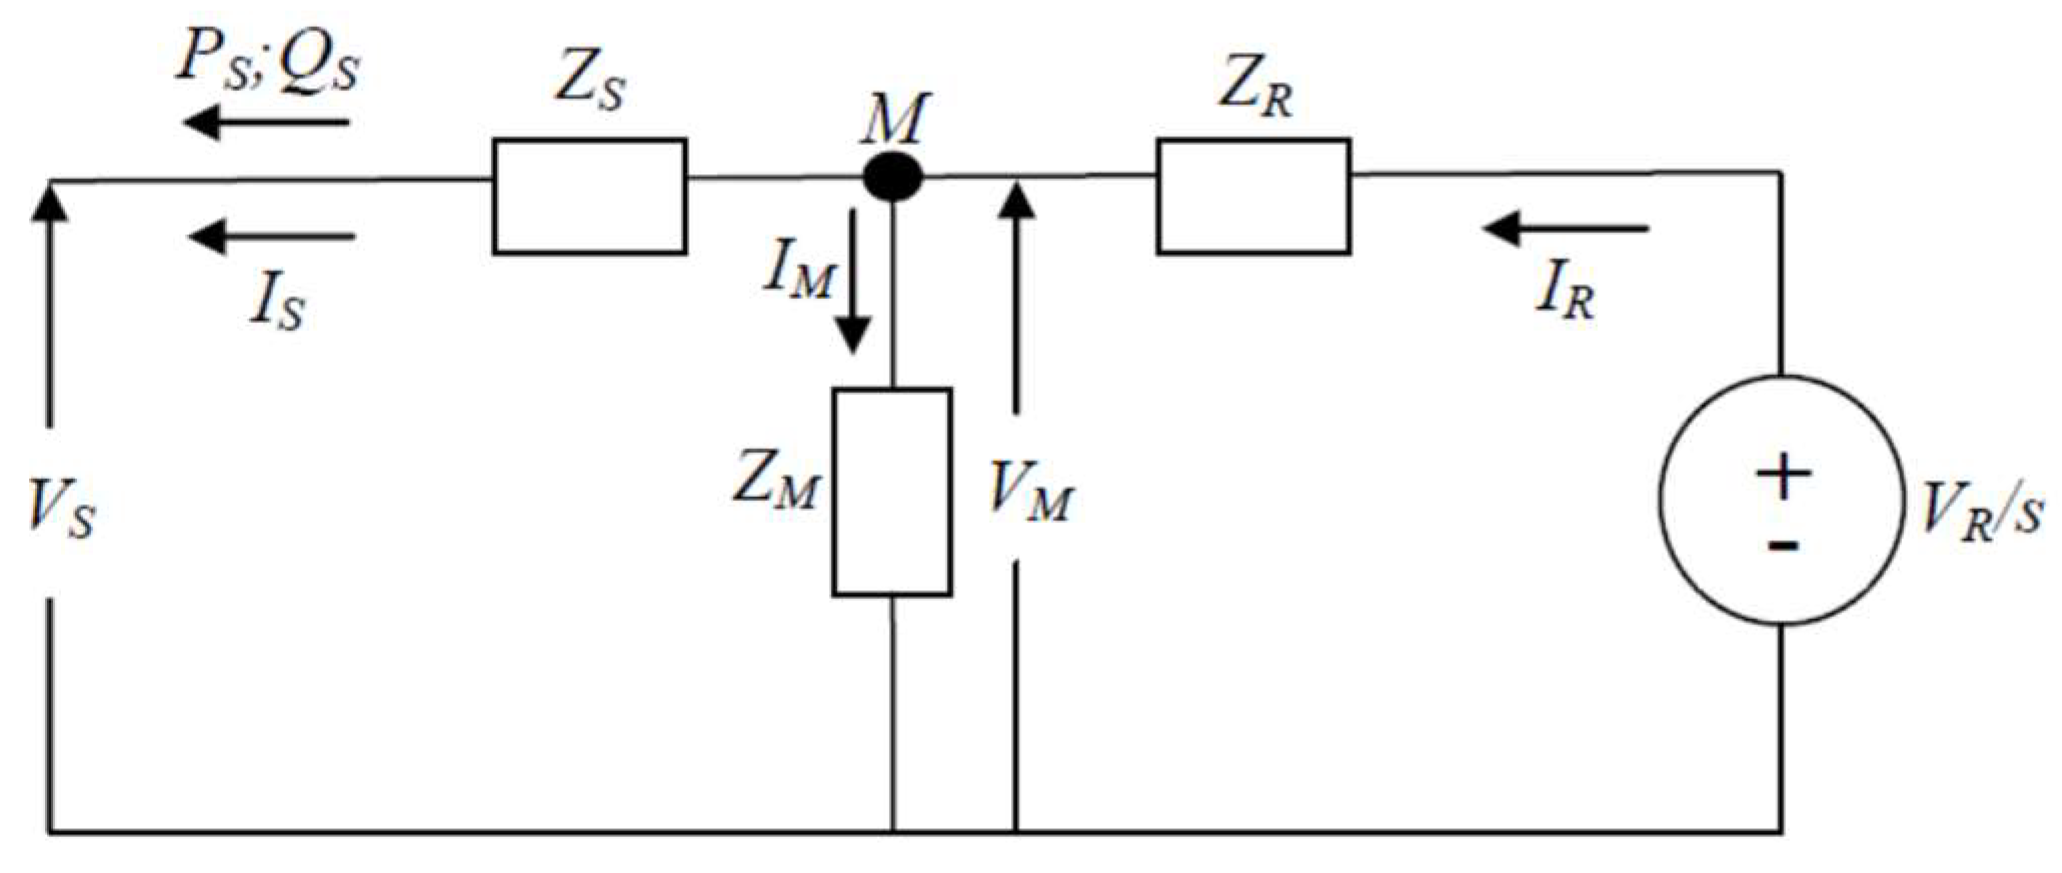
Steady state equivalent circuit of DFIG is given in Figure 2 [19,20,21,22,23,24]. In the figure, VS and IS are WRIG stator circuit voltage and current, VR and IR are WRIG rotor circuit voltage and current. Subscripts S, R, and M are used to identify the electrical quantities in the stator, rotor, and magnetic core circuits, respectively. In addition, the formulations for ZS, ZR, and ZM in Figure 2 will have the following forms:
where:
| RS, XS | : | resistance, reactance of stator circuit |
| RR, XR | : | resistance, reactance of rotor circuit |
| Rc, Xm | : | resistance, reactance of core magnetic circuit |
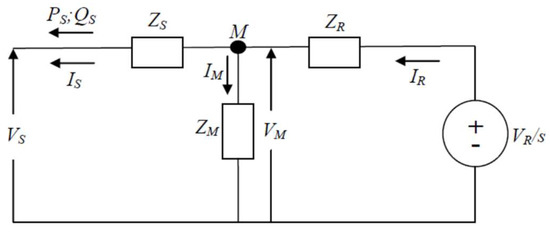
Figure 2.
Equivalent circuit of DFIG.
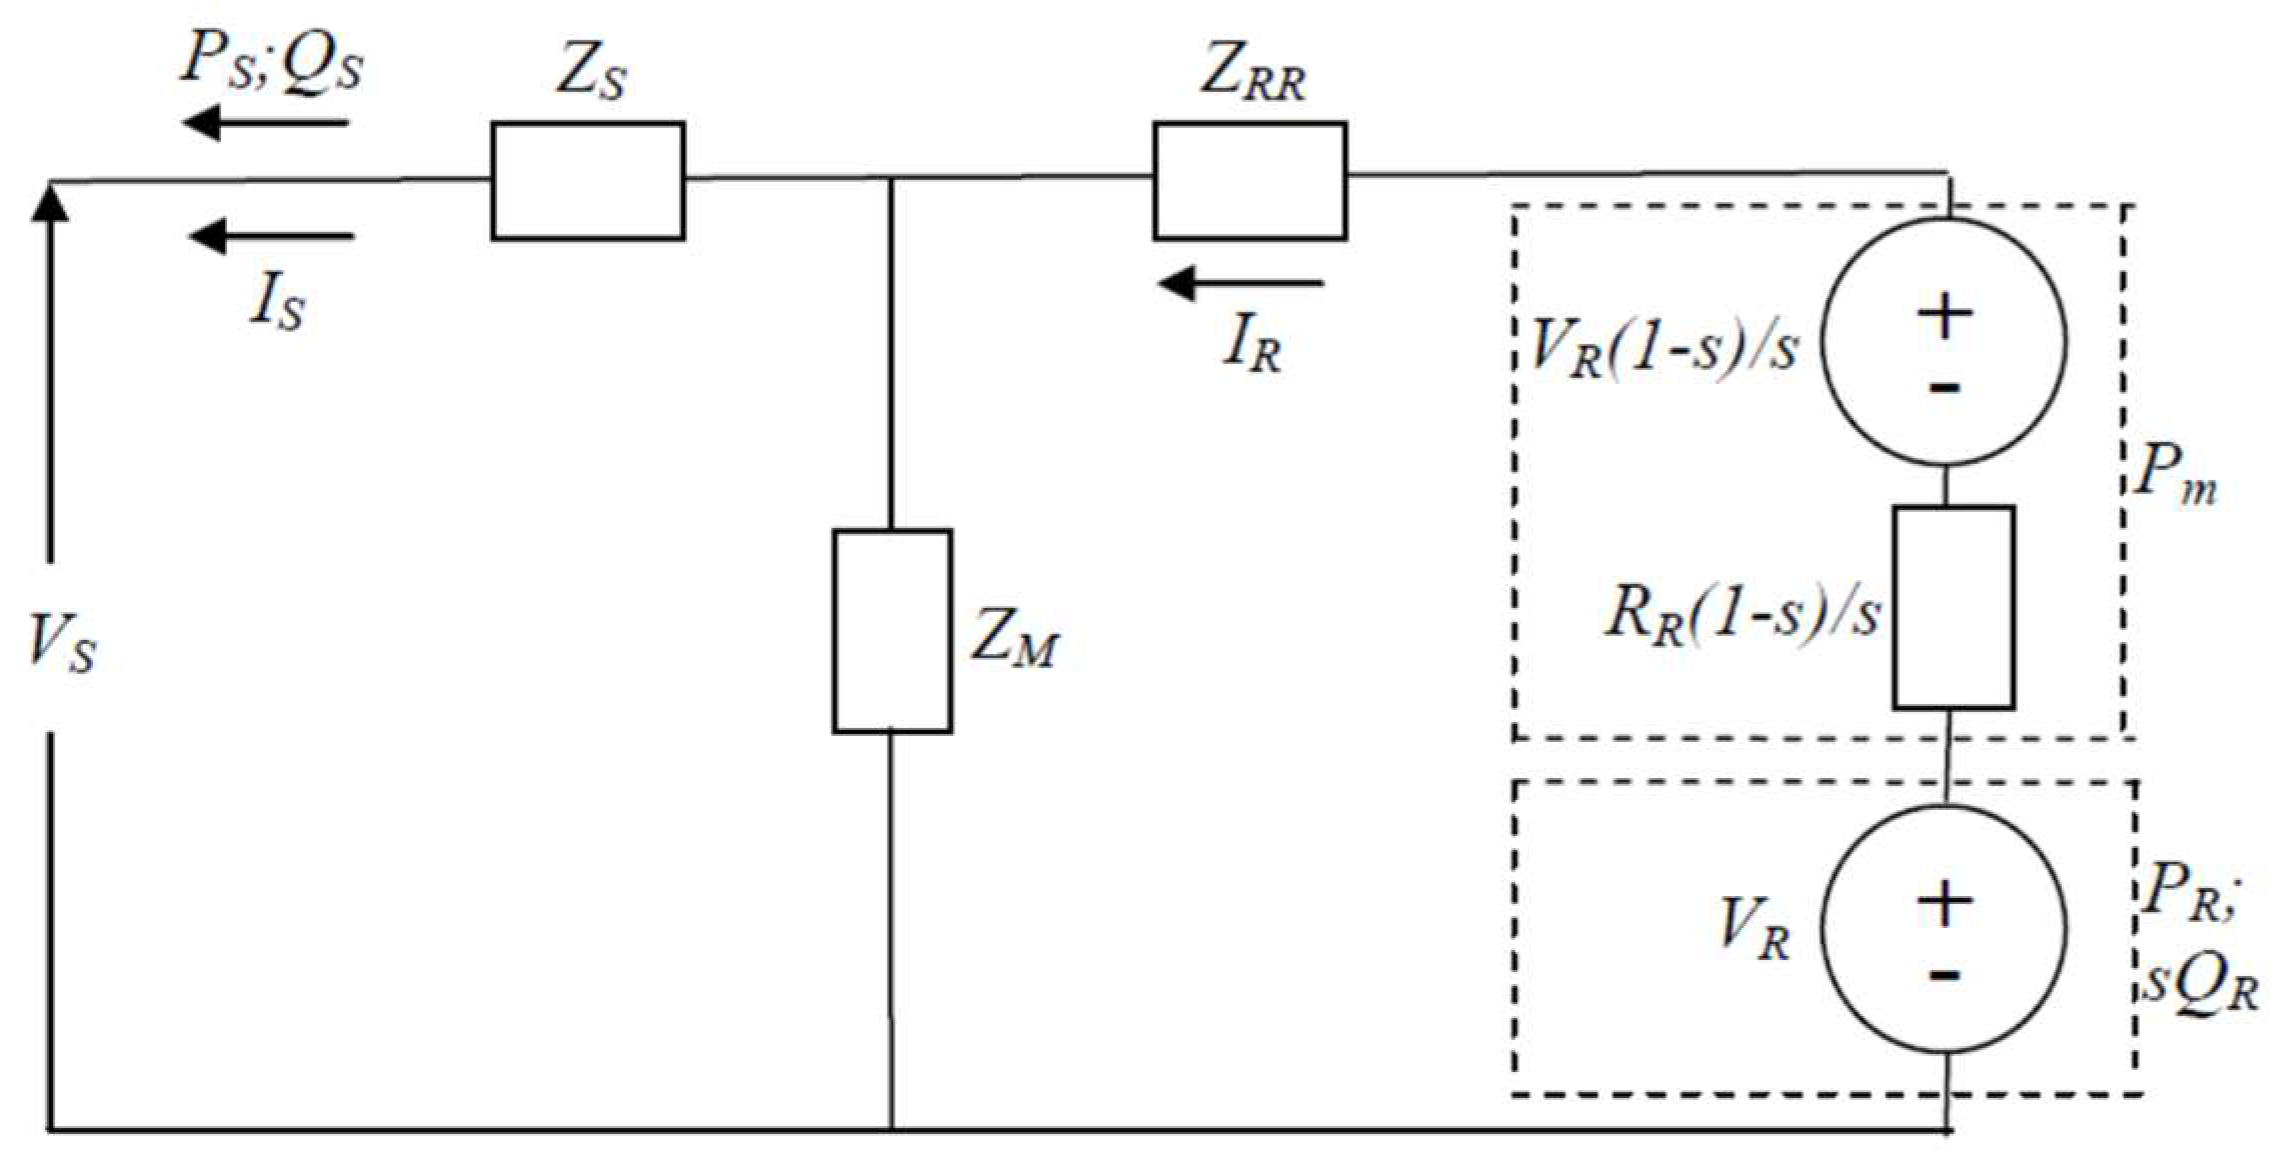
Figure 3 also shows an equivalent circuit of DFIG. In Figure 3, modification to the circuit in Figure 2 has been made to represent the turbine mechanical power and rotor power in the equivalent circuit. A more detailed explanation of DFIG power formulas will be given in the next section. It is to be noted that ZRR in Figure 3 is determined using:
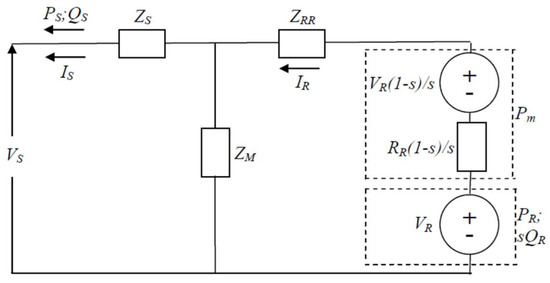
Figure 3.
Modified equivalent circuit of DFIG.
3.2. Steady State Model of DFIG-Based WPP
By referring to Figure 1, the active and reactive powers in DFIG stator are:
where is power factor angle of the DFIG.
In addition, by looking at Figure 2 and Figure 3, the stator, rotor, and mechanical powers can be formulated as follows:
where superscript ‘*’ denotes the complex conjugate.
On using (7) in (8a), the following equation that relates DFIG powers, power factor, and stator voltage/current can be obtained as:
Based on (8b) and (9), the steady state model of DFIG in power factor control mode for load flow analysis is proposed as follows:
The mathematical model (10) is then integrated into the power system load flow problem formulation without WPP as follows [27,28]:
where:
| i = 1, 2, …, n | : | bus number |
| n | : | total number of buses |
| SGi = PGi + jQGi | : | power generation at bus i |
| SLi = PLi + jQLi | : | power load at bus i |
| Vi = |Vi|ejδi | : | voltage at bus i |
| Yij = |Yij|ejθij | : | element ij of admittance matrix |
The two sets of Equations (10) and (11) are then simultaneously solved for the unknown electrical quantities. Details of the equations to be solved and electrical quantities to be computed are presented in Table 1. Since VS is also the voltage at the WPP terminal or bus (Vi), then for every WPP bus, |Vi| and δi are included as the unknown quantities. Moreover, power generations at the WPP bus are PG = Pg and QG = Pgtan. It can also be shown that the rotor voltage and current in (10a) can be related to the stator voltage and current using:
where:

Table 1.
Type of buses, equation and quantities.
On using (12b) in (8c), the rotor active power in (10) can also be related to stator voltage and current as follows:
4. Case Study
4.1. Test System
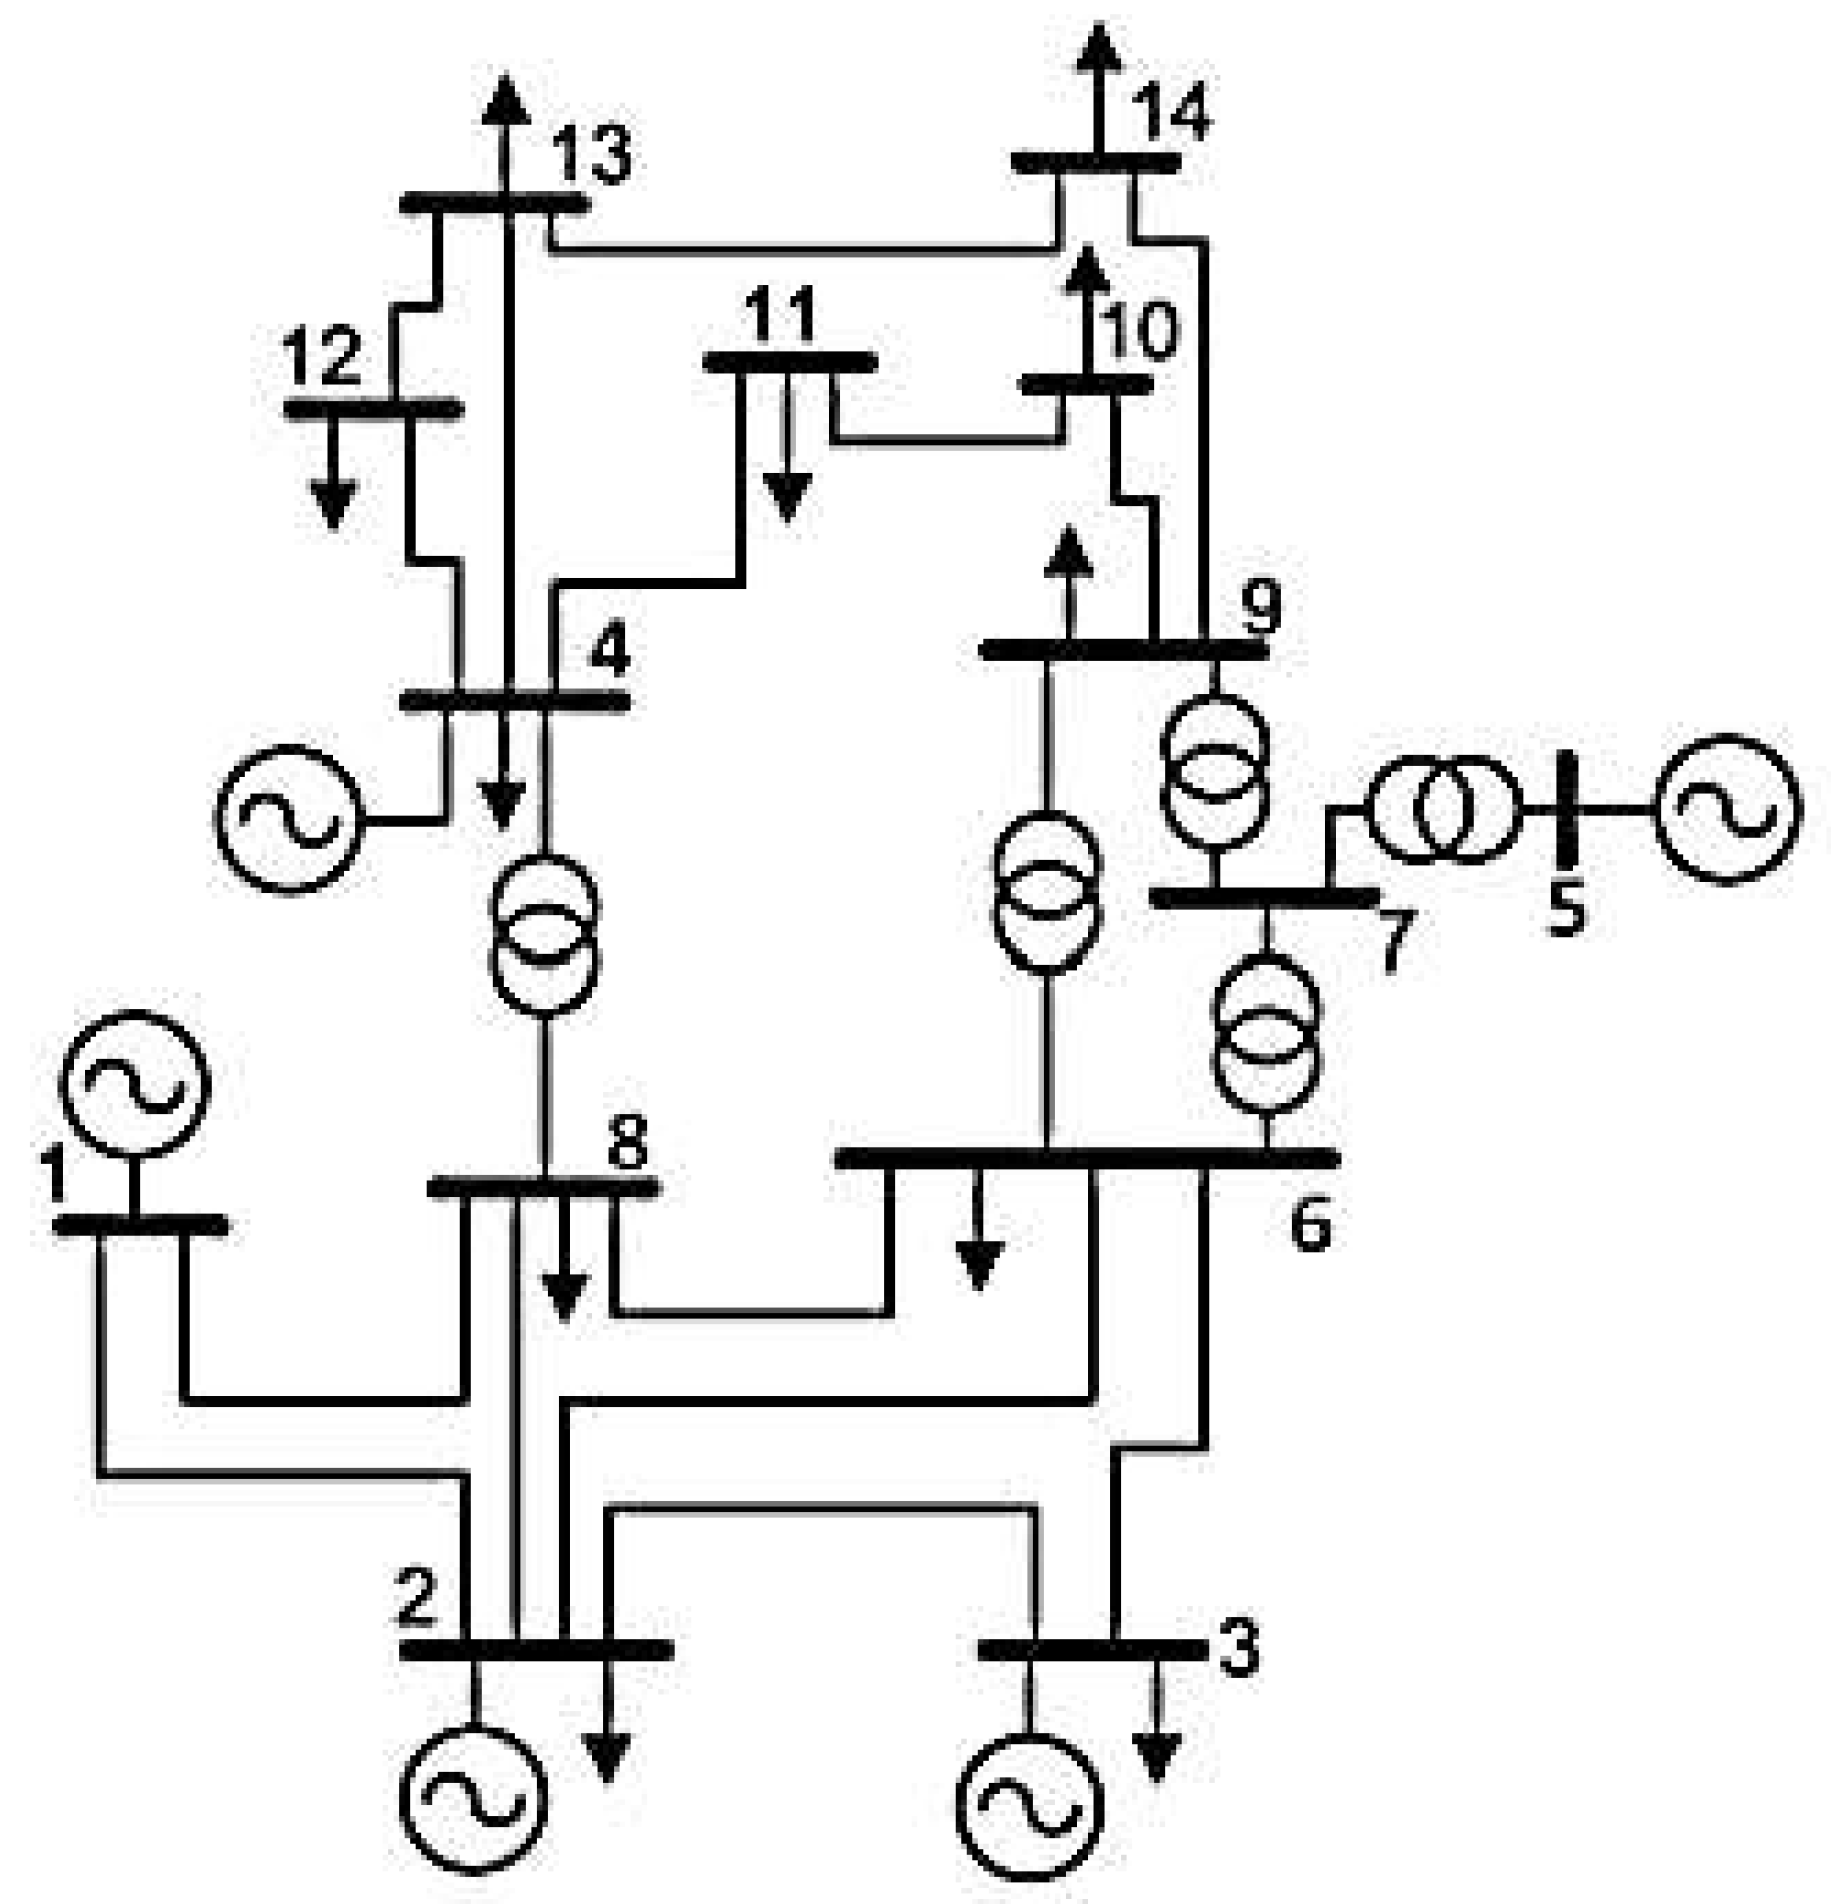
The case study is based on the IEEE 14-bus power system adopted from [29] (see Figure 4). The system has a total three-phase load of 897 MW and 243.9 MVAR. Data for the test system are presented in Table 2 and Table 3. The system is then modified by adding WPP at bus 14 via a step-up transformer with an impedance of j0.05 pu. The WPP consists of 100 identical wind turbine generator (WTG) units. Data for the WTG unit are given in Table 4. A base value of 100 MVA has been used for all data in pu.
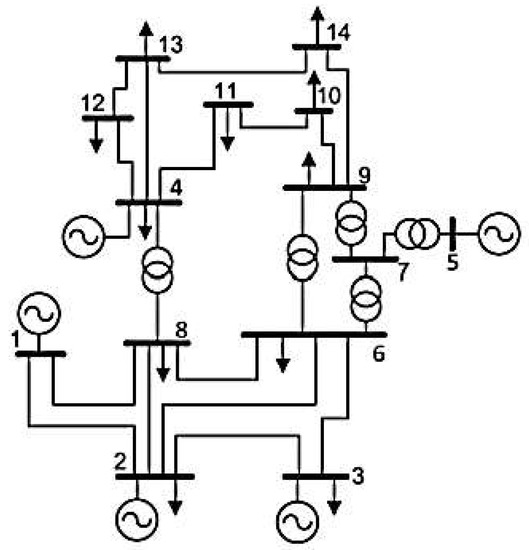
Figure 4.
Test system.
Table 2.
Test system line data (in pu).
Table 3.
Test system bus data (in pu).
Table 4.
WTG unit data.
4.2. WRIG Slip and Turbine Power Calculations
In the present work, the tip speed ratio and turbine performance coefficient have been assumed to be 7.95 and 0.41, respectively [19]. Thus, according to (1), the turbine mechanical power as a function of wind speed is:
In (15), the air density is considered to be normal (or ρ = 1.225 kg/m3). In addition, on using (4), the generator slip as a function of wind speed is:
Table 5 shows the values of machine slip and turbine mechanical power for various wind speeds ranging from 5 to 12 m/s. It has been assumed in the calculations that all wind generator units in the WPP receive the same wind speed (uniform wind speed).
Table 5.
Generator slip and turbine power.
4.3. Aggregation of Wind Turbine Generator Units
In the present work, the group of WTG units is aggregated into a single machine equivalent to simplify the load flow analysis (note: aggregation technique as proposed in [7,23] has been used in the process). In the WPP single machine representation, parameters of the WRIG and pad mount transformer equivalent are presented in Table 6.
Table 6.
Parameter of WPP single machine representation.
The WPP parameter values in Table 6 are then used in the Formulation (10) to obtain the WPP steady state model to be used in load flow analysis.
4.4. Load Flow Results and Discussion
Results of the load flow analysis are presented in Table 7, Table 8, Table 9, Table 10, Table 11, Table 12, Table 13, Table 14 and Table 15. Three power factor operation modes of DFIG, namely: unity, leading, and lagging power factors, are considered in the case study. The results are also given in graphical forms (see Figure 5, Figure 6, Figure 7, Figure 8, Figure 9, Figure 10, Figure 11, Figure 12, Figure 13 and Figure 14). In Table 8, Table 11 and Table 14, PLOSS is the WRIG active power loss, and QLOSS is the WRIG reactive power loss. These WRIG power losses are calculated using the following formula:
Table 7.
DFIG power flow (PF = 1.0).
Table 8.
DFIG reactive power and losses (PF = 1.0).
Table 9.
WPP voltages, G1 to G5 power outputs and line losses (PF = 1.0).
Table 10.
DFIG power flow (PF = 0.95 leading).
Table 11.
DFIG reactive power and losses (PF = 0.95 leading).
Table 12.
WPP voltages, G1 to G5 power outputs and line losses (PF = 0.95 leading).
Table 13.
DFIG power flow (PF = 0.95 lagging).
Table 14.
DFIG reactive power and losses (PF = 0.95 lagging).
Table 15.
WPP voltages, G1 to G5 power outputs and line losses (PF = 0.95 lagging).

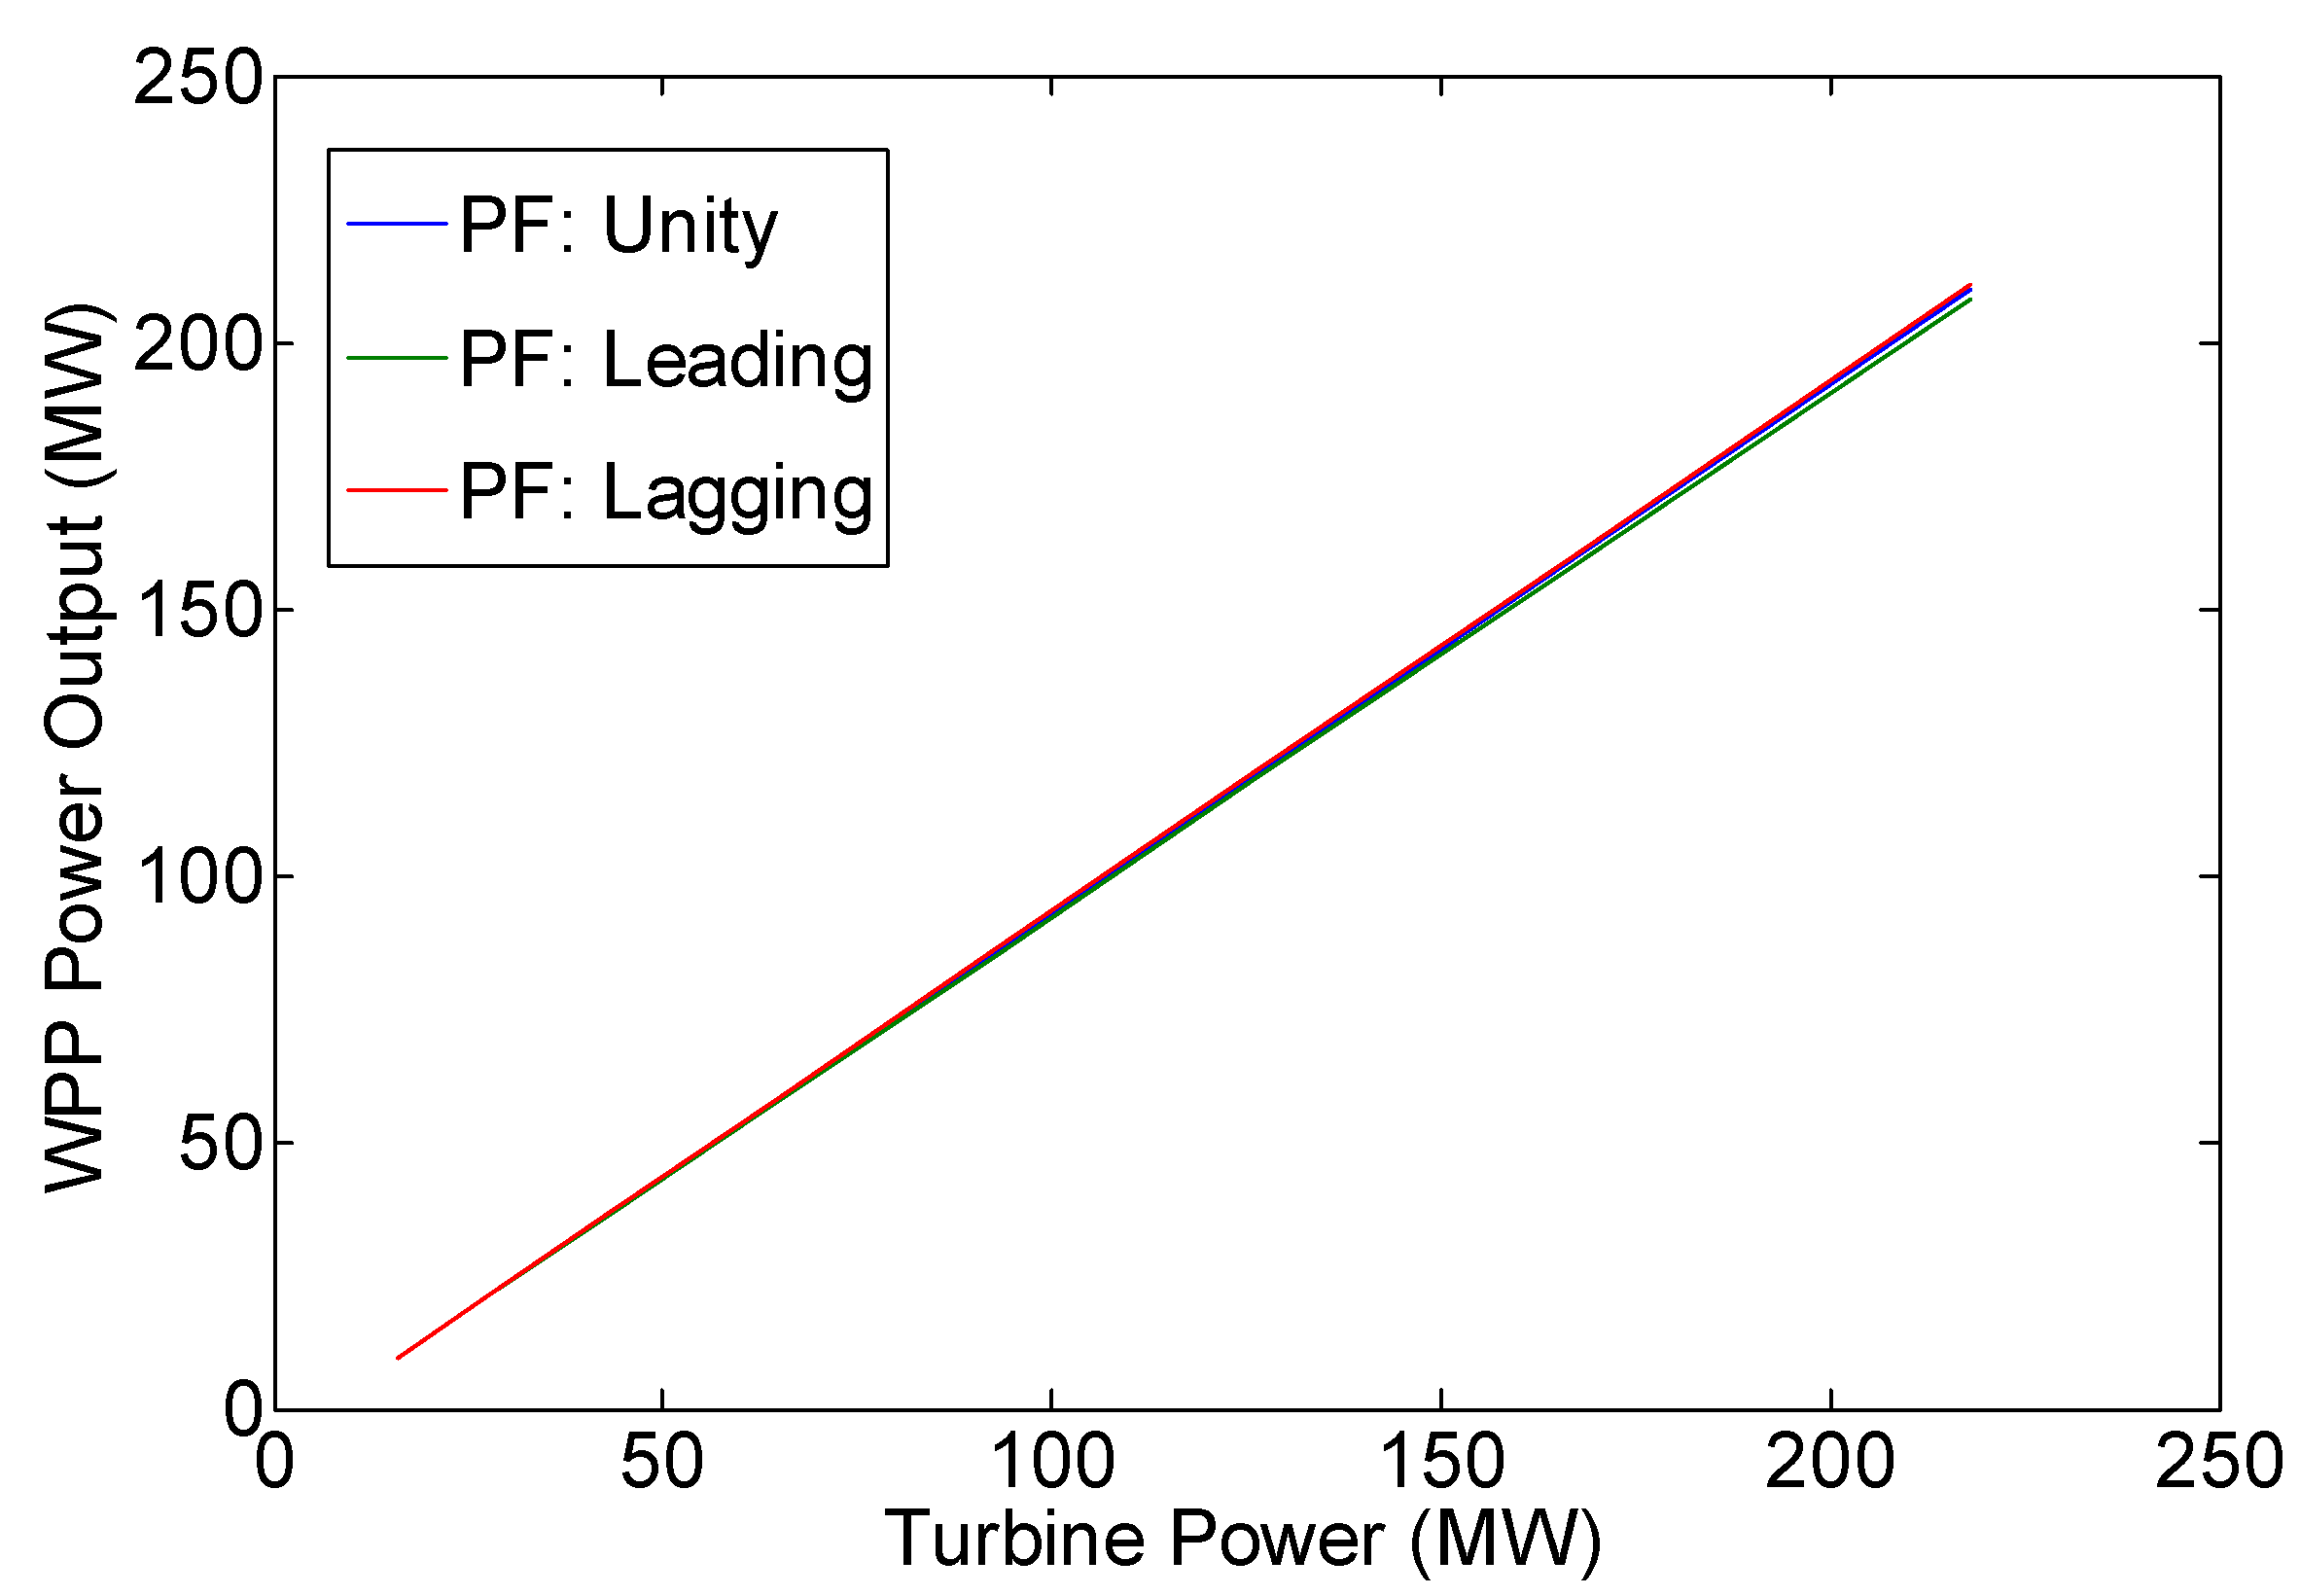
Figure 5.
Variation of WPP active power output (Pg).
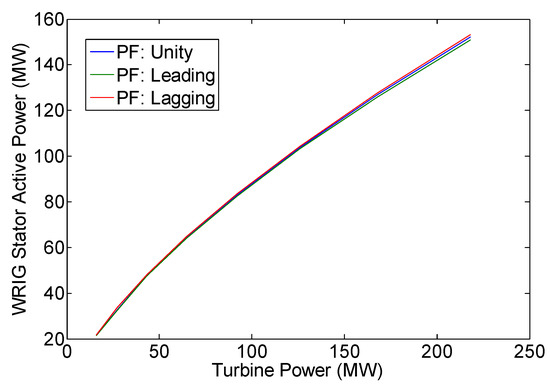
Figure 6.
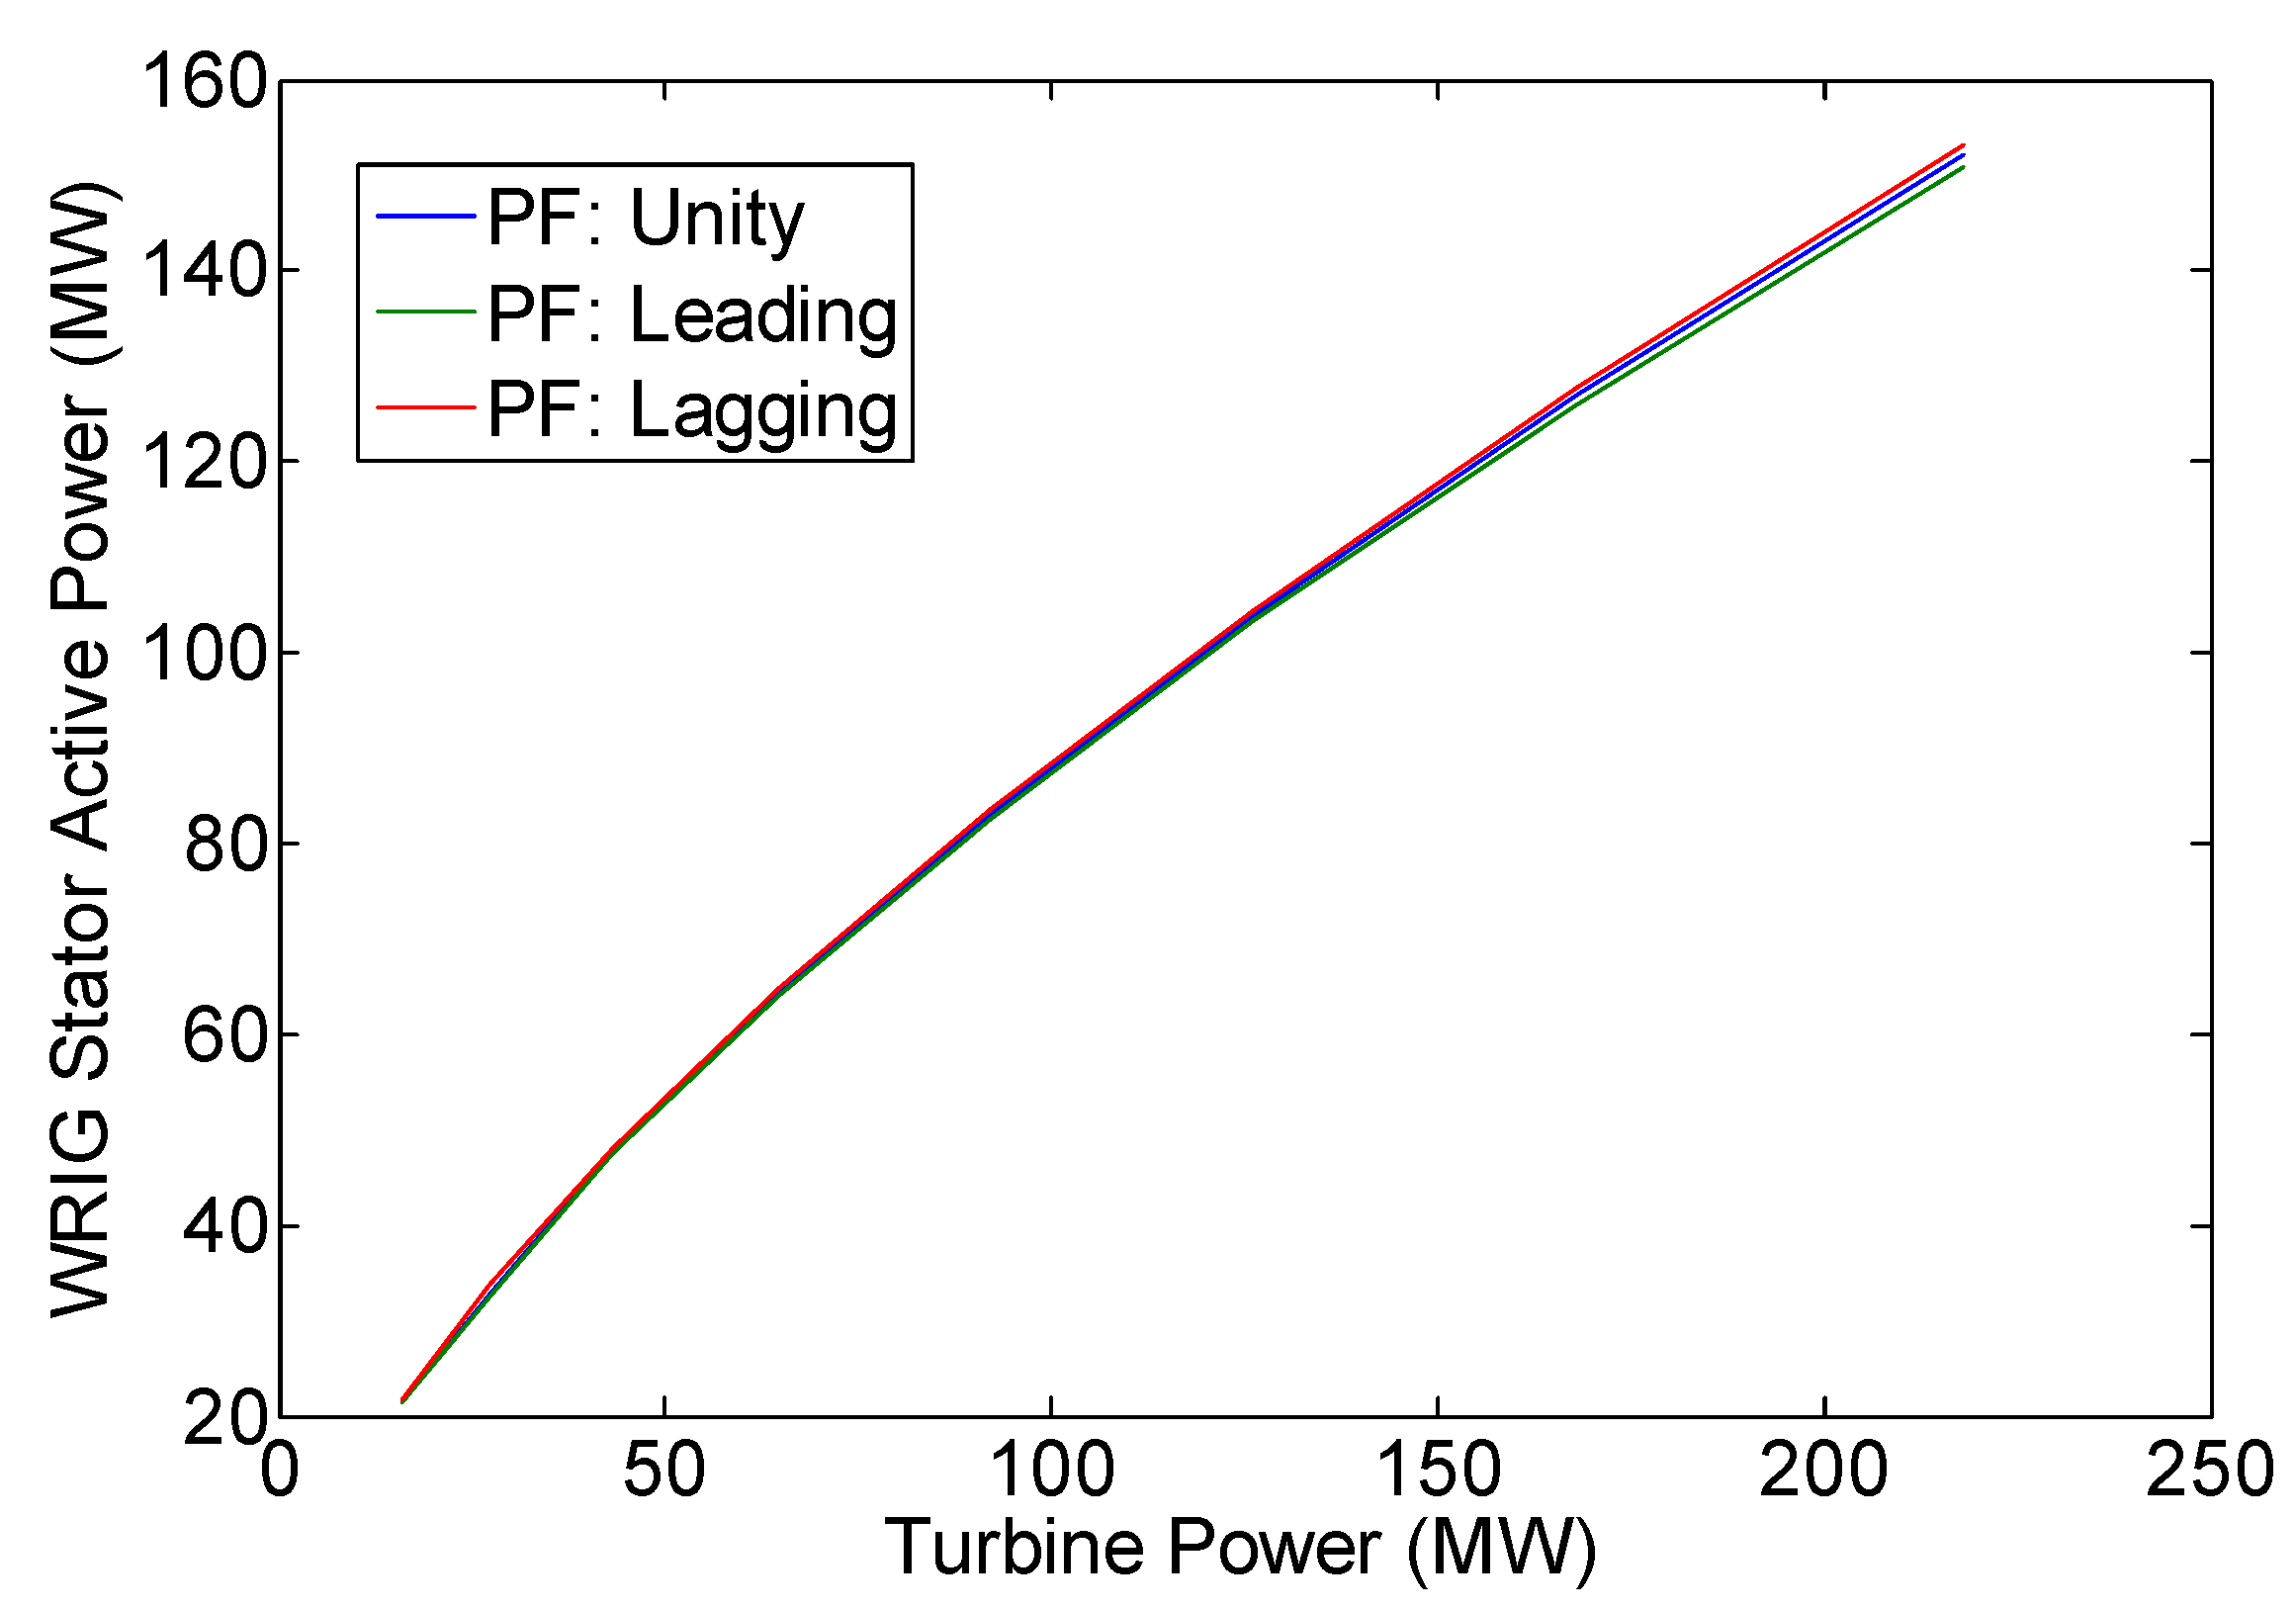
Variation of WRIG stator power (PS).

Figure 7.
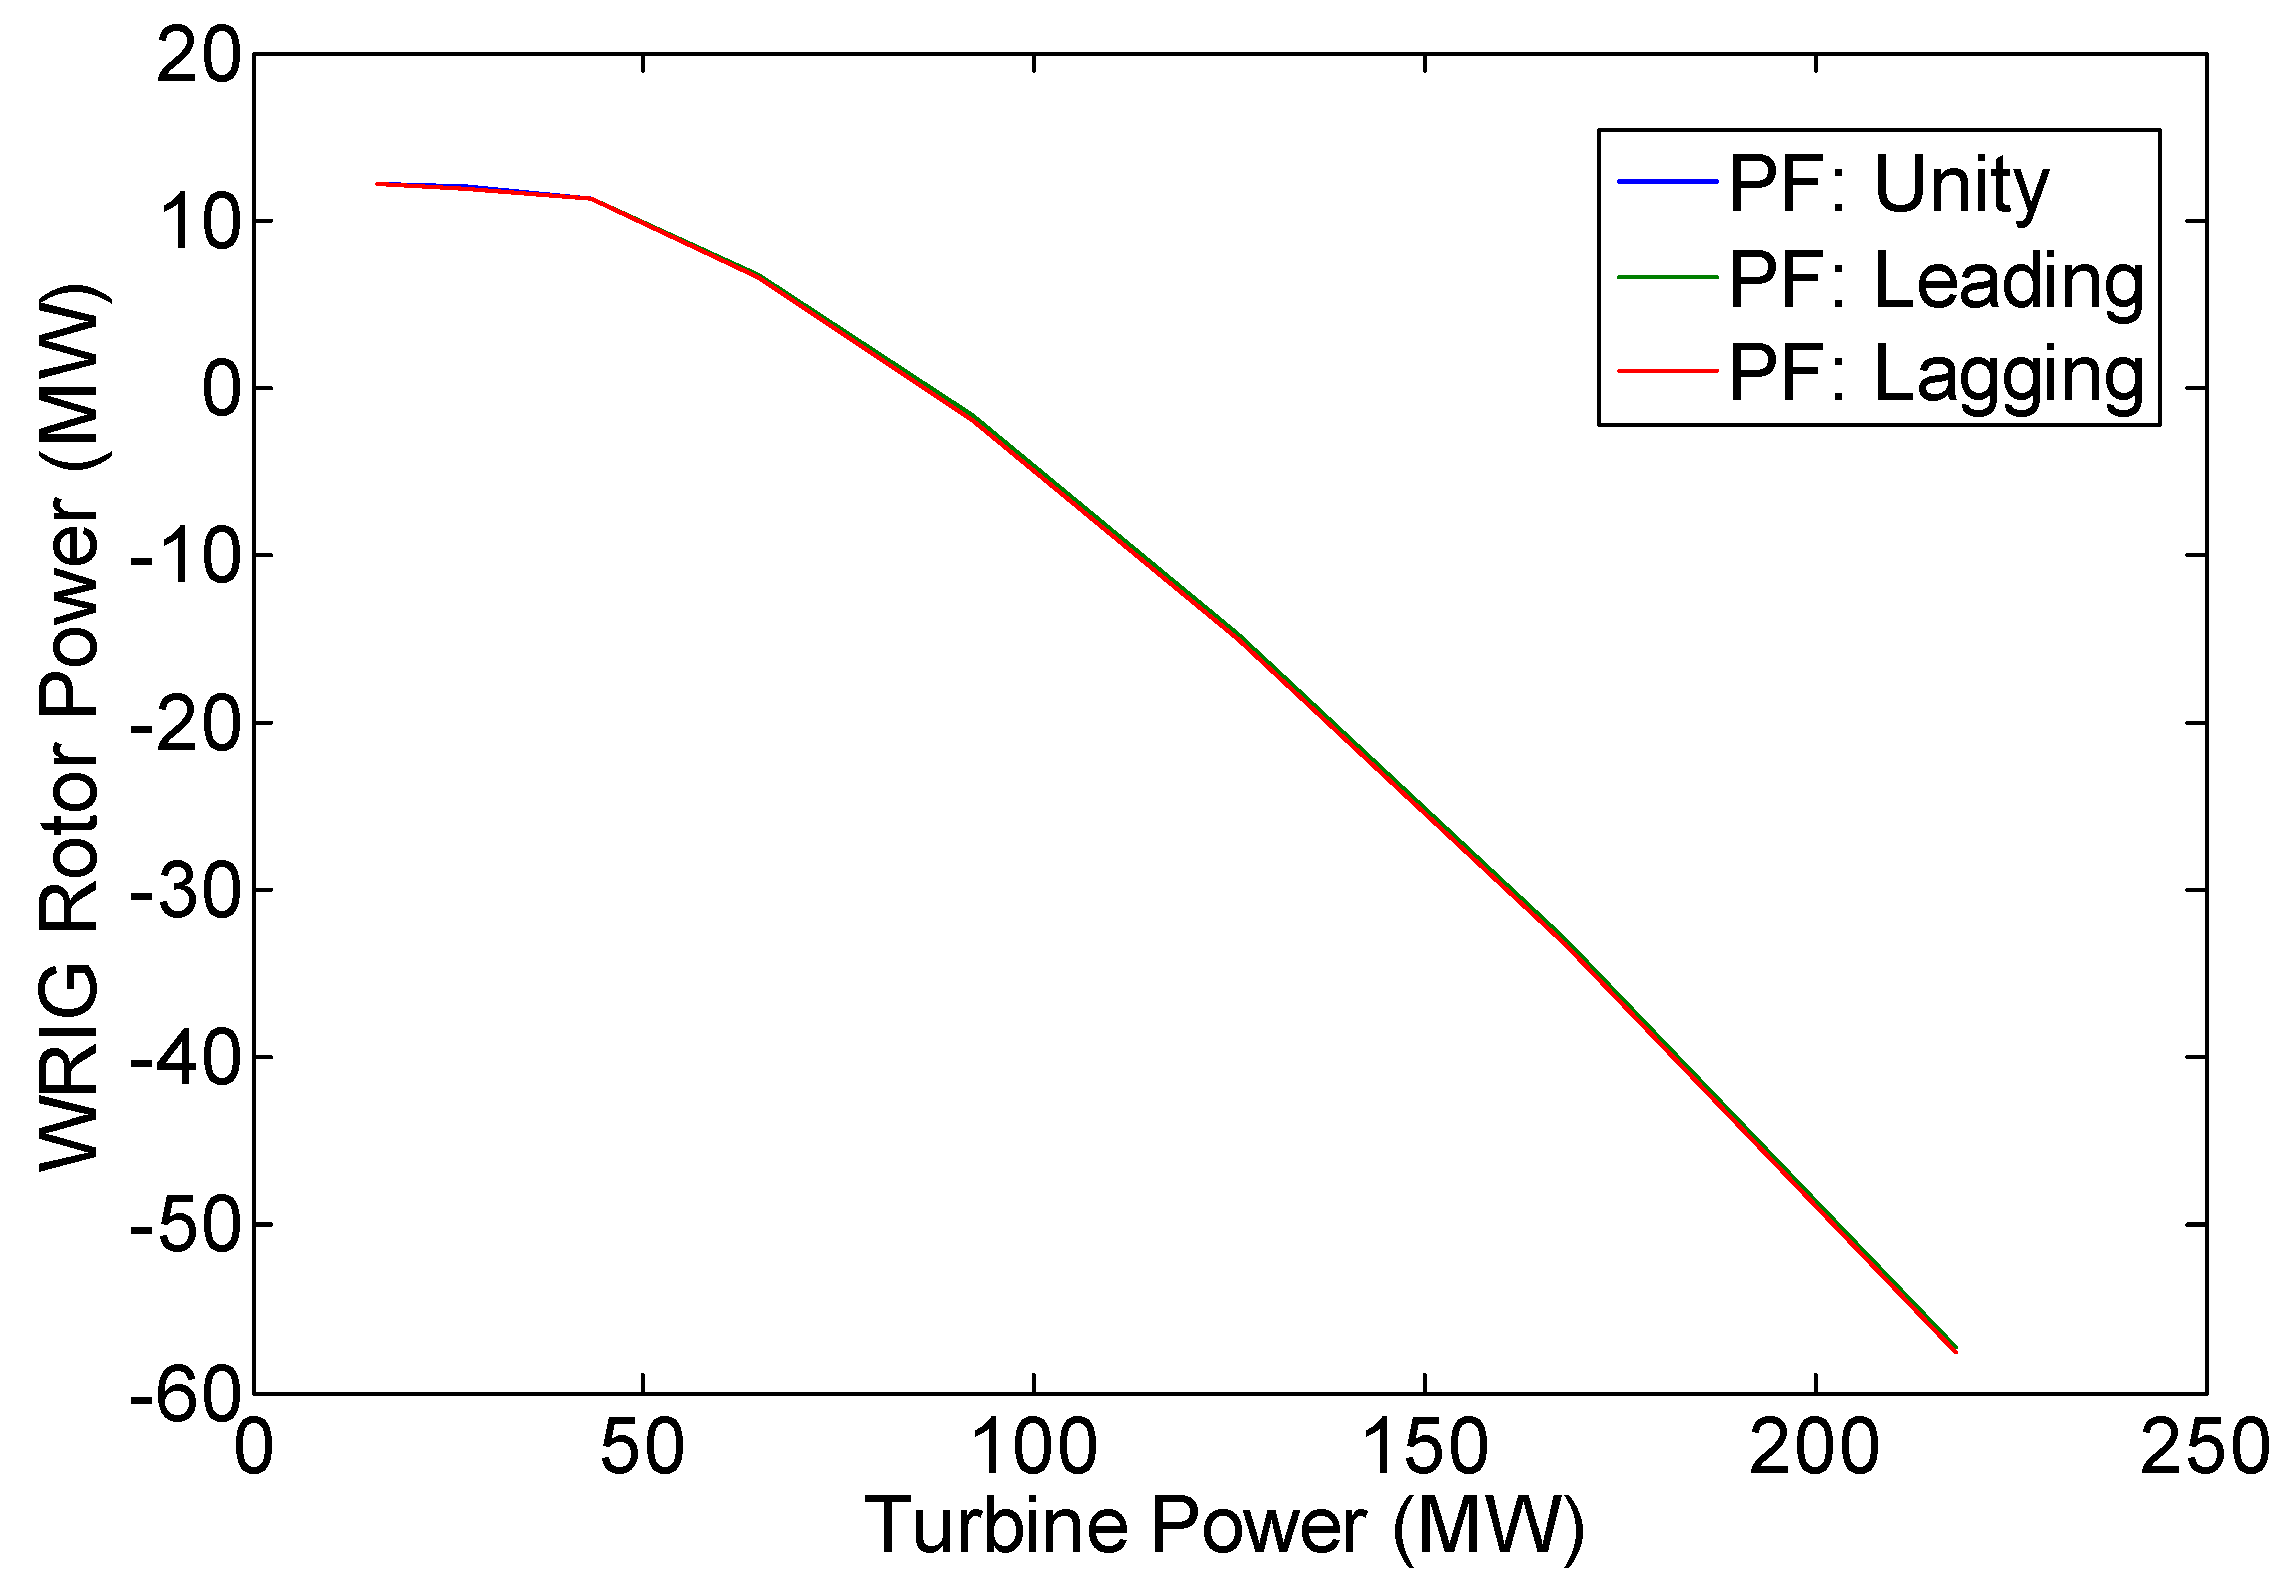
Variation of WRIG rotor power (PR).
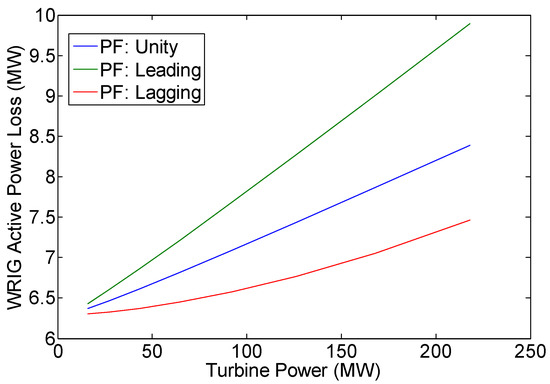
Figure 8.
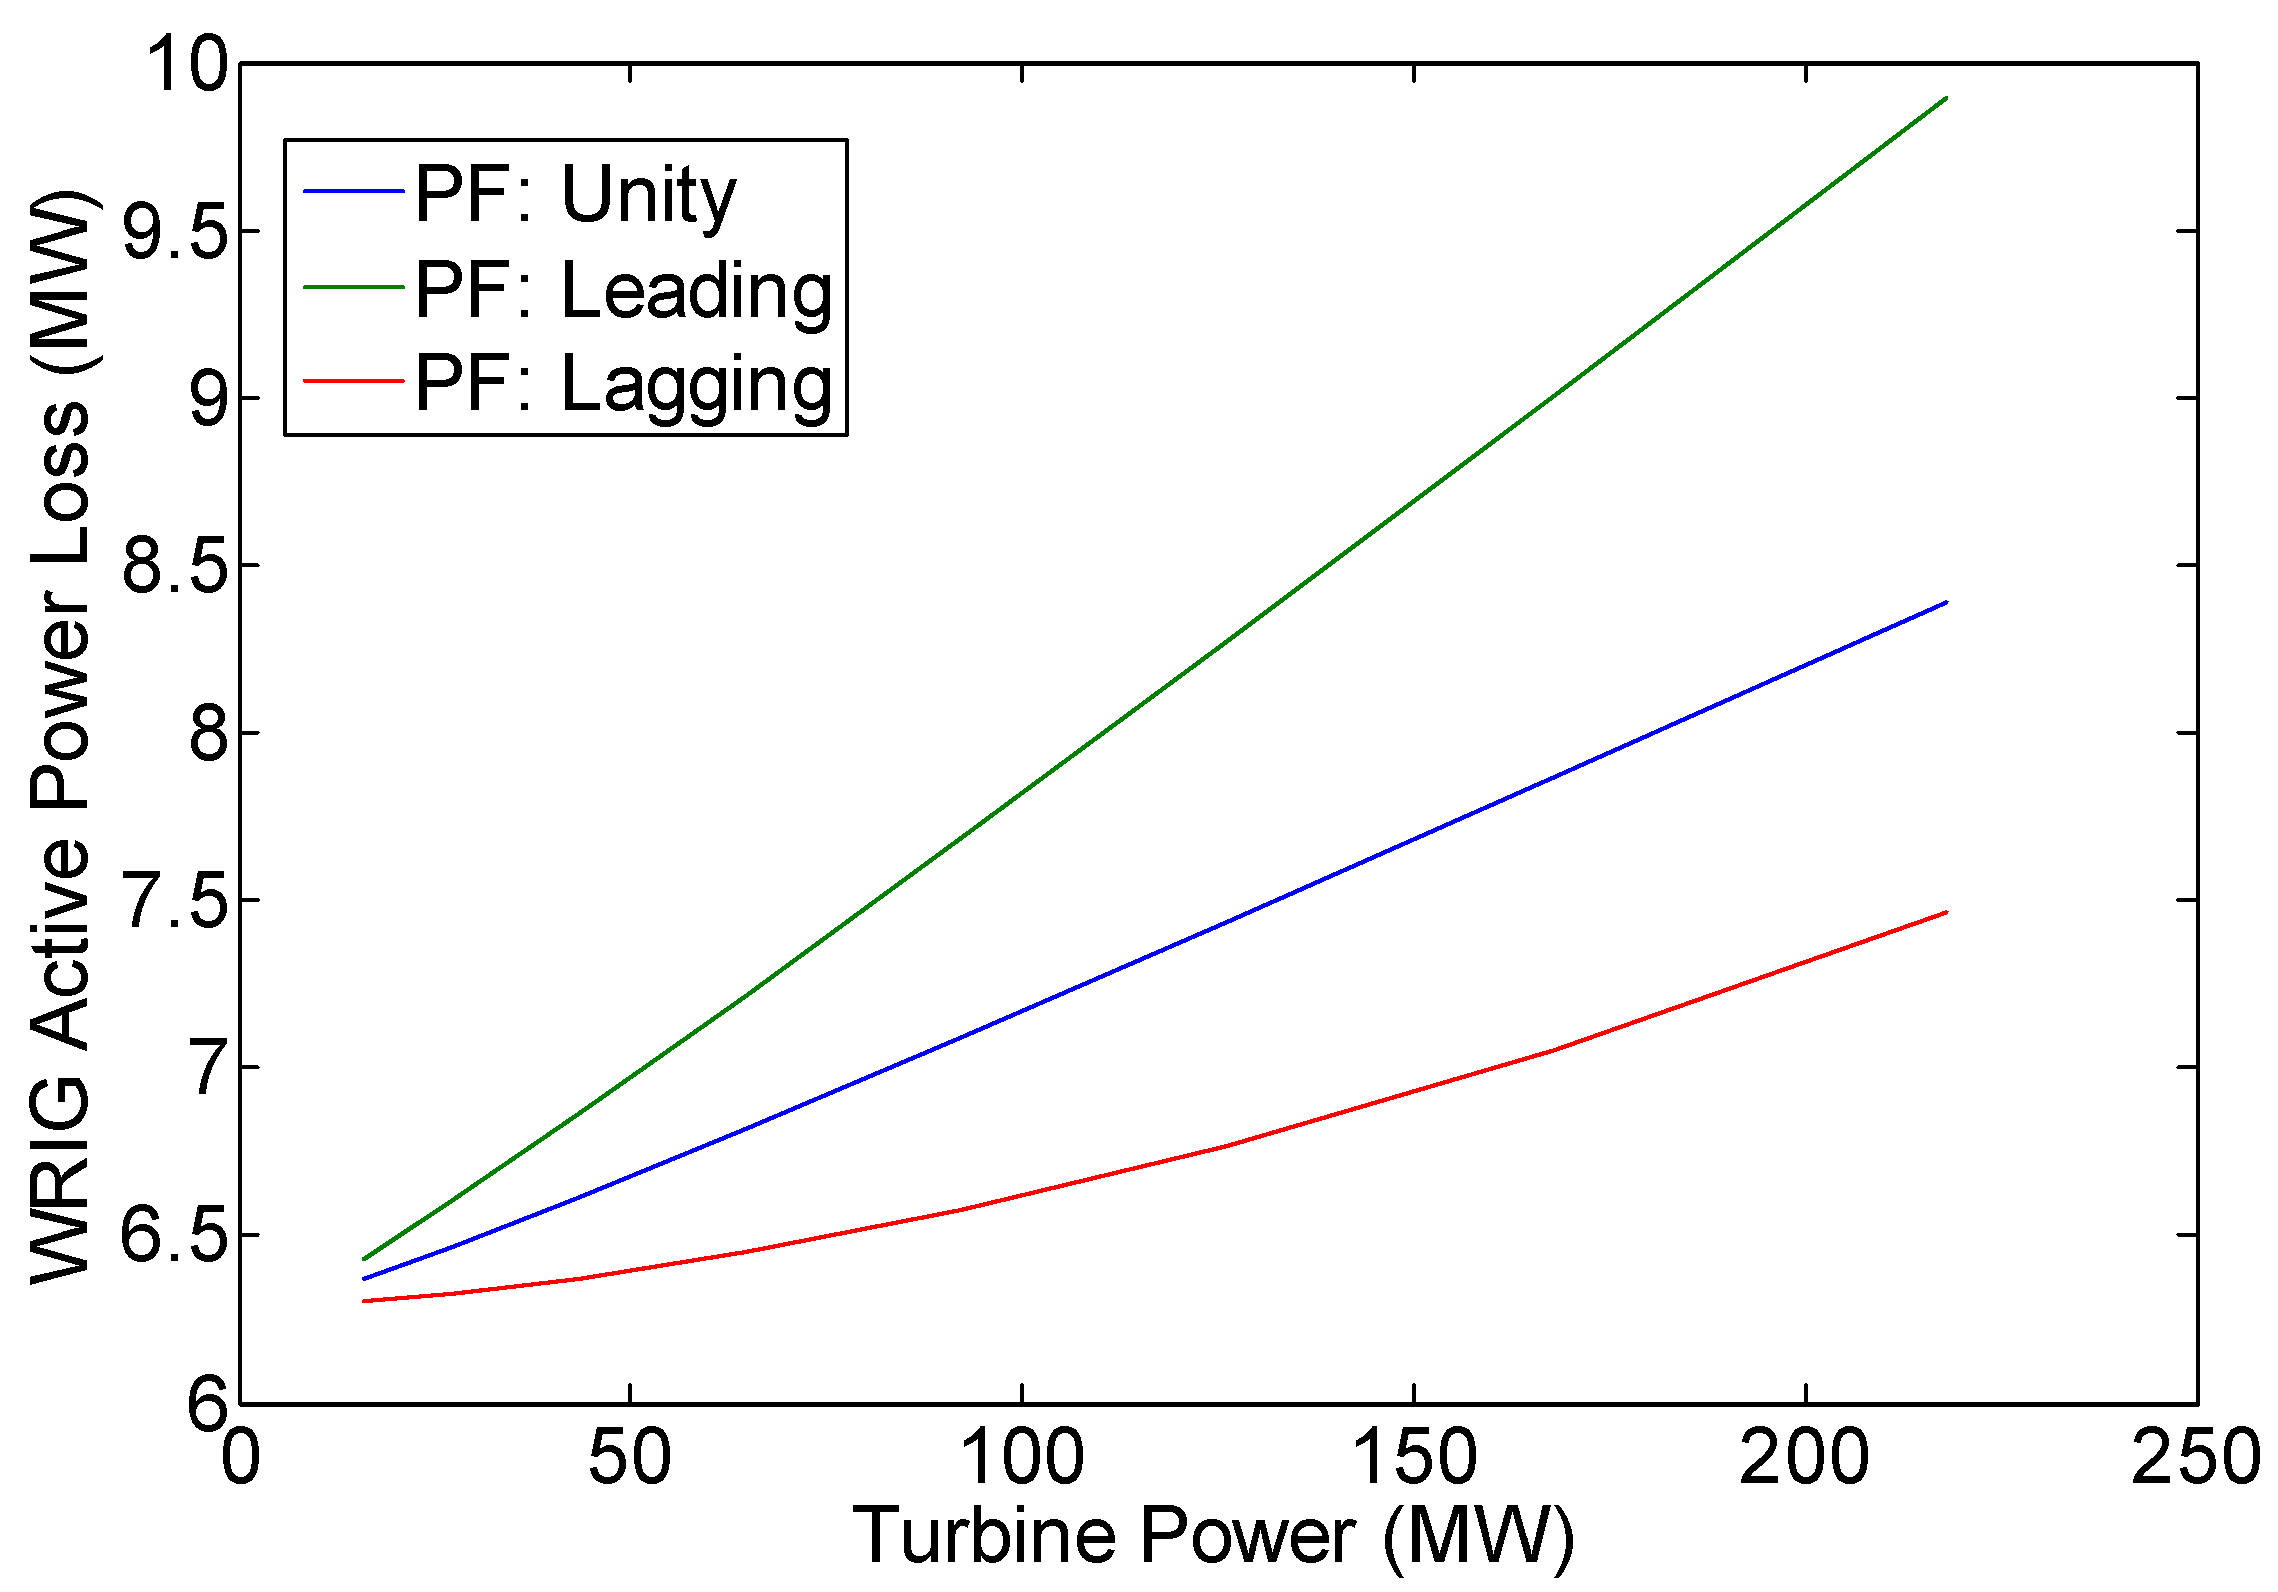
Variation of WRIG active power loss (PLOSS).
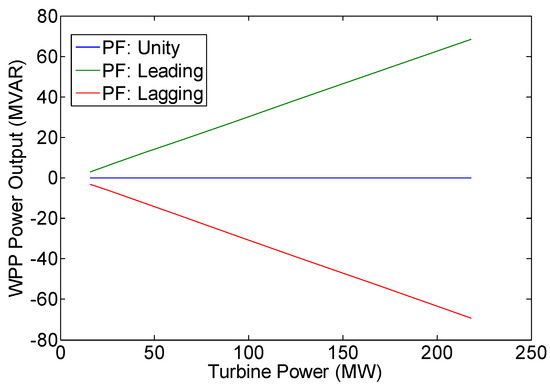
Figure 9.
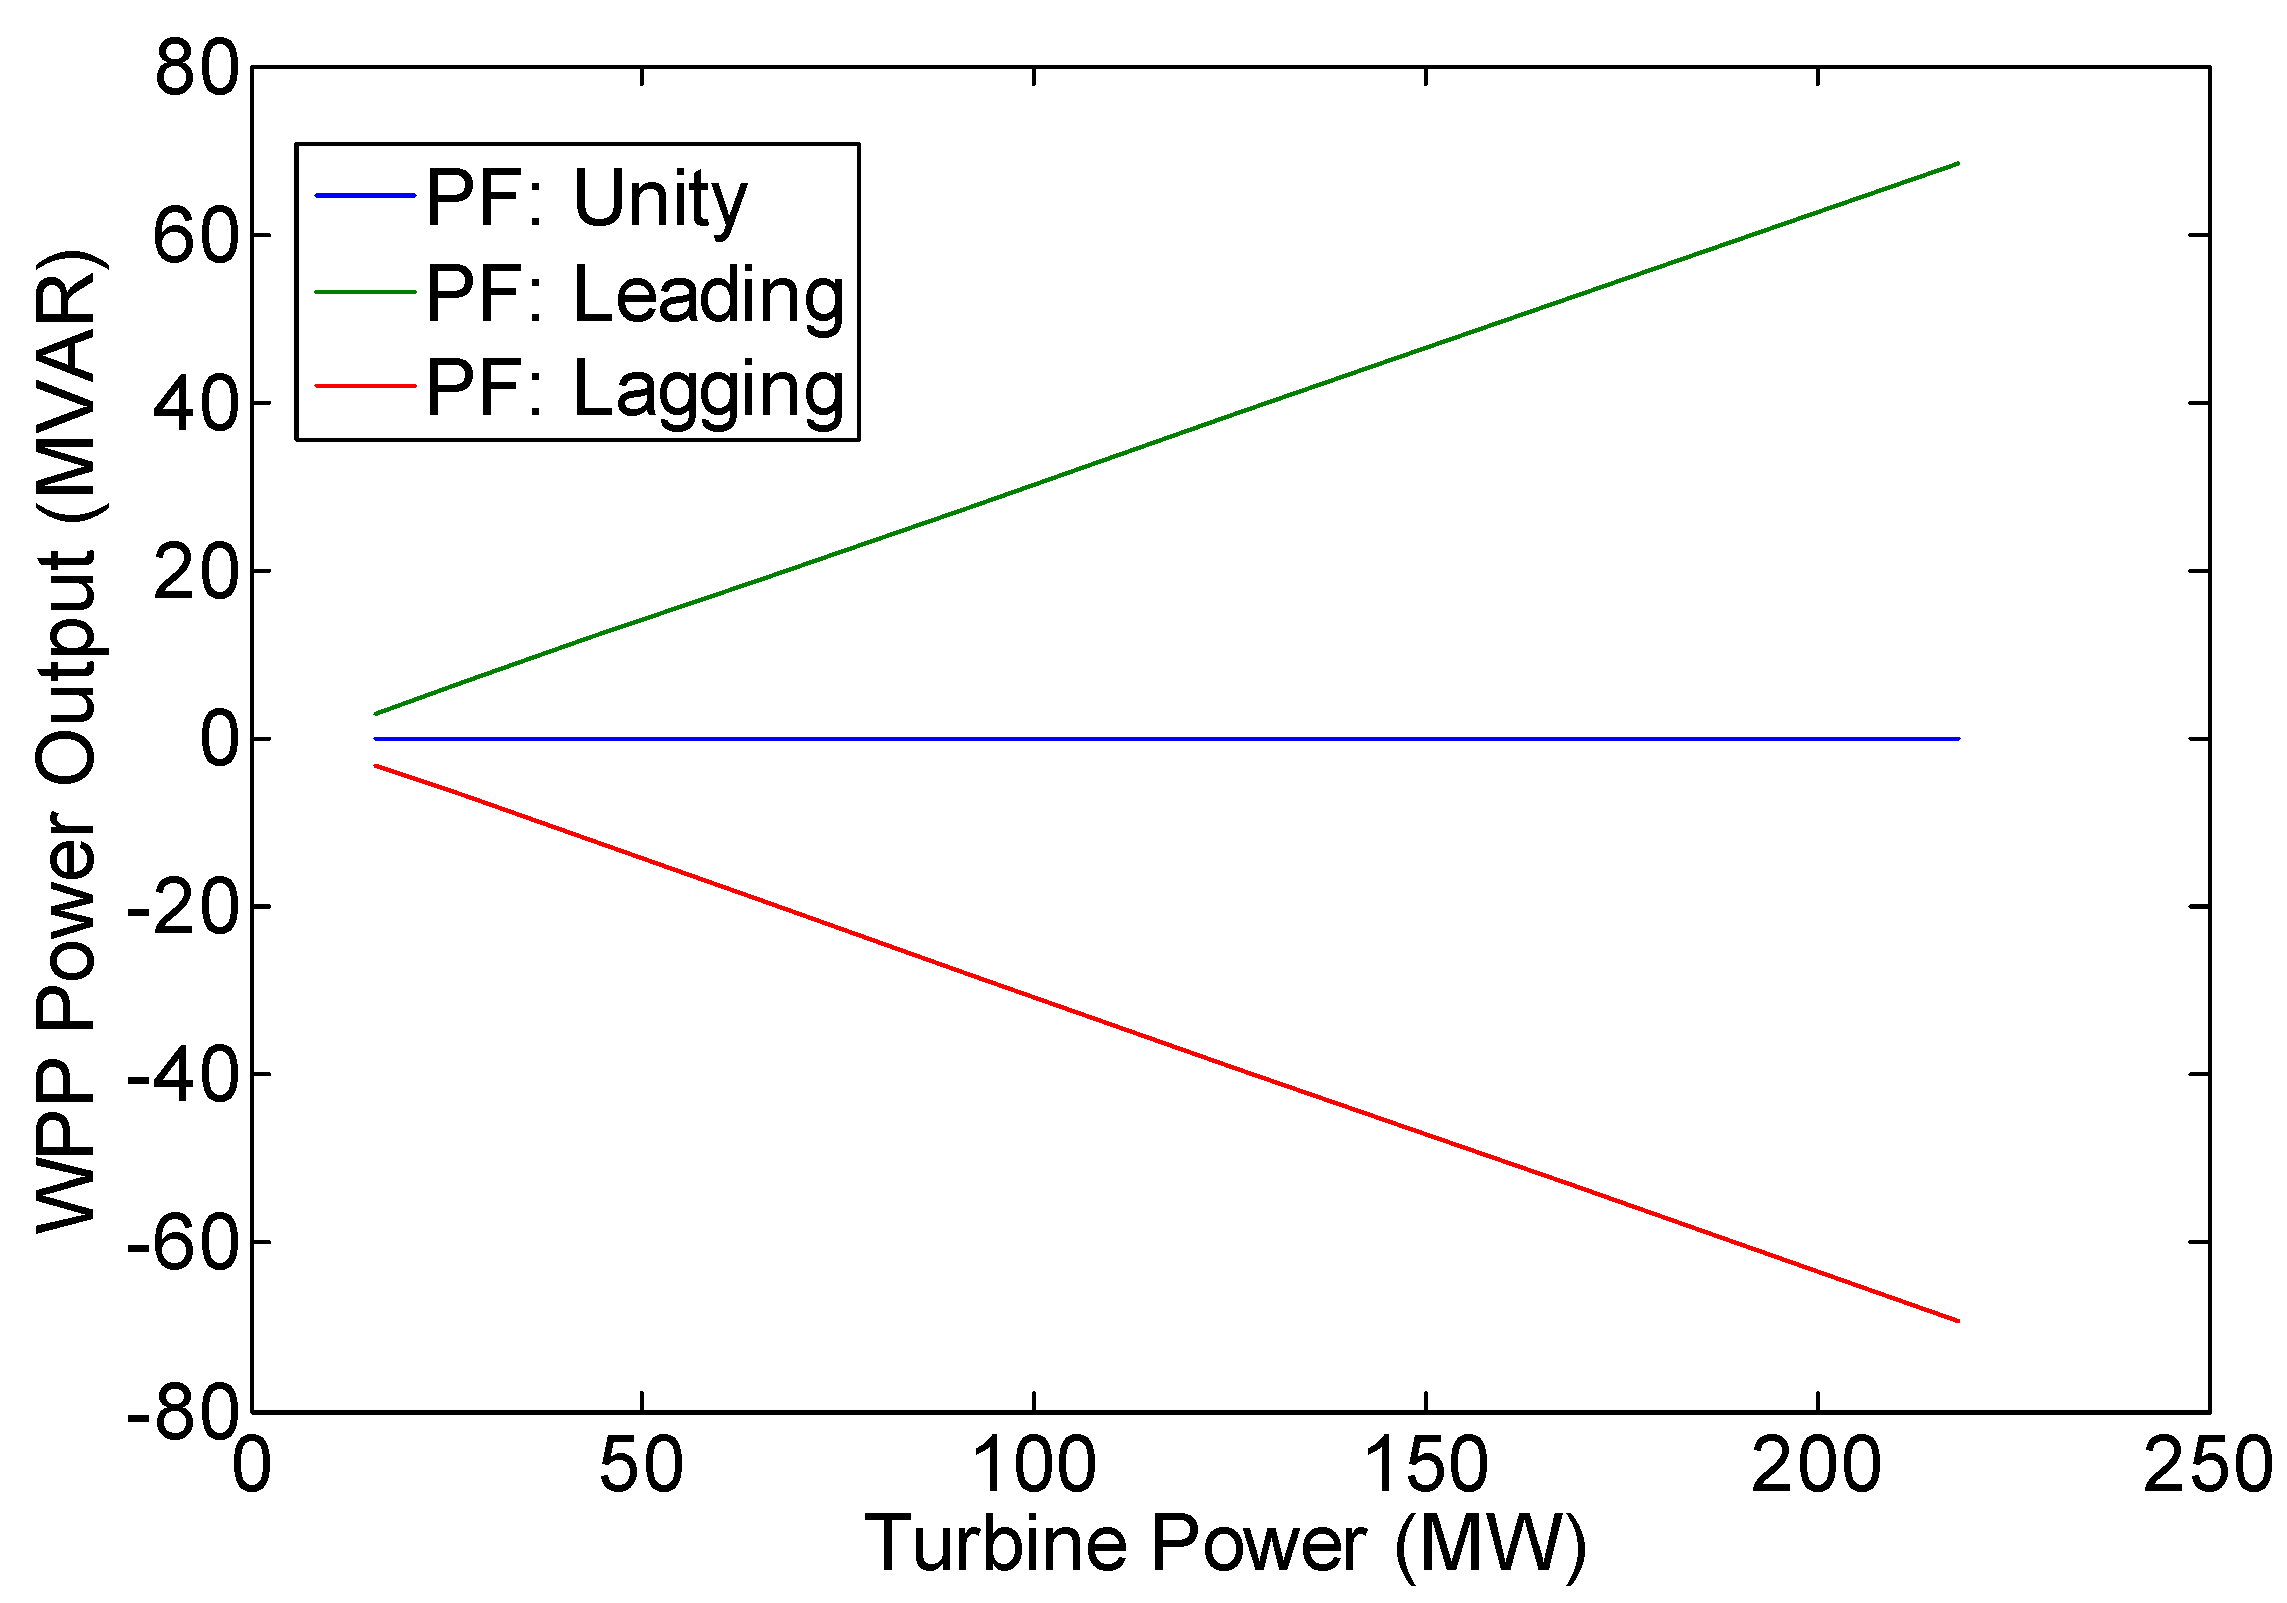
Variation of WPP reactive power output (Qg).
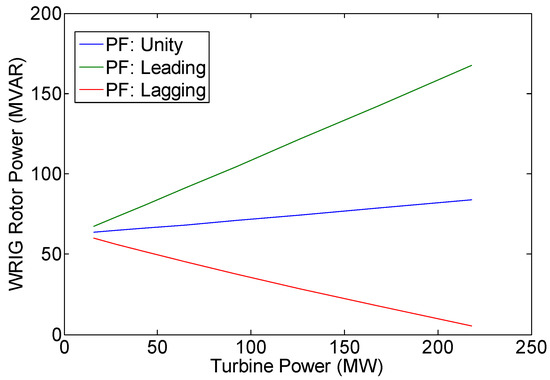
Figure 10.
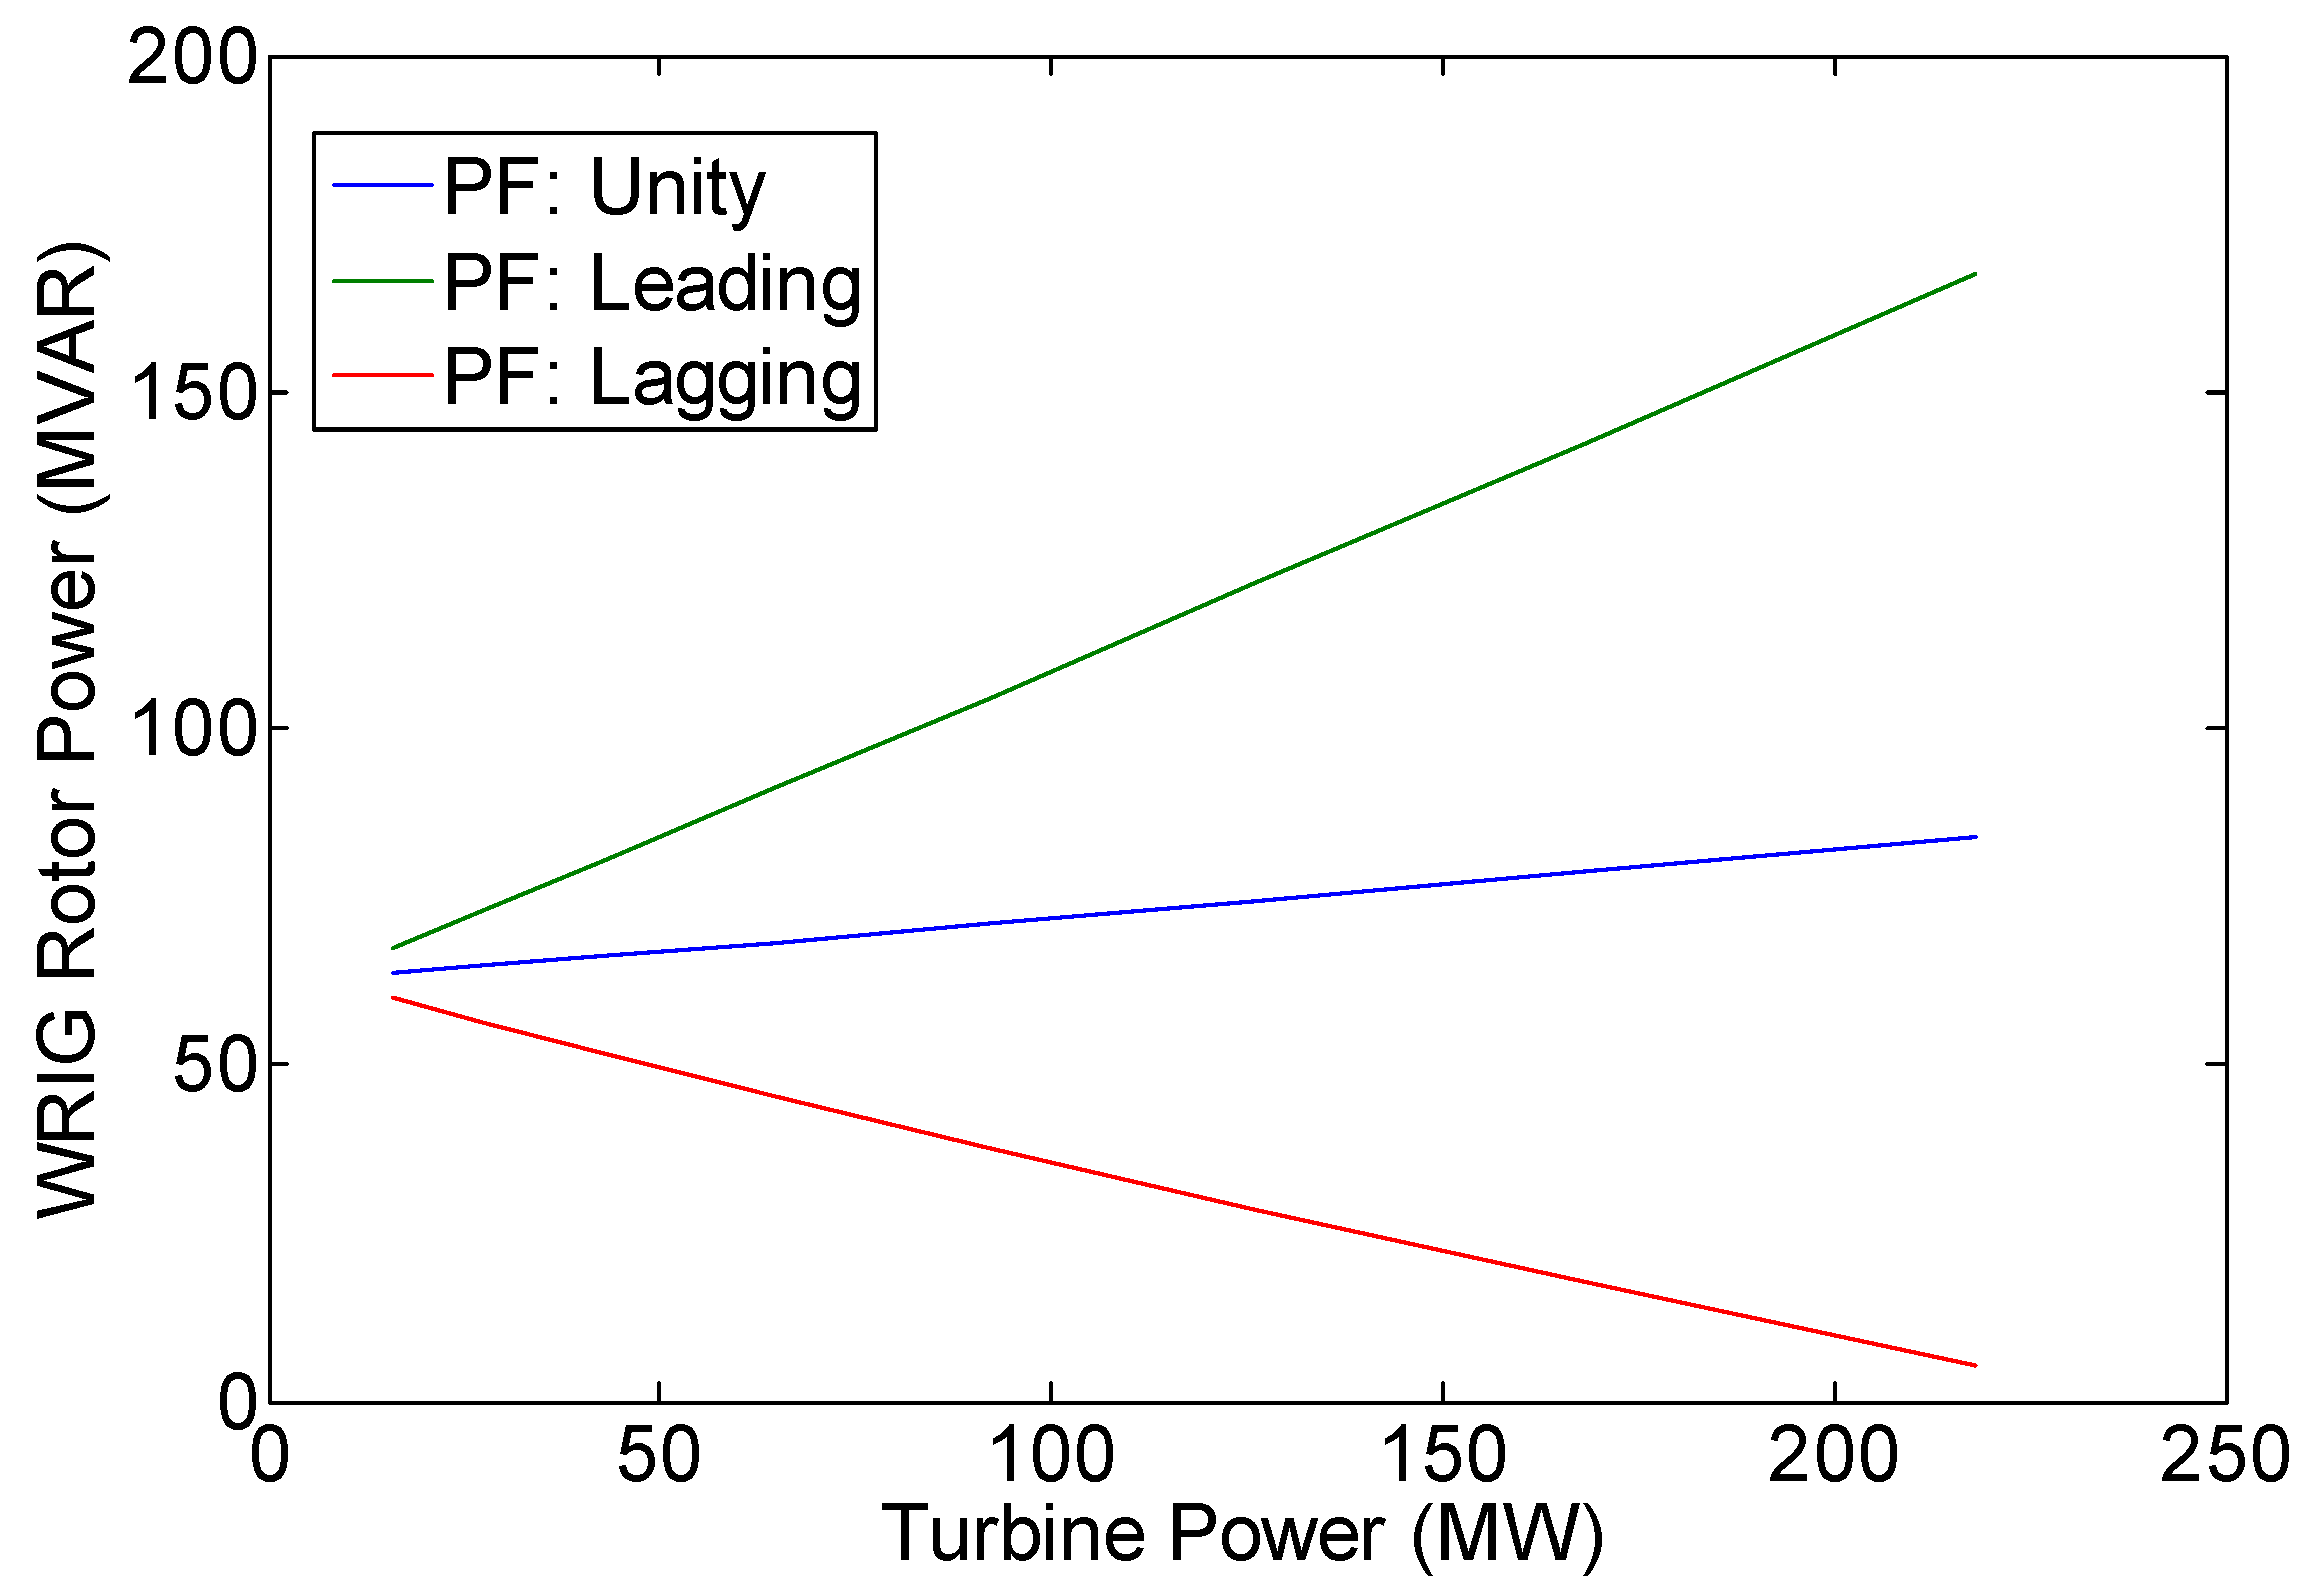
Variation of WRIG rotor power (QR).
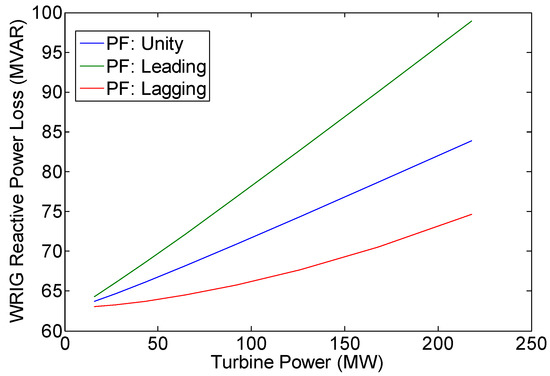
Figure 11.
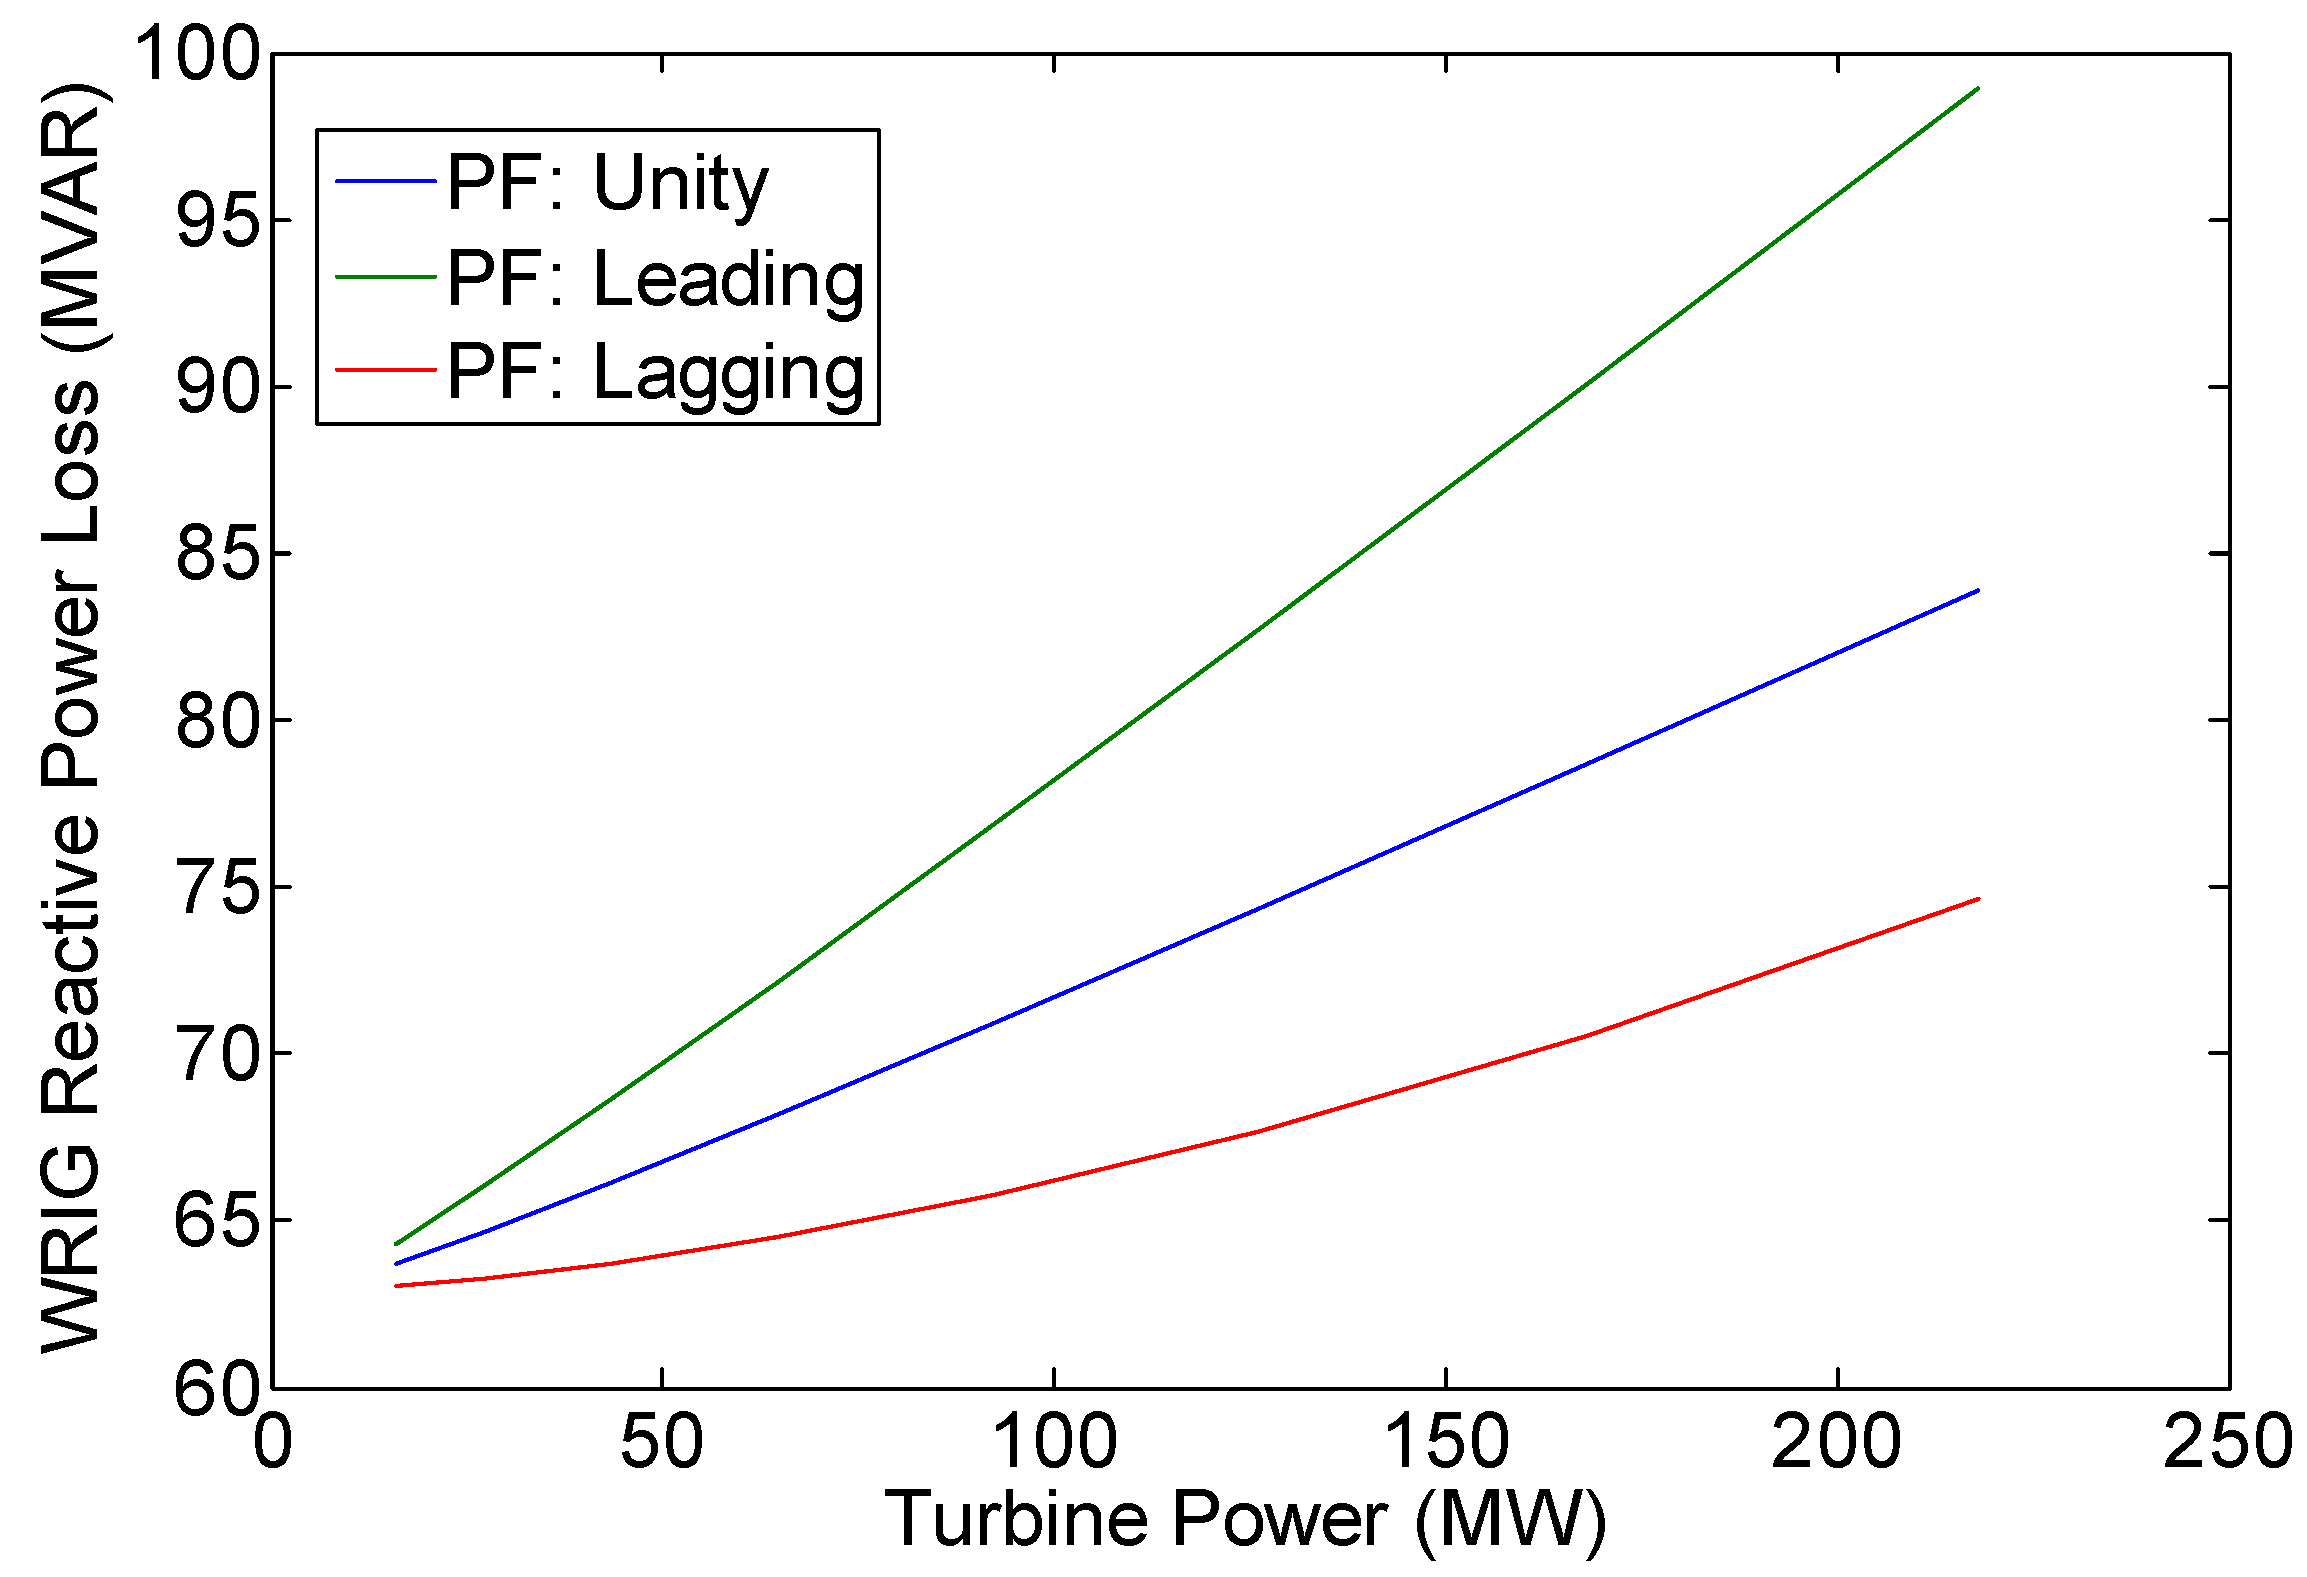
Variation of WRIG reactive power loss (QLOSS).
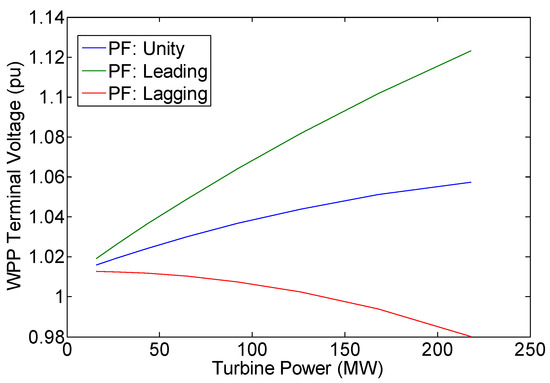
Figure 12.
Variation of WPP terminal voltage.
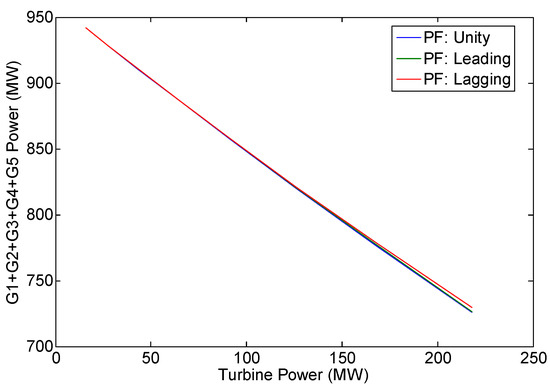
Figure 13.
Variation of G1 + G2 + G3 + G4 + G5 active power output.

Figure 14.
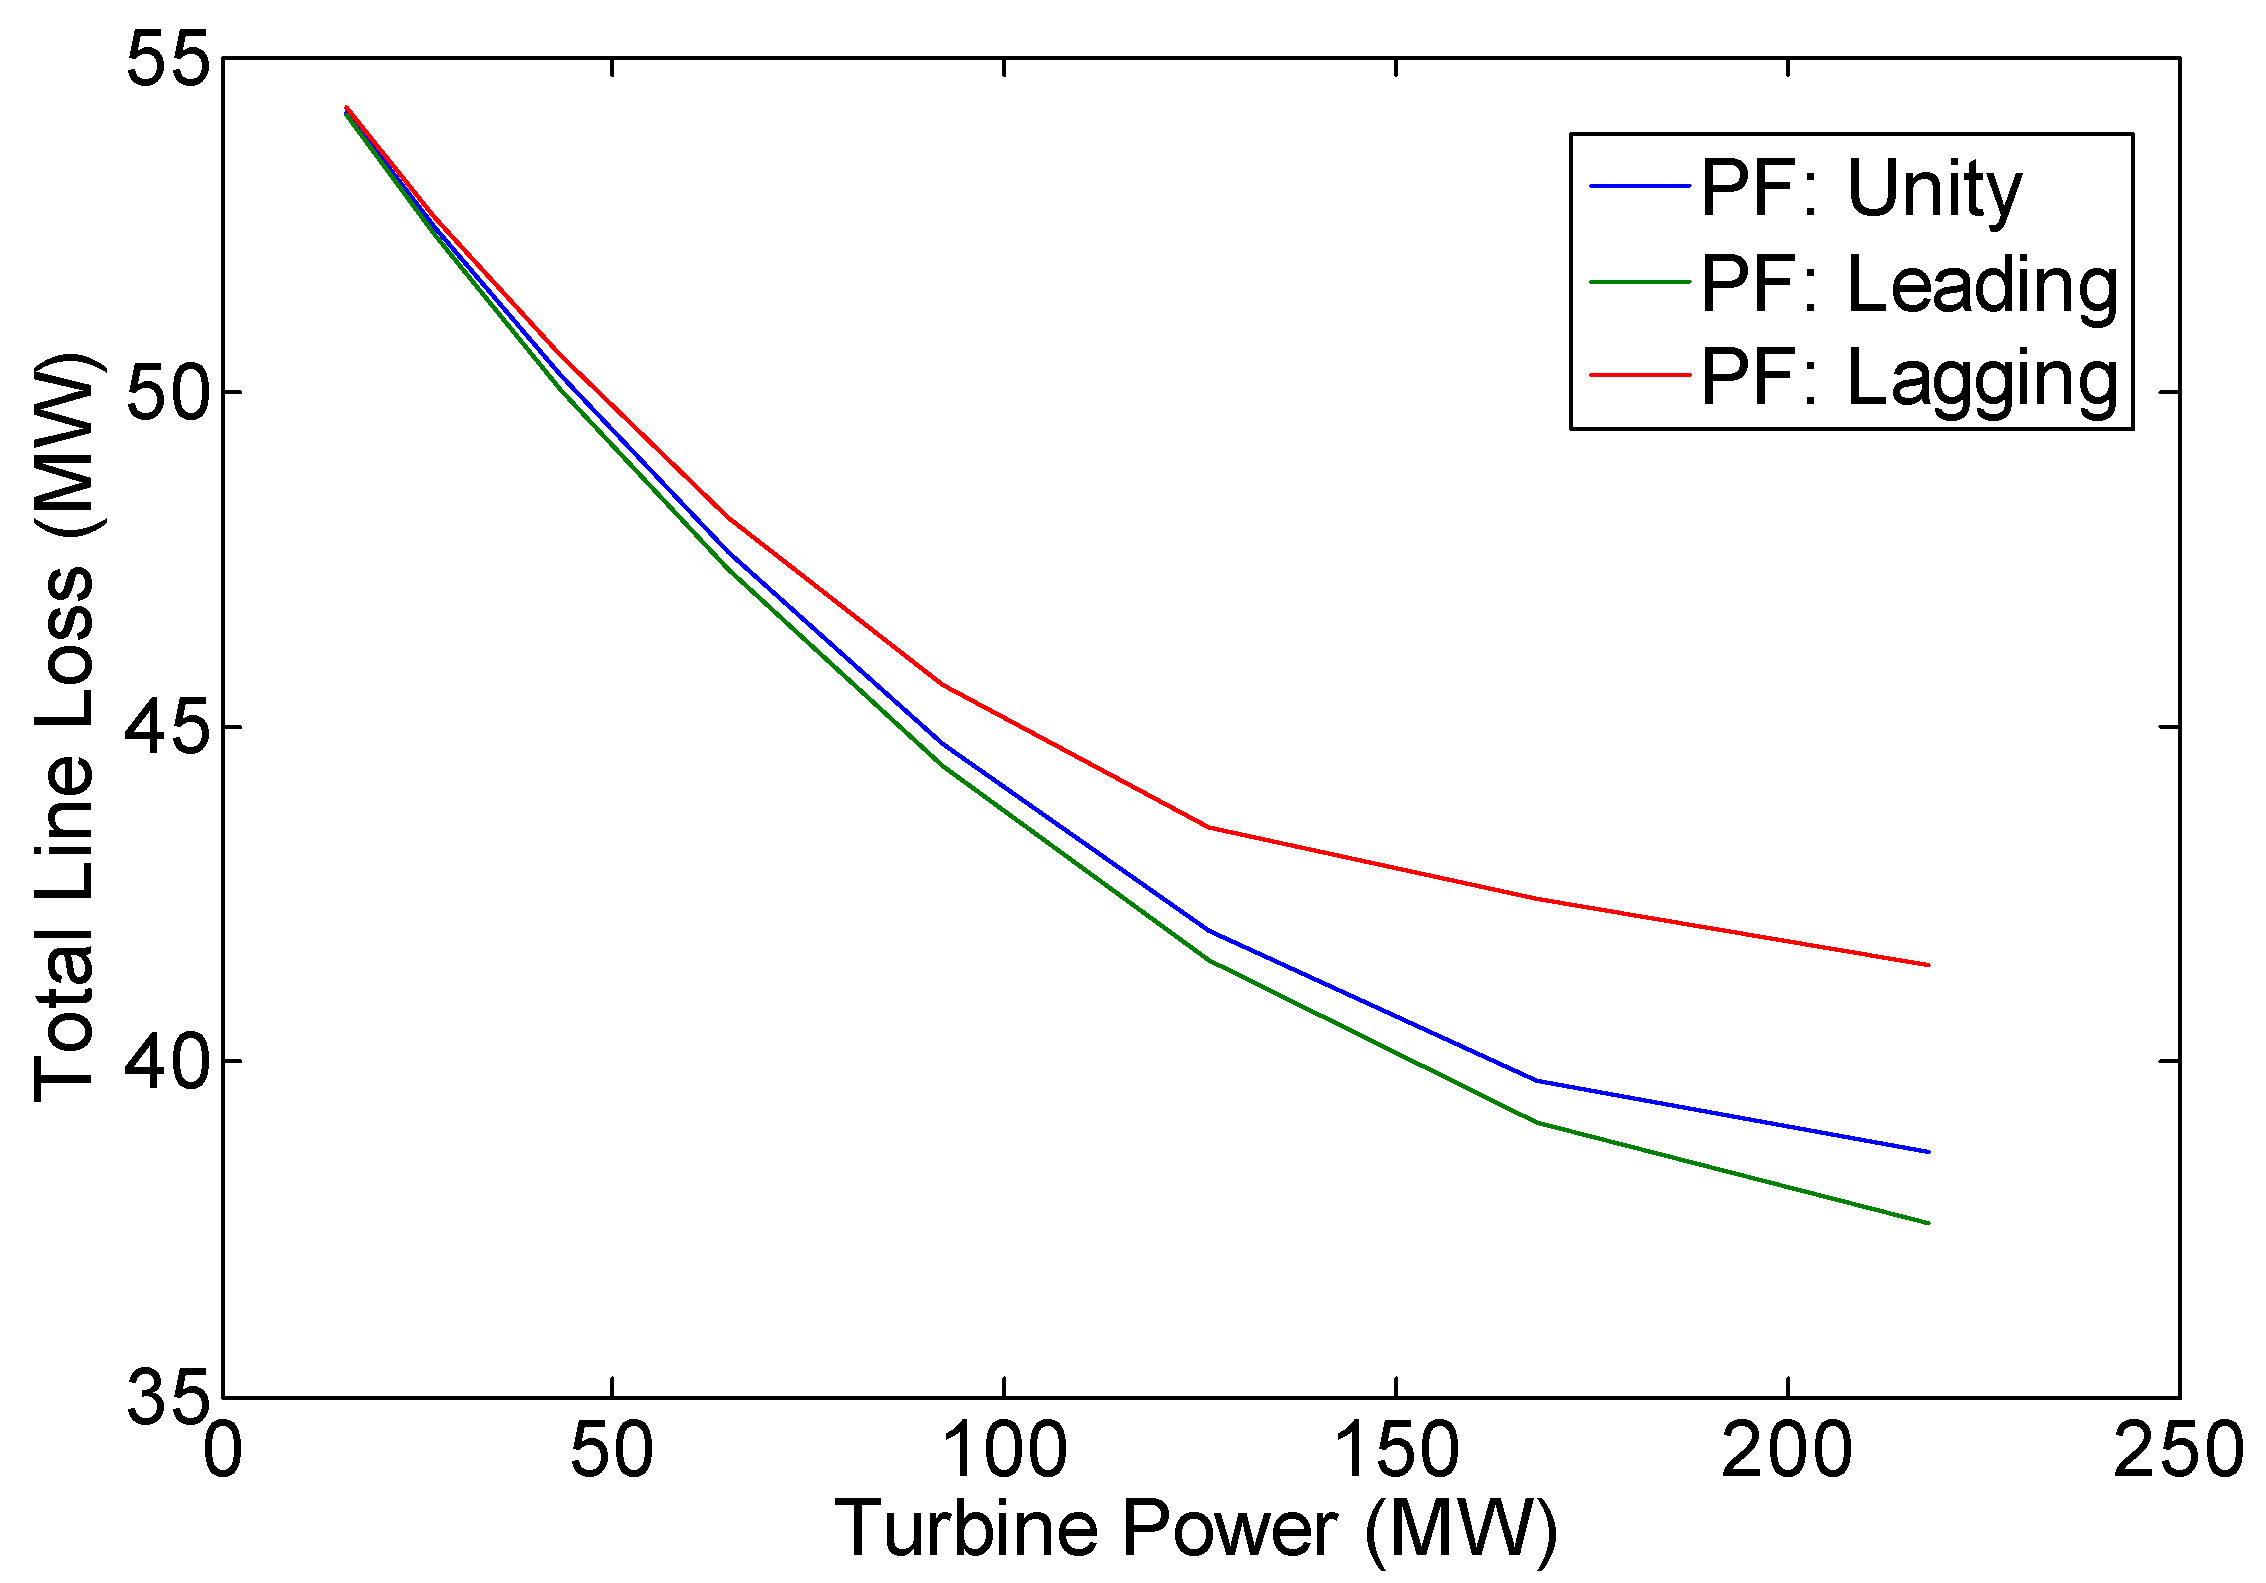
Variation of total line loss.
Figure 5 shows that in all operation modes (i.e., unity, leading, and lagging power factor operations), DFIG always delivers active power to the grid (see column 2 of Table 7, Table 10 and Table 13). This active power output equals the turbine mechanical power minus the WRIG active power loss. This active power output is also the difference between WRIG stator active power and rotor active power (see Figure 6, Figure 7 and Figure 8). It is to be noted that in sub-synchronous operation, rotor active power is positive, or the WRIG rotor absorbs power in the amount of PR. On the other hand, in super-synchronous operation, rotor active power is negative, or power in the amount of PR is delivered by the WRIG rotor (see also column 5 of Table 7, Table 10 and Table 13).
Figure 9 indicates that in unity power factor operation, there is no reactive power exchange between DFIG and power grid, or Qg is zero. However, in leading power factor operation, the DFIG system delivers reactive power to the grid, or Qg is positive. On the other hand, in lagging power factor operation, the DFIG system absorbs reactive power from the grid, or Qg is negative (see also column 3 of Table 7, Table 10 and Table 13). The amount of the DFIG reactive power output is equal to the reactive power produced by WRIG rotor minus the WRIG reactive power loss or the reactive power consumed by the WRIG for core circuit magnetization (see Figure 10 and Figure 11). The load flow results also show that with the increase in turbine power (i.e., WPP power output), the WPP power losses will also increase (see Figure 8 and Figure 11). The rise in WPP power losses is due to the DFIG current increase as the amount of WPP power output increases.
The best system voltage profile is obtained during DFIG leading power factor operation (see Figure 12 and column 2 of Table 9, Table 12 and Table 15). This result is expected since, in this mode of operation, DFIG always delivers reactive power to the power system (grid) and, therefore, can support the system voltage profile. It is also to be noted that the increase in turbine mechanical power will decrease the total active power generation of G1 to G5 (see Figure 13 and column 3 of Table 9, Table 12 and Table 15). These results are also expected as the increase in turbine mechanical power will increase the WPP active power output, and the total active power generation of G1 to G5 will decrease since the WPP supplies some loads.
The decrease in G1 to G5 power generation is one of the advantages of WPP installation since G1 to G5 generators usually consist of conventional generators that use non-renewable energy sources. Another advantage is that the total line losses can be reduced with the increase in WPP power output (see Figure 14 and column 5 of Table 8, Table 11 and Table 14). Table 6, Table 7, Table 8, Table 9, Table 10, Table 11, Table 12, Table 13 and Table 14 confirm the validity of the model proposed. This validity can also be verified by examining the results where G1 to G5 power output plus WPP power output (Pg + jQg) is always equal to total system load plus total line loss where the line loss has been computed based on the line impedances and currents.
5. Conclusions
The present work proposes a steady state model of variable speed (i.e., DFIG-based) WPP for load flow analysis. The model is obtained using formulas that calculate the DFIG stator and rotor powers. Modeling of DFIG power electronic converter is not required in the model derivation. Another important feature of the present paper is that representation of the DFIG in both sub-synchronous and super-synchronous conditions can be carried out by using a single mathematical model. Moreover, the power factor of the DFIG (often assumed to be unity) is also considered in the proposed model development. The method proposed in the present work can accommodate all three power factor operation modes (i.e., unity, leading, and lagging power factors). Results of the case study have also been presented in this paper. The proposed method’s application in a representative power system has been investigated in the case study. For all the power factor operation modes considered in the case study, the results confirm the capability of the proposed method in solving load flow analysis of power systems containing DFIG-based WPP.
Funding
This research was funded by Kemendikbud-Ristek Republik Indonesia, grant number: 062/E5/PG.02.00.PT/2022.
Institutional Review Board Statement
Not applicable.
Informed Consent Statement
Not applicable.
Data Availability Statement
Not applicable.
Conflicts of Interest
The author declares no conflict of interest.
References
- Anaya-Lara, O.; Jenkins, N.; Ekanayake, J.B.; Cartwright, P.; Hughes, M. Wind Energy Generation: Modelling and Control; John Wiley & Sons. Ltd.: Chichester, UK, 2009. [Google Scholar]
- Ackermann, T. Wind Power in Power Systems; John Wiley & Sons. Ltd.: Chichester, UK, 2012. [Google Scholar]
- Li, H.; Chen, Z. Overview of different wind generator systems and their comparisons. IET Renew. Power Gener. 2008, 2, 123–138. [Google Scholar] [CrossRef] [Green Version]
- Babu, N.R.; Arulmozhivarman, A. Wind energy conversion system—A technical review. J. Eng. Sci. Technol. 2013, 8, 493–507. [Google Scholar]
- Haque, M.H. Evaluation of power flow solutions with fixed speed wind turbine generating systems. Energy Convers. Manag. 2014, 79, 511–518. [Google Scholar] [CrossRef]
- Haque, M.H. Incorporation of fixed speed wind turbine generators in load flow analysis of distribution systems. Int. J. Renew. Energy Technol. 2015, 6, 317–324. [Google Scholar] [CrossRef]
- Wang, J.; Huang, C.; Zobaa, A.F. Multiple-node models of asynchronous wind turbines in wind farms for load flow analysis. Electr. Power Compon. Syst. 2015, 44, 135–141. [Google Scholar] [CrossRef] [Green Version]
- Feijoo, A.; Villanueva, D. A PQ model for asynchronous machines based on rotor voltage calculation. IEEE Trans. Energy Convers. 2016, 31, 813–814, Correction in IEEE Trans. Energy Convers. 2016, 31, 1228. [Google Scholar] [CrossRef]
- Ozturk, O.; Balci, M.E.; Hocaoglu, M.H. A new wind turbine generating system model for balanced and unbalanced distribution systems load flow analysis. Appl. Sci. 2018, 8, 502. [Google Scholar]
- Gianto, R.; Khwee, K.H.; Priyatman, H.; Rajagukguk, M. Two-port network model of fixed-speed wind turbine generator for distribution system load flow analysis. Telkomnika 2019, 17, 1569–1575. [Google Scholar] [CrossRef]
- Gianto, R. Steady state model of wind power plant for load flow study. In Proceedings of the 2020 International Seminar on Intelligent Technology and Its Applications (ISITIA 2020), Surabaya, Indonesia, 22–23 July 2020; pp. 119–122. [Google Scholar]
- Gianto, R. T-circuit model of asynchronous wind turbine for distribution system load flow analysis. Int. Energy J. 2019, 19, 77–88. [Google Scholar]
- Gianto, R.; Khwee, K.H. A new T-circuit model of wind turbine generator for power system steady state studies. Bull. Electr. Eng. Inform. 2021, 10, 550–558. [Google Scholar] [CrossRef]
- Dadhania, A.; Venkatesh, B.; Nassif, A.B.; Sood, V.K. Modeling of doubly fed induction generators for distribution system power flow analysis. Electr. Power Energy Syst. 2013, 53, 576–583. [Google Scholar] [CrossRef]
- Ju, Y.; Ge, F.; Wu, W.; Lin, Y.; Wang, J. Three-phase steady-state model of DFIG considering various rotor speeds. IEEE Access 2016, 4, 9479–9948. [Google Scholar] [CrossRef]
- Kumar, V.S.S.; Thukaram, D. Accurate modeling of doubly fed induction based wind farms in load flow analysis. Electr. Power Syst. Res. 2018, 15, 363–371. [Google Scholar]
- Li, S. Power flow modeling to doubly-fed induction generators (DFIGs) under power regulation. IEEE Trans. Power Syst. 2013, 28, 3292–3301. [Google Scholar] [CrossRef]
- Anirudh, C.V.S.; Seshadri, S.K.V. Enhanced modeling of doubly fed induction generator in load flow analysis of distribution systems. IET Renew. Power Gener. 2021, 15, 980–989. [Google Scholar]
- Gianto, R. Steady state model of DFIG-based wind power plant for load flow analysis. IET Renew. Power Gener. 2021, 15, 1724–1735. [Google Scholar] [CrossRef]
- Gianto, R. Integration of DFIG-based variable speed wind turbine into load flow analysis. In Proceedings of the 2021 International Seminar on Intelligent Technology and Its Applications (ISITIA 2021), Virtual, 21–22 July 2021; pp. 63–66. [Google Scholar]
- Gianto, R. Steady state load flow model of DFIG-based wind turbine in voltage control mode. In Proceedings of the 3rd International Conference on High Voltage Engineering and Power Systems (ICHVEPS 2021), Bandung, Indonesia, 5–6 October 2021; pp. 232–235. [Google Scholar]
- Gianto, R. Constant voltage model of DFIG-based variable speed wind turbine for load flow analysis. Energies 2021, 14, 8549. [Google Scholar] [CrossRef]
- Akhmatov, V. Induction Generators for Wind Power; Multi-Science Publishing Co. Ltd.: Brentwood, UK, 2007. [Google Scholar]
- Boldea, I. Variable Speed Generators; Taylor & Francis Group LLC: Roca Baton, FL, USA, 2005. [Google Scholar]
- Fox, B.; Flynn, D.; Bryans, L.; Jenkins, N.; Milborrow, D.; O’Malley, M.; Watson, R.; Anaya-Lara, O. Wind Power Integration: Connection and System Operational Aspects; The Institution of Engineering and Technology: London, UK, 2007. [Google Scholar]
- Patel, M.R. Wind and Solar Power Systems; CRC Press LLC: Boca Raton, FL, USA, 1999. [Google Scholar]
- Gianto, R.; Khwee, K.H. A new method for load flow solution of electric power distribution system. Int. Rev. Electr. Eng. 2016, 11, 535–541. [Google Scholar] [CrossRef]
- Gianto, R. Trust-region method for load flow solution of three-phase unbalanced electric power distribution system. J. Electr. Comput. Eng. 2022, 2022, 5415300. [Google Scholar] [CrossRef]
- Pai, M.A. Computer Techniques in Power System Analysis; Tata McGraw- Hill Publishing Co. Ltd.: New Delhi, India, 1984. [Google Scholar]


Publisher’s Note: MDPI stays neutral with regard to jurisdictional claims in published maps and institutional affiliations. |
© 2022 by the author. Licensee MDPI, Basel, Switzerland. This article is an open access article distributed under the terms and conditions of the Creative Commons Attribution (CC BY) license (https://creativecommons.org/licenses/by/4.0/).