Abstract
Carbonate reservoirs commonly have significant heterogeneity and complex pore systems due to the multi-scale characteristic. Therefore, it is quite challenging to predict the petrophysical properties of such reservoirs based on restricted experimental data. In order to study the heterogeneity and size of the representative elementary volume (REV) of vuggy dolostones, a total of 26 samples with pore sizes ranging from micrometers to centimeters were collected from the Cambrian Xiaoerbulake Formation at the Kalping uplift in the Tarim Basin of northwestern China. In terms of the distribution of pore size and contribution of pores to porosity obtained by medical computed tomography testing, four types of pore systems (Types I–IV) were identified. The heterogeneity of carbonate reservoirs was further quantitatively evaluated by calculating the parameters of pore structure, heterogeneity, and porosity cyclicity. The results indicate that different pore systems yield variable porosities, pore structures, and heterogeneity. The porosity is relatively higher in Type-II and Type-IV samples compared to those of Type-I and Type-III. It is caused by well-developed large vugs in the former two types of samples, which increase porosity and reduce heterogeneity. Furthermore, the REV was calculated by deriving the coefficient of variation. Nine of the twenty-six samples reach the REV within the volume of traditional core plugs, which indicates that the REV sizes of vuggy dolostones are commonly much larger than the volume of traditional core plugs. Finally, this study indicates that REV sizes are affected by diverse factors. It can be effectively predicted by a new model established based on the relationship between REV sizes and quantitative parameters. The correlated coefficient of this model reaches 0.9320. The results of this study give more insights into accurately evaluating the petrophysical properties of vuggy carbonate reservoirs.
1. Introduction
Carbonate reservoirs are widely investigated because they host more than 60% of oil and gas worldwide [1,2,3]. It is well known that carbonate reservoirs are generally heterogeneous [4,5,6]. Diverse depositional environments and complex diagenetic alterations commonly lead to the development of pore systems with sizes ranging from micrometers to centimeters [7,8,9,10]. The heterogeneity of carbonate reservoirs brings a series of challenges in evaluating their petrophysical properties. Therefore, a quantitative evaluation of heterogeneity is extremely significant. Heterogeneity, defined as an inherent, ubiquitous, and critical attribute of ecological systems, has been extensively studied in previous studies [11,12,13]. It is significantly affected by the spatio-temporal scale of observation and measurement methods [14,15]. For example, carbonate samples may be homogeneous on a macro-scale, but heterogeneous at a micro-scale in terms of pore structures [13,16,17].
A representative elementary volume (REV) is proposed to quantitatively characterize heterogeneity and could provide a link between the pore scale and continuum scale. The REV is defined as the minimum volume of a porous medium that is large enough to represent the macroscopic property of a heterogeneous rock [18,19,20,21]. The schematic diagram of the REV is shown in Figure 1, where V is defined as the volume of porous medium and n is defined as the property of the rocks, e.g., porosity [22,23,24,25]. It is noteworthy that REV is various when different physical properties are investigated, even for the same porous medium [26,27,28]. Porosity is the most common property to determine the REV [28,29]. The other properties include permeability [26,30,31,32], tortuosity [23,33], coordination number [34], specific surface area [32], moisture saturation [35], local void ration [36], and fractal dimension [25,37].
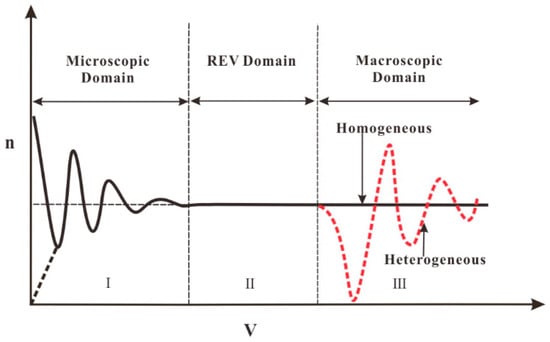
Figure 1.
Schematic graph of the representative elementary volume (REV) (modified from [18,30]).
Porosity generally varies with the sample’s volume in carbonate rocks. During measurements, the testing data of traditional core plugs (a cylinder with a diameter of 2.5 cm and a height of 5 cm) have been commonly used to represent the data of whole cores. However, the porosity of whole cores is usually higher than that of traditional core plugs [38]. When the volume of the analyzed sample is smaller than the REV, there will be a large discrepancy between the measured and real porosity of the sample. As such, precisely determining the REV sizes is very crucial for accurately calculating the petrophysical property and evaluating the reservoir. Extensive papers have been published on determining REV sizes [22,39,40,41]. However, they have mainly focused on determining REV sizes in microscopic domain microstructures of rocks by semi-quantitative to quantitative methods. Only a few studies were conducted on the REV sizes of vuggy carbonate rocks with sizes ranging from micrometers to centimeters [26].
Recently, X-ray computed tomography (CT), as a non-destructive technique, has been widely used to characterize the pore structure of a porous medium [42,43,44]. High-resolution CT such as micro-CT and nano-CT can capture the microstructures of the pore system. However, the trade-off between the sample size and spatial resolution makes the targeted field of high-resolution CT relatively microscopic. Therefore, it is very challenging to display the macroscopic pore space [45,46,47,48]. For vuggy carbonate rocks, medical-CT is an effective technique to characterize the pore system as it is both more efficient and cost-effective compared with micro-CT and nano-CT [43,49]. More importantly, the image resolution of medical-CT is more suitable for studying the pore structure and REV of vuggy carbonate reservoirs with pore sizes ranging from micrometers to centimeters. The aims of this study are to quantitatively characterize the heterogeneity and precisely determine the REV size of dolostones with well-developed vugs. This study can provide a foundation for accurately calculating physical properties and precisely evaluating the reservoirs.
In this study, a total of 26 samples were collected from the Shihuiyao section at the Kalping uplift in the northwestern Tarim Basin to study the heterogeneity of vuggy dolostones. The samples were firstly prepared as cylinders with diameters of 5 cm and heights of 49–100 cm. Then CT was used to characterize the types of pore systems and calculate the parameters of pore structure and heterogeneity. Subsequently, the REV size was determined by deriving the coefficient of variation. Finally, a prediction model of REV was established based on the parameters of pore geometrical and heterogeneity. The potential of this model to predict the REV sizes of vuggy carbonates is also discussed.
2. Geological Setting
The Tarim Basin is a foreland basin with a total area of 5.6 × 10⁵ km2 in the Xinjiang Province in northwestern China (Figure 2a). It is bordered by the Kunlun-Altyn Mountains to the south and the Tianshan Mountains to the north [50,51,52]. The Tarim Basin has suffered a complex tectonic evolution and consists of one low uplift, four uplifts, and six depressions, namely, the Shuntuo Low Uplift, Tabei Uplift, Bachu Uplift, Tazhong Uplift, Tadong Uplift, Kuqa Depression, Awati Depression, Manjiaer Depression, Southwest Depression, Tanggu Depression, and Southeast Depression (Figure 2b) [53,54]. The Kalping Uplift is located in the northwest, along the edge of the Bachu Uplift (Figure 2b,c).
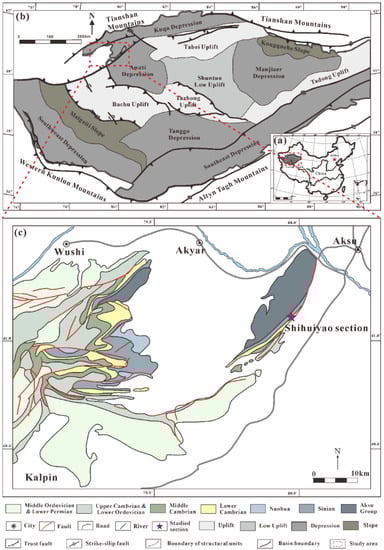
Figure 2.
(a) Location of the Tarim Basin (modified from [50]). (b) Structural units of the Tarim Basin (modified from [51]). (c) Geological setting of outcrop section in the northwestern Tarim Basin (modified from [52]).
The Shihuiyao section, located at the northeastern edge of the Kalping Uplift (Figure 2c), is exposed with consecutive Cambrian strata [53,55,56]. The Lower Cambrian strata, from bottom to top, comprises the Yuertusi, Xiaoerbulake, and Wusongeger Formations. The Xiaoerbulake Formation at the Shihuiyao section is 138.5 m thick and composed of two sequences: the upper Xiaoerbulake and the lower Xiaoerbulake intervals (Figure 3). Algal lamina silty-micritic crystalline dolostone, silty-micritic crystalline dolostone, rubble dolostone, algal clot dolostone, and fabric-obliterated fine-to-medium-crystalline dolostone are well developed in the lower Xiaoerbulake interval, whereas foam spongy texture dolostone, stromatolithic dolostone, algal arene dolostone, and oncolite dolostone are present in the upper Xiaoerbulake interval.
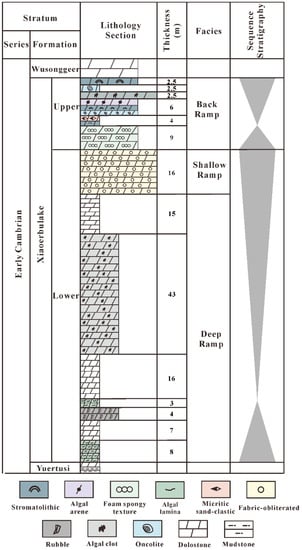
Figure 3.
Simplified stratigraphic framework of the Early Cambrian from the Shihuiyao section.
3. Samples and Methods
A total of 26 dolostones with well-developed vugs were collected from the Xiaoerbulake Formation in the Shihuiyao section (Figure 4). Rock types of these samples were determined through detailed field and microscopic investigation (Figure 5).
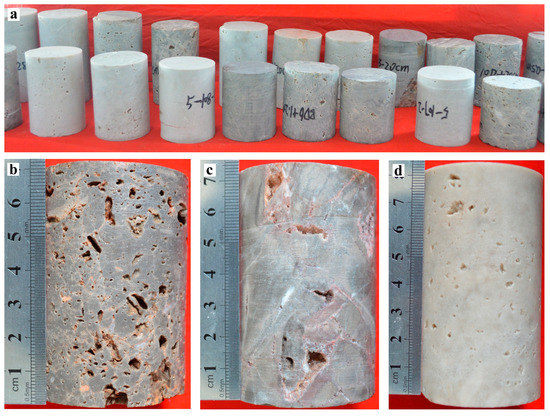
Figure 4.
Image of the vuggy dolostones with millimeter-to-centimeter-scale vugs in the Xiaoerbulake Formation from the Shihuiyao section. (a) Image of cylinders of vuggy dolostones. (b) Image of sample SHY002, flat vugs are developed with a diameter of 2–6 mm. (c) Image of sample SHY007, the sample develops vugs and fissures and the vugs are half-filled by secondary carbonates. (d) Image of sample SHY016, flat vugs are developed and the distribution of vugs is scattered.
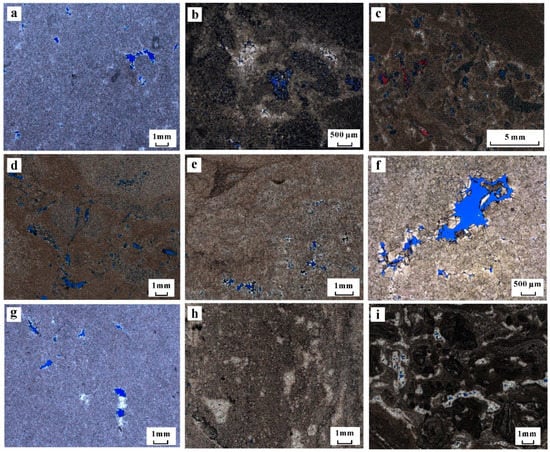
Figure 5.
Plane polarized light microscopic images of porous dolostones in the Xiaoerbulake Formation from the Shihuiyao section. (a) Rock Type i, fabric-obliterated fine-crystalline dolostone with grain ghosts, intercrystalline pores, and intercrystalline pores. (b) Rock Type ii, rubble dolostone, intercrystalline pores. (c) Rock Type ii, rubble dolostone, intercrystalline pores, some intercrystalline pores filled with calcite. (d) Rock Type iii, the thrombolite dolostone with fabric obliterated by dolomitization or recrystallization, dissolution enlarged pores and fissures. (e) Rock Type iii, the thrombolite dolostone with fabric obliterated by dolomitization or recrystallization, intercrystalline pores. (f) Rock Type iv, crystalline dolostone, dissolution enlarged pores and intercrystalline dissolution pores. (g) Rock Type iv, crystalline dolostone, intercrystalline pores, and intercrystalline pores. (h) Rock Type v, foam spongy texture silty crystalline dolostone with fabric partly preserved. (i) Rock Type vi, oncolite dolostone, intercrystalline pores, and intercrystalline pores.
The 26 samples were prepared as cylinders with diameters of 5 cm and heights of 49–100 cm, which were subsequently scanned using Philips Brilliance iCT at a resolution with a voxel size of 97.66 × 97.66 × 335.00 μm3. An operating voltage of 140 kV and a filament current of 188 mA were applied. To obtain high-quality images, three preprocessing steps were used to reduce the drawbacks. The first step was filtering, which was beneficial in reducing high frequencies and noise. The second step was ring-artifact removal, where rings were removed from the images by comparing and adjusting all the voxel values of each ring. The third step was a beam-hardening correction, which reduced the homogeneous effect of the cylindrical samples. Finally, solid and void phases were distinguished by binarization and threshold segmentation.
Wavelet transform has been widely used in different disciplines of earth science, especially in the quantitative research of sequence stratigraphy [57,58], which hence is used in this study to quantitatively characterize the cyclicity of porosity.
The REV size of the vuggy dolostones was determined by a conventional statistical approach in which porosity was measured using medical-CT images. A total of 10 cylindrical subsamples were randomly selected from the individually large cylinders (Figure 6). The volume of these subsamples was gradually increased from a diameter of 1 mm and height of 1 mm until it was close to the volume of the largest cylinders. As shown in Figure 1, the REV size can be determined based on the covariation of property and volume. In region I, the fluctuation of n reduces with an increasing V, where the fluctuation is dominated by microscopic properties. In region II, the value of n is essentially consistent, which means that the observed property is not affected by the increase in the sample volume. Therefore, the boundary of regions I and II is defined as the REV. In region III, the value of n may remain stable or fluctuate with an increasing V as it depends on whether the porous medium is homogeneous or not. The fluctuations are dominated by macroscopic properties in this region.
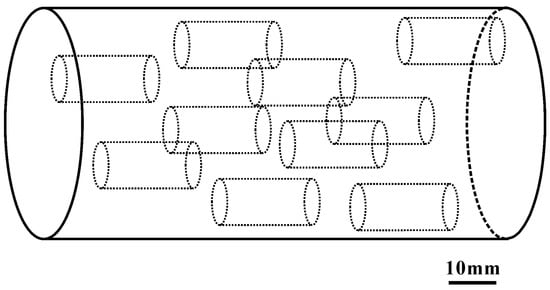
Figure 6.
Schematic of subsamples selection.
4. Quantitative Calculation of Parameters
4.1. Pore Geometrical Parameters
The following parameters are calculated to better evaluate the influences of pore volume and morphology on heterogeneity.
- (1)
- The dominant pore volume
The pore volume fraction on the cumulative curve at 50% is defined as the dominant pore volume (V50). In other words, a half of sample’s porosity is composed of pores with volumes larger than V50. This parameter indicates the dominant size of the well-developed vugs in the sample.
- (2)
- The number of large vugs
When the cumulative pore volume fraction is greater than 50%, the total number of vugs is defined as the number of large vugs (). This value is then adopted to characterize the heterogeneity of pore distribution.
- (3)
- Average shape factor
The average shape factor () is used to quantitatively characterize pore shapes. The parameters equal to 1 indicate regular spherical pores, whereas the larger the parameters are, the more irregular the pore shapes are. The average shape factor is defined as
where is the area of the ith pore, is the volume of the ith pore, and n is the total number of pores.
4.2. Heterogeneity Parameters
- (1)
- Coefficient of variation
The coefficient of variation (Cv) is calculated to show the variability relative to the mean value [15]. Since the Cv value of a homogeneous sample is zero, positive Cv values thus indicate heterogeneous samples. In this paper, the Cv values based on CT images of subsamples (Cv_sub) and along the slice direction (Cv_sli) were calculated.
where Cv is the coefficient of variation, is the standard deviation, and is the arithmetic mean value.
- (2)
- Heterogeneous factor
The heterogeneous factor () can magnify the effect in the large vugs of carbonate rocks on heterogeneity [59].
where is the bulk volume of the sample, is the bulk volume of the inner large vugs of the sample (the volume of each vug is greater than or equal to V50), is the volume of the sample excluding , is the volume of the rock matrix, and is the pore volume excluding (Figure 7).
where is the porosity of the sample, is the pore volume, is the porosity of the inner large vugs, and is the porosity of the sample excluding the inner large vugs.
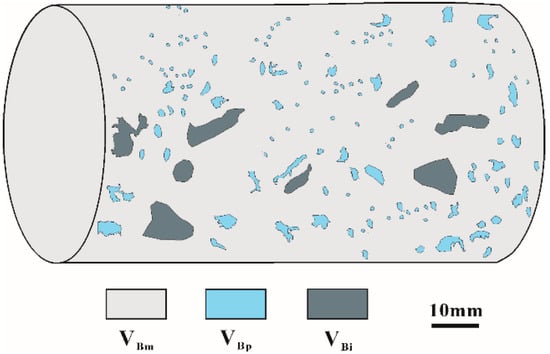
Figure 7.
Schematic of volume introduction of each component of the sample.
If the ratio of the bulk volume of the inner large vugs compared with the bulk volume of the sample is defined as F, then
Substituting Equation (7) into Equation (6),
If the ratio of to is defined as R, then
If the heterogeneous factor () is defined as , then
4.3. Cyclicity of Porosity
REV can be clearly defined only in two situations: (i) materials displaying periodic geometry and (ii) a sample volume containing a very large set of microscale elements of statistically homogeneous and ergodic properties [60,61]. The periodic distribution of sample porosity is analyzed based on a wavelet transform.
where is the scale parameter ( > 0), is the position parameter, is the signal, and is the analyzing wavelet. The wavelet used here is a complex wavelet.
For a better comparison, the number of periodicities is calculated per unit length due to the different slice numbers of CT. It is defined as
where P is the total number of periodicities, and L is the number of CT slices.
5. Results
5.1. Rock Type
The Lower Cambrian Xiaoerbulake Formation has been deeply buried, during which it has suffered intense and prolonged diagenetic modifications, resulting in complex rock types. Based on detailed field and microscope investigation, we have found that most of the dolostone shows, originally, depositional and microbial fabrics. In addition, some dolostones have been recrystallized with their original fabrics having vanished. In view of the rock fabrics and genesis, for the samples investigated, classification divided the 26 samples into three major categories, namely, microbial dolostone, hydrodynamic dolostone, and crystalline dolostone. In addition, the microbial dolostones can be further subdivided by their textures into thrombolite dolostone, foam spongy texture silty crystalline dolostone, and oncolite dolostone. The hydrodynamic dolostones were further subdivided into rubble dolostone and fabric-obliterated fine-crystalline dolostone. The twenty-six samples were in classified into six rock types (Figure 5).
5.2. Pore System Classification
To study the influence of variation in pore size on heterogeneity and REV in the samples, four types of pore systems (Types I–IV) were classified based on the distribution of pore size and the contribution of pores to porosity (Figure 8, Table 1).
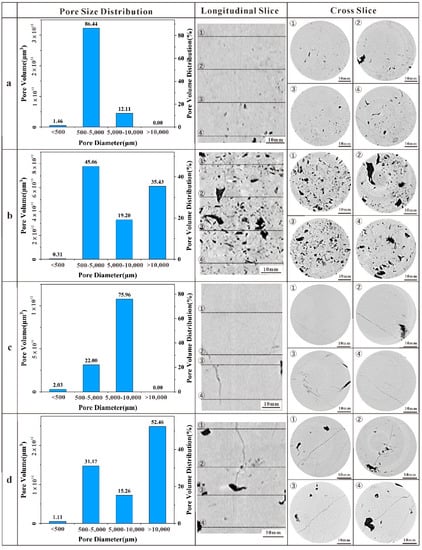
Figure 8.
Examples of carbonate types of pore system classification from CT images. (a) Type-I, sample SHY026, mainly developed small vugs with a diameter of 1–2 mm, locally developed, and large vugs with a diameter of 7–8 mm. (b) Type-II, sample SHY002, flat vugs with a diameter of 2–6 mm. (c) Type-III, sample SHY006, cracks. (d) Type-IV, sample SHY009, a multitude of flat vugs with a diameter of 3–4 mm.

Table 1.
The calculating parameters and determining the REV.
The Type-I pore system is present in all rock types except for Rock Type ii (Figure 9), and mainly comprises small vugs with diameters of 500–5000 μm (Figure 8a). These small vugs contribute to more than 60% of the total porosity. No large vugs with diameters larger than 10,000 μm were observed in the Type-I pore system. The porosity of this type is lower than 4% (Figure 9).
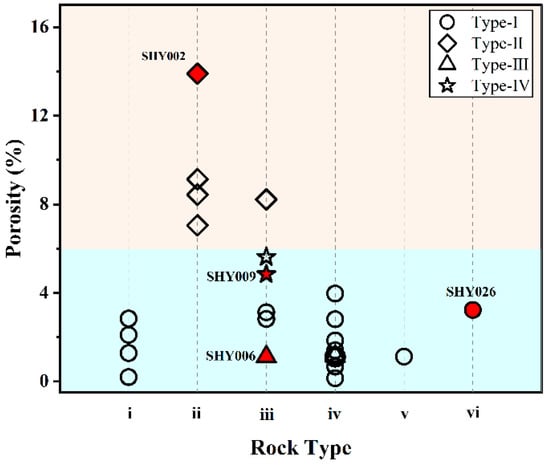
Figure 9.
Porosity plotted against rock type. Marker color represents pore type.
The Type-II pore system comprises vugs with diameters mainly of 500–5000 μm (Figure 8b). However, large vugs with diameters greater than 10,000 μm are also observed. The porosity of this type of pore system is the highest among the four types, which ranges from 7.05% to 13.90% (Figure 9). This type of pore system is developed in Rock Type ii and Rock Type iii.
5.3. Quantified Pore Geometrical Parameters
The 50% threshold on the curve of the cumulative pore volume fraction can be used to calculate parameters of V50 and . The calculated parameters are summarized in Table 1 and illustrated on Figure 10a,b. Figure 10a shows the lowest value and a relatively high V50 value in sample SHY006, whereas Figure 10b shows the highest value and a relatively low V50 value in sample SHY022. The parameters of V50 and thus reveal distinct pore structures of the studied samples. A smaller V50 and a larger indicate more uniform pore sizes of the sample and vice versa. On the plot of porosity versus log10V50 (Figure 10c), different pore system types can be well distinguished. In detail, Type-I samples have low V50 values and high values, with the V50 values ranging from 8.21 × 10⁸ to 2.42 × 1010 μm3 and values greater than 22 (Table 1). The V50 values for Type-II samples, however, are in a relatively large range with being greater than 13. Type-III and Type-IV samples have relatively higher V50 and lower values, indicating that the pore size distribution in these samples is more uneven than those of Type-I and Type-II samples. The parameter of , depicting pore circularity, is broadly positively correlated with porosity (Figure 10d). Samples with low porosity have low values, demonstrating that pore structures are relatively uniform in these samples (Table 1).
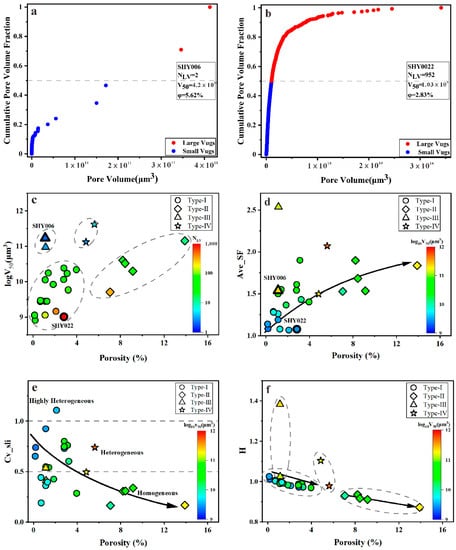
Figure 10.
Cross plots of porosity and pore geometrical parameters and heterogeneity parameters. Marker shape represents pore type. (a) Pore volume cumulative curve of sample SHY006. Long axial vugs are developed along the cracks, with a diameter of 3–4 mm. (b) Pore volume cumulative curve of sample SHY022. A multitude of flat vugs are developed with a diameter of 1–2 mm and distributed in a laminar structure. (c) Cross-plot of porosity and dominant pore volume (log10V50) with the number of large vugs superimposed in color. (d) Cross-plot of porosity and average shape factor () with dominant pore volume (log10V50) superimposed in color. (e) Cross-plot of porosity and the coefficient of variation of CT slices with dominant pore volume (log10V50) superimposed in color. (f) Cross-plot of porosity and heterogeneous factor with dominant pore volume (log10V50) superimposed in color.
5.4. Quantification of Heterogeneity
Based on the values of Cv, the heterogeneity of the samples can be divided into three grades, namely highly heterogeneous (Cv > 1.0), heterogeneous (0.5 < Cv < 1.0), and homogeneous (0.0 < Cv < 0.5). To quantitatively analyze the heterogeneity of carbonates, the coefficient of variation is calculated using CT slices along with the whole sample (Table 1). The values of Cv_sli show an evidently decreasing trend with the increase of porosity (Figure 10e). The Cv_sli values range from 0.19 to 1.11 in Type-I samples. For a given low porosity, these samples yield variable Cv_sli values from high heterogeneity to homogeneity. The Type-II samples have lower Cv_sli values and a higher porosity compared with the other pore system types. The values of Cv_sli of Type-II samples are below 0.5, suggesting that they are homogeneous. The Cv_sli values range from 0.41 to 0.74 in Type-III and Type-IV samples. Meanwhile, they yield relatively higher log10V50 values than the other pore system types.
The values of heterogeneous factor decrease with increasing porosity within individual types of pore systems (Figure 10f). However, the slope varies among the different types of pore system. The values range from 0.97 to 1.03 in Type-I samples that have low log10V50 values (Table 1). Samples of Type-II have the lowest values among the four types of pore system, which are less than 0.94. Type-III and Type-IV samples generally have high and log10V50 values (Figure 10f).
5.5. Cycle Analysis of Porosity
As shown in Figure 11, porosity periodically fluctuates along with the slices, ranging from 8.36% to 19.35%. The cycles of porosity were quantitatively calculated using the complex wavelet transform. The rightmost part of Figure 11 is the number of calculated cycles, which shows three cycles in this sample.
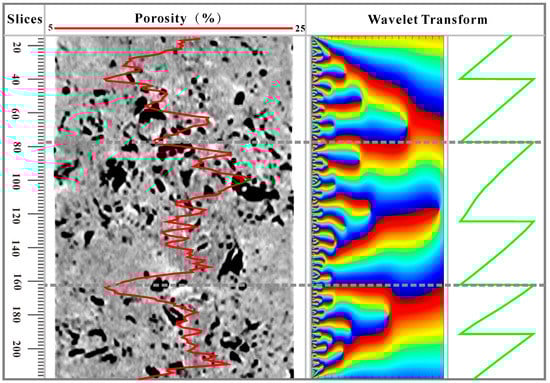
Figure 11.
Identification of the porosity cyclicity based on complex wavelet transform. The red line is porosity and the green line is the cycles of porosity.
In the plot of porosity versus (Figure 12), the data of Type-I samples are dispersive with values ranging from 0.92 to 1.98, while those of Type-II samples range from 1.46 to 1.95 (Table 1). The values are greater than 1.6 in Type-III samples, but less than 1.6 for Type-IV samples. Clearly, decreases with increasing porosity when the porosity is less than 6%.
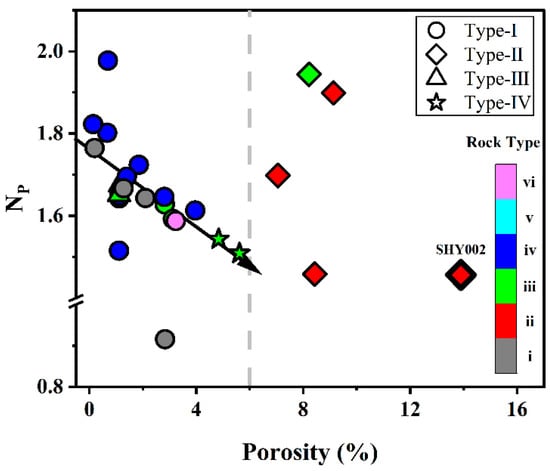
Figure 12.
Cross-plot of porosity and porosity cyclicity with rock type superimposed in color. Marker shape represents pore type.
6. Discussion
6.1. Evaluation on Heterogeneity of Pore Systems
The classification schemes for carbonate pore systems have been proposed in view of pore geometry, rock fabric, genesis, flow properties, and pore-scale modeling [62,63,64]. In addition, definitions and classifications for vug or vuggy porosity have been discussed in previous works [63,65,66,67]. Choquette and Pray [63] defined a pore to be a vug if it is (1) approximately equant and not remarkably elongated; (2) large enough to be visible with the naked eye (pore diameter exceeding 1/16 mm); and (3) not fabric selective. Lucia stated that vugs that are within crystals or grains or that are markedly larger than crystals or grains are considered pore spaces [65,66,67]. The authors further subdivided vuggy pore spaces into separate vugs and touching vugs based on whether the vugs are interconnected or not. Luo and Machel [68] proposed a new pore size classification for complex carbonate reservoirs: microporosity (diameter < 1 μm), mesoporosity (diameter 1–1000 μm), macroporosity (diameter 1–256 mm), and megaporosity (diameter > 256 mm). The vugs of that study were grouped into mesoporosity. Li et al. [69] quantitatively divided the carbonate rock into matrix, fractured, and vuggy based on a new function of the carbonate rock index. Based on the definition of vugs by Lucia [65,66,67], the classification scheme in this paper is proposed by taking into account the pore size distribution and contributions of pores to porosity. Four types of pore systems (Types I–IV) were classified in this study (Figure 8). The scheme is rewarding for studying the influence of pore size distribution on heterogeneity and REV.
Large vugs with diameters greater than 10,000 μm are both developed in Type-II and Type-IV samples. The difference between these two types is their distinct pore size distributions that contribute to the total porosity (Figure 8b,d). The vugs’ diameters in Type-II samples are mainly in the range of 500–5000 μm (Figure 8b), whereas those in Type-IV samples are greater than 10,000 μm (Figure 8d). The small vugs, with diameters less than 500 μm, contribute less to the rock porosity in all types (Figure 8), suggesting that large vugs are the main source for the reservoir space of vuggy dolostones. The relationships between rock types and types of pore systems are complex due to the dual control of the deposition environment and diagenesis. Individual types of pore systems could be developed in multiple rock types (Figure 9). Moreover, different degrees of dissolution in the same rock type could result in variation in the pore systems. The Rock Type ii samples have a relatively high porosity (Figure 9), indicating that the development degree of vugs is the highest in these samples.
Quantifying reservoir heterogeneity is an important but difficult process. Many diagenetic parameters and pore structure parameters could result in variations of reservoir properties. The values of log10V50 and in Type-I samples are relatively low, indicating a more uniform pore structure. Nevertheless, heterogeneity could be high for a given low porosity in these samples (Figure 10c–f). Type-II samples are characterized by a relatively low heterogeneity but high porosity, indicating that the intensive development of vugs leads to low heterogeneity in carbonate reservoirs. However, the heterogeneity of the samples will increase only if a small number of large vugs is developed at a low porosity, such as Type-III samples (Table 1). The heterogeneity of different pore systems is highly variable in the vuggy carbonate reservoirs (Figure 10e,f). As such, it is a challenging task to select suitable samples for analysis. Therefore, precisely determining the REV sizes is very crucial for accurately calculating the petrophysical properties and evaluating the reservoir quality.
6.2. REV Analysis
This paper applies two methods to determine the REV size. One method is to determine the size of the representative elementary volume based on the cutoff value of Cv_sub when it is less than 0.1 (CREV), then the REV is obtained. Another method is to take the derivative of Cv_sub to determine the size of the representative elementary volume (DREV), where the REV is considered to be reached when the derivative of Cv_sub is between −9 × 10⁻¹⁵ and 9 × 10⁻¹⁵ (Figure 13). As shown in Figure 13a,c and e, the values of the DREV are greater than the CREV. There will be slight fluctuations when the value of Cv_sub is less than 0.1, resulting in a certain change in the derivative of Cv_sub. However, the DREV values could be equal to (Figure 13b) or less than (Figure 13d) the CREV, indicating that the value of Cv_sub is relatively stable when it is equal to or larger than 0.1, respectively. Figure 13f shows that the REV can be determined by the derivative of Cv_sub, but the size of the REV cannot be determined based on the cutoff value of Cv_sub. There are nine samples with values of the DREV which are lower than the CREV (the REV size of sample SHY025 cannot be obtained based on the cutoff value of Cv_sub.), two samples with a DREV equal to the CREV, and fifteen samples with a DREV greater than the CREV (Figure 14, Table 1). The REV determined based on the derivative of Cv_sub (DREV) is more accurate compared to the cutoff value of the Cv_sub (CREV), so the DREV is used for the following REV analysis.
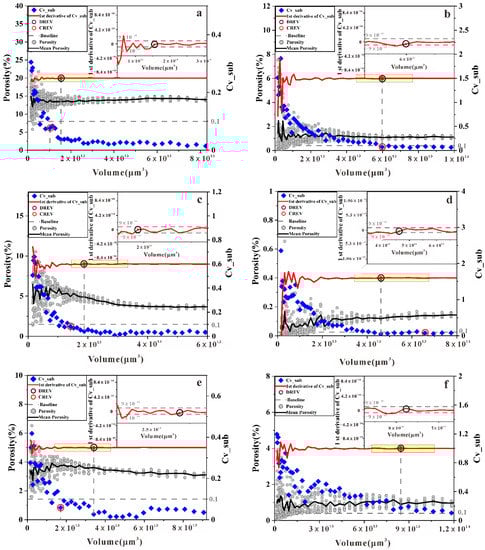
Figure 13.
Determination of REV for porosity. (a) Sample SHY002 developed flat vugs with a diameter of 2–6 mm. (b) Sample SHY007 developed vugs and cracks, and vugs half-filled by secondary carbonates. (c) Sample SHY009 developed a multitude of flat vugs developed with a diameter of 3–4 mm. (d) Sample SHY014 developed small amount of vugs with a diameter of 0.5–1 mm. (e) Sample SHY022 developed a multitude of flat vugs with a diameter of 1–2 mm. (f) Sample SHY025 developed flat vugs with a diameter of 2–6 mm and partially filled by secondary carbonates. The insets in the six images are magnifications of light yellow rectangle indicated in individual images.
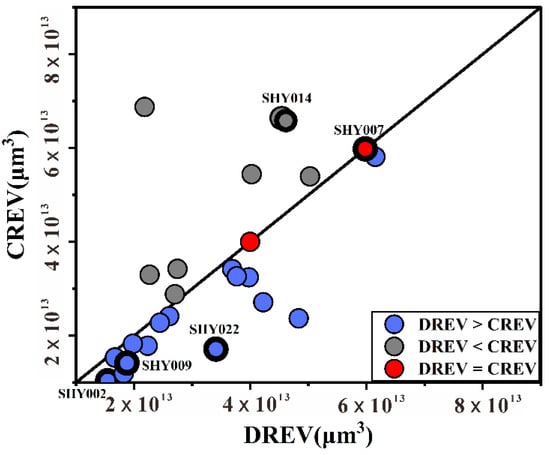
Figure 14.
Cross-plot of DREV versus CREV.
Factors affecting the REV size have been studied in previous works based on rock samples and numerical models at different scales. Gitman et al. [61] stated that the REV sizes depended on the investigated petrophysical properties, the contrast of properties, volume fractions of the microstructure, required relative precision, and the number of realizations of the microstructure. Tavakoli [17] demonstrated that primary depositional settings and diagenesis controlled the REV sizes of the reservoirs. Moreover, the REV size also depends on the scale of observation [17]. Compared to previous studies, we mainly focused on the influence of measurement methods, porosity, type of pore systems, and heterogeneity of pore structures on the REV sizes, with an aim to reveal the effect of the heterogeneity of the developed vugs on REV sizes.
The REV sizes are variable when using different methods, and the results obtained by the derivative of Cv_sub (DREV) are relatively more accurate (Figure 14). In addition, porosity is one of the important factors that influences the REV size. Clearly, the values of the DREV decrease as porosity increases (Figure 15). Nine of the twenty-six samples investigated have DREV values of less than 2.45 × 1013 μm3 (the volume of the cylinder with a diameter of 2.5 cm and a height of 5 cm) and a porosity greater than 3.5%, except for one outlier (Figure 15). Type-II and Type-IV samples required smaller volumes to attain REV compared to those of Type-I and Type-III samples, indicating that the development of large vugs has negative impacts on the REV size. In addition, the REV size was affected by the parameters of heterogeneity and pore structure. However, compared with porosity, the correlation between these parameters and the DREV was not high, as revealed by the weak correlations in Figure 16. As such, the REV size is very likely the result of the interplay of multiple factors. It is necessary to comprehensively consider the multiple parameters of a sample to accurately determine the REV size.
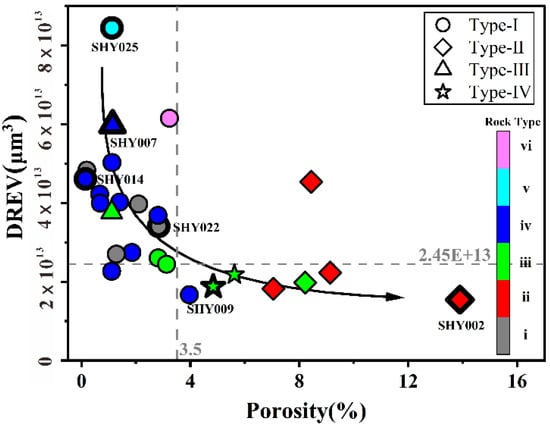
Figure 15.
Cross-plot of porosity and DREV with rock type superimposed in color. Marker shape represents pore type.
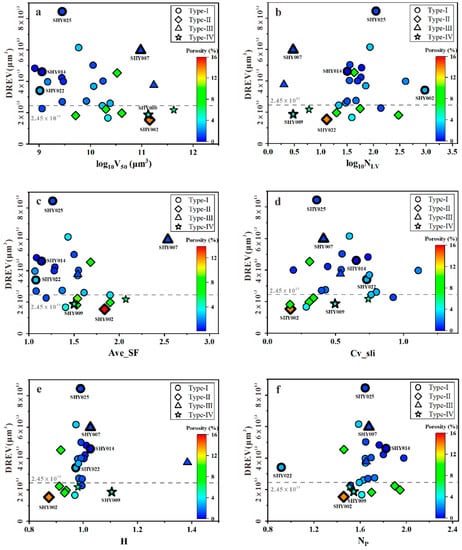
Figure 16.
Cross-plots of DREV and five parameters with porosity superimposed in color. Marker shape represents pore type. (a) DREV versus log10V50. (b) DREV versus log10. (c) DREV versus . (d) DREV versus Cv_sli. (e) DREV versus . (f) DREV versus .
6.3. The REV Prediction Model
Several researchers have attempted to determine the REV sizes of porous media. Clausnitzer et al. [39] showed that the side length of the REV for porosity was approximately 5.5 times of the diameter of a random pack of uniform glass beads. Bažant [40] found that the REV size could be calculated by , where is the characteristic length, and is the number of spatial dimensions. The characteristic length is approximately 2.7 times the maximum inclusion size [41]. Razavi et al. [34] suggested a systematic method to quantify the calculation of the REV, in which the REV radius of spherical glass beads was approximately two to three times the identified average diameters. The REV radius of silica sand was between 5 and 11 times the (the median particle size). The REV radius of Ottawa sandstone was between 9 and 16 times the (the median particle size). Vik et al. [26] showed that the REV sizes were close to the average values of all porosity measured when the bulk sample volume was greater than 1300 cm3, which was expected to be above the REV. Clearly, the REV sizes determined by the above studies were mainly based on the characteristic length or diameter. For significantly heterogeneous carbonate rocks, any single parameter is inadequate to properly evaluate it, as addressed above (Figure 16).
Multiple statistical regressions (MLRs) are a useful method to analyze the effect of multiple independent variables on the dependent variable [70,71]. The model is defined by Equation (13).
where is the determined property, is the predicted property, represents independent variables, and are coefficients determined by the regression. The adjusted coefficient of determination () is used to determine how this statistical model fits to the data of the determined property.
where is the sample size, represents the total number of independent variables in the linear model, and is the determination coefficient. is different to because it considers the degree of freedom of the data set. will increase when a new independent variable is included, with an exception that it improves more than expected by chance.
To reduce the uncertainties of the estimated REV, MLRs was used to evaluate the best statistical fit between the DREV and the calculated multi-factors using the adjusted coefficient of determination (). The independent variables were added one by one to the equation (Table 2). The independent variable was removed if the added independent variables did not contribute much to the fitted equation (e.g., parameters of Cv_sli and ) (Figure 17b,d). It is worth noting that parameter is not used in the predicting model, but this parameter is the premise of whether the sample can obtain the REV or not (see Section 4.3). Combinations of various factors have been tested (Figure 17, Table 2). Of which, the best model consists of parameters of logφ, , , and log that yield the maximum of 0.9320 with a p-value below 0.05 and D-W greater than 1.5. This final model passes the tests of the significance and sample independence. The REV sizes can be obtained by a non-destructive CT technique in this method, meaning there are intact sample aspects for later petrophysical tests. More importantly, the REV sizes obtained for multiple parameters are more accurate than those obtained for a single parameter.
Table 2.
Adjusted Coefficient of Determination between Determined and Estimated REV.
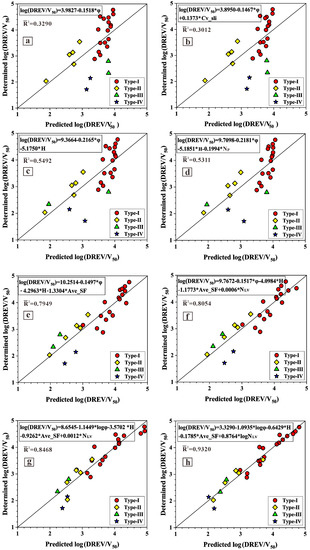
Figure 17.
The fitting prediction model of DREV. (a) Fitting model established for . (b) Fitting model established for and Cv_sli. (c) Fitting model established for and . (d) Fitting model established for , and . (e) Fitting model established for , and . (f) Fitting model established for , , and . (g) Fitting model established for , , and (h) Fitting model established for , , and .
The link between the REV sizes and porosity, pore structure parameters, and heterogeneity parameter is thus established based on the prediction model. In other words, REV sizes can be obtained if these parameters are known. This potentially makes it a very effective model to predict the REV sizes of vuggy dolostones. This study provides a foundation for accurately calculating petrophysical properties and precisely evaluating the reservoir’s quality.
7. Conclusions
- (1)
- A total of 26 vuggy dolostones collected from the Cambrian Xiaoerbulake Formation at the Kalping uplift are classified into four types of pore systems based on the pore size distribution and contribution of pores to porosity.
- (2)
- The different degrees of dissolution in different types of pore systems yield variation in porosity, pore structure parameters, and heterogeneity. The development of numerous vugs increases porosity and reduces heterogeneity, while the development of a small amounts of large vugs increases the sample’s heterogeneity.
- (3)
- The REV determined by the derivative of Cv_sub is more accurate than that determined by the cutoff value of Cv_sub. Only nine out of twenty-six samples have a DREV less than the volume of traditional core plugs (2.45 × 1013 μm3), hence the traditional core plugs are unrepresentative for most vuggy carbonate rocks.
- (4)
- The REV sizes are influenced by various factors. Any individual parameter only is inadequate to properly evaluate the REV sizes, so that multi-factors should be considered. A prediction model has been established based on the relationship between the REV sizes and the quantitative parameters of V50, , , , and H, with the correlation coefficient reaching 0.9320. Thus, our model could be very effective for predicting REV sizes of vuggy dolostones.
Author Contributions
Conceptualization, Y.X. and Z.C.; methodology, Y.X.; software, Y.X., Q.L. and J.G.; validation. Y.X., Z.C. and H.Z.; formal analysis, Y.X. and L.C.; investigation, Y.X.; resources, Y.X. and F.H.; data curation, Y.X.; writing—original draft preparation, Y.X.; writing—review and editing, Y.X. and H.Z.; project administration, Z.C.; funding acquisition, Z.C. All authors have read and agreed to the published version of the manuscript.
Funding
This work is financially supported by the National Key Research and Development Program of China (Grant No. 2019YFC0605502), the Strategic Priority Research Program of the Chinese Academy of Sciences (Grant No. XDA14010302), and the National Natural Science Foundation of China (Grant No. 42002170).
Institutional Review Board Statement
Not applicable.
Informed Consent Statement
Not applicable.
Data Availability Statement
Not applicable.
Acknowledgments
We appreciate Jie Li and Peng Tang for their collaboration and enthusiastic support of fieldwork. The authors especially thank Yan Xiong for her help during the medical-CT experiment.
Conflicts of Interest
The authors declare no conflict of interest.
Nomenclature
| REV | the representative elementary volume |
| V50 | the dominant pore volume |
| the pore number on the cumulative curve at greater than 50% | |
| the average of the shape factor | |
| the area of the ith pore | |
| the volume of the ith pore | |
| n | the total number of pores |
| Cv | the coefficient of variation |
| the standard deviation | |
| the arithmetic mean value | |
| Cv_sli | the coefficient of variation of the medical-CT along the slice direction |
| Cv_sub | the coefficient of variation when determining the REV. |
| the heterogeneous factor | |
| the bulk volume of the sample | |
| the bulk volume of the inner large vugs of the sample (the volume of each vug is greater than or equal to V50) | |
| the volume of the sample, excluding | |
| the volume of the rock matrix | |
| the volume of pores, excluding | |
| the porosity of the sample | |
| the volume of the pores | |
| the porosity of the inner large vugs | |
| the porosity of the sample, excluding the inner large vugs | |
| the ratio of the bulk volume of the inner large vugs to the bulk volume of the sample | |
| the ratio of the porosity of the inner large vugs to the porosity of a sample excluding the inner large vugs | |
| the scale parameter (α > 0) | |
| the position parameter | |
| the signal | |
| the analyzing wavelet (the wavelet used is a complex wavelet) | |
| the number of periodicities per unit length | |
| P | the total number of periodicities |
| L | the number of CT slices |
| CREV | the determining REV based on the cutoff value of Cv_sli |
| DREV | the determining REV based on the derivative of Cv_sub |
| the characteristic length | |
| the number of spatial dimensions | |
| the median particle size | |
| the determined property | |
| the predicted property | |
| independent variables | |
| coefficients determined by the regression | |
| the adjusted coefficient of determination | |
| the sample size | |
| the total number of independent variables | |
| the determination coefficient |
References
- Ahr, W.M. Geology of Carbonate Reservoirs: The Identification, Description, and Characterization of Hydrocarbon Reservoirs in Carbonate Rocks; Wiley: Hoboken, NJ, USA, 2008. [Google Scholar] [CrossRef]
- Jia, C. Characteristics of Chinese Petroleum Geology: Geological Features and Exploration Cases of Stratigraphic, Foreland and Deep Formation Traps; Springer: Berlin/Heidelberg, Germany, 2012. [Google Scholar] [CrossRef]
- Bagrintseva, K.I. Carbonate Reservoir Rocks; John Wiley & Sons: Hoboken, NJ, USA, 2015. [Google Scholar]
- Apolinarska, K. Book Reviews. Origin of Carbonate Sedimentary Rocks; De Gruyter Open: Berlin, Germany, 2017. [Google Scholar] [CrossRef]
- Issoufou Aboubacar, M.S.; Cai, Z. A Quadruple-Porosity Model for Consistent Petrophysical Evaluation of Naturally Fractured Vuggy Reservoirs. SPE J. 2020, 25, 2678–2693. [Google Scholar] [CrossRef]
- Zhang, H.; Ait Abderrahmane, H.; Arif, M.; Al Kobaisi, M.; Sassi, M. Influence of Heterogeneity on Carbonate Permeability Upscaling: A Renormalization Approach Coupled with the Pore Network Model. Energy Fuels 2022, 36, 3003–3015. [Google Scholar] [CrossRef]
- Gundogar, A.S.; Ross, C.M.; Akin, S.; Kovscek, A.R. Multiscale pore structure characterization of middle east carbonates. J. Pet. Sci. Eng. 2016, 146, 570–583. [Google Scholar] [CrossRef]
- Sadeghnejad, S.; Gostick, J. Multiscale Reconstruction of Vuggy Carbonates by Pore-Network Modeling and Image-Based Technique. SPE J. 2020, 25, 253–267. [Google Scholar] [CrossRef]
- Radwan, A.E.; Trippetta, F.; Kassem, A.A.; Kania, M. Multi-scale characterization of unconventional tight carbonate reservoir: Insights from October oil filed, Gulf of Suez rift basin, Egypt. J. Pet. Sci. Eng. 2021, 197, 107968. [Google Scholar] [CrossRef]
- Li, J.; Zhang, H.; Cai, Z.; Zou, H.; Hao, F.; Wang, G.; Li, P.; Zhang, Y.; He, J.; Fei, W. Making sense of pore systems and the diagenetic impacts in the Lower Triassic porous dolostones, northeast Sichuan Basin. J. Pet. Sci. Eng. 2021, 197, 107949. [Google Scholar] [CrossRef]
- Chen, J.; Yang, S.; Mei, Q.; Chen, J.; Chen, H.; Zou, C.; Li, J.; Yang, S. Influence of Pore Structure on Gas Flow and Recovery in Ultradeep Carbonate Gas Reservoirs at Multiple Scales. Energy Fuels 2021, 35, 3951–3971. [Google Scholar] [CrossRef]
- Jiang, Z.; van Dijke, M.I.J.; Sorbie, K.S.; Couples, G.D. Representation of multiscale heterogeneity via multiscale pore networks. Water Resour. Res. 2013, 49, 5437–5449. [Google Scholar] [CrossRef]
- Nader, F.H. Multi-Scale Quantitative Diagenesis and Impacts on Heterogeneity of Carbonate Reservoir Rocks; Springer: Berlin/Heidelberg, Germany, 2017. [Google Scholar]
- Frazer, G.W.; Wulder, M.A.; Niemann, K.O. Simulation and quantification of the fine-scale spatial pattern and heterogeneity of forest canopy structure: A lacunarity-based method designed for analysis of continuous canopy heights. For. Ecol. Manag. 2005, 214, 65–90. [Google Scholar] [CrossRef]
- Fitch, P.J.R.; Lovell, M.A.; Davies, S.J.; Pritchard, T.; Harvey, P.K. An integrated and quantitative approach to petrophysical heterogeneity. Mar. Pet. Geol. 2015, 63, 82–96. [Google Scholar] [CrossRef]
- Cooper, S.D.; Barmuta, L.; Sarnelle, O.; Kratz, K.; Diehl, S. Quantifying Spatial Heterogeneity in Streams. Freshw. Sci. 1997, 16, 174–188. [Google Scholar] [CrossRef]
- Tavakoli, V. Carbonate Reservoir Heterogeneity: Overcoming the Challenges; Springer International Publishing AG: Cham, Switzerland, 2019. [Google Scholar]
- Bear, J. Dynamics of Fluids in Porous Media; American Elsevier Publishing Company: Princeton, NJ, USA, 1972. [Google Scholar]
- Brown, G.O.; Hsieh, H.T.; Lucero, D.A. Evaluation of laboratory dolomite core sample size using representative elementary volume concepts. Water Resour. Res. 2000, 36, 1199–1207. [Google Scholar] [CrossRef]
- Rozenbaum, O.; du Roscoat, S.R. Representative elementary volume assessment of three-dimensional x-ray microtomography images of heterogeneous materials: Application to limestones. Phys. Rev. E 2014, 89, 053304. [Google Scholar] [CrossRef] [PubMed]
- Yio, M.H.N.; Wong, H.S.; Buenfeld, N.R. Representative elementary volume (REV) of cementitious materials from three-dimensional pore structure analysis. Cem. Concr. Res. 2017, 102, 187–202. [Google Scholar] [CrossRef]
- Shah, S.M.; Crawshaw, J.P.; Gray, F.; Yang, J.; Boek, E.S. Convex hull approach for determining rock representative elementary volume for multiple petrophysical parameters using pore-scale imaging and Lattice–Boltzmann modelling. Adv. Water Resour. 2017, 104, 65–75. [Google Scholar] [CrossRef]
- Wu, M.; Wu, J.; Wu, J. A three-dimensional model for quantification of the representative elementary volume of tortuosity in granular porous media. J. Hydrol. 2018, 557, 9. [Google Scholar] [CrossRef]
- Wang, Y.; Wang, L.; Wang, J.; Jiang, Z.; Wang, C.-C.; Fu, Y.; Song, Y.-F.; Wang, Y.; Liu, D.; Jin, C. Multiscale characterization of three-dimensional pore structures in a shale gas reservoir: A case study of the Longmaxi shale in Sichuan basin, China. J. Nat. Gas Sci. Eng. 2019, 66, 207–216. [Google Scholar] [CrossRef]
- Wu, H.; Yao, Y.; Zhou, Y.; Qiu, F. Analyses of representative elementary volume for coal using X-ray μ-CT and FIB-SEM and its application in permeability predication model. Fuel 2019, 254, 115563. [Google Scholar] [CrossRef]
- Vik, B.; Bastesen, E.; Skauge, A. Evaluation of representative elementary volume for a vuggy carbonate rock-Part: Porosity, permeability, and dispersivity. J. Pet. Sci. Eng. 2013, 112, 36–47. [Google Scholar] [CrossRef]
- Gonzalez, J.L.; de Faria, E.L.; Albuquerque, M.P.; Albuquerque, M.P.; Bom, C.R.; Freitas, J.C.C.; Cremasco, C.W.; Correia, M.D. Representative elementary volume for NMR simulations based on X-ray microtomography of sedimentary rock. J. Pet. Sci. Eng. 2018, 166, 906–912. [Google Scholar] [CrossRef]
- Singh, A.; Regenauer-Lieb, K.; Walsh, S.D.C.; Armstrong, R.T.; van Griethuysen, J.J.; Mostaghimi, P. On Representative Elementary Volumes of Grayscale Micro-CT Images of Porous Media. Geophys. Res. Lett. 2020, 47, e2020GL088594. [Google Scholar] [CrossRef]
- Shahin, G.; Desrues, J.; Pont, S.D.; Combe, G.; Argilaga, A. A study of the influence of REV variability in double-scale FEM × DEM analysis. Int. J. Numer. Methods Eng. 2016, 107, 882–900. [Google Scholar] [CrossRef]
- Norris, R.J.; Lewis, J.J.M. The Geological Modeling of Effective Permeability in Complex Heterolithic Facies. In Proceedings of the SPE Annual Technical Conference and Exhibition, SPE-22692-MS, Dallas, TX, USA, 6–9 October 1991. [Google Scholar] [CrossRef]
- Nordahl, K.; Ringrose, P.S. Identifying the Representative Elementary Volume for Permeability in Heterolithic Deposits Using Numerical Rock Models. Math. Geosci. 2008, 40, 753–771. [Google Scholar] [CrossRef]
- Katagiri, J.; Kimura, S.; Noda, S. Significance of shape factor on permeability anisotropy of sand: Representative elementary volume study for pore-scale analysis. Acta Geotech. 2020, 15, 2195–2203. [Google Scholar] [CrossRef]
- Borges, J.A.R.; Pires, L.F.; Cássaro, F.A.M.; Roque, W.L.; Heck, R.J.; Rosa, J.A.; Wolf, F.G. X-ray microtomography analysis of representative elementary volume (REV) of soil morphological and geometrical properties. Soil Tillage Res. 2018, 182, 112–122. [Google Scholar] [CrossRef]
- Razavi, M.R.; Muhunthan, B.; Al Hattamleh, O. Representative Elementary Volume Analysis of Sands Using X-Ray Computed Tomography. Geotech. Test. J. 2007, 30, 212–219. [Google Scholar] [CrossRef]
- Costanza-Robinson, M.S.; Estabrook, B.D.; Fouhey, D.F. Representative elementary volume estimation for porosity, moisture saturation, and air-water interfacial areas in unsaturated porous media: Data quality implications. Water Resour. Res. 2011, 47, W07513. [Google Scholar] [CrossRef]
- Al-Raoush, R.; Papadopoulos, A. Representative elementary volume analysis of porous media using X-ray computed tomography. Powder Technol. 2010, 200, 69–77. [Google Scholar] [CrossRef]
- Zhang, J.; Yu, L.; Jing, H.; Liu, R. Estimating the Effect of Fractal Dimension on Representative Elementary Volume of Randomly Distributed Rock Fracture Networks. Geofluids 2018, 2018, 1–13. [Google Scholar] [CrossRef]
- Wei, C.; Tian, C.; Zheng, J.; Cai, K.; Du, D.; Song, B.; Hu, Y. Heterogeneity Characteristics of Carbonate Reservoirs: A Case Study using Whole Core Data. In Proceedings of the SPE Reservoir Characterisation and Simulation Conference and Exhibition, Abu Dhabi, United Arab Emirates, 14–16 September 2015; p. D021S004R002. [Google Scholar] [CrossRef]
- Clausnitzer, V.; Hopmans, J.W. Determination of phase-volume fractions from tomographic measurements in two-phase systems. Adv. Water Resour. 1999, 22, 577–584. [Google Scholar] [CrossRef]
- Bažant, Z.P. Stochastic models for deformation and failure of quasibrittle structures: Recent advances and new directions. In Computational Modelling of Concrete Structures; A.A. Balkema Publisher: Lisse, The Netherlands, 2003; pp. 583–598. [Google Scholar]
- Bažant, Z.P.; Pijaudier-Cabot, G. Measurement of Characteristic Length of Nonlocal Continuum. J. Eng. Mech. 1989, 115, 755–767. [Google Scholar] [CrossRef]
- Lai, J.; Wang, G.; Wang, Z.; Chen, J.; Pang, X.; Wang, S.; Zhou, Z.; He, Z.; Qin, Z.; Fan, X. A review on pore structure characterization in tight sandstones. Earth-Sci. Rev. 2018, 177, 436–457. [Google Scholar] [CrossRef]
- Moslemipour, A.; Sadeghnejad, S. Dual-scale pore network reconstruction of vugular carbonates using multi-scale imaging techniques. Adv. Water Resour. 2021, 147, 103795. [Google Scholar] [CrossRef]
- Razavifar, M.; Mukhametdinova, A.; Nikooee, E.; Burukhin, A.; Rezaei, A.; Cheremisin, A.; Riazi, M. Rock Porous Structure Characterization: A Critical Assessment of Various State-of-the-Art Techniques. Transp. Porous Media 2021, 136, 431–456. [Google Scholar] [CrossRef]
- Vogel, H.J.; Weller, U.; Schlüter, S. Quantification of soil structure based on Minkowski functions. Comput. Geosci. 2010, 36, 1236–1245. [Google Scholar] [CrossRef]
- Cnudde, V.; Boone, M.N. High-resolution X-ray computed tomography in geosciences: A review of the current technology and applications. Earth-Sci. Rev. 2013, 123, 1–17. [Google Scholar] [CrossRef]
- Qajar, J.; Arns, C.H. Characterization of reactive flow-induced evolution of carbonate rocks using digital core analysis- part 1: Assessment of pore-scale mineral dissolution and deposition. J. Contam. Hydrol. 2016, 192, 60–86. [Google Scholar] [CrossRef] [PubMed]
- Chaves, J.M.; Moreno, R.B. Low- and High-Resolution X-Ray Tomography Helping on Petrophysics and Flow-Behavior Modeling. SPE J. 2021, 26, 206–219. [Google Scholar] [CrossRef]
- Pini, R.; Madonna, C. Moving across scales: A quantitative assessment of X-ray CT to measure the porosity of rocks. J. Porous Mater. 2015, 23, 325–338. [Google Scholar] [CrossRef]
- Ye, N.; Zhang, S.; Qing, H.; Li, Y.; Huang, Q.; Liu, D. Dolomitization and its impact on porosity development and preservation in the deeply burial Lower Ordovician carbonate rocks of Tarim Basin, NW China. J. Pet. Sci. Eng. 2019, 182, 106303. [Google Scholar] [CrossRef]
- Chen, L.; Zhang, H.; Cai, Z.; Hao, F.; Xue, Y.; Zhao, W. Petrographic, mineralogical and geochemical constraints on the fluid origin and multistage karstification of the Middle-Lower Ordovician carbonate reservoir, NW Tarim Basin, China. J. Petrol. Sci. Eng. 2022, 208, 109561. [Google Scholar] [CrossRef]
- Liu, P.X.; Deng, S.B.; Guan, P.; Jin, Y.Q.; Wang, K.; Chen, Y.Q. The nature, type, and origin of diagenetic fluids and their control on the evolving porosity of the Lower Cambrian Xiaoerbulak Formation dolostone, northwestern Tarim Basin, China. Pet. Sci. 2020, 17, 873–895. [Google Scholar] [CrossRef]
- Zhang, D.; Bao, Z.; Pan, W.; Hao, Y.; Cheng, Y.; Wang, J.; Zhang, Y.; Lai, H. Characteristics and forming mechanisms of evaporite platform dolomite reservoir in Middle Cambrian of Xiaoerbulake section, Tarim Basin. Nat. Gas Geosci. 2014, 25, 498–507. [Google Scholar]
- Deng, S.; Li, H.; Zhang, Z.; Zhang, J.; Yang, X. Structural characterization of intracratonic strike-slip faults in the central Tarim Basin. AAPG Bull. 2019, 103, 109–137. [Google Scholar] [CrossRef]
- Shen, A.; Zheng, J.; Chen, Y.; Ni, X.; Huang, L. Characteristics, origin and distribution of dolomite reservoirs in Lower-Middle Cambrian, Tarim Basin, NW China. Pet. Explor. Dev. 2016, 43, 375–385. [Google Scholar] [CrossRef]
- Zheng, J.P.; Wenqing, P.; Anjiang, S. Reservoir geological modeling and significance of Cambrian Xiaoerblak Formation in Keping outcrop area, Tarim Basin, NW China. Pet. Explor. Dev. 2019, 47, 392–402. [Google Scholar] [CrossRef]
- Zhang, J.; Song, A. Application of Wavelet Analysis in Sequence Stratigraphic Division of Glutenite Sediments. In Proceedings of the 2010 International Conference on Challenges in Environmental Science and Computer Engineering, Wuhan, China, 6–7 March 2010. [Google Scholar]
- Kadkhodaie, A.; Rezaee, R. Intelligent sequence stratigraphy through a wavelet-based decomposition of well log data. J. Nat. Gas Sci. Eng. 2017, 40, 38–50. [Google Scholar] [CrossRef]
- Allshorn, S.L.; Dawe, R.A.; Grattoni, C.A. Implication of heterogeneities on core porosity measurements. J. Pet. Sci. Eng. 2019, 174, 486–494. [Google Scholar] [CrossRef]
- Ostoja-Starzewski, M. Material spatial randomness: From statistical to representative volume element. Probabilistic Eng. Mech. 2006, 21, 112–132. [Google Scholar] [CrossRef]
- Gitman, I.M.; Askes, H.; Sluys, L.J. Representative volume: Existence and size determination. Eng. Fract. Mech. 2007, 74, 2518–2534. [Google Scholar] [CrossRef]
- Archie, G.E. Classification of Carbonate Reservoir Rocks and Petrophysical Considerations. AAPG Bull. 1952, 36, 278–298. [Google Scholar]
- Choquette, P.W.; Pray, L.C. Geologic Nomenclature and Classification of Porosity in Sedimentary Carbonates. AAPG Bull. 1970, 54, 207–250. [Google Scholar]
- Lønøy, A. Making sense of carbonate pore systems. AAPG Bull. 2006, 90, 1381–1405. [Google Scholar] [CrossRef]
- Lucia, F.J. Petrophysical Parameters Estimated From Visual Descriptions of Carbonate Rocks: A Field Classification of Carbonate Pore Space. J. Pet. Technol. 1983, 35, 629–637. [Google Scholar] [CrossRef]
- Lucia, F.J. Rock-Fabric/Petrophysical Classification of Carbonate Pore Space for Reservoir Characterization1. AAPG Bull. 1995, 79, 1275–1300. [Google Scholar]
- Lucia, F.J. Carbonate Reservoir Characterization; Springer: Berlin/Heidelberg, Germany, 2007. [Google Scholar] [CrossRef]
- Luo, P.; Machel, H.G. Pore size and pore throat types in a heterogeneous dolostone reservoir, Devonian Grosmont Formation, Western Canada sedimentary basin. AAPG Bull. 1995, 79, 1698–1720. [Google Scholar]
- Li, B.; Tan, X.; Wang, F.; Lian, P.; Gao, W.; Li, Y. Fracture and vug characterization and carbonate rock type automatic classification using X-ray CT images. J. Pet. Sci. Eng. 2017, 153, 88–96. [Google Scholar] [CrossRef]
- Archilla, N.L.; Missagia, R.M.; Hollis, C.; de Ceia, M.A.R.; McDonald, S.A.; Lima Neto, I.A.; Eastwood, D.S.; Lee, P. Permeability and acoustic velocity controlling factors determined from x-ray tomography images of carbonate rocks. AAPG Bull. 2016, 100, 1289–1309. [Google Scholar] [CrossRef]
- Oliveira, G.L.P.; Ceia, M.A.R.; Missagia, R.M.; Lima Neto, I.; Santos, V.H.; Paranhos, R. Core plug and 2D/3D-image integrated analysis for improving permeability estimation based on the differences between micro- and macroporosity in Middle East carbonate rocks. J. Pet. Sci. Eng. 2020, 193, 107335. [Google Scholar] [CrossRef]


Publisher’s Note: MDPI stays neutral with regard to jurisdictional claims in published maps and institutional affiliations. |
© 2022 by the authors. Licensee MDPI, Basel, Switzerland. This article is an open access article distributed under the terms and conditions of the Creative Commons Attribution (CC BY) license (https://creativecommons.org/licenses/by/4.0/).