Article

Fast Charging of an Electric Bus Fleet and Its Impact on the Power Quality Based on On-Site Measurements

1
Department of Electrical Engineering and Electrotechnologies, Faculty of Electrical Engineering and Computer Science, Lublin University of Technology, Nadbystrzycka 38 A, 20-618 Lublin, Poland
2
Department of Electrical Drives and Machines, Faculty of Electrical Engineering and Computer Science, Lublin University of Technology, Nadbystrzycka 38 A, 20-618 Lublin, Poland
*
Author to whom correspondence should be addressed.
Energies 2022, 15(15), 5555; https://doi.org/10.3390/en15155555
Submission received: 30 June 2022 / Revised: 23 July 2022 / Accepted: 28 July 2022 / Published: 30 July 2022

Abstract

:
The subject of this study was a distribution substation that feeds 14 fast DC chargers (80 kW) located at the bus depot in Lublin, Poland. The voltage variations were determined to be within the PN-EN 50160 standard limit values (±10% Un). There were several events registered when 4th, 6th, 8th, and 10th voltage harmonics were above the PN-EN 50160 limit during the charging of the electric buses. The obtained maximum 10 min average values of the total voltage harmonic distortion (THD) were 3.36%, 2.27%, and 2.89% for the first, second, and third phase, respectively, i.e., below the limit value of 8% required by PN-EN 50160. Due to the exceedance of the 6th voltage harmonic, the PN-EN 50160 requirements were not met.

1. Introduction

Electric buses provide numerous benefits, the most notable of which is the reduction in air pollution levels. Using electric buses also provides a reduction in noise emissions and improvements in the comfort of transportation in cities. Electric buses do not produce environmentally harmful exhaust fumes and emit much less noise than conventional buses [1,2,3,4].
According to the Polish Alternative Fuels Association (PSPA) [5], as of the last day of 2021, Polish cities had a fleet of 615 city buses. This is about 5.2% of all vehicles of this type in Poland. More than half (54.1%) of all electric buses registered in Poland were part of fleets operating in cities with more than 300,000 residents, i.e., in Warsaw, Kraków, Poznań, Szczecin, Bydgoszcz, and Lublin [6].
In 2021, for the first time in Poland’s history, there were more registrations of new electric buses (36%) than those with diesel engines (35%). In terms of the number of newly registered electric buses, Poland took 5th place in Europe (Denmark, France, Great Britain, and Germany took higher positions). At the end of April 2022, there were 721 electric buses registered in Poland [5]. All indications are that 2022 will be another year in which the number of electric buses will increase.
In Poland, there are currently 520 charging stations in use for electric buses, which provide more than 70 MW of power in more than 50 cities. In this category, the leader is invariably Ekoenergetyka-Polska, company from Zielona Góra, which launched 437 charging stations, with a total capacity of 61 MW. Further spots on the podium belong to: Medcom (16%–85 charging stations) and Enika (3%–13 charging stations) [7].
The charging of electric vehicles requires the use of non-linear power electronic devices. Current harmonics are injected into the distribution grid during the operation of a fast charger, which might affect other power quality parameters [8,9,10,11]. Current and voltage harmonics might cause power losses [12,13]. The resulting voltage distortion depends on the parameters of the power system; however, the current distortion depends on the individual characteristics of the device. Malfunctions and damages of some devices might originate from other devices generating harmonics (such as fast chargers). Management algorithm and topology of a fast charger, as well as neighboring electric bus chargers and other non-linear loads, are able to influence the current harmonic emissions. Damage to generators and turbine shafts, transformers, neutral wires and motor overheating, unwanted tripping of circuit breakers, capacitor overloading, and system resonation are all impacts of current harmonic distortions [14,15,16,17].
With the growing popularity of electric buses, their impact on power systems is receiving more attention. The studies are mostly based on computational simulations. In the research of [18], an analysis of the impact electric bus charging on urban distribution grids was provided. According to the findings, typical European cities are expected to be capable of integrating a large number of electric bus chargers into their medium voltage distribution network. Leou et al. [19] built the stochastic harmonic analysis model and usage scenario model. The analyzed distribution system started to have voltage events due to the increasing number of chargers; however, current and voltage harmonic levels were acceptable. The scheduling of electric bus charging and its impact on the power system was analyzed in [20,21].
There are a few papers where the impact of electric bus charging was investigated, considering the data obtained from the actual measurements. Thiringer and Haghbin [22] examined the impact of electric buses on power quality parameters. The study showed that the harmonic emission was within the acceptable limits, in spite of the high amount of low-frequency harmonics. The impact of 11 electric bus chargers was discussed in the study by [23]. Power quality parameters, including voltage flickers, harmonic distortion, and voltage imbalance, met the grid code requirements. The effect of implementing an electric bus fleet in Warsaw was examined by Zagrajek et al. [24]. The results showed that power quality parameters were within the limits of the EN 50160 standard. In the work of [25], the impact of pantograph charging and fast charging on power quality parameters was presented. The power quality parameters were also compliant with the EN 50160 standard. According to the research, while more than one charger was in operation, the harmonic currents were of an additive nature, to some degree.
The purpose of this paper is to identify and analyze the impact of electric bus charging on power quality parameters.

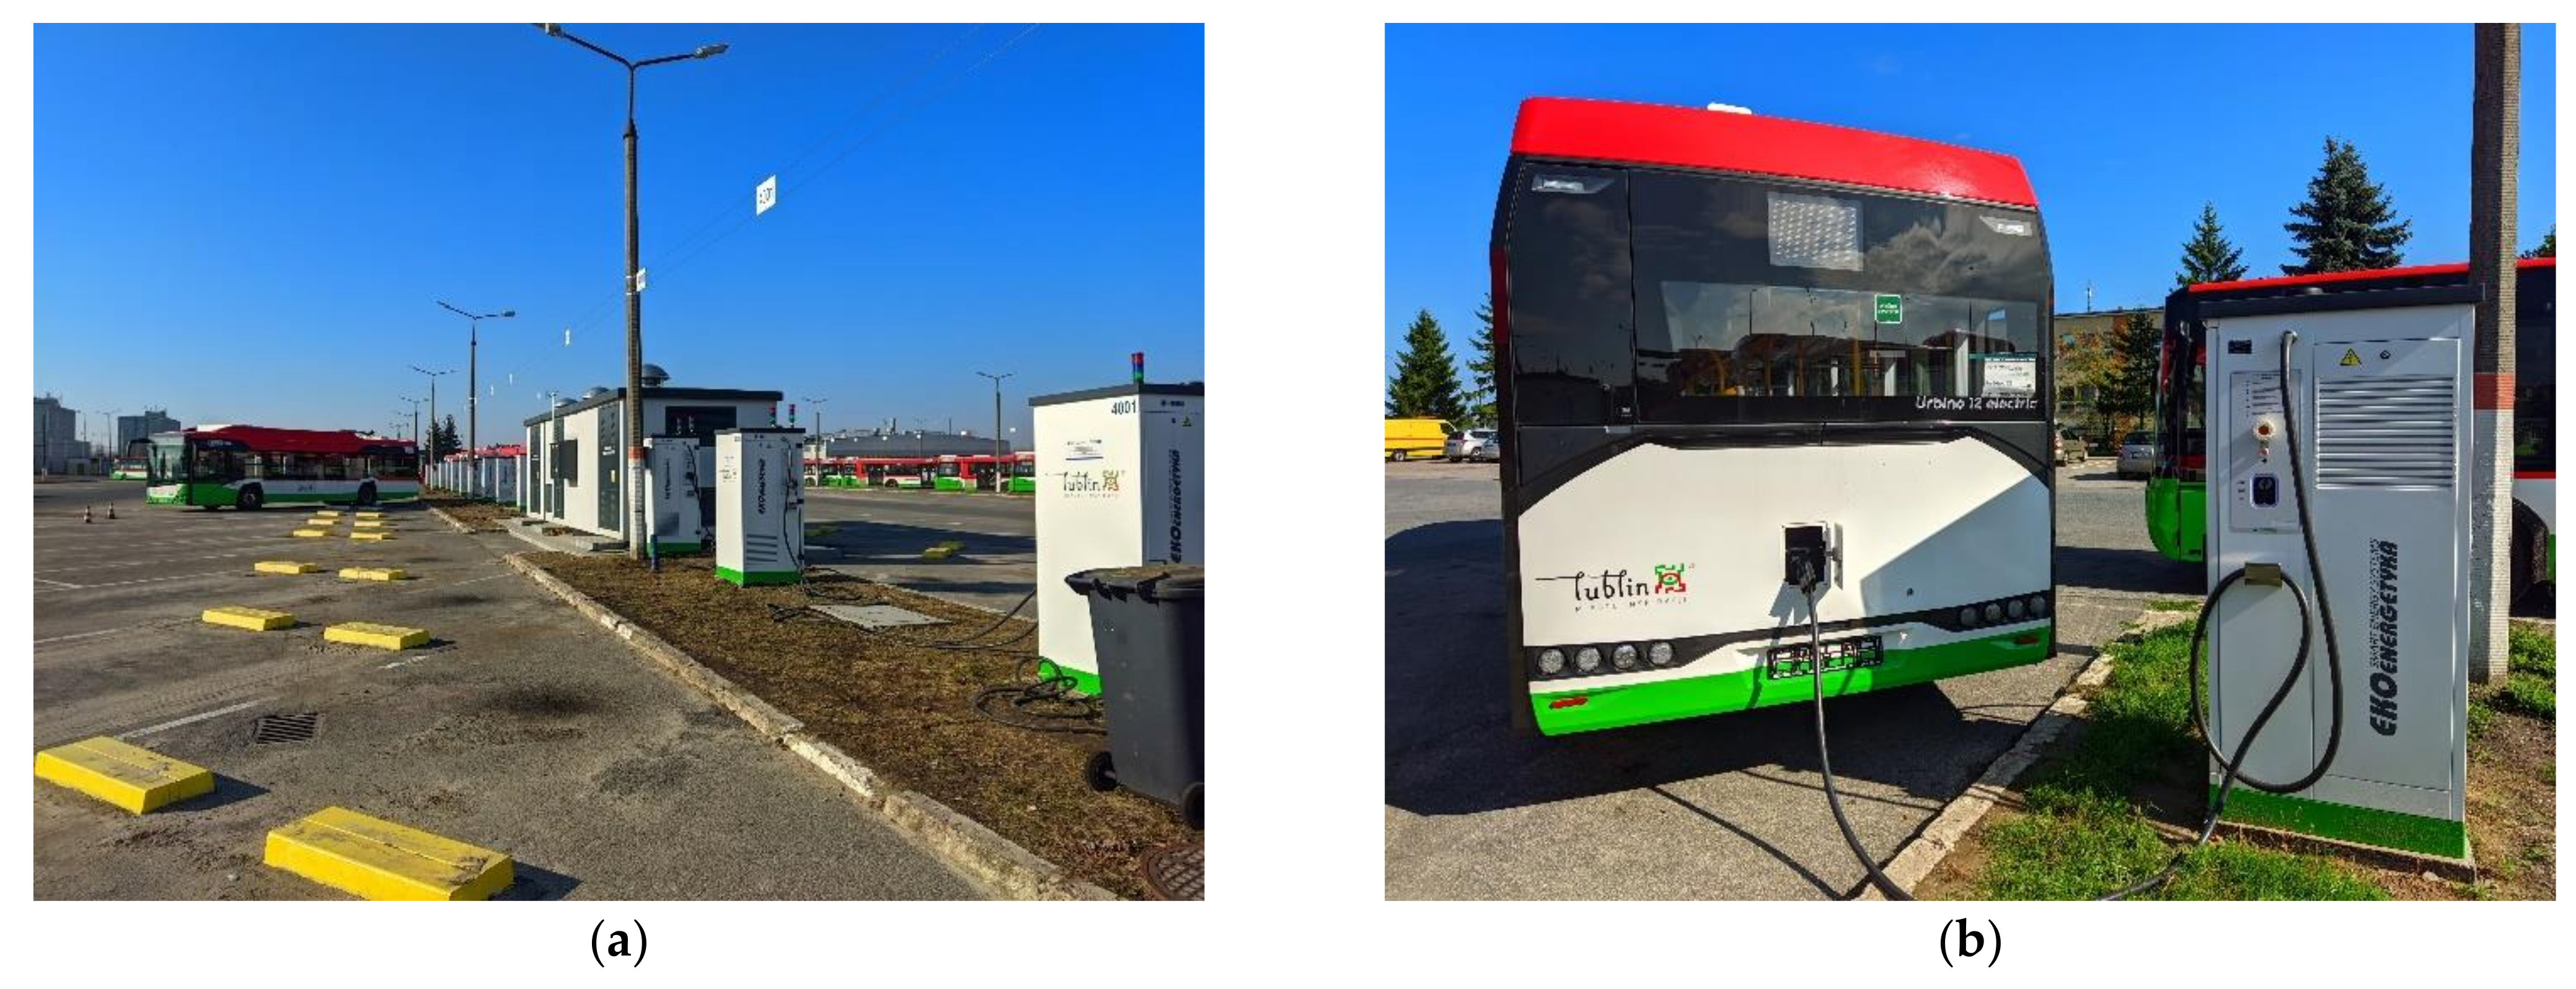
2. Materials and Methods

The research focused on a distribution substation that supplies 14 fast electric bus chargers of the same type at the bus depot at Grygowa Street in Lublin, Poland (Figure 1). The bus depot has a 1600 kVA 15.75/0.42 kV Dyn5 transformer that is connected to the 15.75 kV medium voltage grid (Figure 2). The stationary DC charging station is designed to charge electric buses equipped with a Combo-2 charging connector (Type 2; Mode 4). The charging station is built on the basis of high-frequency converter circuits, which serve as a regulated current-voltage source with the possibility of direct communication with the electric bus’s battery management system. The unit has 2 outputs, providing the possibility of charging two buses simultaneously, with a maximum output of 40 kW using both connectors, and the possibility of charging with the full charger output, i.e., a maximum of 80 kW when using one connector. The electric bus fleet in Lublin consists of 31 Solaris Urbino 12 electric buses (IV generation) that are equipped with traction batteries with a capacity of 116 kWh (4 × 29 kWh) made using lithium-titanium-oxide (LTO) technology. The minimum range of this type of electric bus is approximately 90 km.
Power quality measurements were taken throughout the week and 3 days later during one charging process using an IEC 61000-4-30:2015 class A power quality analyzer, Sonel PQM-711 with Sonel F-2 Rogowski coils. The data aggregation interval was set to 150 cycles (3 s; nominal frequency of 50 Hz) for the whole week, and 10 cycles (200 ms; nominal frequency of 50 Hz) for one charging process so as to be able to analyze current harmonics emission in accordance with the IEEE 519 standard. The data stored in the analyzer was imported with Sonel Analysis 4.5.0 software. The results were then aggregated (averaged) to approximately 10 min intervals; therefore, 1010 cycles and 6 samples of average values for the whole week and one charging process, respectively, were obtained.
Standard documents considered in the power quality analysis are [26,27,28,29]:
  • The Regulation of the Minister of Economy of 4 May 2007 on the detailed conditions for the operation of the power system (hereafter referred as the Regulation)—the fundamental document in Poland′s procedure of analyzing power quality for low, medium, and high voltage public power networks, with the last update in 2020;
  • PN-EN 50160:2010—a subordinate document to the Regulation and in line with its requirements. This document introduces European standard EN 50160 in Poland. In 2015 and 2019 the PN-EN 50160 standard was updated and the requirements were tightened for Norway; however, as the Regulation in Poland has not been updated and it is the paramount of importance, the results will be analyzed in accordance with the 2010 version of PN-EN 50160;
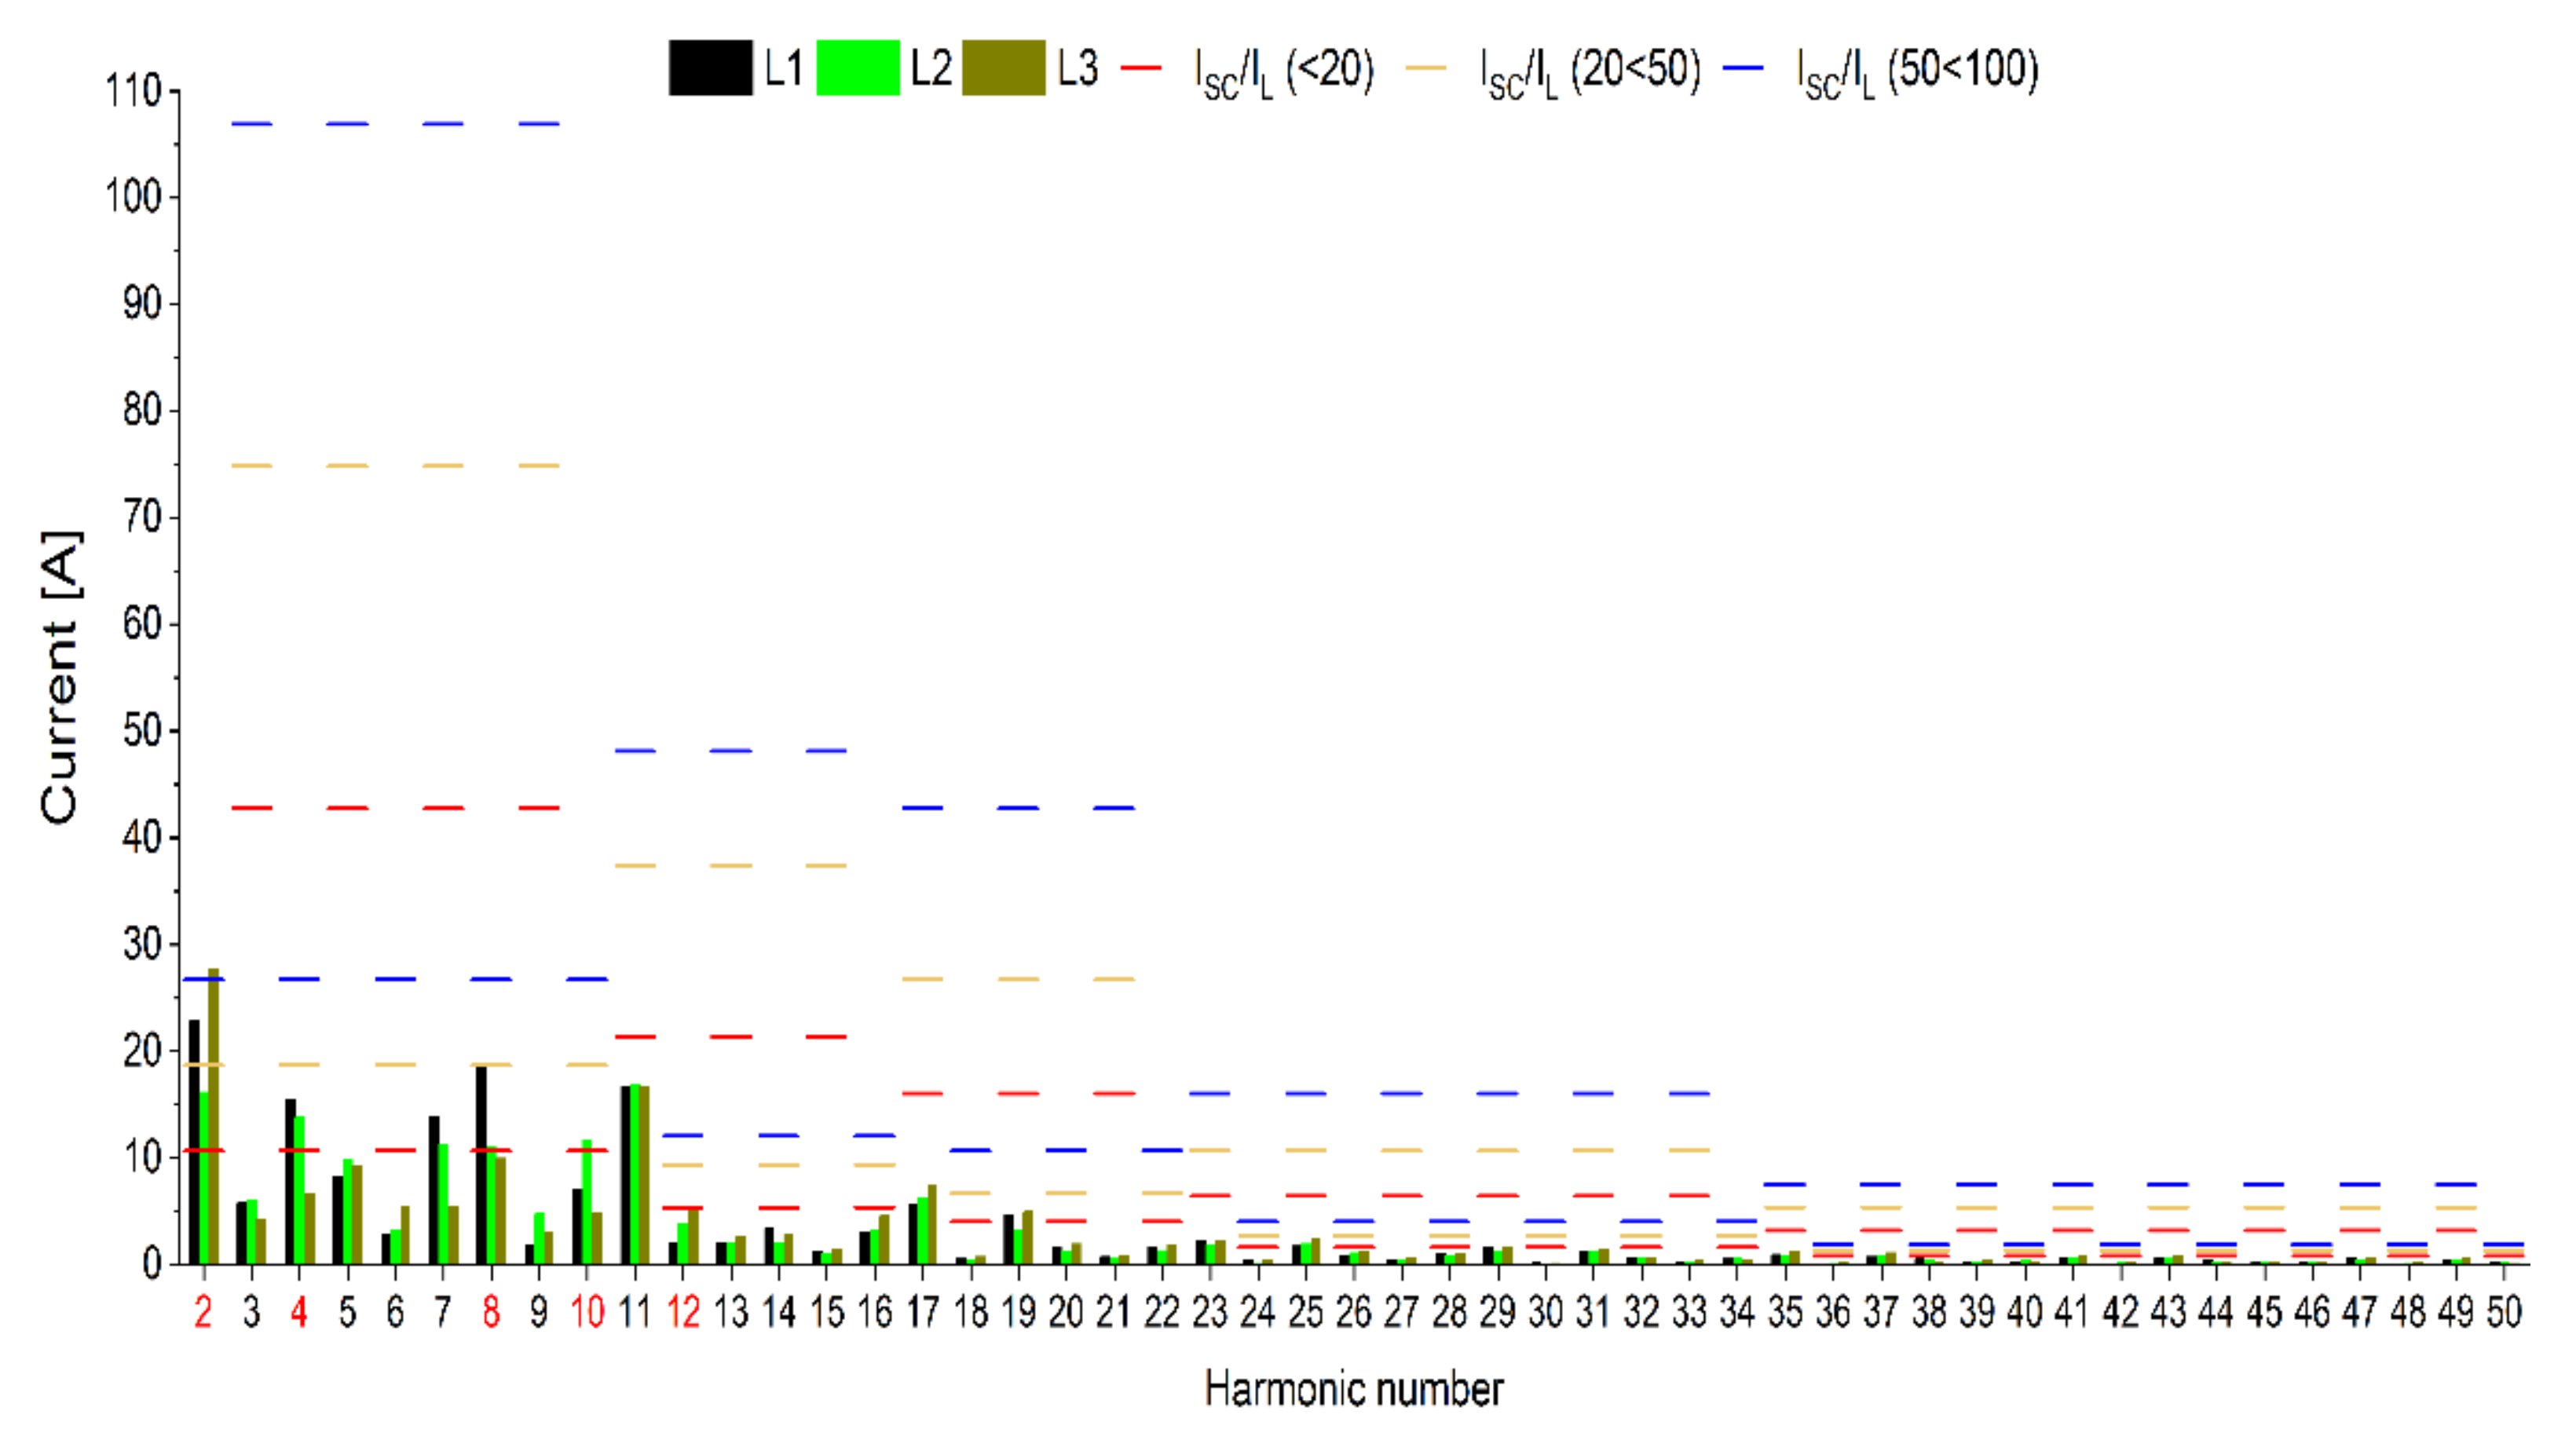
  • IEEE 519—contains recommendation for current distortion limits. It is not normative in Europe. The IEC 61851-21-2 standard [30] declares the use of national standards for current harmonic analysis for chargers with currents higher than 75 A (which is the case for fast and super-fast electric bus chargers); however, such a standard does not exist in Poland.
The following criteria were taken into account in analysis of the power quality parameters:
  • Frequency variation,
  • Voltage variation,
  • Voltage asymmetry,
  • Total harmonic distortion of voltage,
  • Short-term and long-term flicker severity,
  • Voltage and current harmonics.

3. Results and Discussion

The weekly total power demand profile (Figure 3) shows that a maximum of 10 chargers were used simultaneously on the first day of measurements. The fast chargers were mostly in operation after the rush hours. The highest number of devices using the chargers each day was noted after the morning rush hours. The number of buses being charged was not monitored.
Figure 4 shows the total active and reactive power demand profile during one charging cycle (from 22% to 100% state of charge) of a Solaris Urbino 12 electric bus. The momentary power drop was due to the attempt of electric bus driver to charge an additional bus with the same charger. Nevertheless, the charging of the second bus did not start due to an error in the charger′s software. The charging of the fist bus continued until being fully charged, which took approximately 1 h. Other electric buses were being charged at the bus depot during the measurement process.

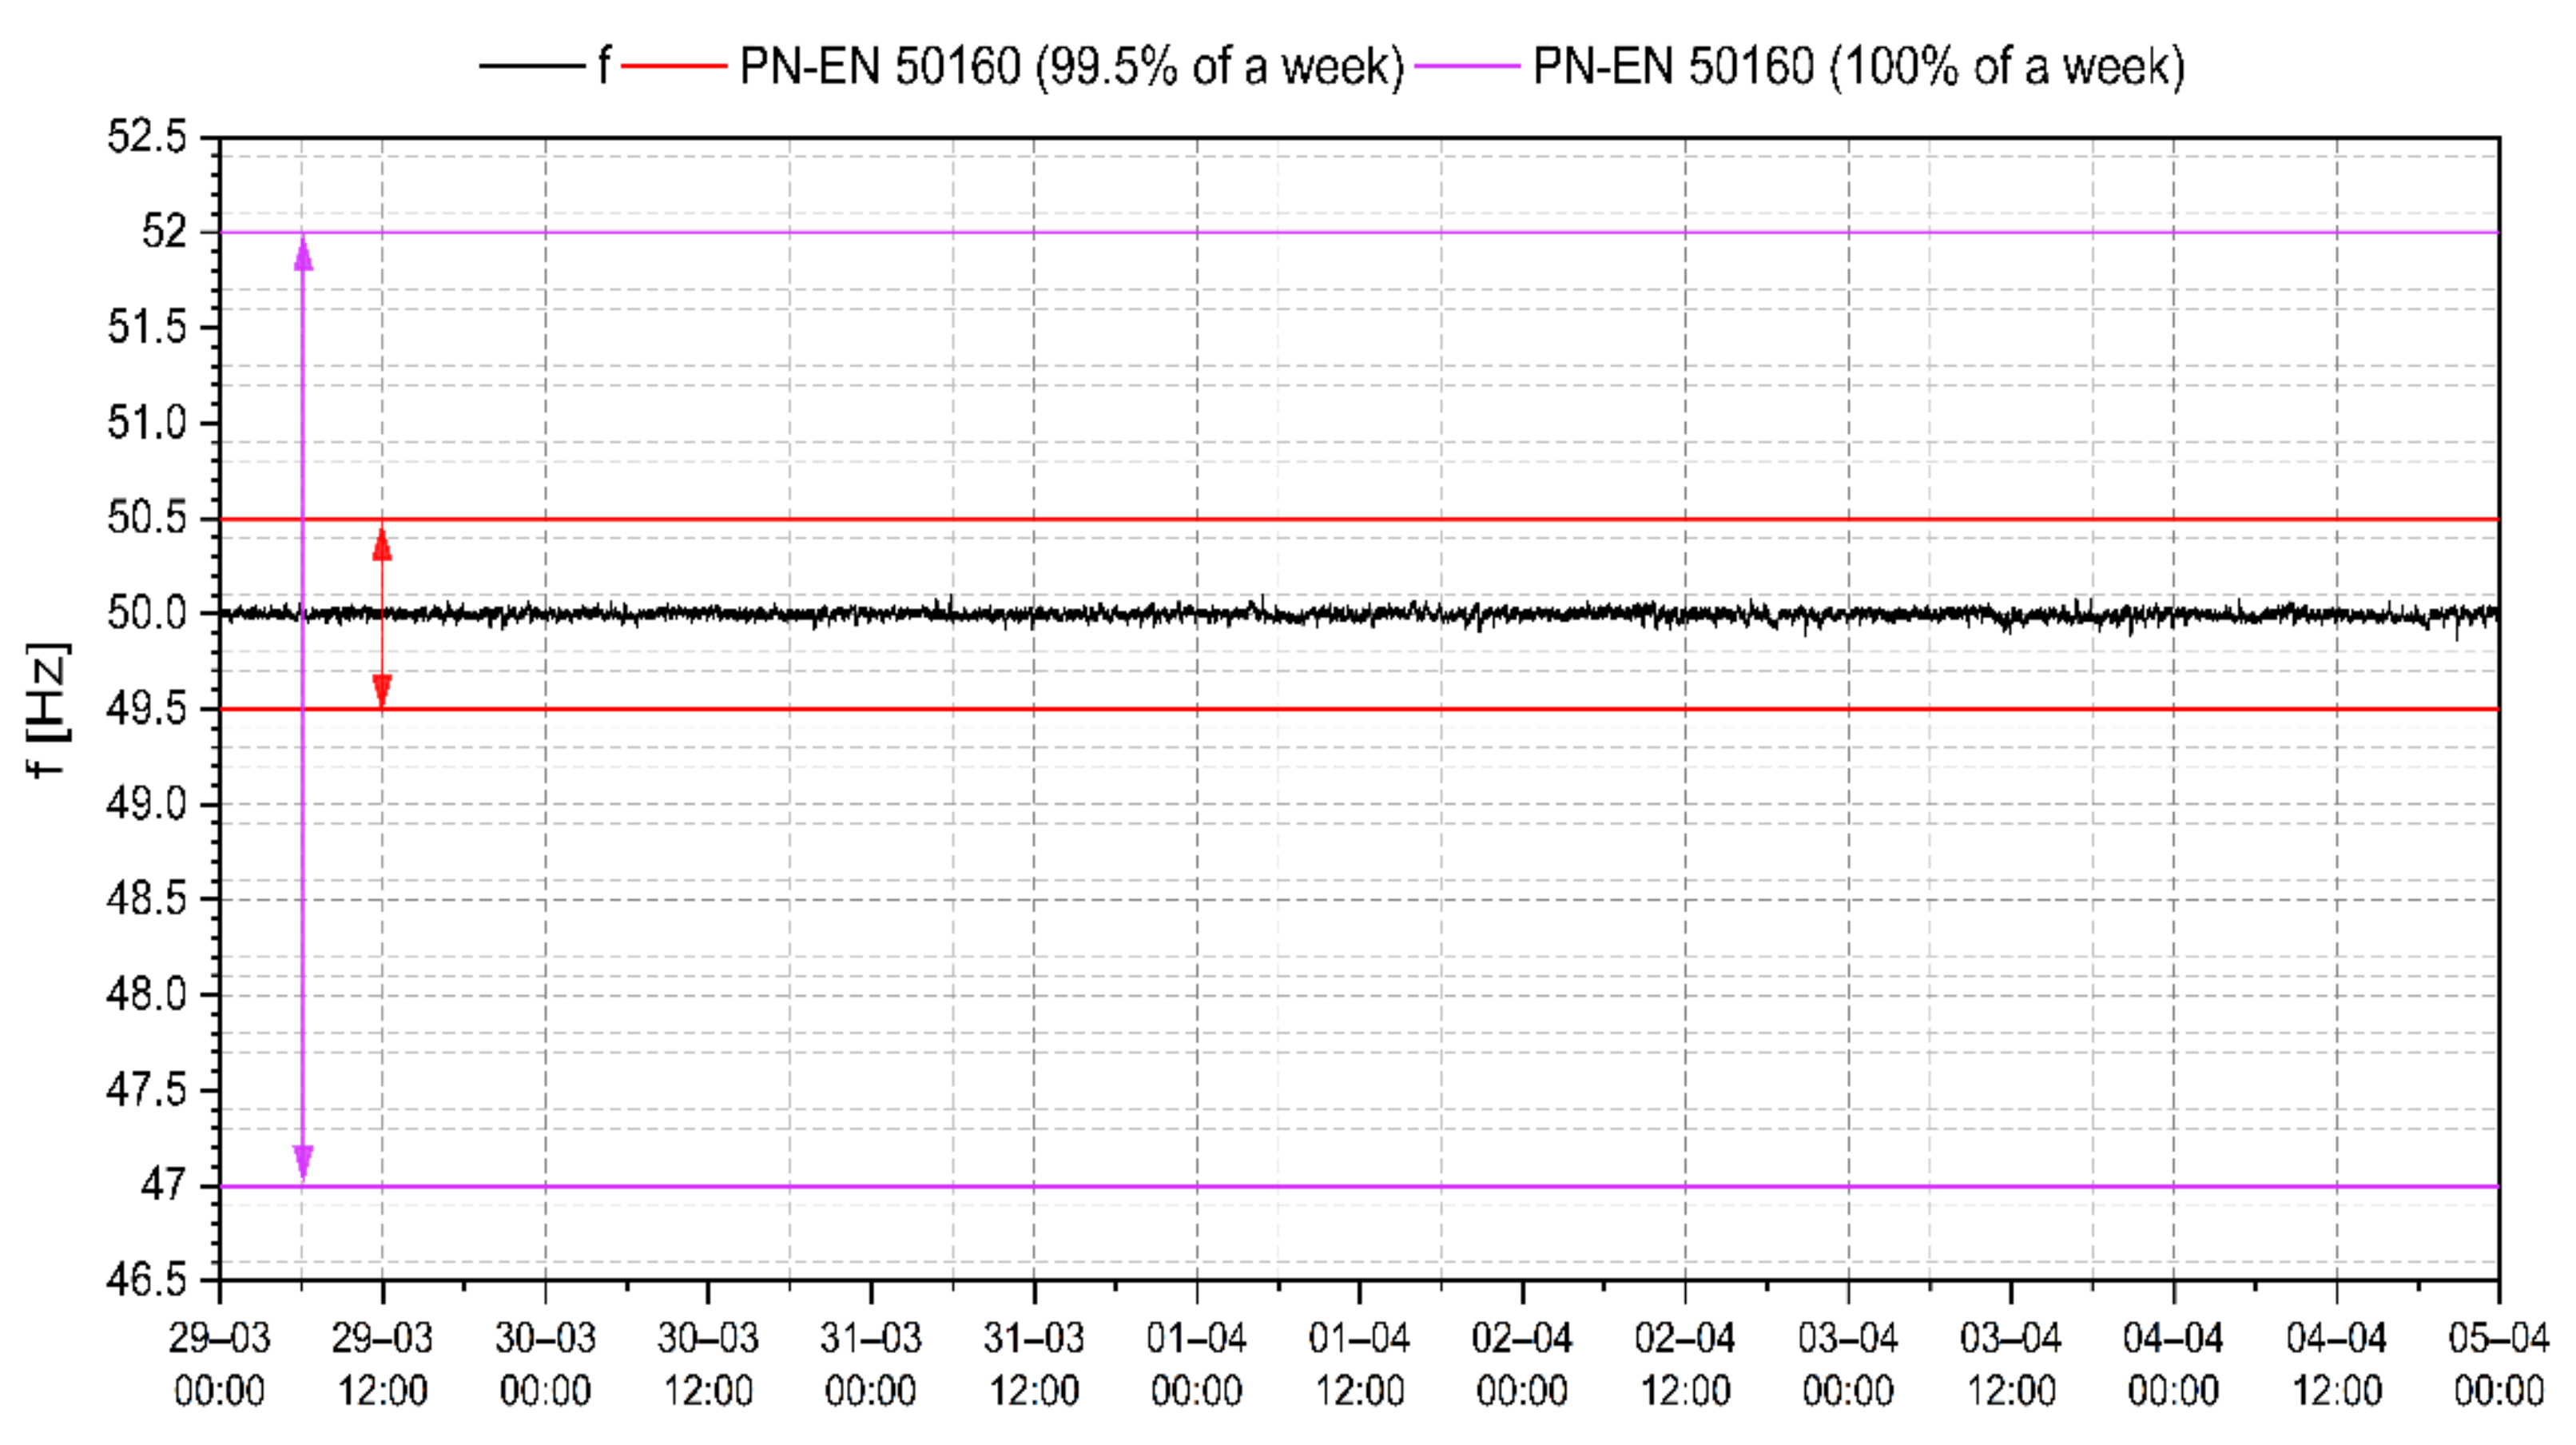
3.1. Power Frequency
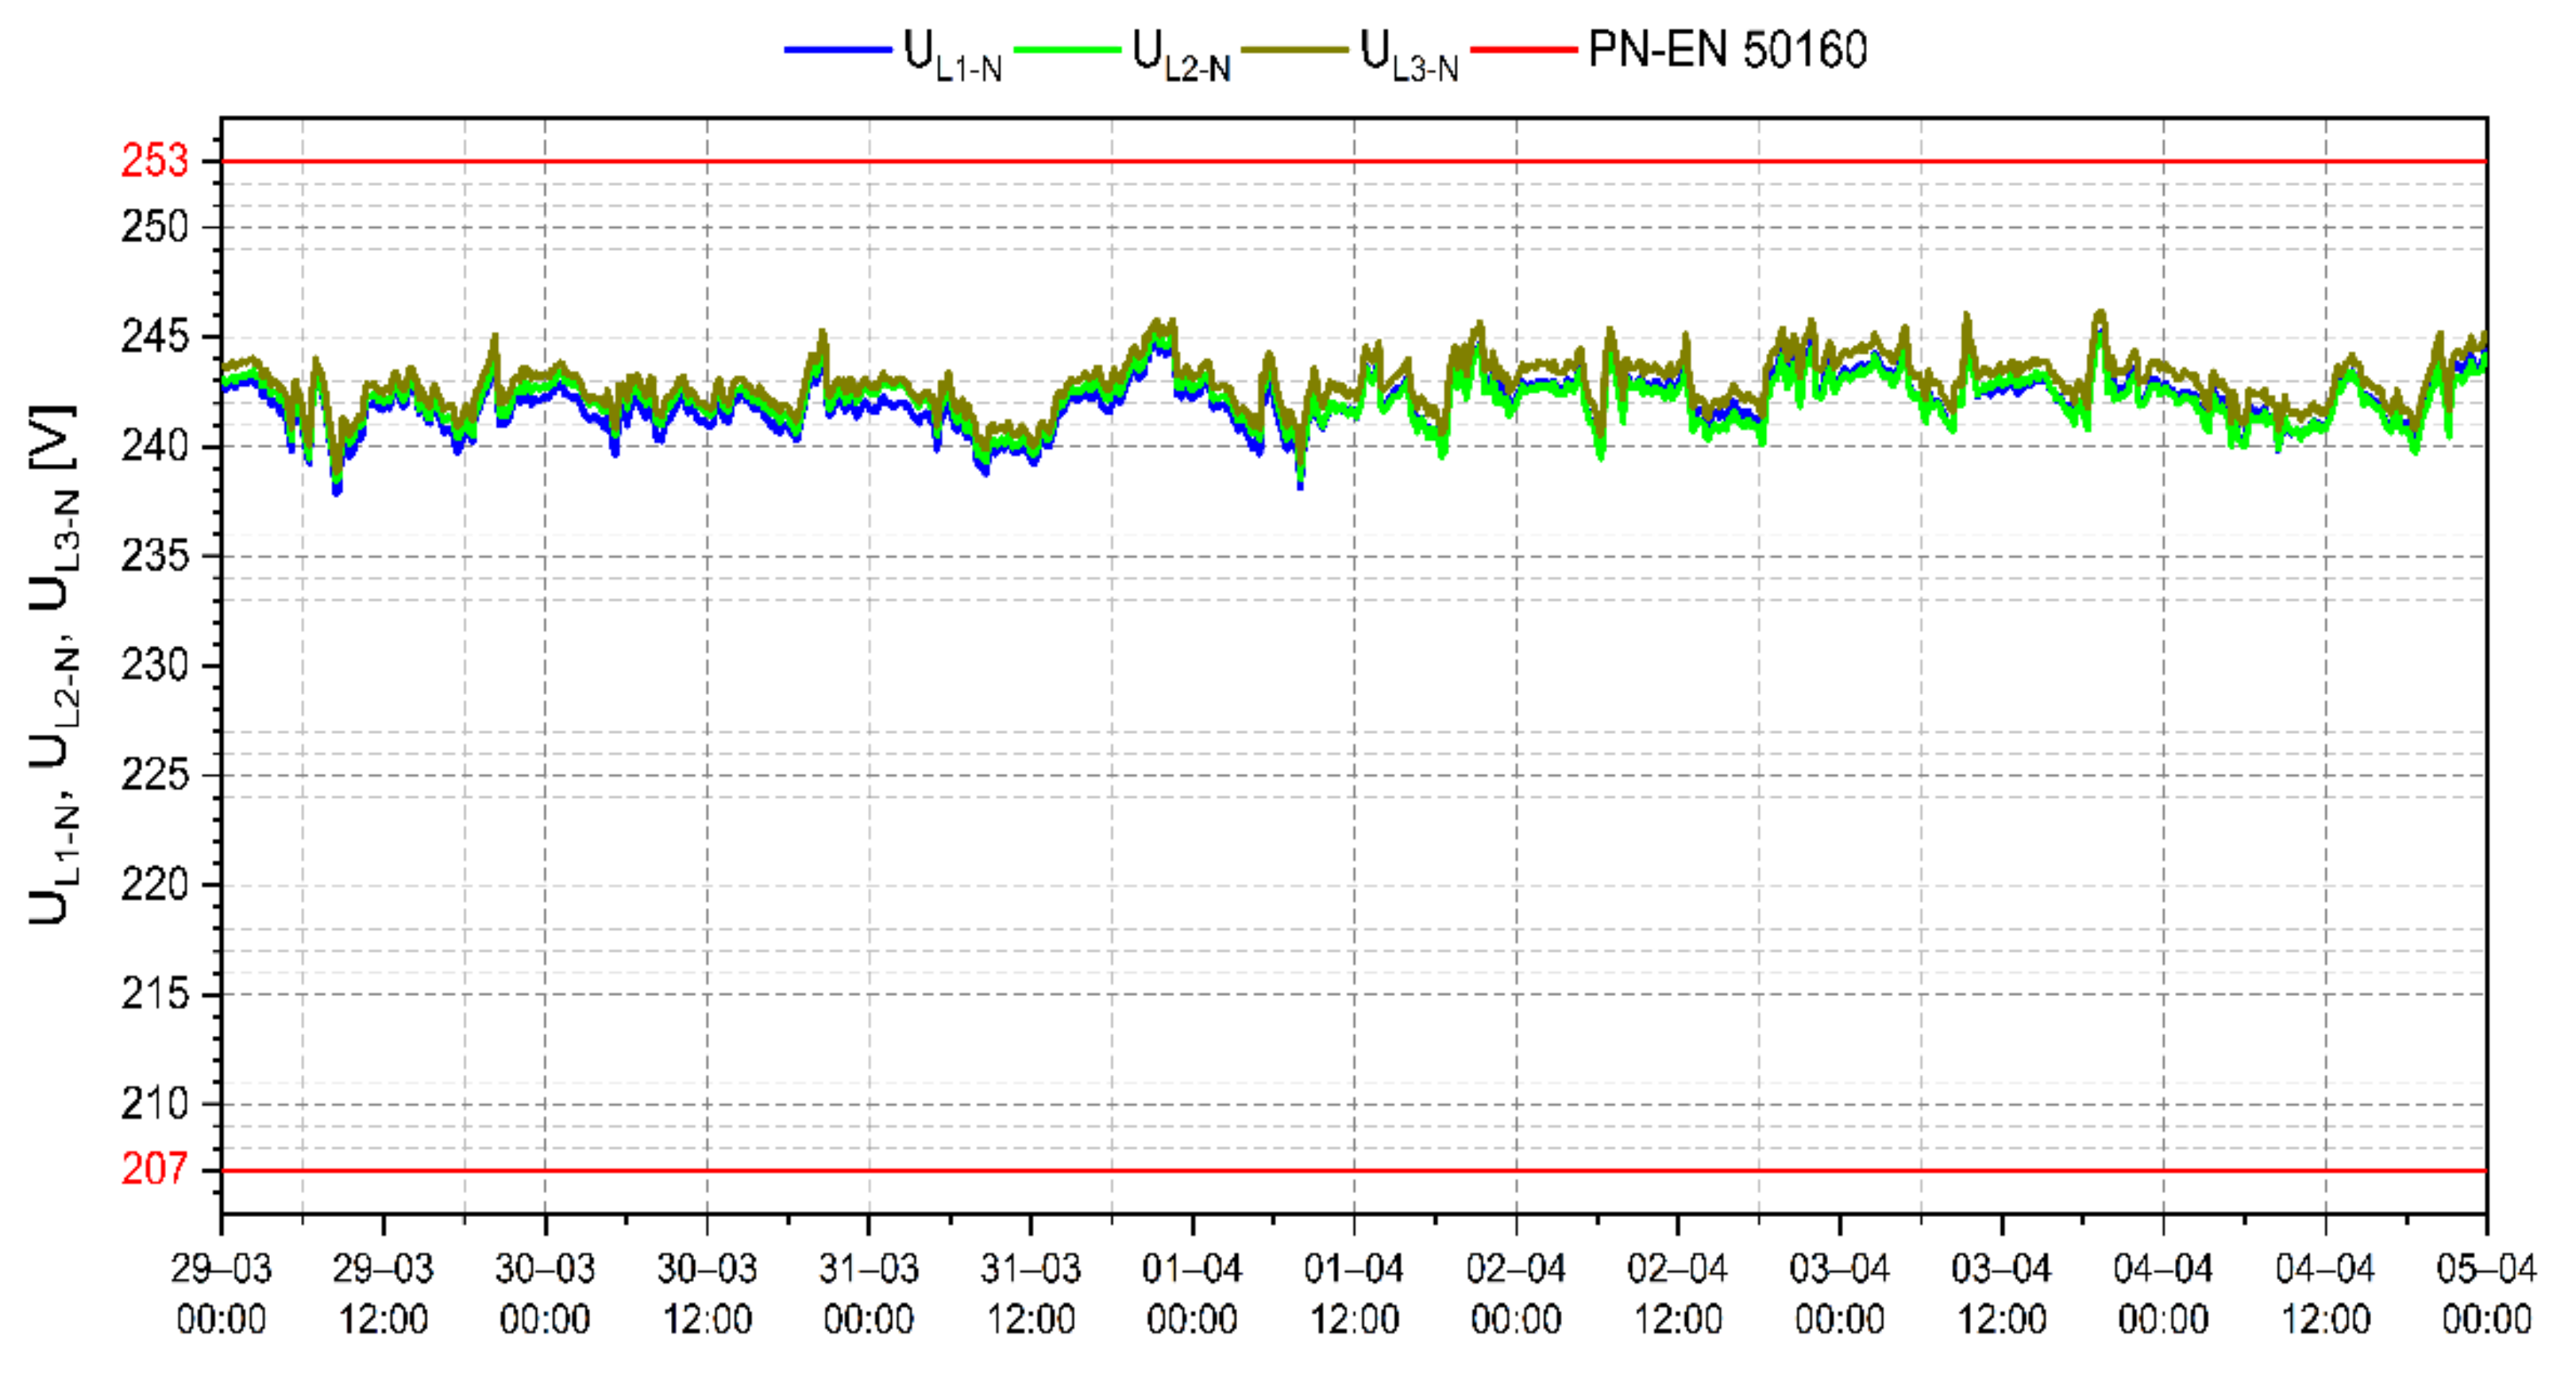
The values of the power frequency were aggregated every 450 cycles (approximately 9 s). The power frequency during the whole week remained within the PN-EN 50160:2010 limits. The 95th percentile of the mean value of the power frequency was 50.03 Hz. The mean value of the power frequency for the entire measurement period was 49.99 Hz. The maximum and minimum values of the average values dataset were 50.1 Hz and 49.86 Hz, respectively. Figure 5 presents power frequency variation during the measurement week.
The power frequency recorded during the charging process of the electric bus also did not exceed the limits of PN-EN 50160:2010. The mean value of the power frequency was 50 Hz and the 95th percentile of the mean value was 50.02 Hz.

3.2. Phase Voltage

The 95th percentiles of the approximately 10 min mean RMS values of the phase voltages were 244 V, 243.82 V, and 244.8 V for the first, second, and third phase, respectively. These values were closer to the upper limit (253 V); nevertheless, they are compliant with the PN-EN 50160:2010 standard. The values of phase voltages during one charging process were also within the limits. The mean values were 240.4 V, 241.05 V, and 241.32 V for the first, second, and third phase, respectively. Detailed results of phase voltages for the one-week measurement period are shown in Table 1. Figure 6 presents RMS phase voltage variation during the measurement week.

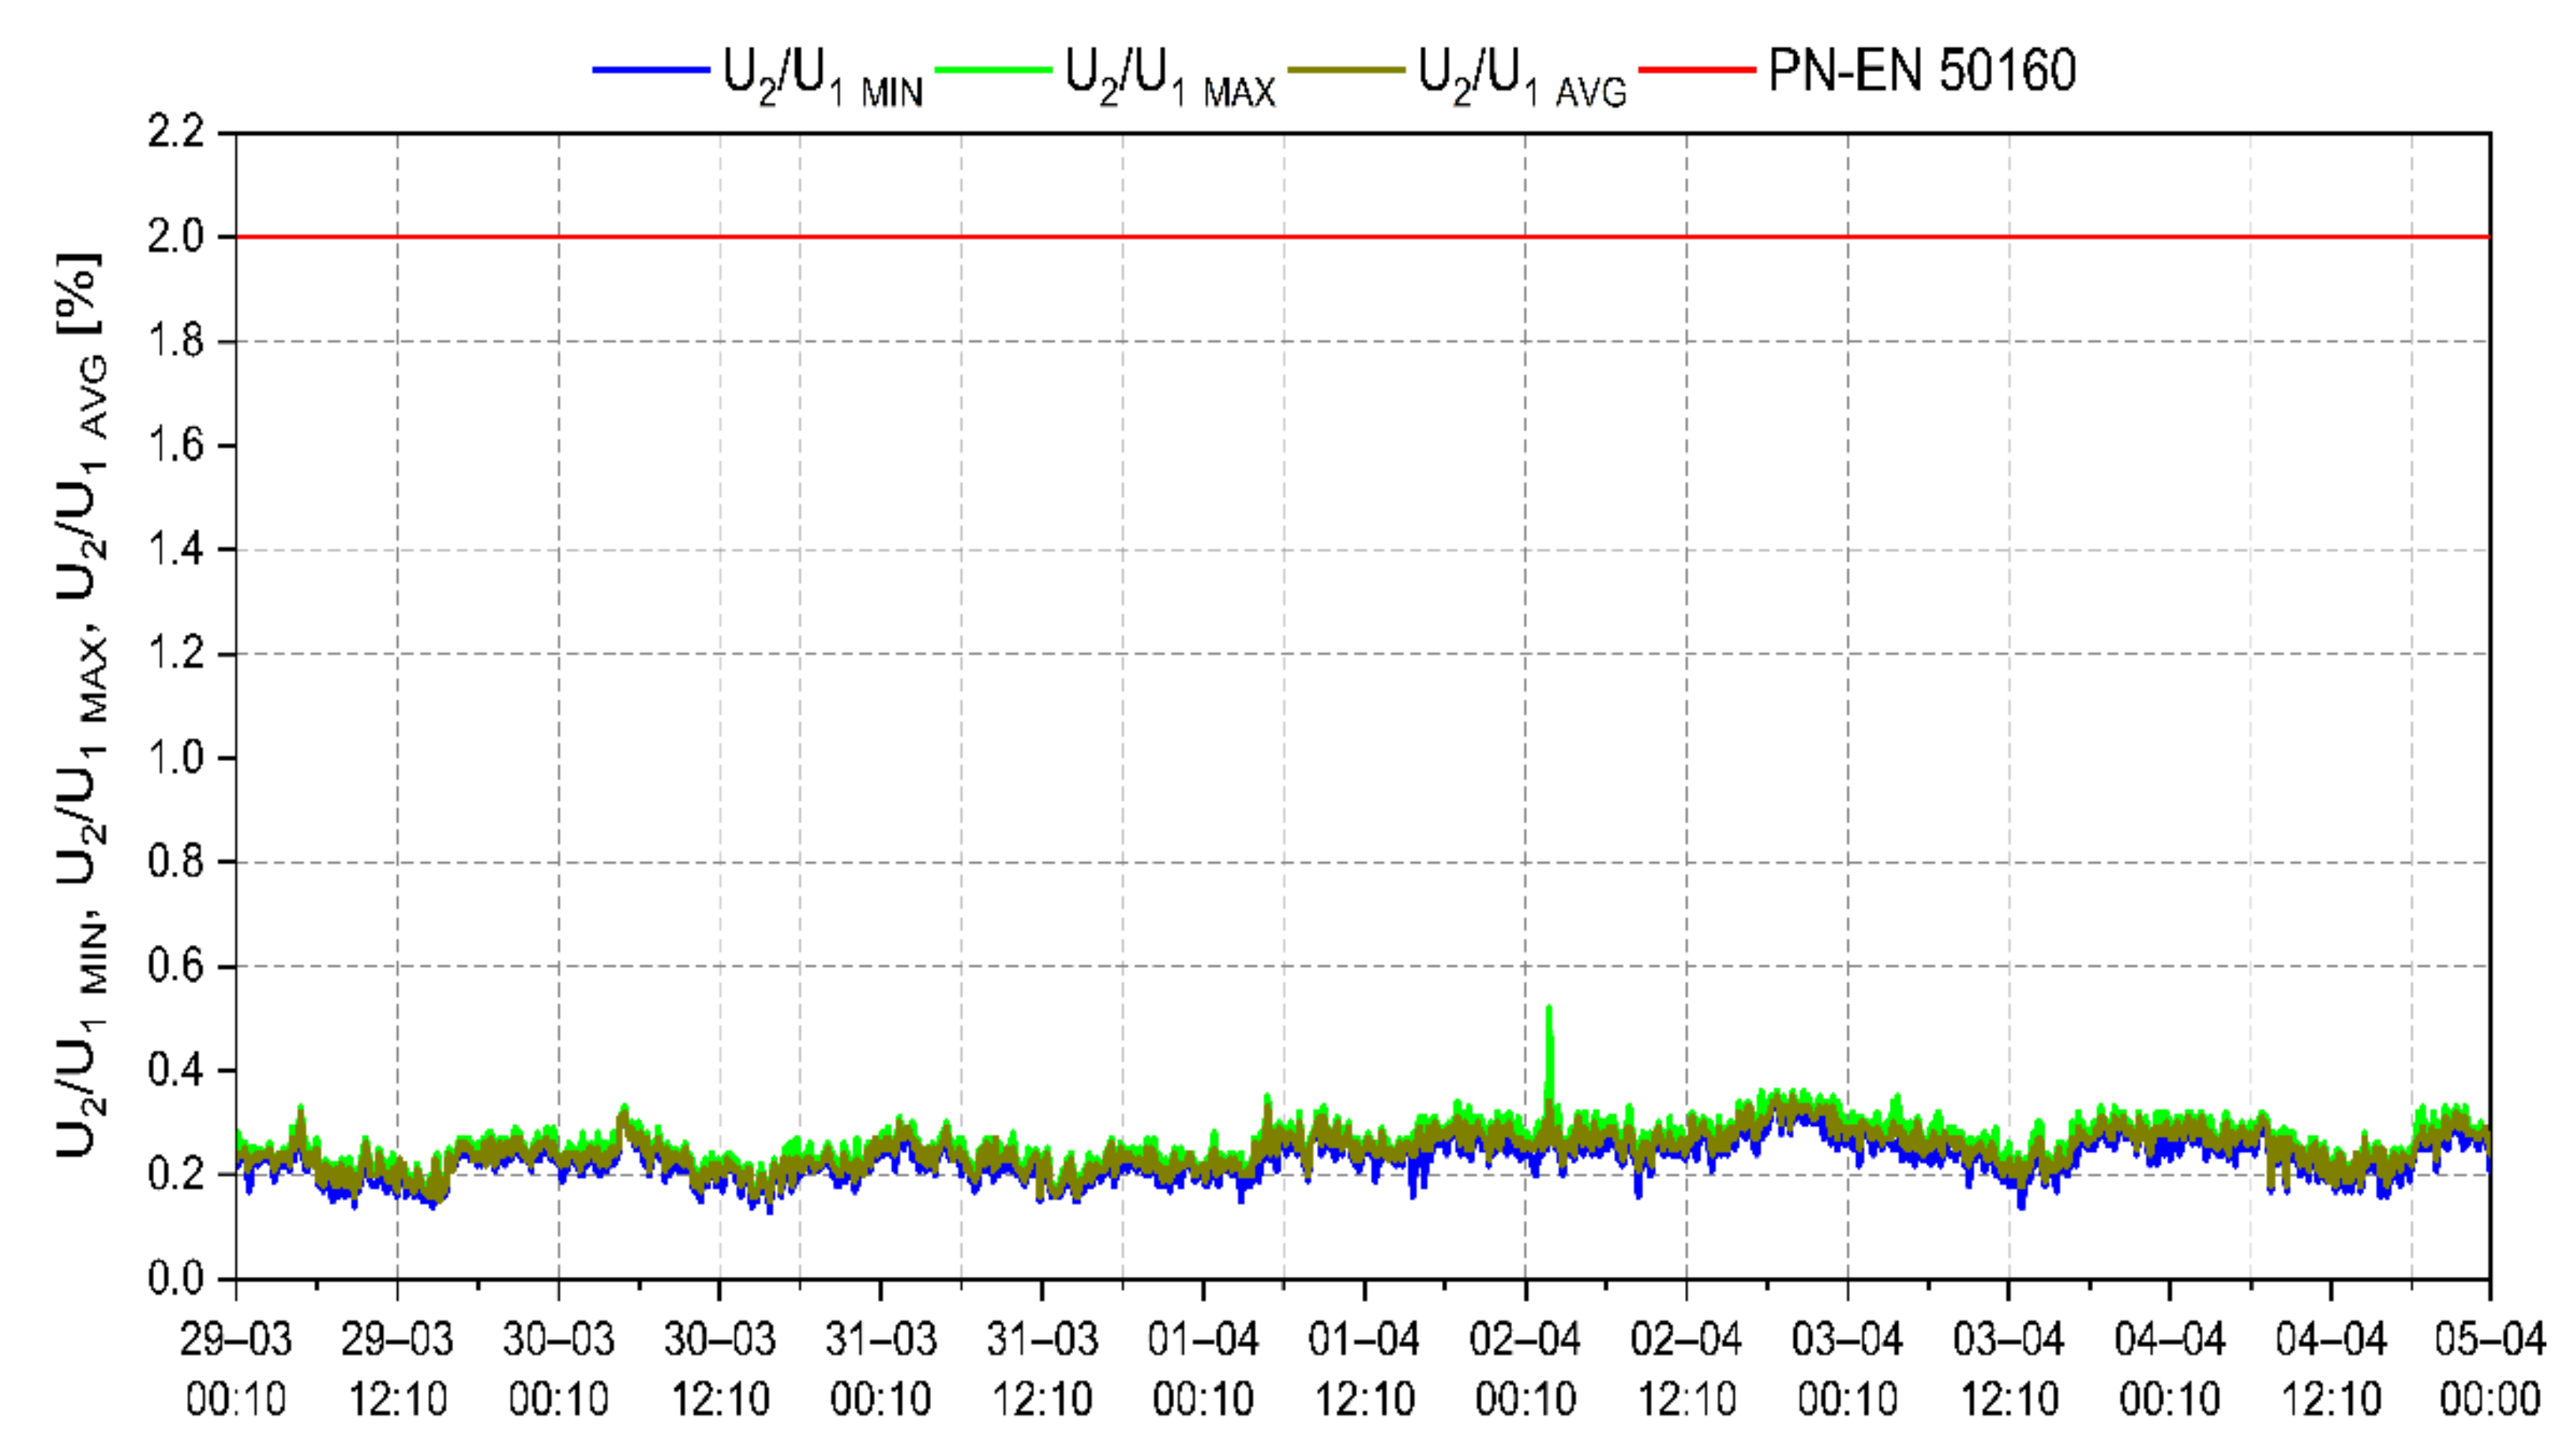
3.3. Voltage Asymmetry

The 95th percentiles of the approximately 10 min mean, maximum, and minimum values of the voltage imbalance factor were 0.31%, 0.32%, and 0.29%, respectively. The mean value of the phase imbalance factor measured during one charging process was slightly lower (0.22%). This means that the results are compliant with the limit set in the PN-EN 50160:2010 (2% for 95% of the week). Figure 7 presents the weekly variation of the voltage imbalance factor.

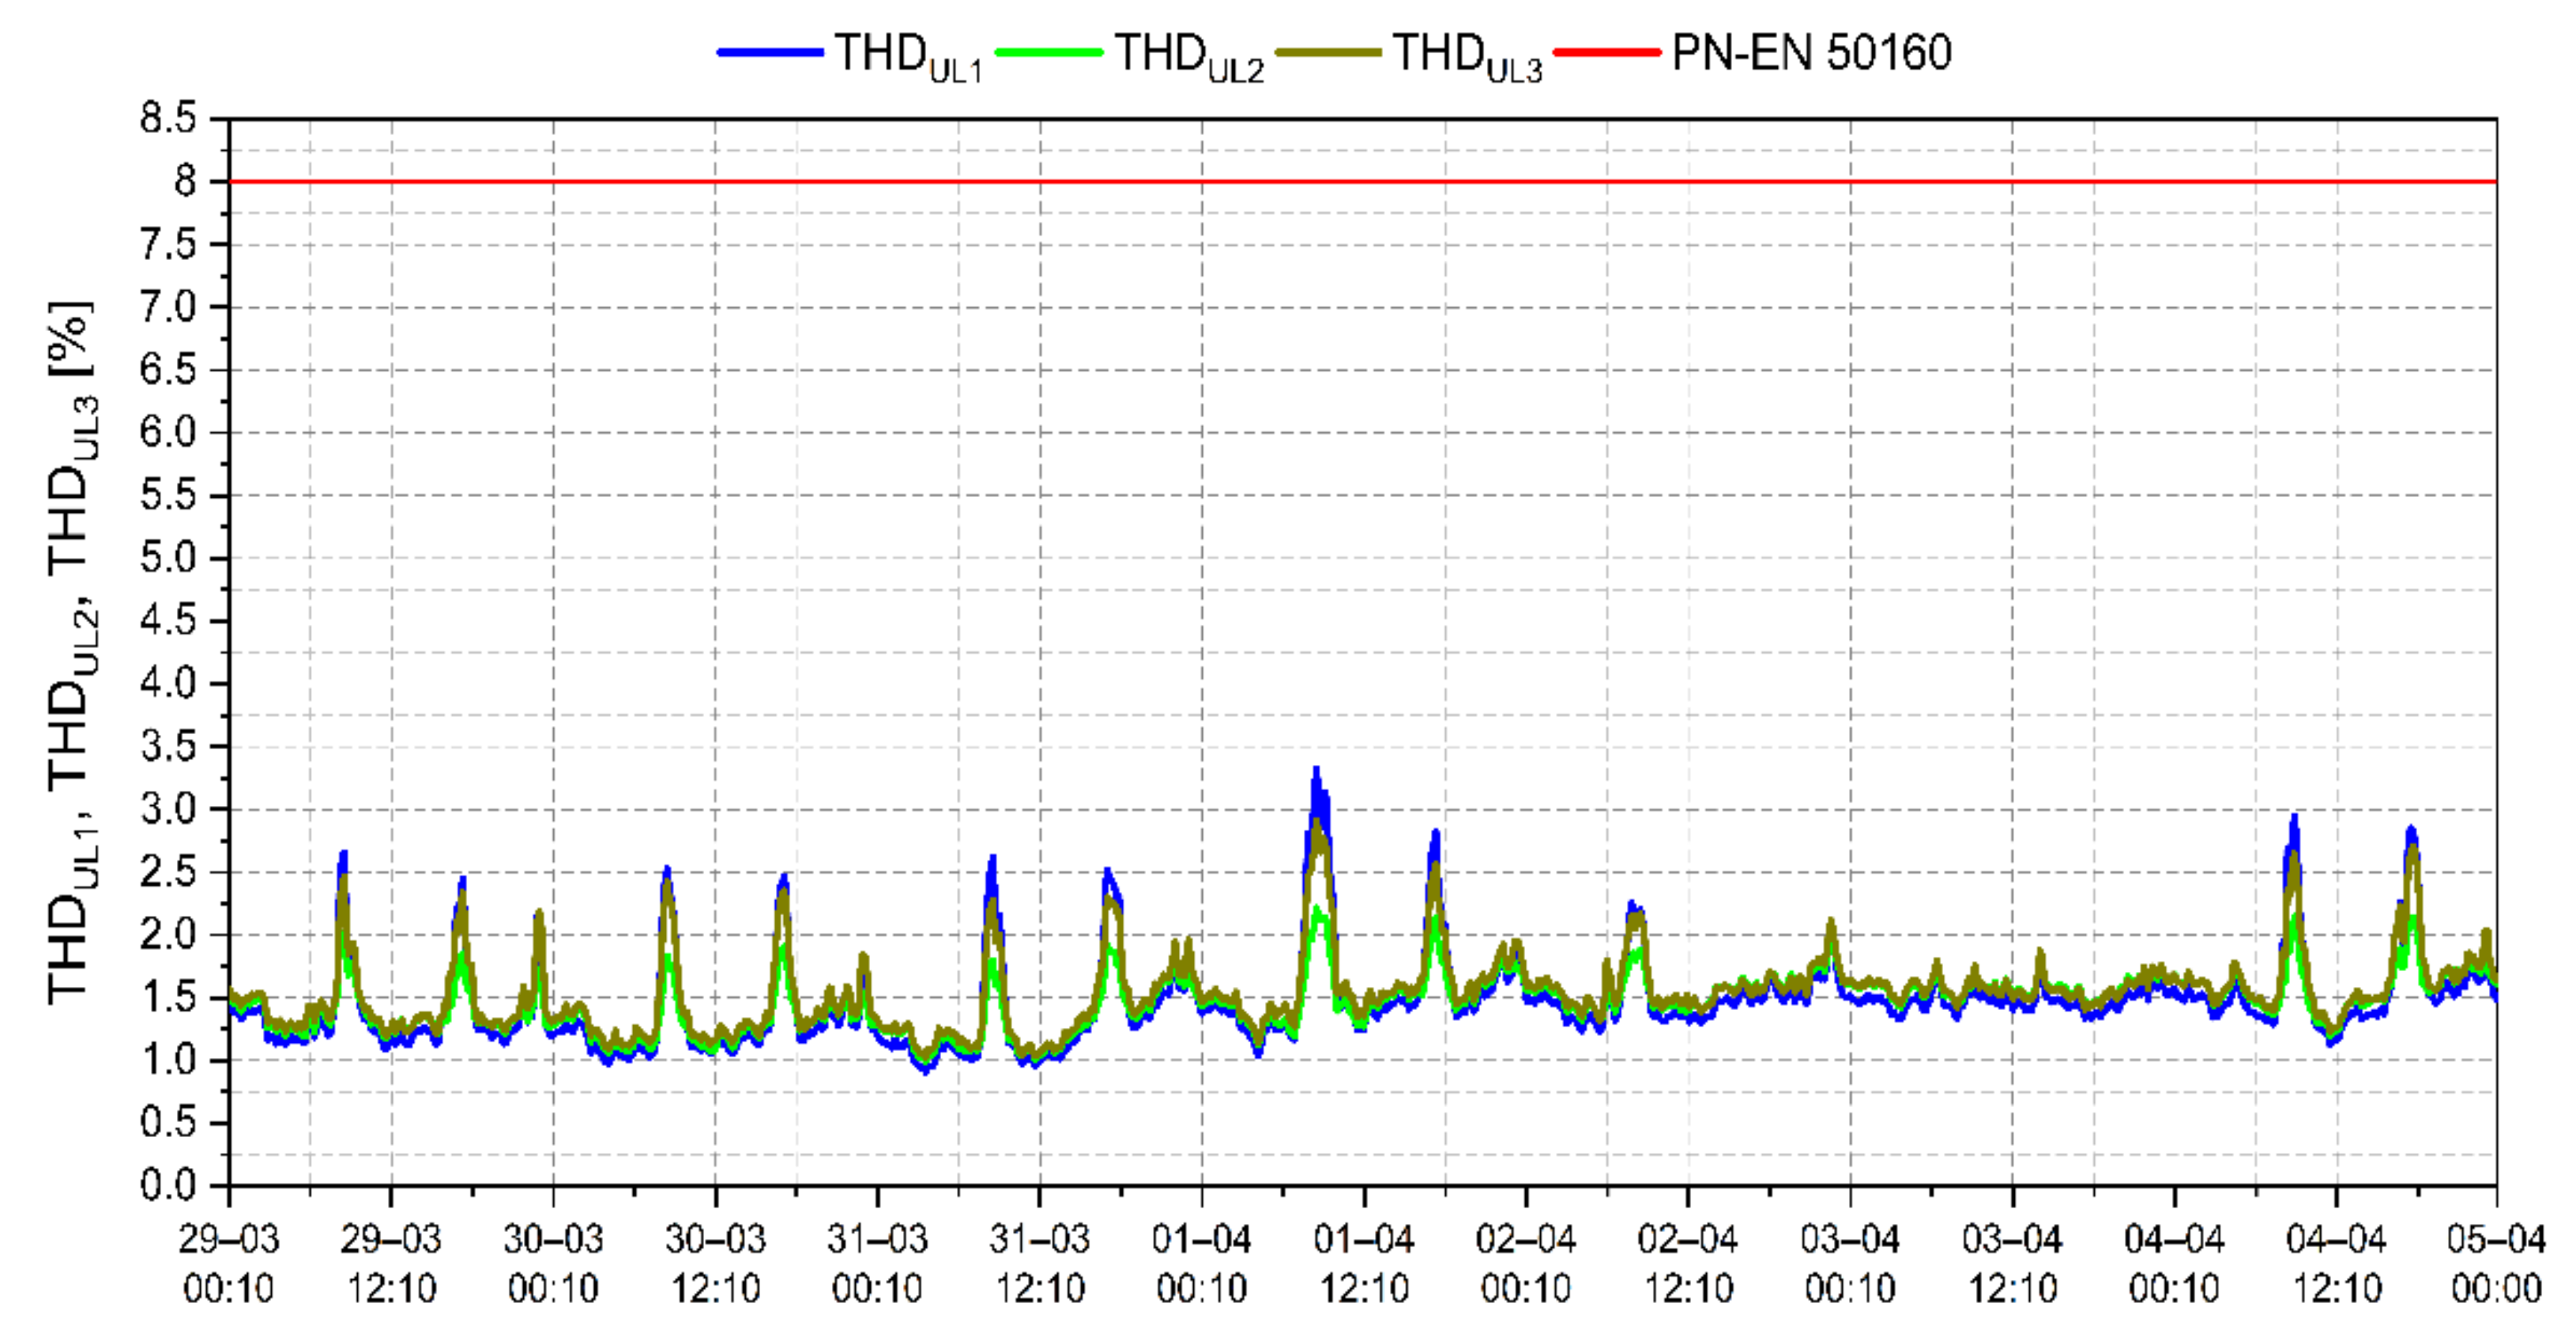
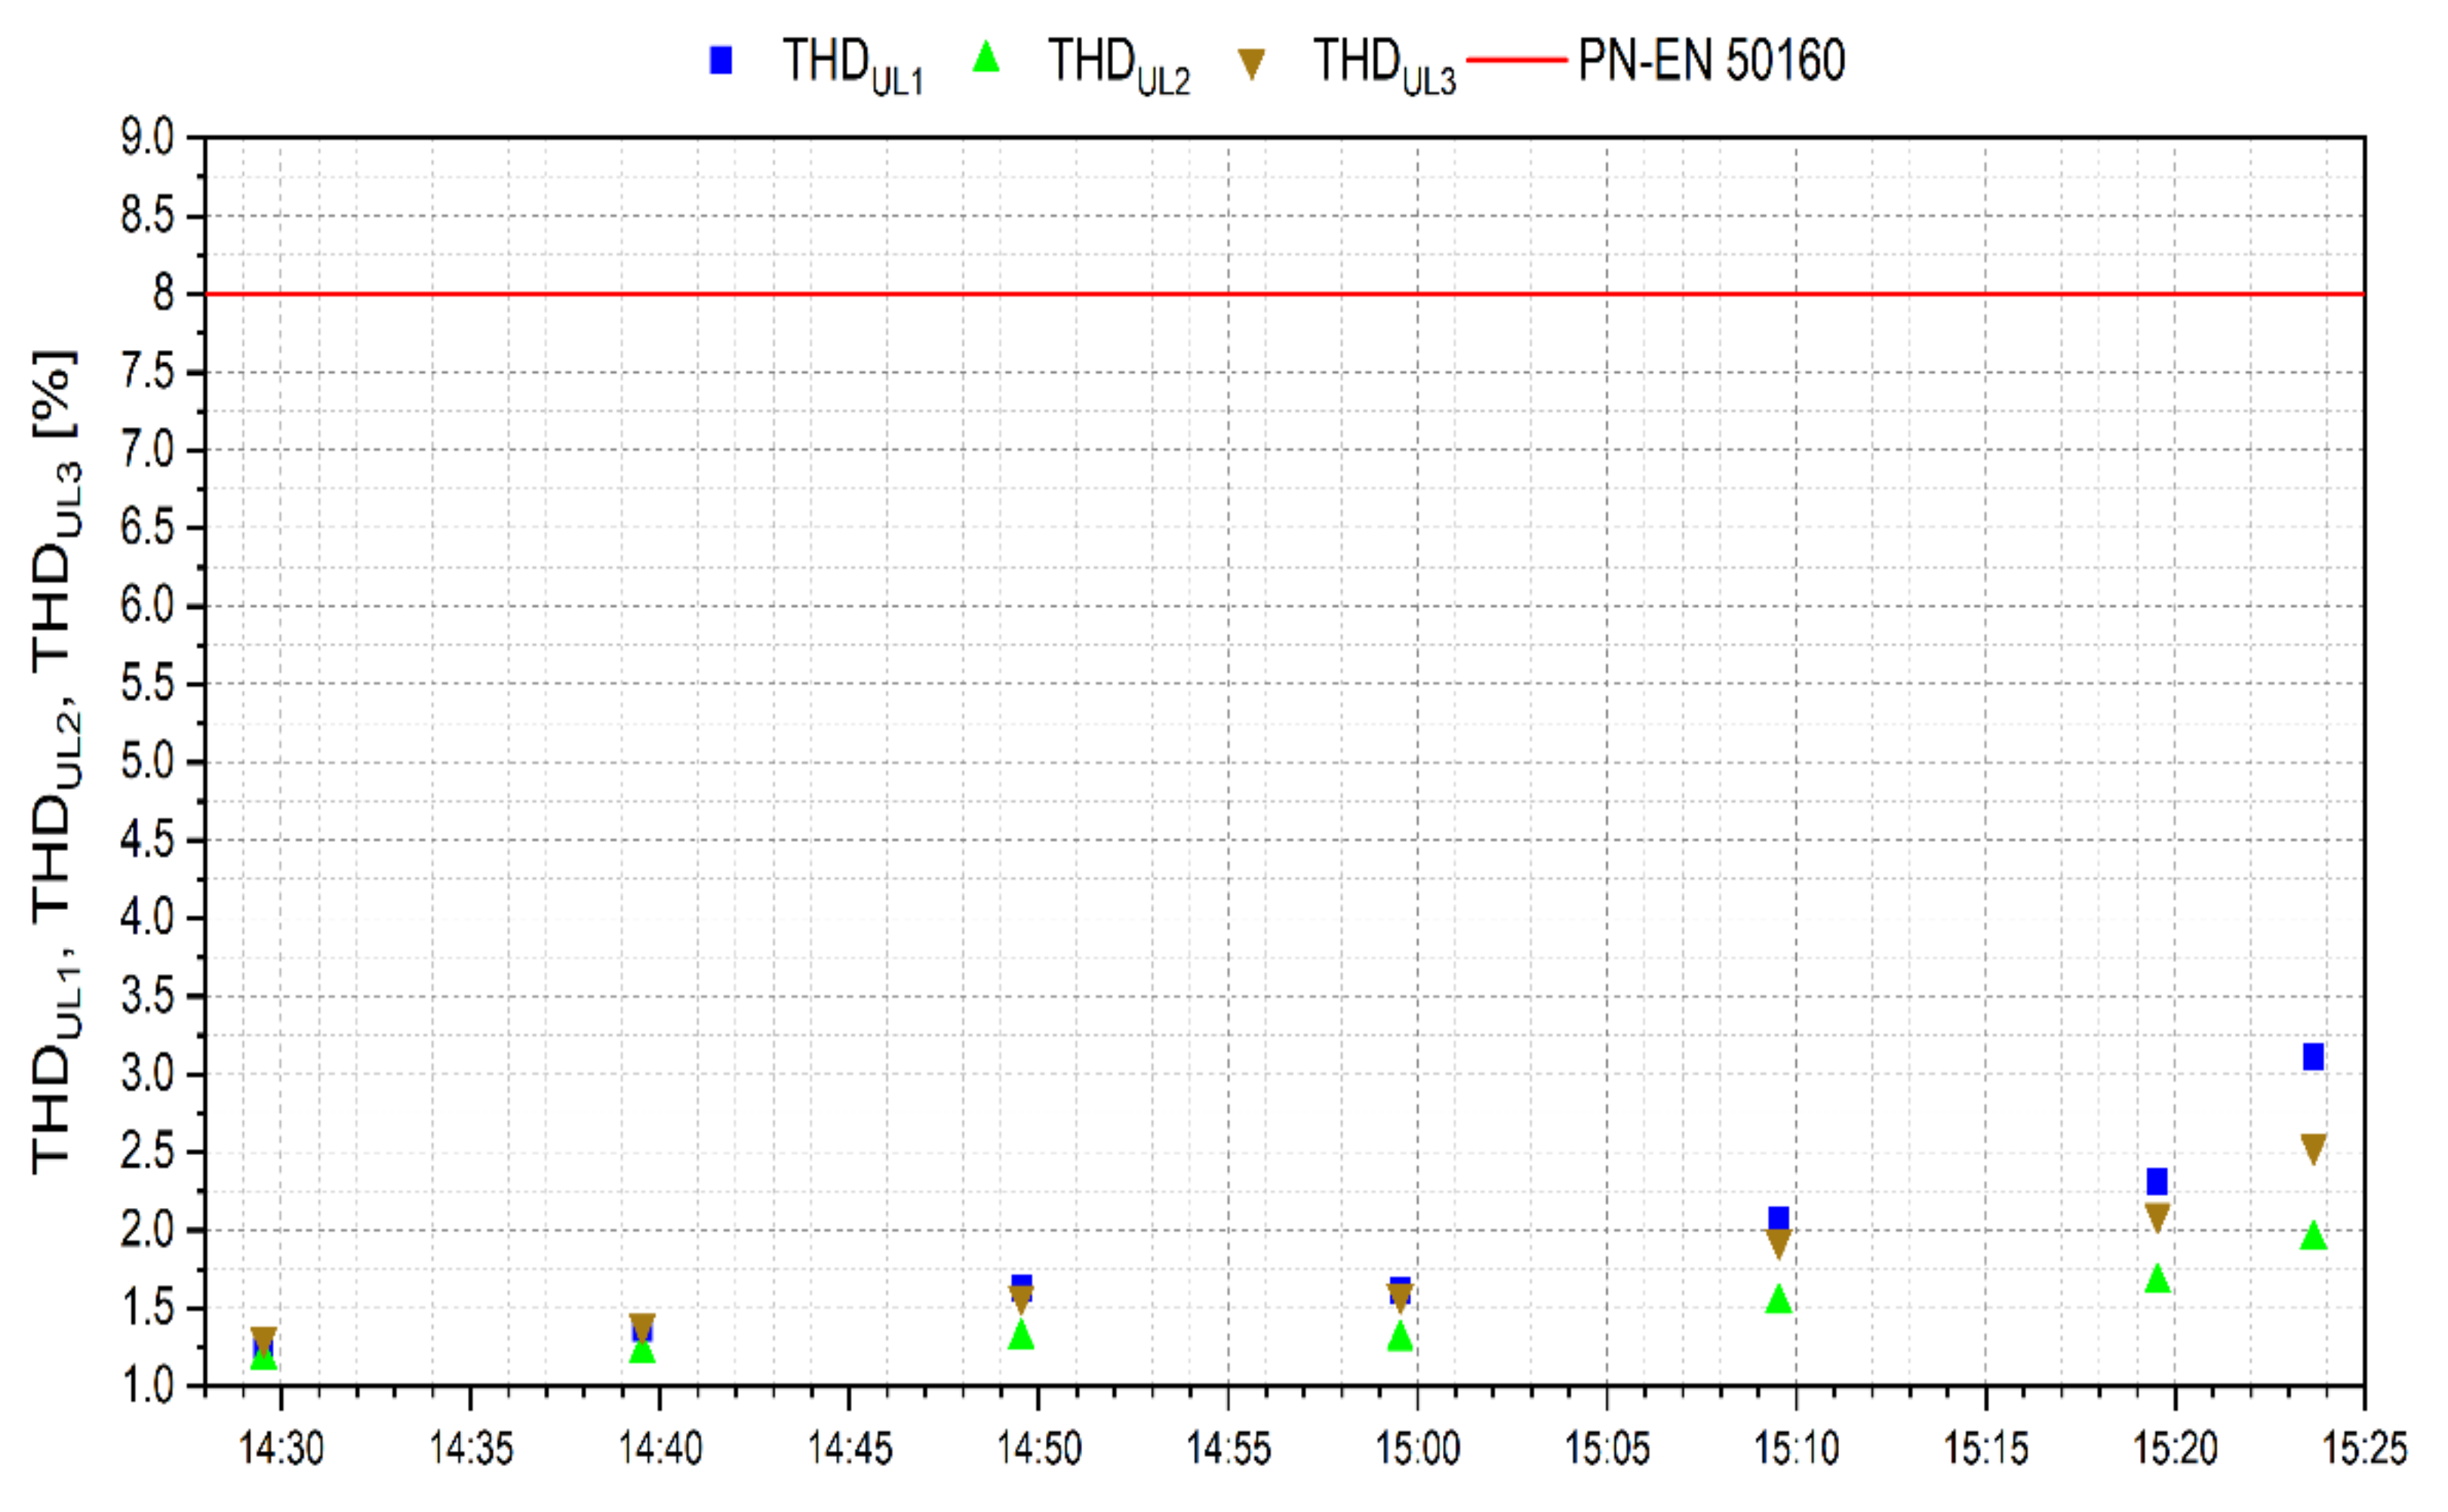
3.4. Total Harmonic Distortion of Voltage

The 95th percentiles of approximately 10 min mean values of the total harmonic distortion of voltage (THDU) were 2.27%, 1.84%, and 2.18% for the first, second, and third phase, respectively, which means they are compliant with the PN-EN 50160:2010 standard (THDU ≤ 8% for 95% of the week). The peaks of THDU occurred when most chargers were in use. The value of THDU during one charging process was increasing due to the increasing number of other electric buses being charged. Figure 8 and Figure 9 show the THDU variation during the one-week measurement period and one charging process, respectively.

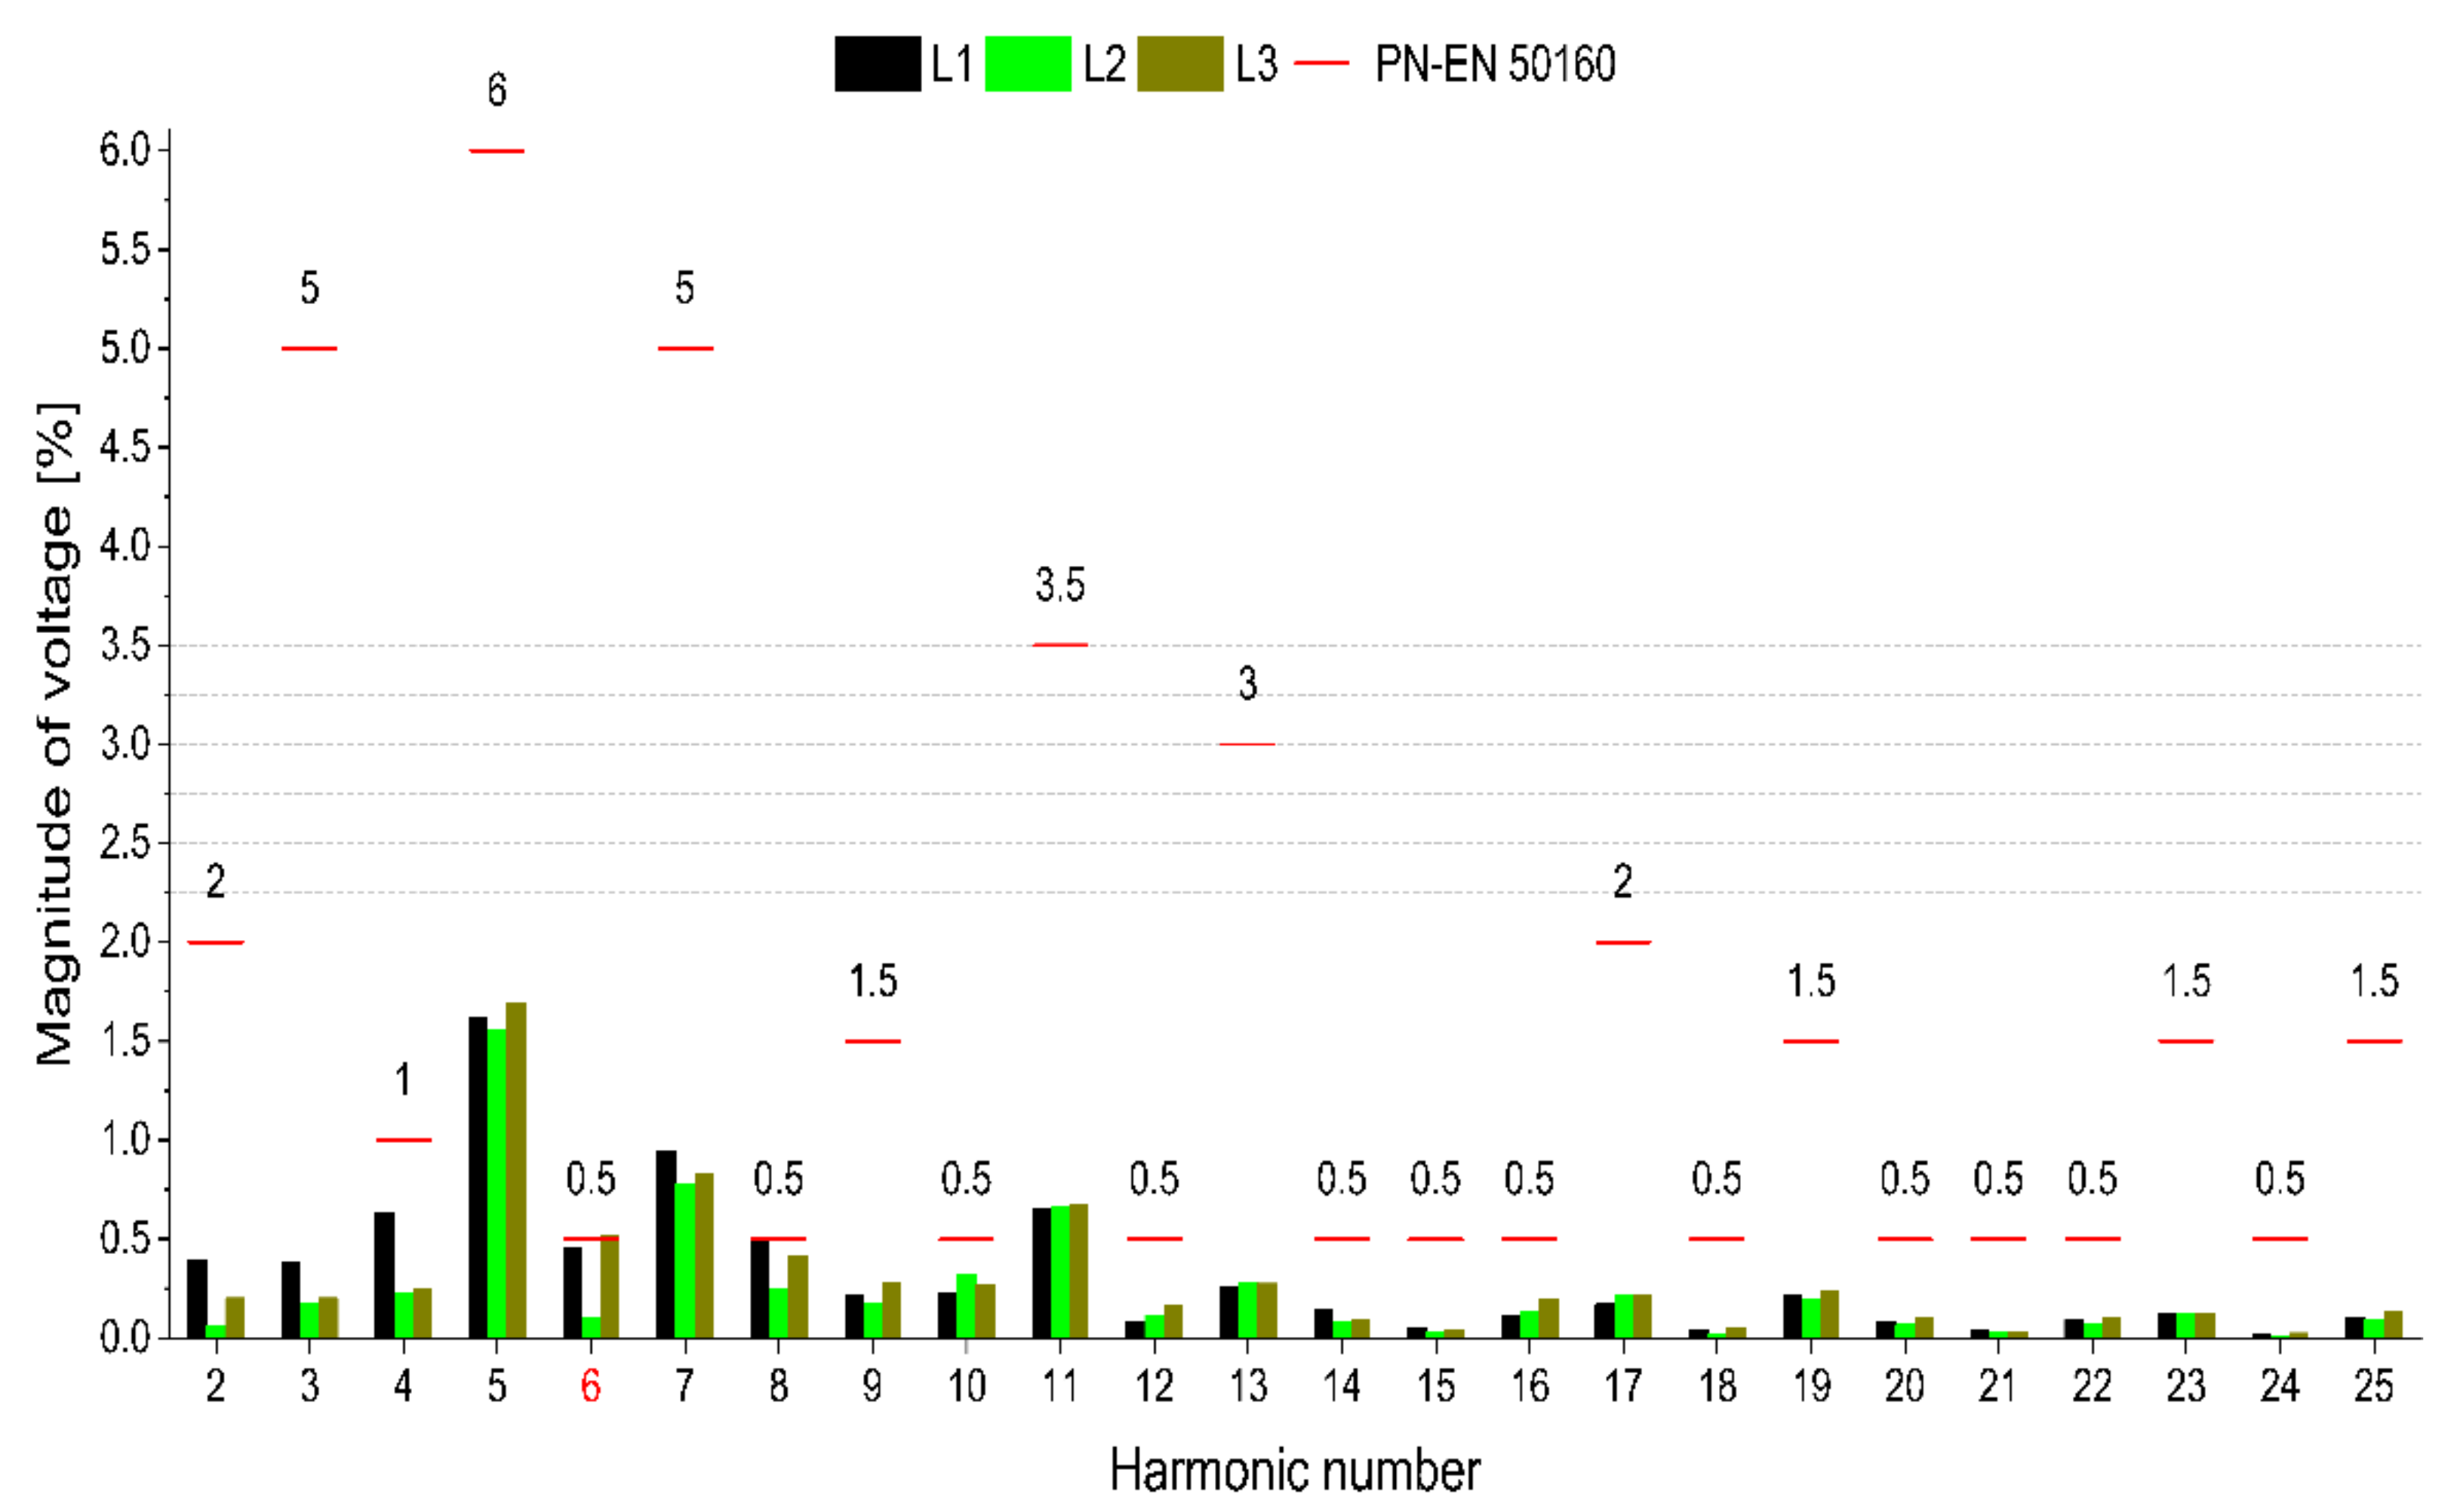
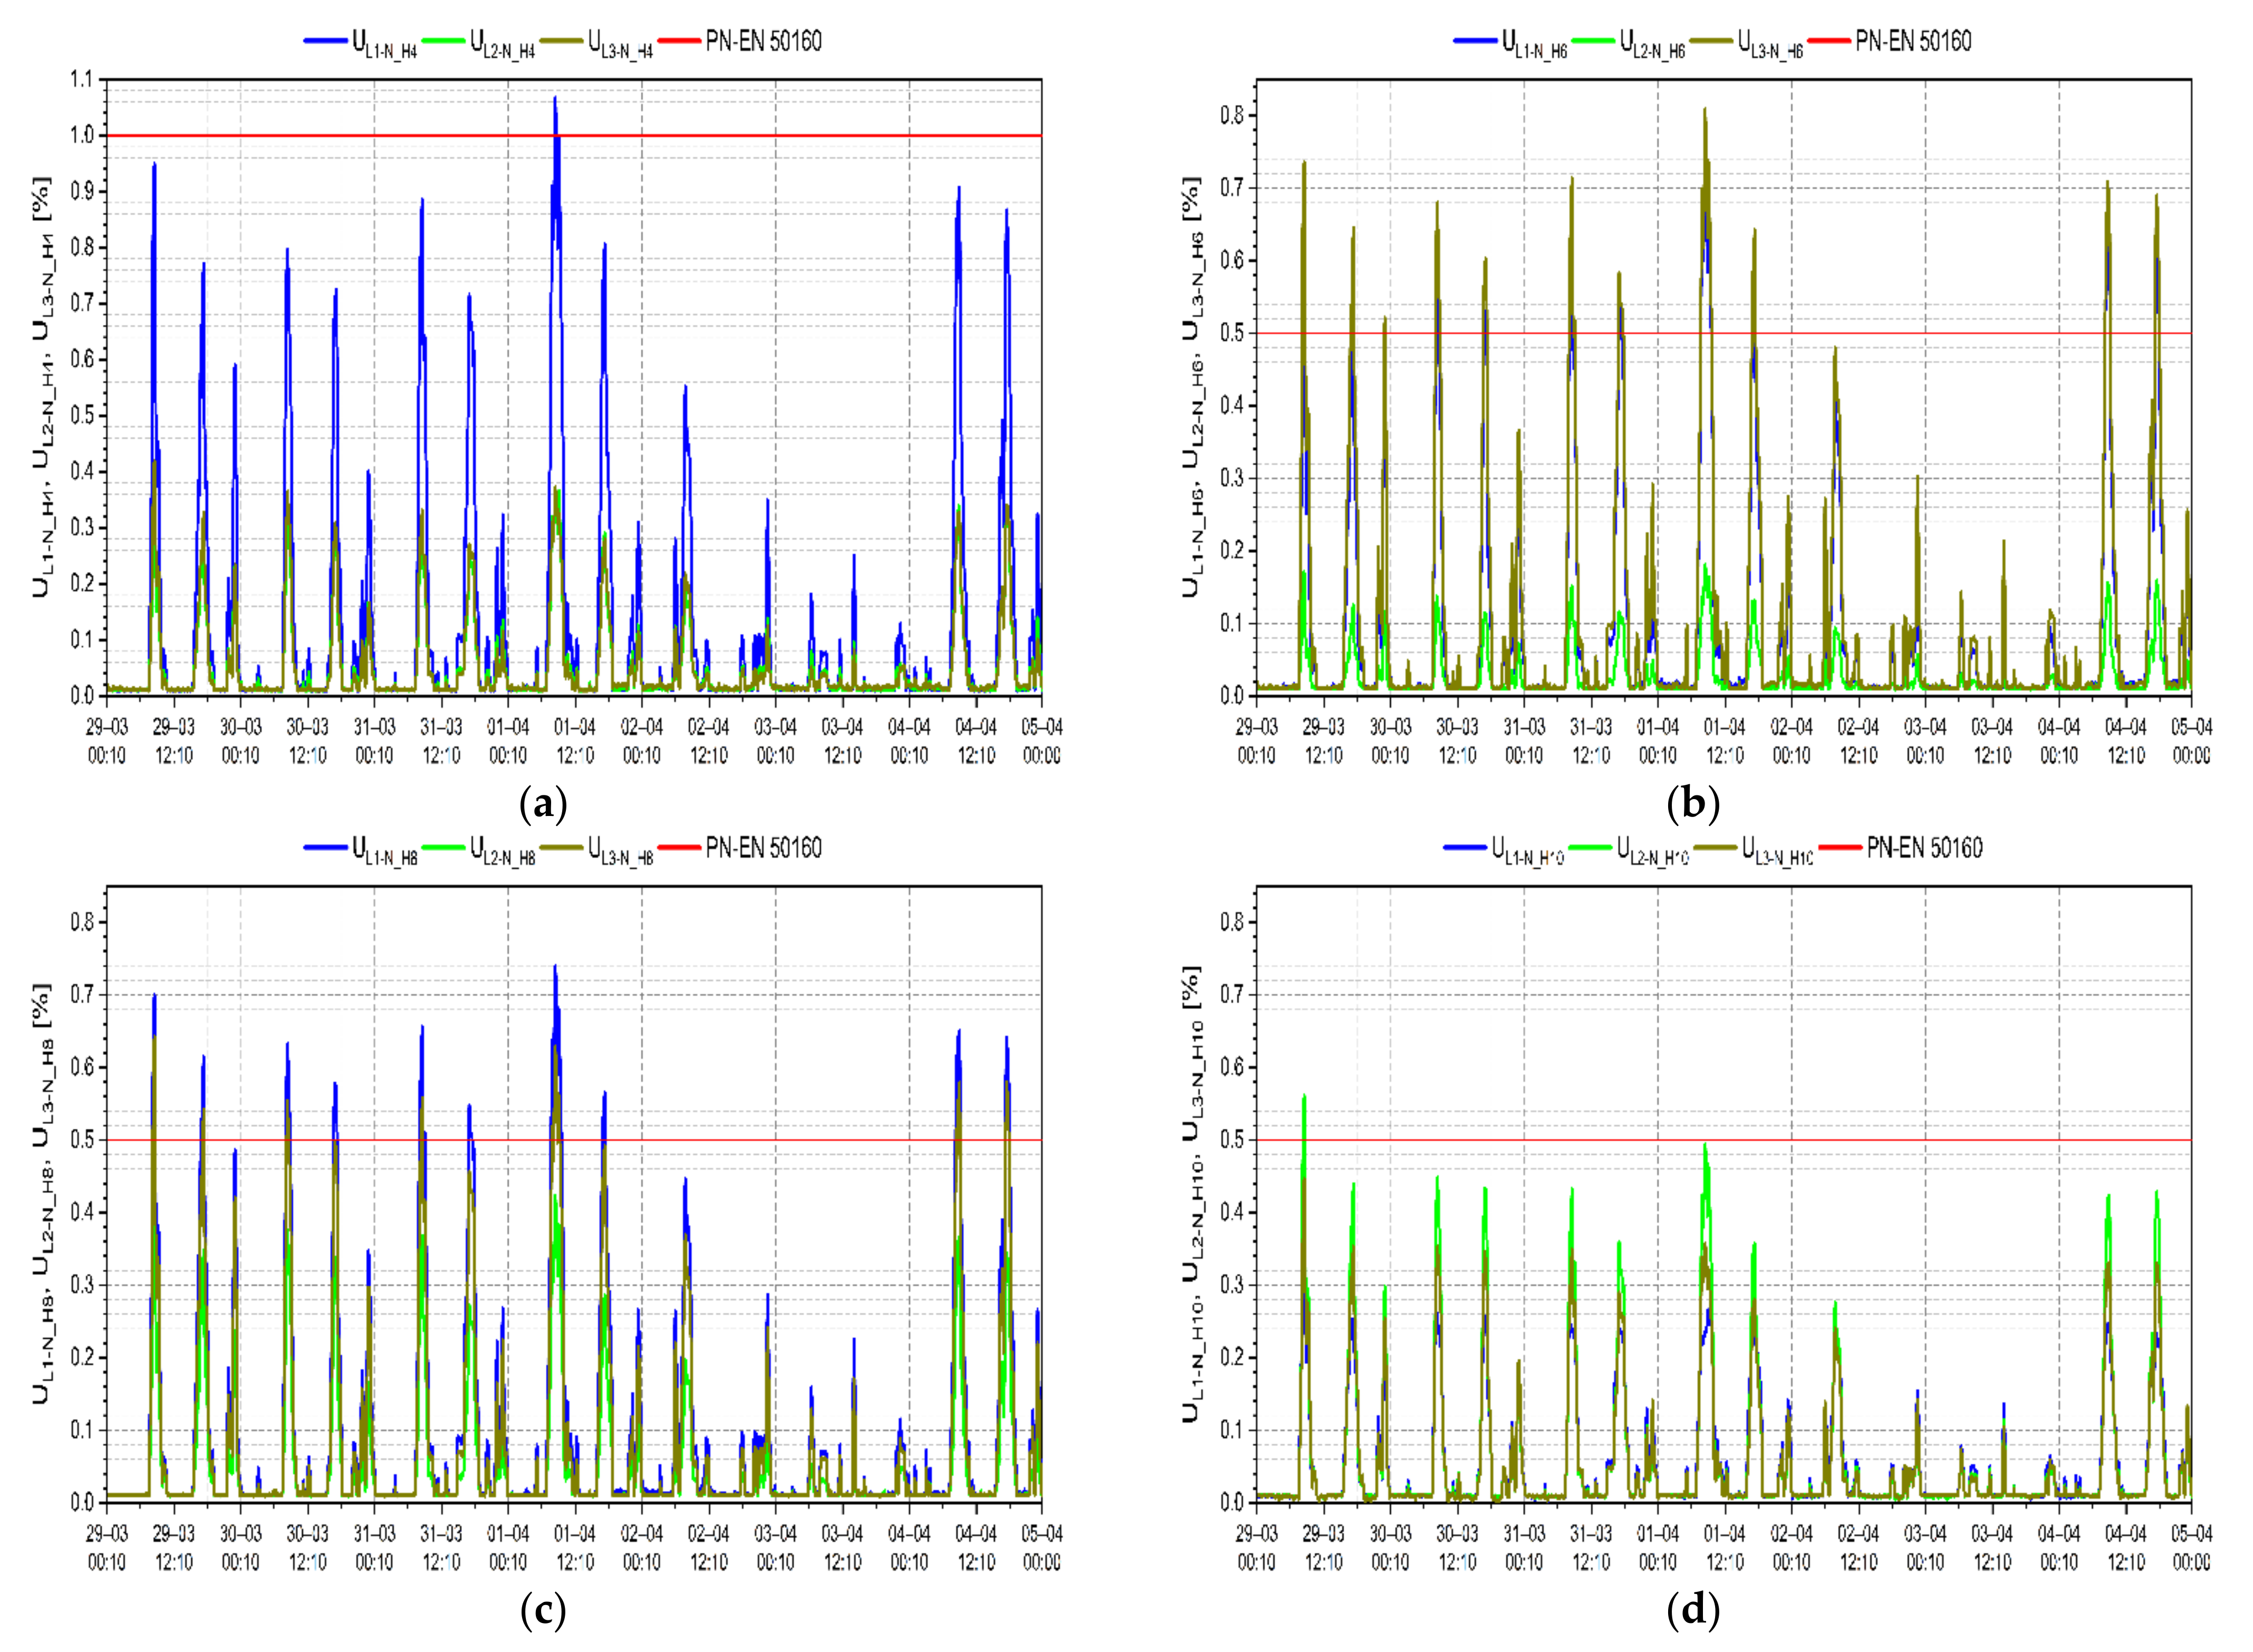
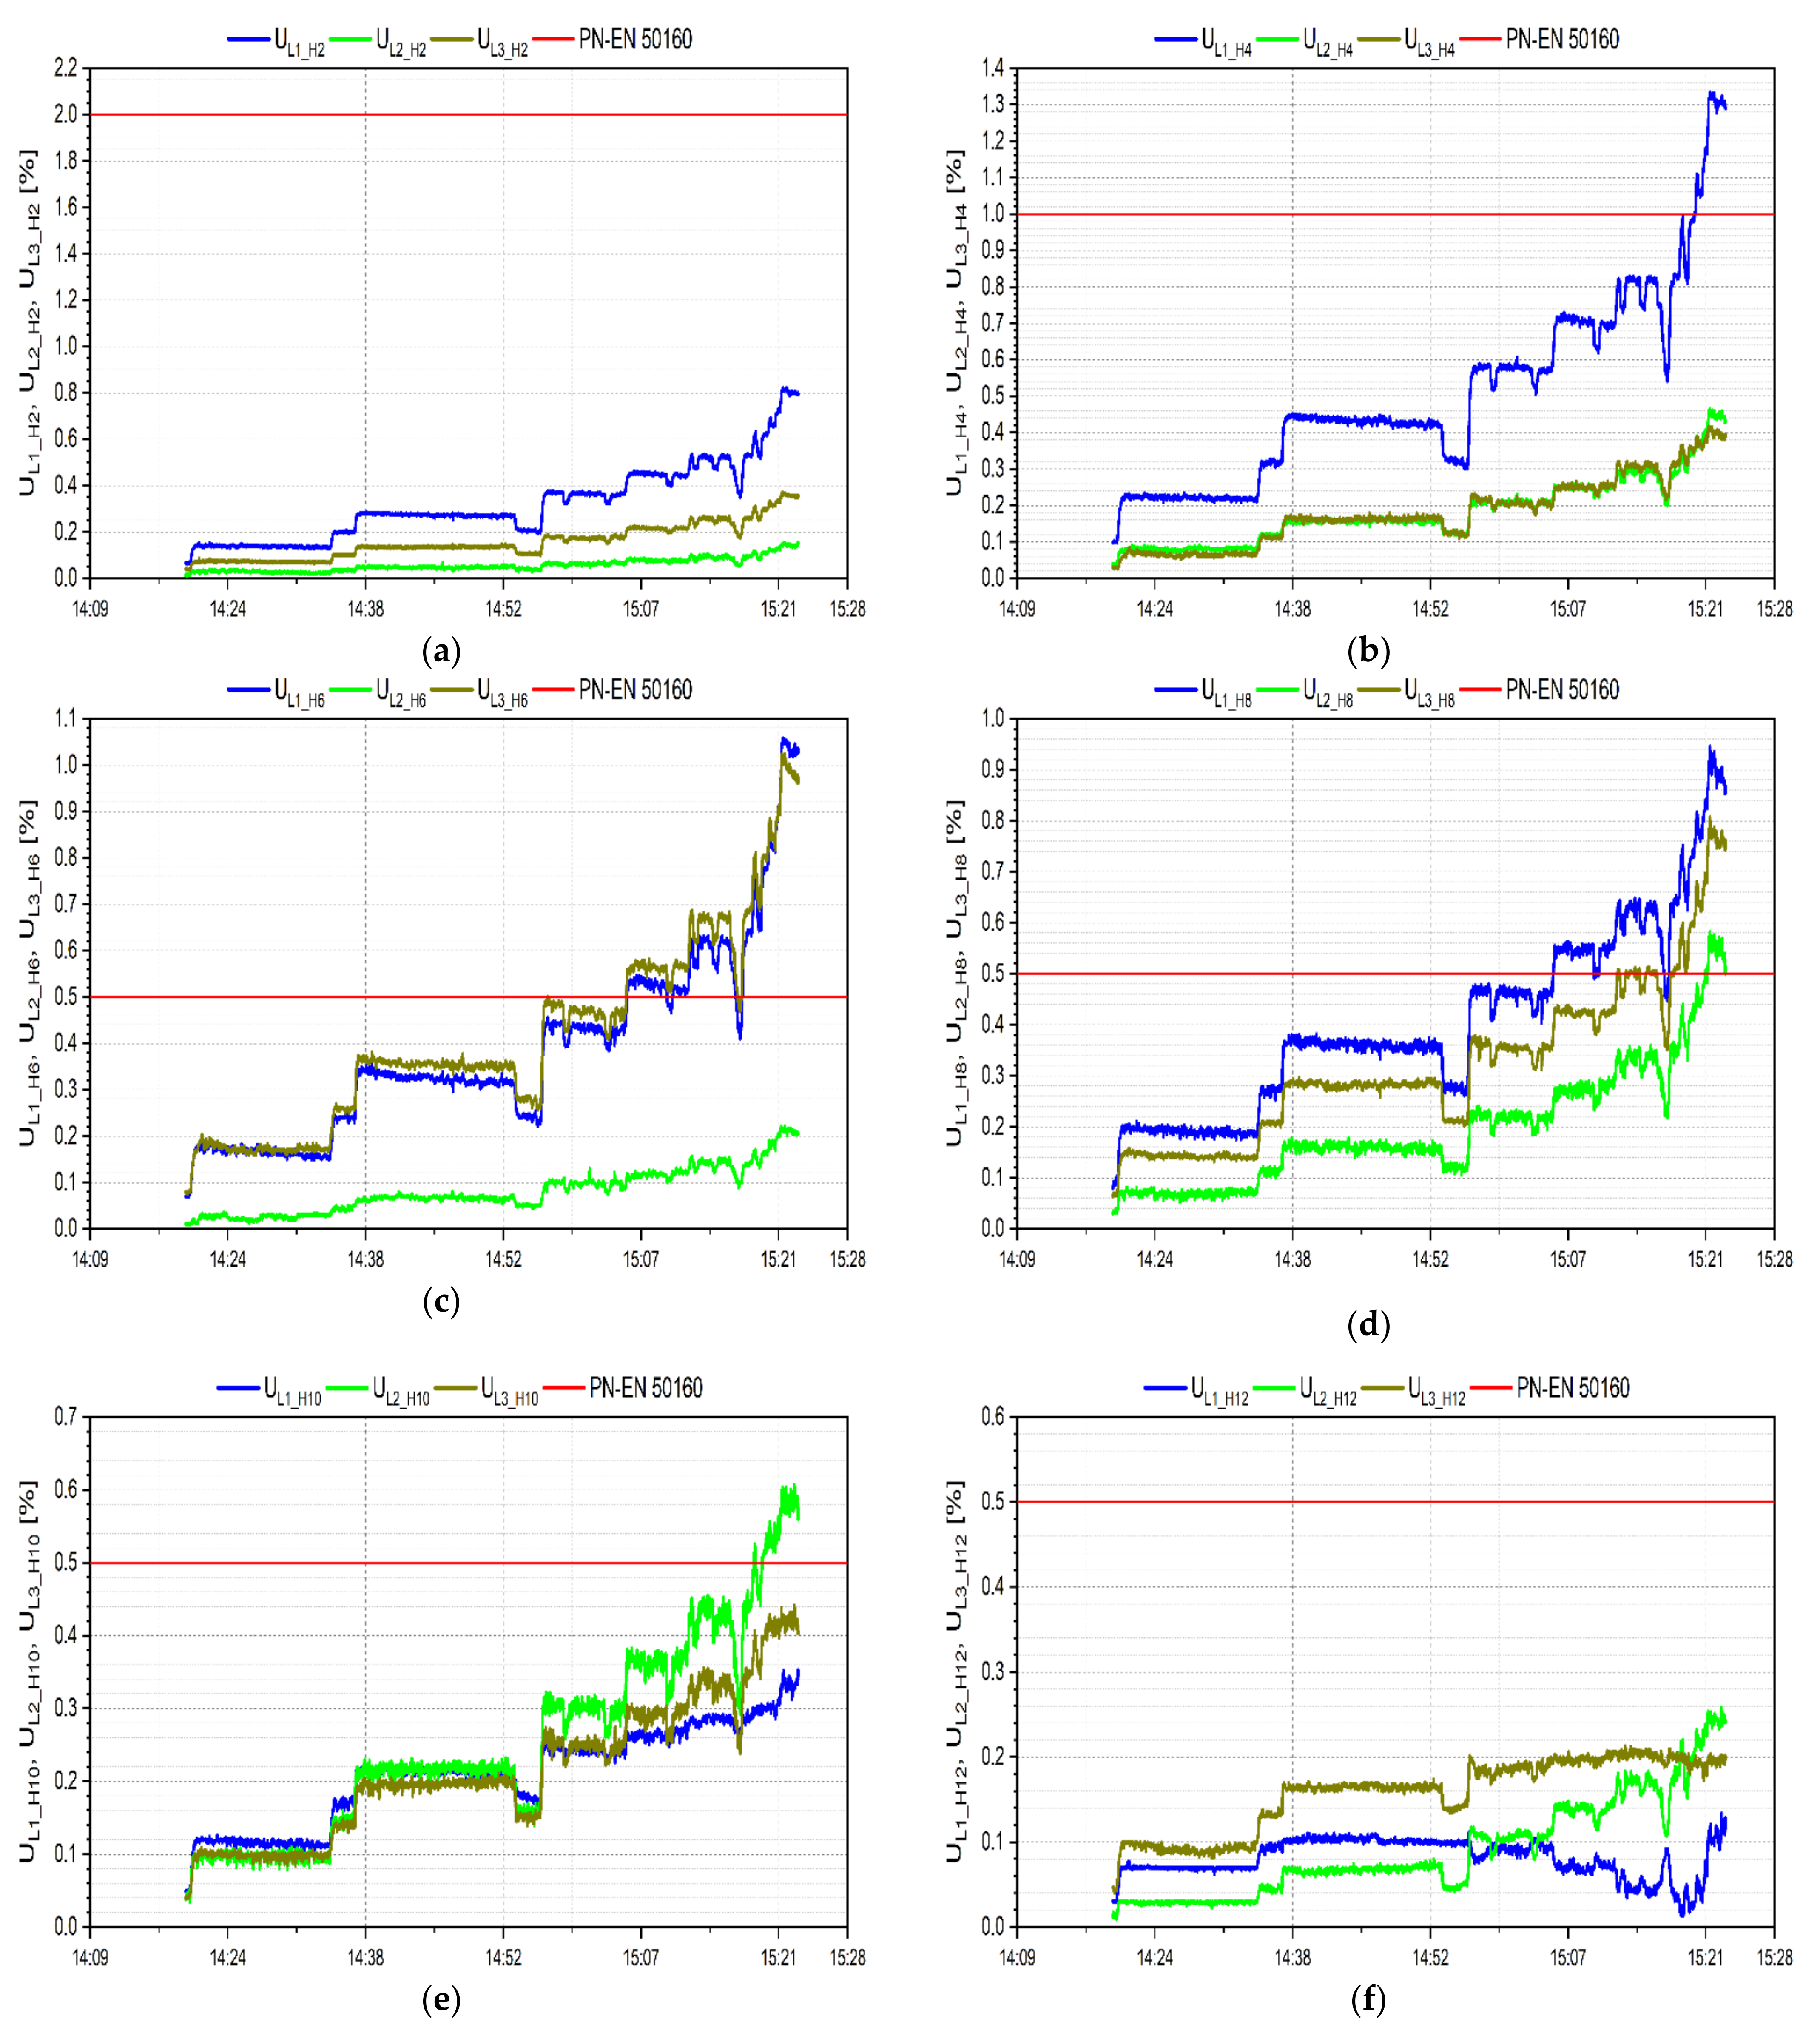
3.5. Voltage Harmonics

The power quality analyzer registered 2753 events when the 4th (L1, L2), 6th, 8th, or 10th (each phase) voltage harmonic were above the limits. The first phase was characterized by the highest number of events (1401). The lowest number of events (804) occurred in the third phase. Voltage harmonics exceedances were also registered during one charging process (179 events; the same individual voltage harmonics).
The 95th percentile of the 6th voltage harmonic of the third phase was slightly (0.52%) above the PN-EN 50160:2010 limit (0.5%). The 6th harmonic of the first phase was also close to the limit. A similar situation occurred with the 8th harmonic of the first and third phase. Figure 10 presents the voltage harmonic spectrum (95th percentile) for the measurement week. Table 2 shows the numeric values of each individual voltage harmonic.
The 95th percentile of the individual voltage harmonic distortion measured during one charging process is even higher, which is caused by connecting more and more buses to the neighboring chargers (Figure 11). The 4th (L2), 6th (each phase), 8th (L1, L3), and 10th (L2) voltage harmonics were above the requirements of the PN-EN 50160 standard. Figure 12 presents the 4th, 6th, 8th, and 10th voltage harmonic variation during the one-week measurement period. The 6th voltage harmonic of the third phase increased above the limit of the PN-EN 50160 standard as soon as six chargers were in use simultaneously. The individual voltage harmonic variation (150-cycles averaged) of the 2nd, 4th, 6th, 8th, 10th, and 12th harmonic during the full charging process are presented in Figure 13. The 4th, 6th, 8th, and 10th harmonic were increasing with time and were above the PN-EN 50160:2010 limit. The results show that the higher the number of chargers in operation, the higher the individual voltage harmonic values.

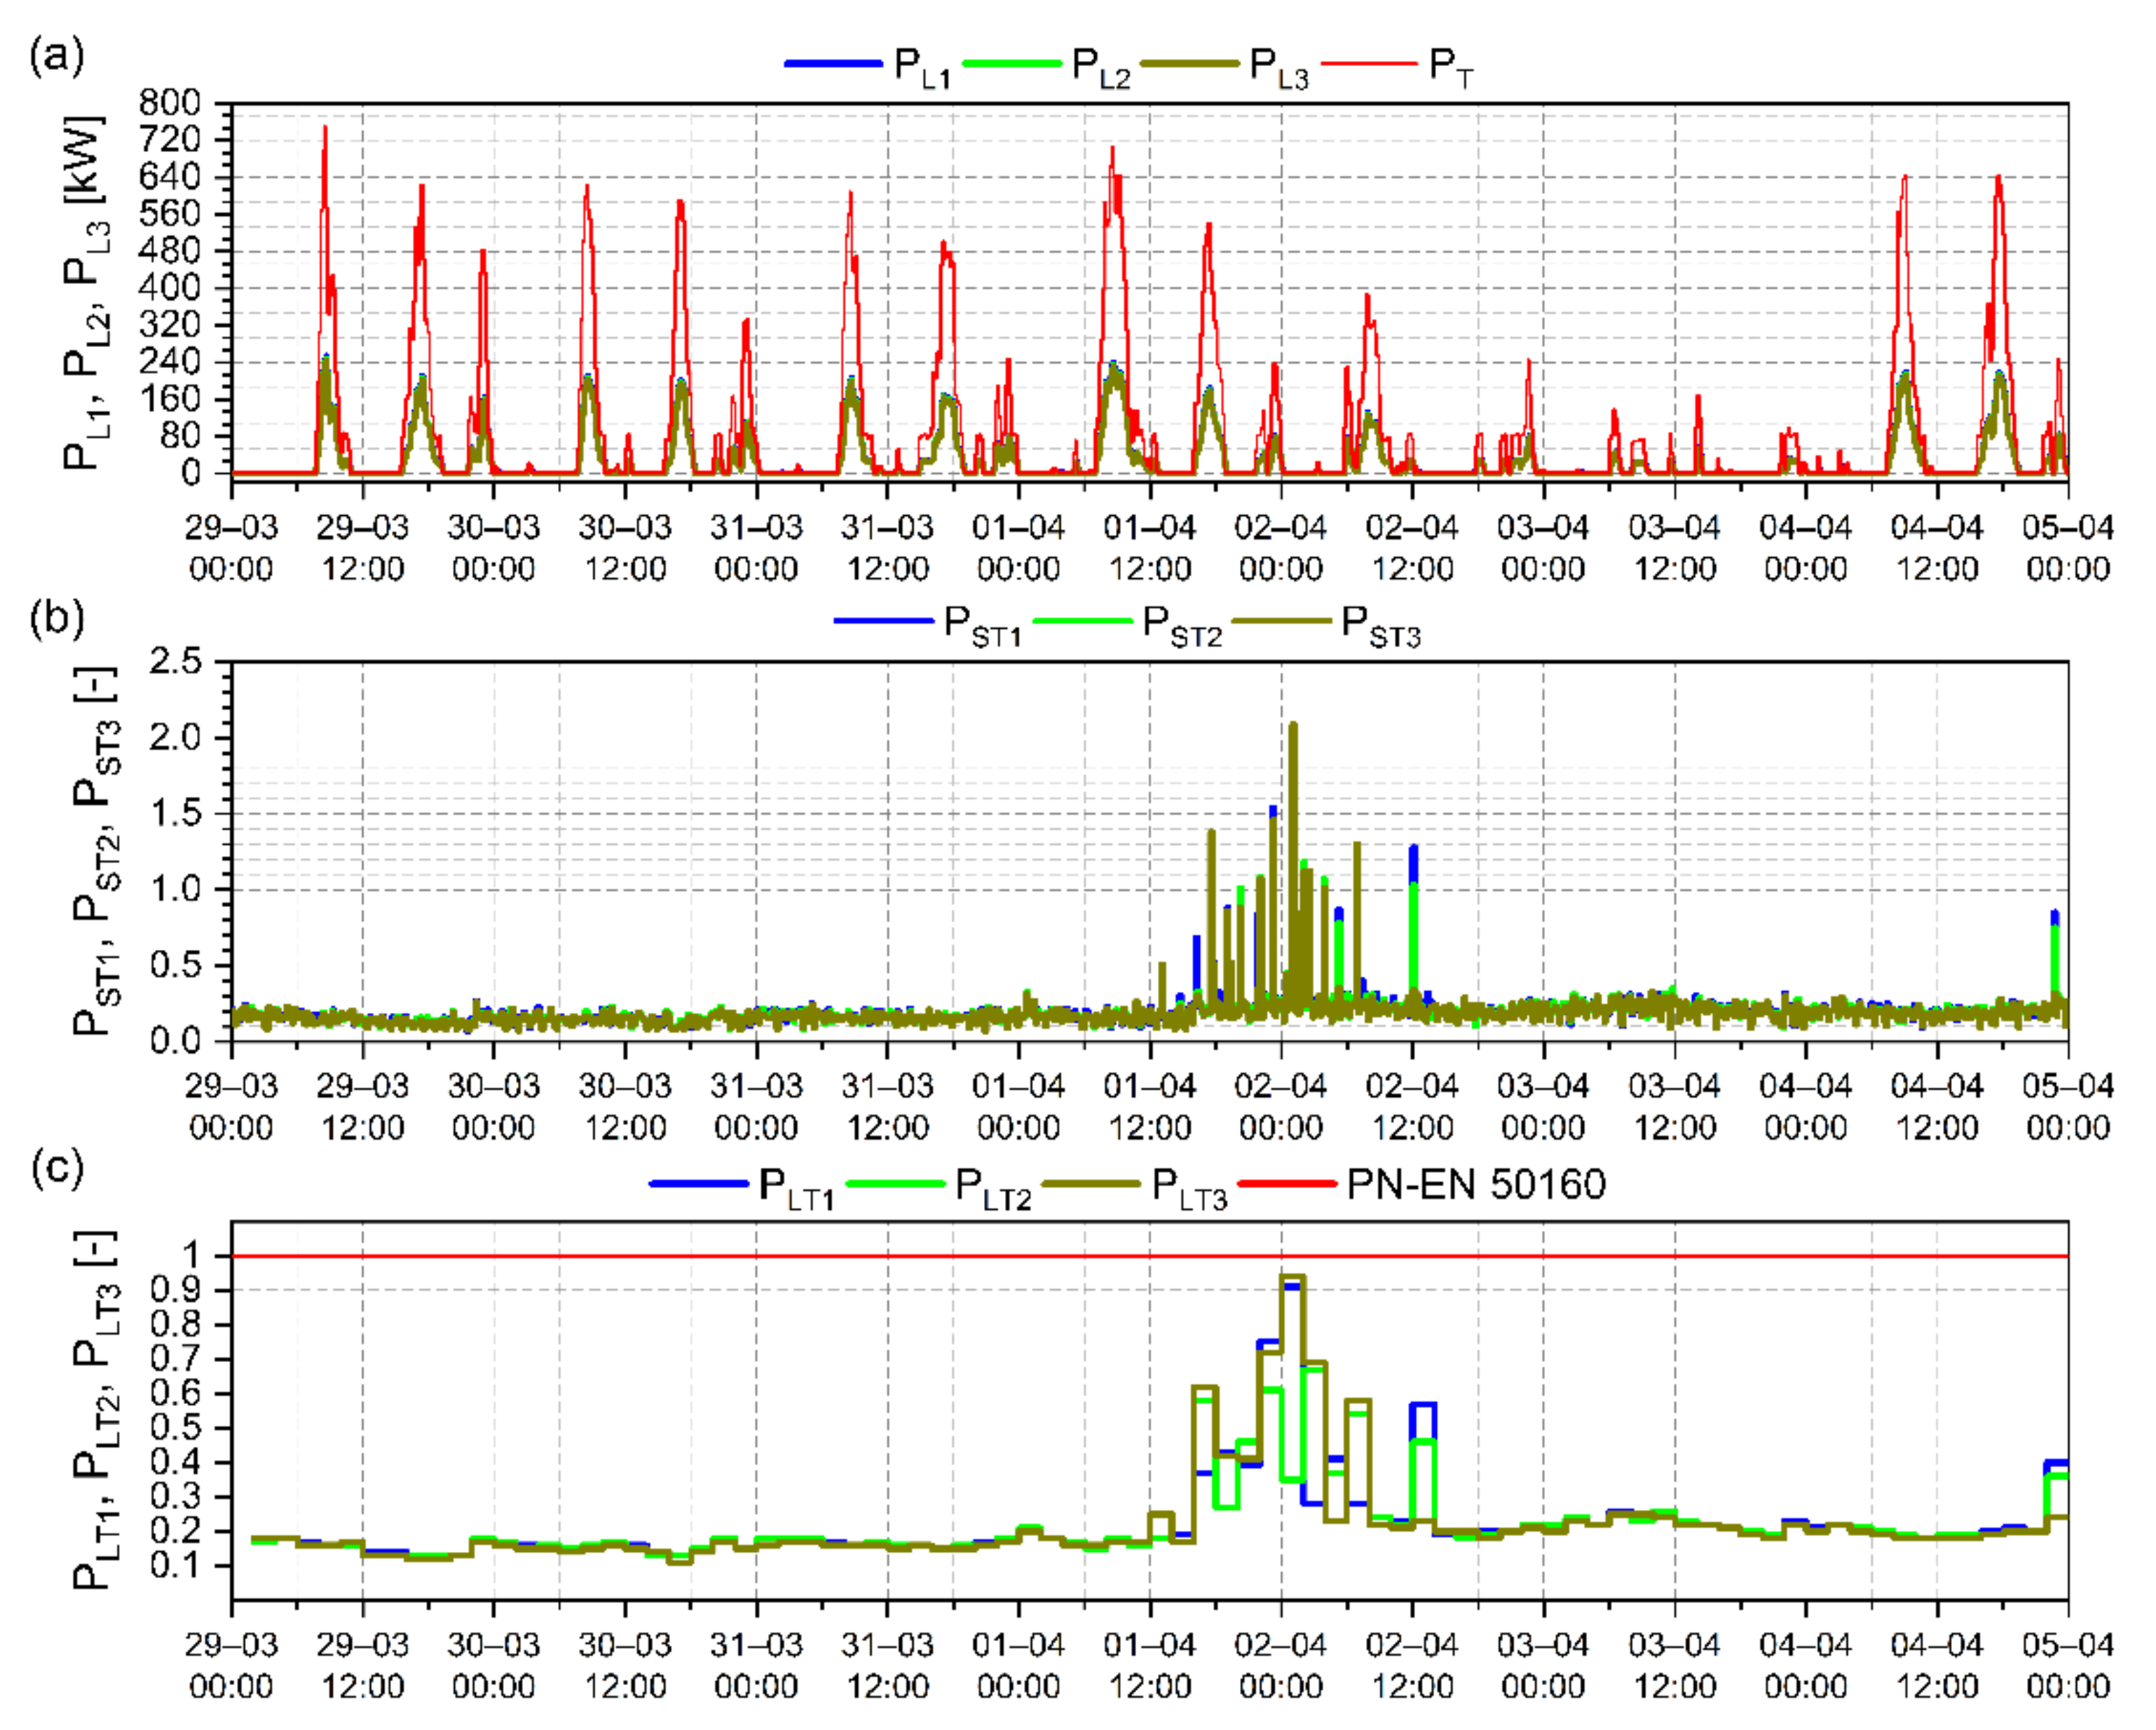
3.6. Short-Term and Long-Term Flicker Perceptibility

The weekly variation in the 10 min averaged active power (P); short-term flicker perceptibility (PST), and long-term flicker perceptibility (PLT) are presented in Figure 14. There was one approximately 24 h period (between the 1st and 2nd of April) when the values of PST and PLT were higher than usual. It is visible that the values of PST were higher when charging occurred. The thing that might have contributed to this result was the snowfall that occurred on those days. Nevertheless, the PLT meets the requirements of PN-EN 50160:2010. Detailed results are presented in Table 3.

3.7. Current Harmonic Emission

The current harmonic distortion was analyzed in accordance with the recommendations presented in IEEE Standard 519-2014 [28] for the whole week (10 min interval; short time harmonic measurements) and for one charging process (3 s interval; very short time harmonic measurements; limits for daily evaluation). Due to the fact that the electric bus depot was built less than a year ago, the maximum demand load current (IL) was assumed as the maximum average fundamental current from all measured current channels during the recording period. Each ratio of the maximum short-circuit current (ISC) to IL was considered in the analysis, as the impedance of the system is unknown.
The 95th percentiles of the 2nd (each phase), 4th (L1, L2), 8th (L1, L2), 10th (L2), and 12th (L3) harmonic current were above the limits for the most severe case during the one-week measurement period (Figure 15). The 2nd harmonic current of the third phase was the highest in both considered scenarios. The 2nd (each phase), 4th (L1, L2), 8th (L1), and 12th (L3) harmonic current were also exceeded for the most severe case during one charging process. (Figure 16). The values of current harmonics were within the limits for the ISC/IL ratio, above 1000 and 50 for the whole week and one charging process, respectively.
The individual harmonic current variation (150 cycles averaged): (a) 2nd harmonic, (b) 4th harmonic, (c) 6th harmonic, (d) 8th harmonic, (e) 10th harmonic, (f) 12th harmonic during the full charging process are presented in Figure 17. The harmonic currents were slightly increasing with time, except for the 6th harmonic (each phase) and the 12th harmonic (L1). The temporary decrease in all harmonic currents during charging was caused by the brief connection of another electric bus.

4. Conclusions

This article presents an analysis of the impact of an electric bus fleet on the power quality parameters in Lublin, Poland. The measurements show that high current harmonics (the 2nd, 4th, 8th, 10th, and 12th) were injected into the grid, resulting in noncompliance with the PN-EN 50160:2010 standard. This means that the requirements of the Regulation [26] were also not met due, to the exceedance of the 6th voltage harmonic of the third phase.
The study reveals that the harmonic current emissions and voltage harmonics at the distribution substation change, depending on the number of chargers that operate at the same time. The magnitude of harmonic currents at the secondary side of the transformer is considerably greater than at the fast-charger′s terminal, which means that harmonic currents are of an additive nature.
A detailed analysis of the results obtained and presented in the article is the basis for the conclusion that the charging of electric buses at this bus depot should be distributed strategically. Simultaneous use of more than 6 chargers should be restricted due to concerns regarding power quality. This would reduce exceedances of voltage harmonics (especially the 6th).
Electric buses are used to improve quality of life by reducing air pollution and noise; however, they can cause power quality problems in the distribution system. Nevertheless, environmental protection and continuous technological progress define them as the future of public transport. Currently, due to the need to reduce harmful emissions and the possibility of obtaining electricity from renewable energy sources, as well as due to the technological progress in the production of efficient energy sources, electric buses, although more expensive than those powered by diesel engines, are increasingly being considered by large urban areas.
An important direction for the development of the electric bus market is the creation of topologies for electric bus chargers that do not significantly affect power quality parameters. New technologies and charging management systems will help to reduce the effects of electric bus charging on the distribution grid and will lower greenhouse gas emissions. Stringent current harmonics emissions guidelines in Poland for devices with an input current of more than 75 A would also help in the reduction of the impact of electric bus charging on power quality parameters.
Regulations and standards are implemented to oblige energy distribution companies and users to restrict the disturbance levels introduced into the power system. The Regulation uses the term every week 95% of the set of 10 min averages for the parameter should be in the range. This means that continuous measurement would be the best solution. In practice, it is most often enough to carry out a measurement within a period of 7 days, which reduces the costs of the measurements, while providing an approximate picture of the phenomena occurring in the distribution grid. However, it should be remembered that the phenomena in the distribution grid are often of a random nature, or they occur only in certain situations, e.g., during snowfalls or other weather events, which means that not all disturbances will be recorded all the time. Observation of power quality parameters for the period of one month at the bus depot would be advisable.
Further research will focus on the analysis of power quality parameters during ultra-fast charging (450 kW) and the supraharmonic current emissions of electric vehicle chargers.

Author Contributions

Conceptualization, A.C. and P.H.; methodology, A.C. and P.H.; software, A.C.; validation, A.C., P.H. and P.M.; formal analysis, A.C. and P.M.; investigation, A.C.; writing—original draft preparation, A.C. and P.H.; writing—review and editing, A.C. and P.H.; supervision, P.M. All authors have read and agreed to the published version of the manuscript.

Funding

This research was co-funded by the INTERDOC PL project, which is co-financed by the European Social Fund under the Knowledge Education Development Operational Program 2014–2020 (project number POWR.03.02.00-00-I020/16).

Acknowledgments

The authors would like to acknowledge the Municipal Transport Company Lublin, LLC.

Conflicts of Interest

The authors declare no conflict of interest.

References

  1. Mathes, M.; Schmidt, M.; Käsgen, J.; Fievet, B.; Tichelen, P.V.; Berecibar, M.; Al-Saadi, M. Heavy-Duty Battery Electric Buses’ Integration in Cities Based on Superfast Charging Technologies: Impact on the Urban Life. Sustainability 2022, 14, 4777. [Google Scholar] [CrossRef]
  2. Lie, K.W.; Synnevåg, T.A.; Lamb, J.J.; Lien, K.M. The Carbon Footprint of Electrified City Buses: A Case Study in Trondheim, Norway. Energies 2021, 14, 770. [Google Scholar] [CrossRef]
  3. Mao, F.; Li, Z.; Zhang, K. A Comparison of Carbon Dioxide Emissions between Battery Electric Buses and Conventional Diesel Buses. Sustainability 2021, 13, 5170. [Google Scholar] [CrossRef]
  4. Patalas-Maliszewska, J.; Łosyk, H. Analysis of the development and parameters of a public transport system which uses low-carbon energy: The evidence from Poland. Energies 2020, 13, 5779. [Google Scholar] [CrossRef]
  5. Polish Electromobility Counter. Available online: https://pspa.com.pl/ (accessed on 6 June 2022).
  6. Polska w Europejskiej Czołówce Pod Względem Rejestracji Elektrobusów. Available online: https://www.transport-publiczny.pl/wiadomosci/polska-w-europejskiej-czolowce-pod-wzgledem-rejestracji-elektrobusow-73096.html (accessed on 6 June 2022).
  7. Ponad 700 Elektrycznych Autobusów w Polsce. Available online: https://www.transport-publiczny.pl/wiadomosci/ponad-700-elektrycznych-autobusow-w-polsce-73582.html (accessed on 6 June 2022).
  8. Chudy, A.; Mazurek, P. Electromobility–the Importance of Power Quality and Environmental Sustainability. Journal of Ecological Engineering 2019, 20, 15–23. [Google Scholar] [CrossRef]
  9. Mazurek, P.; Chudy, A. An Analysis of Electromagnetic Disturbances from an Electric Vehicle Charging Station. Energies 2021, 15, 244. [Google Scholar] [CrossRef]
  10. Watson, N.; Watson, R.; Paterson, T.; Russell, G.; Ellerington, M.; Langella, R. Power Quality of a bidirectional Electric Vehicle charger. In Proceedings of the 2020 19th International Conference on Harmonics and Quality of Power (ICHQP), Dubai, UAE, 6–7 July 2020; pp. 1–5. [Google Scholar]
  11. Das, H.S.; Rahman, M.M.; Li, S.; Tan, C.W. Electric vehicles standards, charging infrastructure, and impact on grid integration: A technological review. Renew. Sustain. Energy Rev. 2020, 120, 109618. [Google Scholar] [CrossRef]
  12. Un-Noor, F.; Padmanaban, S.; Mihet-Popa, L.; Mollah, M.; Hossain, E. A Comprehensive Study of Key Electric Vehicle (EV) Components, Technologies, Challenges, Impacts, and Future Direction of Development. Energies 2017, 10, 1217. [Google Scholar] [CrossRef] [Green Version]
  13. Pieltain Fernandez, L.; Gomez San Roman, T.; Cossent, R.; Mateo Domingo, C.; Frias, P. Assessment of the Impact of Plug-in Electric Vehicles on Distribution Networks. IEEE Trans. Power Syst. 2011, 26, 206–213. [Google Scholar] [CrossRef]
  14. Deb, S.; Tammi, K.; Kalita, K.; Mahanta, P. Impact of Electric Vehicle Charging Station Load on Distribution Network. Energies 2018, 11, 178. [Google Scholar] [CrossRef] [Green Version]
  15. Castello, P.; Muscas, C.; Pegoraro, P.; Sulis, S. PMU’s Behavior with Flicker-Generating Voltage Fluctuations: An Experimental Analysis. Energies 2019, 12, 3355. [Google Scholar] [CrossRef] [Green Version]
  16. Galla, S.; Wlas, M. The Influence of a Photovoltaic Micro-Installation on the Low-Frequency Parameters of Electricity at PCC and Its Impact on the Thermal Characteristics of Selected Devices. Energies 2021, 14, 2355. [Google Scholar] [CrossRef]
  17. Tamaskani, R.; Khodsuz, M.; Yazdani-Asrami, M. Optimal Design of C-Type Filter in Harmonics Polluted Distribution Systems. Energies 2022, 15, 1578. [Google Scholar] [CrossRef]
  18. Stahleder, D.; Reihs, D.; Ledinger, S.; Lehfuss, F. Impact assessment of high power electric bus charging on urban distribution grids. In Proceedings of the IECON 2019-45th Annual Conference of the IEEE Industrial Electronics Society, Lisbon, Portugal, 14–17 October 2019; pp. 4304–4309. [Google Scholar]
  19. Leou, R.C.; Teng, J.H.; Lu, H.J.; Lan, B.R.; Chen, H.T.; Hsieh, T.Y.; Su, C.L. Stochastic analysis of electric transportation charging impacts on power quality of distribution systems. IET Gener. Transm. Distrib. 2018, 12, 2725–2734. [Google Scholar] [CrossRef]
  20. Mohamed, M.; Farag, H.; El-Taweel, N.; Ferguson, M. Simulation of electric buses on a full transit network: Operational feasibility and grid impact analysis. Electr. Power Syst. Res. 2017, 142, 163–175. [Google Scholar] [CrossRef]
  21. Arif, S.M.; Lie, T.T.; Seet, B.C.; Ahsan, S.M.; Khan, H.A. Plug-In Electric Bus Depot Charging with PV and ESS and Their Impact on LV Feeder. Energies 2020, 13, 2139. [Google Scholar] [CrossRef]
  22. Thiringer, T.; Haghbin, S. Power Quality Issues of a Battery Fast Charging Station for a Fully-Electric Public Transport System in Gothenburg City. Batteries 2015, 1, 22–33. [Google Scholar] [CrossRef] [Green Version]
  23. Su, C.-L.; Yu, J.-T.; Chin, H.-M.; Kuo, C.-L. Evaluation of power-quality field measurements of an electric bus charging station using remote monitoring systems. In Proceedings of the 2016 10th International Conference on Compatibility, Power Electronics and Power Engineering (CPE-POWERENG), Bydgoszcz, Poland, 29 June–1 July 2016; pp. 58–63. [Google Scholar]
  24. Zagrajek, K.; Paska, J.; Kłos, M.; Pawlak, K.; Marchel, P.; Bartecka, M.; Michalski, Ł.; Terlikowski, P. Impact of Electric Bus Charging on Distribution Substation and Local Grid in Warsaw. Energies 2020, 13, 1210. [Google Scholar] [CrossRef] [Green Version]
  25. Al-Saadi, M.; Bhattacharyya, S.; Tichelen, P.V.; Mathes, M.; Käsgen, J.; Van Mierlo, J.; Berecibar, M. Impact on the Power Grid Caused via Ultra-Fast Charging Technologies of the Electric Buses Fleet. Energies 2022, 15, 1424. [Google Scholar] [CrossRef]
  26. Regulation of the Minister of Economy Dated. 4 May 2007 on Detailed Conditions of Functioning of the Power System. Available online: https://isap.sejm.gov.pl/isap.nsf/DocDetails.xsp?id=wdu20070930623 (accessed on 6 June 2022).
  27. PN-EN 50160:2010; Parametry Napięcia Zasilającego w Publicznych Sieciach Elektroenergetycznych. Voltage Characteristics of Public Distribution Systems. Wroclaw University of Technology: Wroclaw, Poland, 2004.
  28. IEEE Standard 519-2014; Recommended Practice and Requirements for Harmonic Control in Electrical Power Systems. IEEE: Piscataway, NJ, USA, 2014.
  29. Jasiński, M.; Sikorski, T.; Kostyła, P.; Kaczorowska, D.; Leonowicz, Z.; Rezmer, J.; Szymańda, J.; Janik, P.; Bejmert, D.; Rybiański, M.; et al. Influence of Measurement Aggregation Algorithms on Power Quality Assessment and Correlation Analysis in Electrical Power Network with PV Power Plant. Energies 2019, 12, 3547. [Google Scholar] [CrossRef] [Green Version]
  30. International Electrotechnical Commission. IEC 61851-21-2-Electric Vehicle Conductive Charging System—Part 21-2: Electric Vehicle Requirements for Conductive Connection to an AC/DC Supply—EMC Requirements for off Board Electric Vehicle Charging Systems; International Electrotechnical Commission: Geneva, Switzerland, 2018. [Google Scholar]
Figure 1. The view of (a) the bus depot and dedicated substation at the Grygowa Street; (b) Solaris Urbino Electric 12 electric bus being charged with the fast charger.
Energies 15 05555 g001
Figure 2. Power quality measurement points and electric bus chargers connected at the transformer.
Energies 15 05555 g002
Figure 3. Weekly total active and reactive power demand profile (data aggregation interval: 150 cycles).
Energies 15 05555 g003
Figure 4. Power demand profile during one charging cycle (data aggregation interval: 50 cycles).
Energies 15 05555 g004
Figure 5. Power frequency variation during the measurement week; colored lines indicate the limits.
Energies 15 05555 g005
Figure 6. Phase voltage variation during the measurement week.
Energies 15 05555 g006
Figure 7. Voltage imbalance factor variation during the measurement week.
Energies 15 05555 g007
Figure 8. Total harmonic distortion of voltage variation during the measurement week.
Energies 15 05555 g008
Figure 9. Total harmonic distortion of voltage variation during one charging process.
Energies 15 05555 g009
Figure 10. Voltage harmonic spectrum (95th percentile) for the entire week.
Energies 15 05555 g010
Figure 11. Voltage harmonic spectrum (95th percentile) for one electric bus charging process.
Energies 15 05555 g011
Figure 12. The individual voltage harmonic variation (10 min averaged): (a) 4th harmonic; (b) 6th harmonic; (c) 8th harmonic; (d) 10th harmonic during the measurement week.
Energies 15 05555 g012
Figure 13. The individual voltage harmonic variation (150 cycles averaged): (a) 2nd harmonic; (b) 4th harmonic; (c) 6th harmonic; (d) 8th harmonic; (e) 10th harmonic; (f) 12th harmonic during the full charging process.
Energies 15 05555 g013
Figure 14. (a) Total active power demand profile (10 min averaged); (b) short-term flicker perceptibility; (c) long-term flicker perceptibility during the measurement period.
Energies 15 05555 g014
Figure 15. Current harmonic spectrum (95th percentile)—one-week measurement period (IL = 1068.57 A).
Energies 15 05555 g015
Figure 16. Current harmonic spectrum (99th percentile)—one charging process (IL = 116.93 A).
Energies 15 05555 g016
Figure 17. The individual harmonic current variation (150 cycles averaged): (a) 2nd harmonic, (b) 4th harmonic, (c) 6th harmonic, (d) 8th harmonic, (e) 10th harmonic, and (f) 12th harmonic during the full charging process.
Energies 15 05555 g017
Table 1. Phase voltage values for the one-week measurement period.
Phase VoltageMeanMinimumMaximumP95
UL1-N242.03 V237.9 V245.36 V244 V
UL2-N242.16 V238.43 V245.26 V243.82 V
UL3-N242.9 V238.89 V246.12 V244.8 V
UL1-N242.03 V237.9 V245.36 V244 V
Table 2. Numeric values of each individual voltage harmonic.
Harmonic NumberPN-EN 50160:2010 Limit [%]P95 L1 [%]P95 L2 [%]P95 L3 [%]
H220.400.070.20
H350.390.180.20
H410.640.230.25
H561.631.561.69
H60.50.460.100.52
H750.950.780.83
H80.50.490.250.42
H91.50.220.170.28
H100.50.230.320.27
H113.50.660.670.67
H120.50.080.110.16
H1330.260.280.28
H140.50.150.080.09
H150.50.050.030.04
H160.50.120.140.20
H1720.170.220.22
H180.50.040.020.06
H191.50.220.190.24
H200.50.080.070.11
H210.50.040.030.03
H220.50.090.070.10
H231.50.130.120.13
H240.50.020.010.03
H251.50.100.100.13
Table 3. Values of short-term and long-term flicker perceptibility (one-week measurement period).
N totalMeanMinimumMedianMaximumP95
PST110080.190.070.182.050.29
PST210080.190.070.181.030.28
PST310080.190.070.172.090.27
PLT1840.220.110.180.910.41
PLT2840.220.130.180.670.46
PLT3840.220.110.180.940.58
Publisher’s Note: MDPI stays neutral with regard to jurisdictional claims in published maps and institutional affiliations.

