1. Introduction
Among the many topics related to wind energy [
1], there is a special group associated with precise measurements of flow parameters. Such topics include farm site assessment and wake interference among the wind turbines. During such research, various types of precise anemometers are used. One type is a hot-wire anemometric system dedicated to the measurement velocity signals in a wide frequency range. A reliable knowledge of the wind is significant for the wind farm location planning and implementation. Wind data acquired by the meteorological stations provide knowledge about the distribution of frequency, velocity, and energy in different directions. It is used for making preliminary estimates about the wind energy potential of a site [
2].
A lot of research related to the wind turbines focuses on the model tests in a wind tunnels. In such research the scale effect must be taken into account. It requires the use of various types of measuring equipment, allowing for measurements in a wide spectrum of frequencies [
3,
4,
5,
6]. Many experimental investigations focus on the effects of various flow parameters, including the intensity of turbulence [
7,
8,
9]. In presented cases the basic measurement instrument capable to measure velocity with frequencies of tens of kilohertz is a hot-wire anemometer.
Based on recorded velocity changes, it is possible to determine the characteristic parameters of analyzed flows, including the turbulence. This phenomenon occurs in flows of any kind, and it is characterized by its randomness in both time and space domains. With respect to its time randomness, the assessment of turbulence requires the measurement systems that enable measurements with the best possible dynamic parameters. Therefore, the design of hot-wire anemometric measurement systems comprises a complex process in which an appropriate selection of electronic components providing the fastest possible response of the system to changes occurring in the flow plays a crucial role.
While measuring the flow velocity with the use of such hot-wire anemometric techniques, the problems related to changes of characteristics of a hot-wire anemometric system, which are conditional based on the environment in which these measurements are performed, can often be encountered. Research on sensitivity of hot-wire anemometric measurement methods with respect to environmental conditions, as well as the configuration of measurement systems, concerns their static characteristics, allowing for precise determination of flow velocity. Comprehensive analysis of this problem resulted in the development of measurement systems allowing for compensation of the effect of variable environmental measurement conditions, such as the influence of variable flow temperature on characteristics of the measuring hot-wire anemometer [
10]. Rarely, the discussion deals with the problem of the dynamic sensitivity of the measurement of hot-wire anemometric systems, which is closely related to the issue of the dynamic response of the hot-wire anemometric system. The presented system is dedicated to the analysis of the wind energy spectrum in experimental laboratory tests on reduced-scale models and to specialized in situ measurements.
2. Dynamic Properties of the Hot-Wire Anemometric Systems
The first elaborations concerning the transmission band of hot-wire anemometers contained detailed analyses of measurement probes as well as experimental investigations of the transmission band of hot-wire anemometric sensors. An analysis of the influence of flow velocity on the transmission band of hot-wire anemometric sensors operating in the constant-current operational mode can be found in [
11]. The author describes the results of an experimental investigation of a transmission band of a platinum wire at different velocities of the flow, in which the wire was placed. A detailed analysis of the wire’s dynamics under various flow conditions suggests its huge changes depending on flow velocity. Studies of dynamics of thermoresistant wire elements are still under way and obtained results allow for development of complex systems for correction of dynamic errors acquired during temperature measurements [
12,
13,
14,
15].
The dynamic response of the hot-wire anemometric systems doesn’t depend only on the sensor properties themselves. It is also conditional on the electronic configuration of the measurement module itself, among other things. Therefore, the analysis of the transmission band of such systems must be examined with special consideration given to components deciding the rate of the system’s reaction to fluctuating measurement signals, such as the properties of the electronic components from which these systems are made.
In the literature concerning this subject, a number of studies raising the problem of the dynamic response of hot-wire anemometric systems are available. In the study [
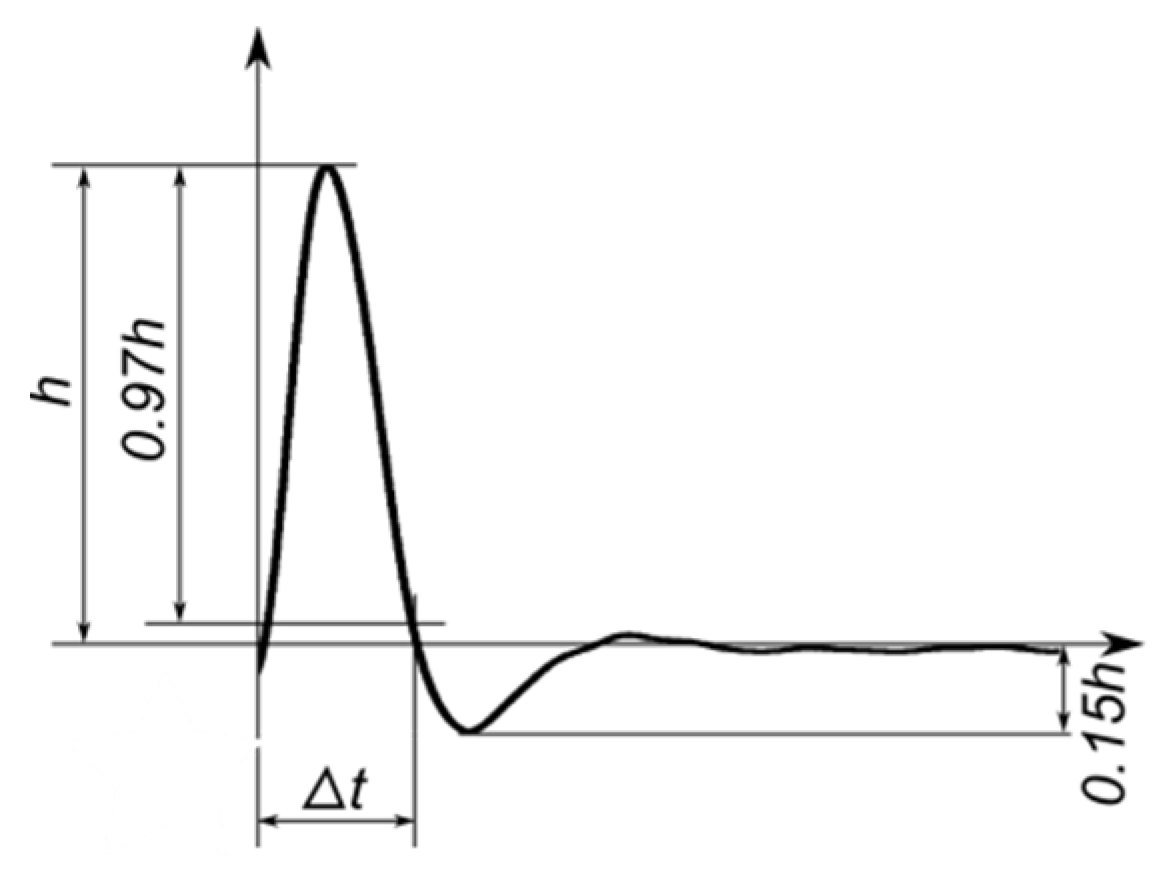
16], a description of the constant-temperature hot-wire anemometric system in the bridge configuration by means of the third-order linear differential equation allowing for determination of its dynamic response was proposed. Testing of dynamics of such systems in real-life conditions was hindered, owing to the lack of possibility to generate precisely specified, controlled, harmonically variable fields of flow velocity. In order to verify the dynamic response of such systems, a generator of sine or rectangular voltage wave included in one branch of the bridge circuit of a hot-wire anemometer, simulating the step-change excitation of the velocity of flowing medium, was used. This method was used to determine the optimal dynamic response of the hot-wire anemometric system, which would ensure the system’s maximum bandwidth—
Figure 1.
In such case, the system’s bandwidth frequency
fc can be determined on the basis of measured time Δ
t, which is the time interval in which the system’s response reaches 3% of its maximum value (1).
Such a method for investigating the dynamics of hot-wire anemometers was adopted as the standard. Later on, a series of studies dealing with detailed analysis of dynamic properties of hot-wire anemometric measurement systems was performed. Studies [
17,
18,
19,
20] presented the results of model testing of hot-wire anemometric measurement systems, which consider additional factors influencing the response of hot-wire anemometers such as: the frequency characteristics of the amplifier used in real-life conditions, the impedance of electric circuit, the offset, type of measuring wire and the properties of the medium in which the measurements are performed.
3. The Hot-Wire Anemometer with Bandwidth Frequency Optimization
Analysis of the literature dealing with hot-wire anemometry points out the necessity to adjust the hot-wire anemometric measurement systems in a way that would ensure their optimal transmission bands depending on the configuration of the system itself and the conditions under which the measurements are performed. In case of the conventional hot-wire anemometers, the bandwidth optimization is adjusted only for specific probes, cable types, length, velocities, and specific laboratory conditions. The electrical anemometer parameters are selected to ensure high bandwidth for different types of probes. However, such adjustment does not provide the guarantee that this bandwidth will be optimal. Depending on different measurement conditions, bandwidth changes, and in some cases, it can be much lower than we expected and assumed in experiment. The development of hot-wire anemometric systems characterized by wide transmission bands, constant over possibly the widest range of fluctuations of factors influencing their dynamic response, has become an important problem. Simulation testing of the model of such a system was presented in [
21]. It showed that it is possible to develop a hot-wire anemometric measurement system that would allow for implementation of algorithms enabling the automatic adjustment of the hot-wire anemometer, ensuring that the optimal transmission band would be obtained. For this purpose, a simplified model of such a measurement system was used.
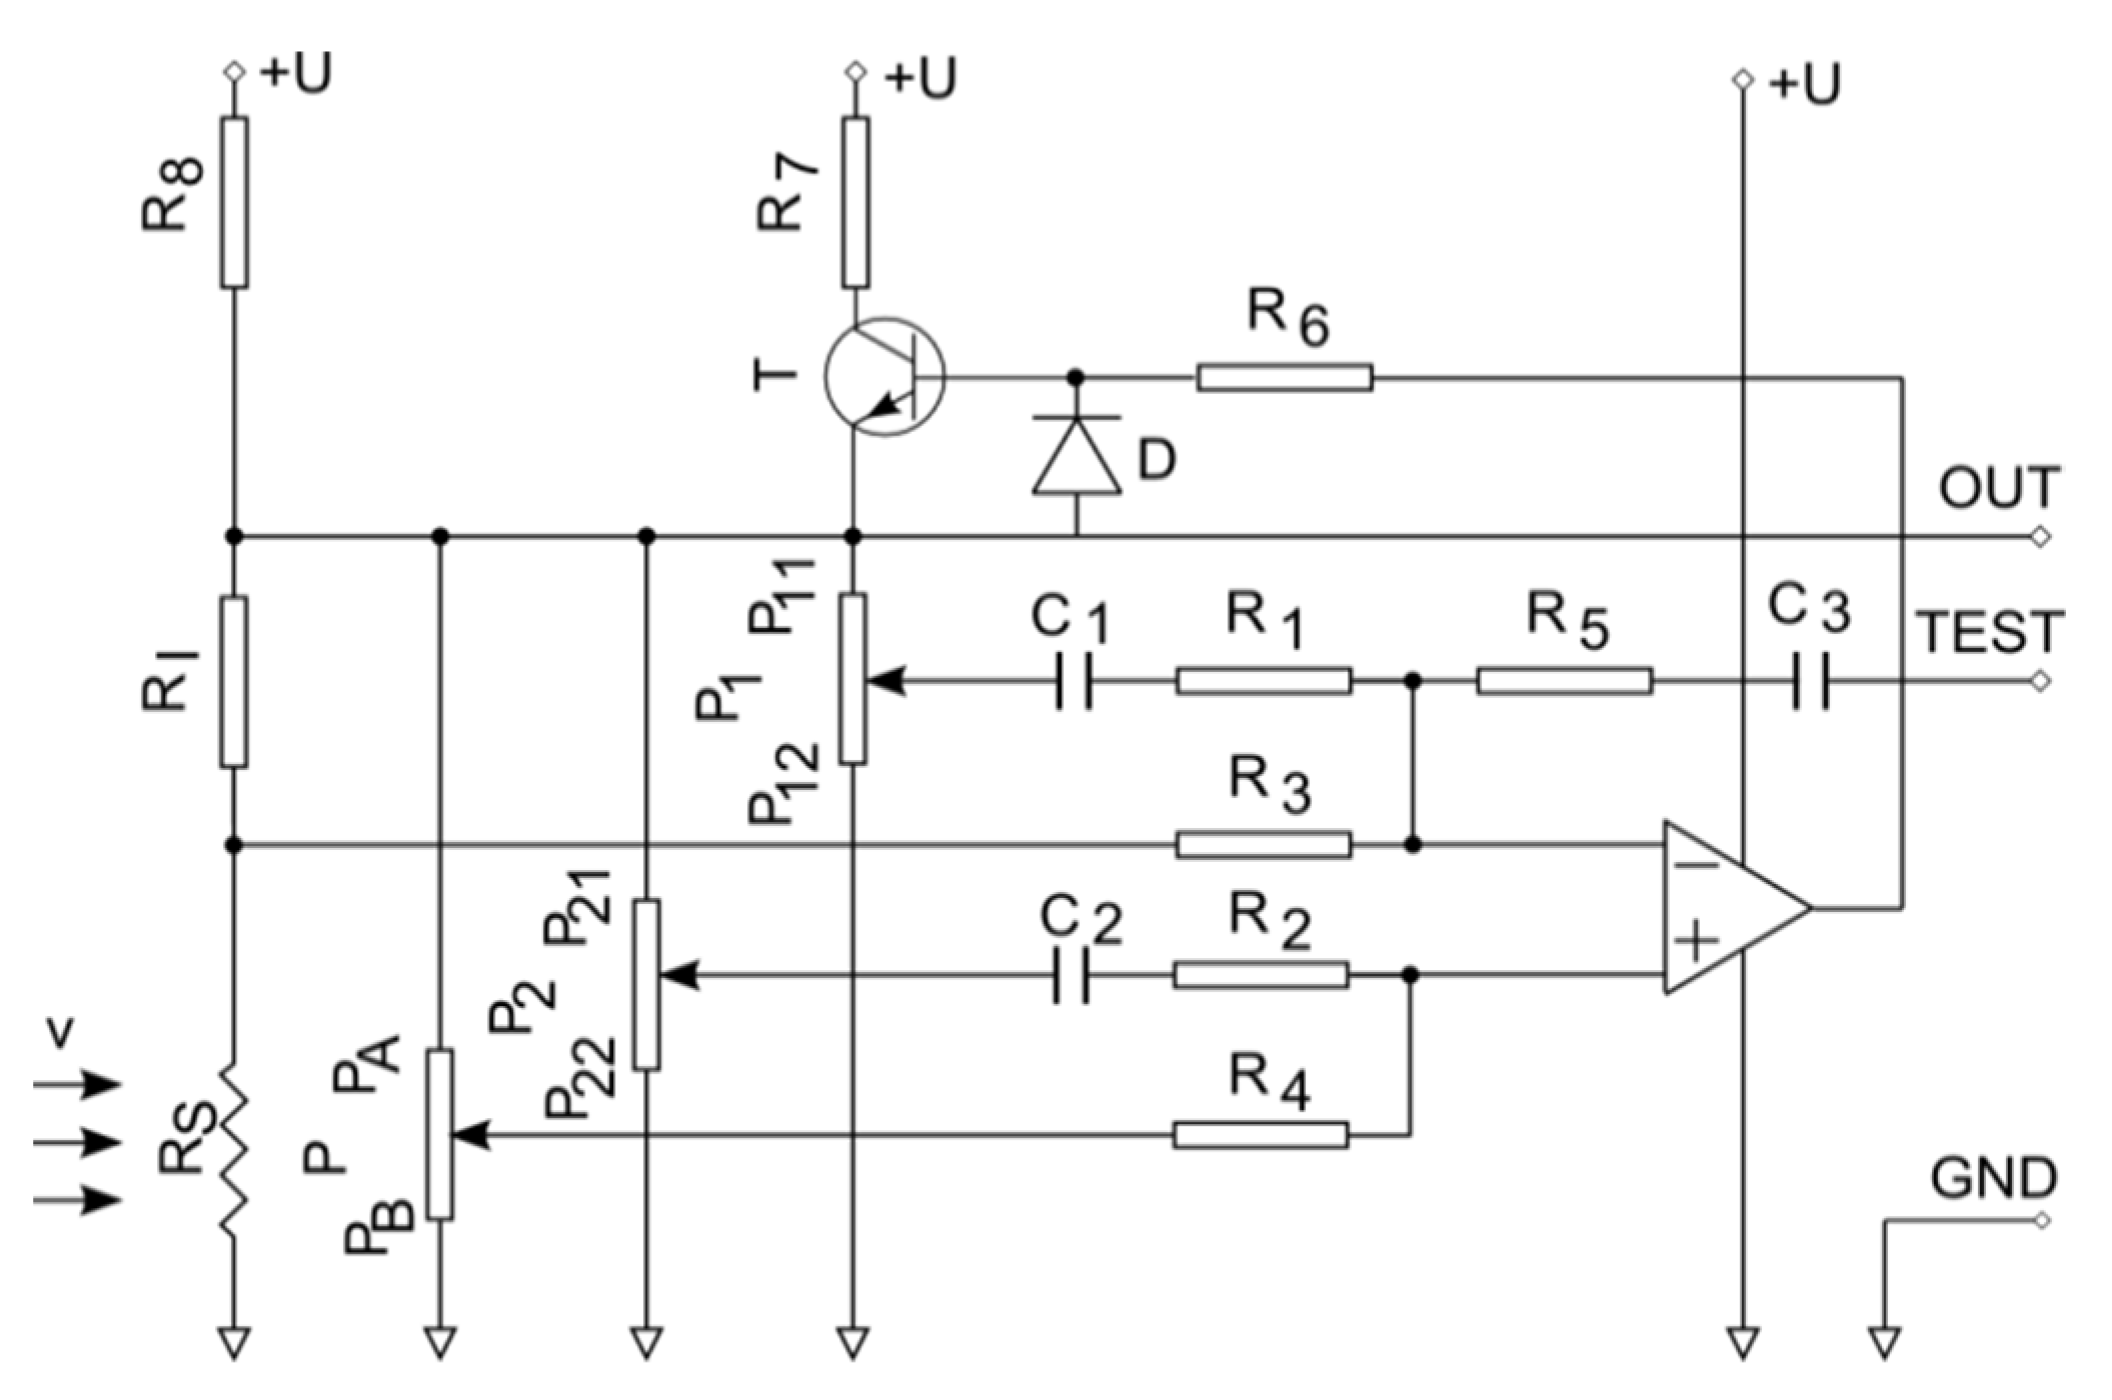
Figure 2 presents conception of one measurement channel of the anemometer.
Adjustment of dynamic properties of such a system are facilitated by including two potentiometers between the upper point and the ground point of the resistance bridge. In line with the assumptions, adjusting the P1 potentiometer gives the possibility to obtain a stable operation of the system with a preliminarily optimized transmission band. Adjusting the P2 potentiometer allows for a final optimization of the transmission band of the whole system to be obtained.
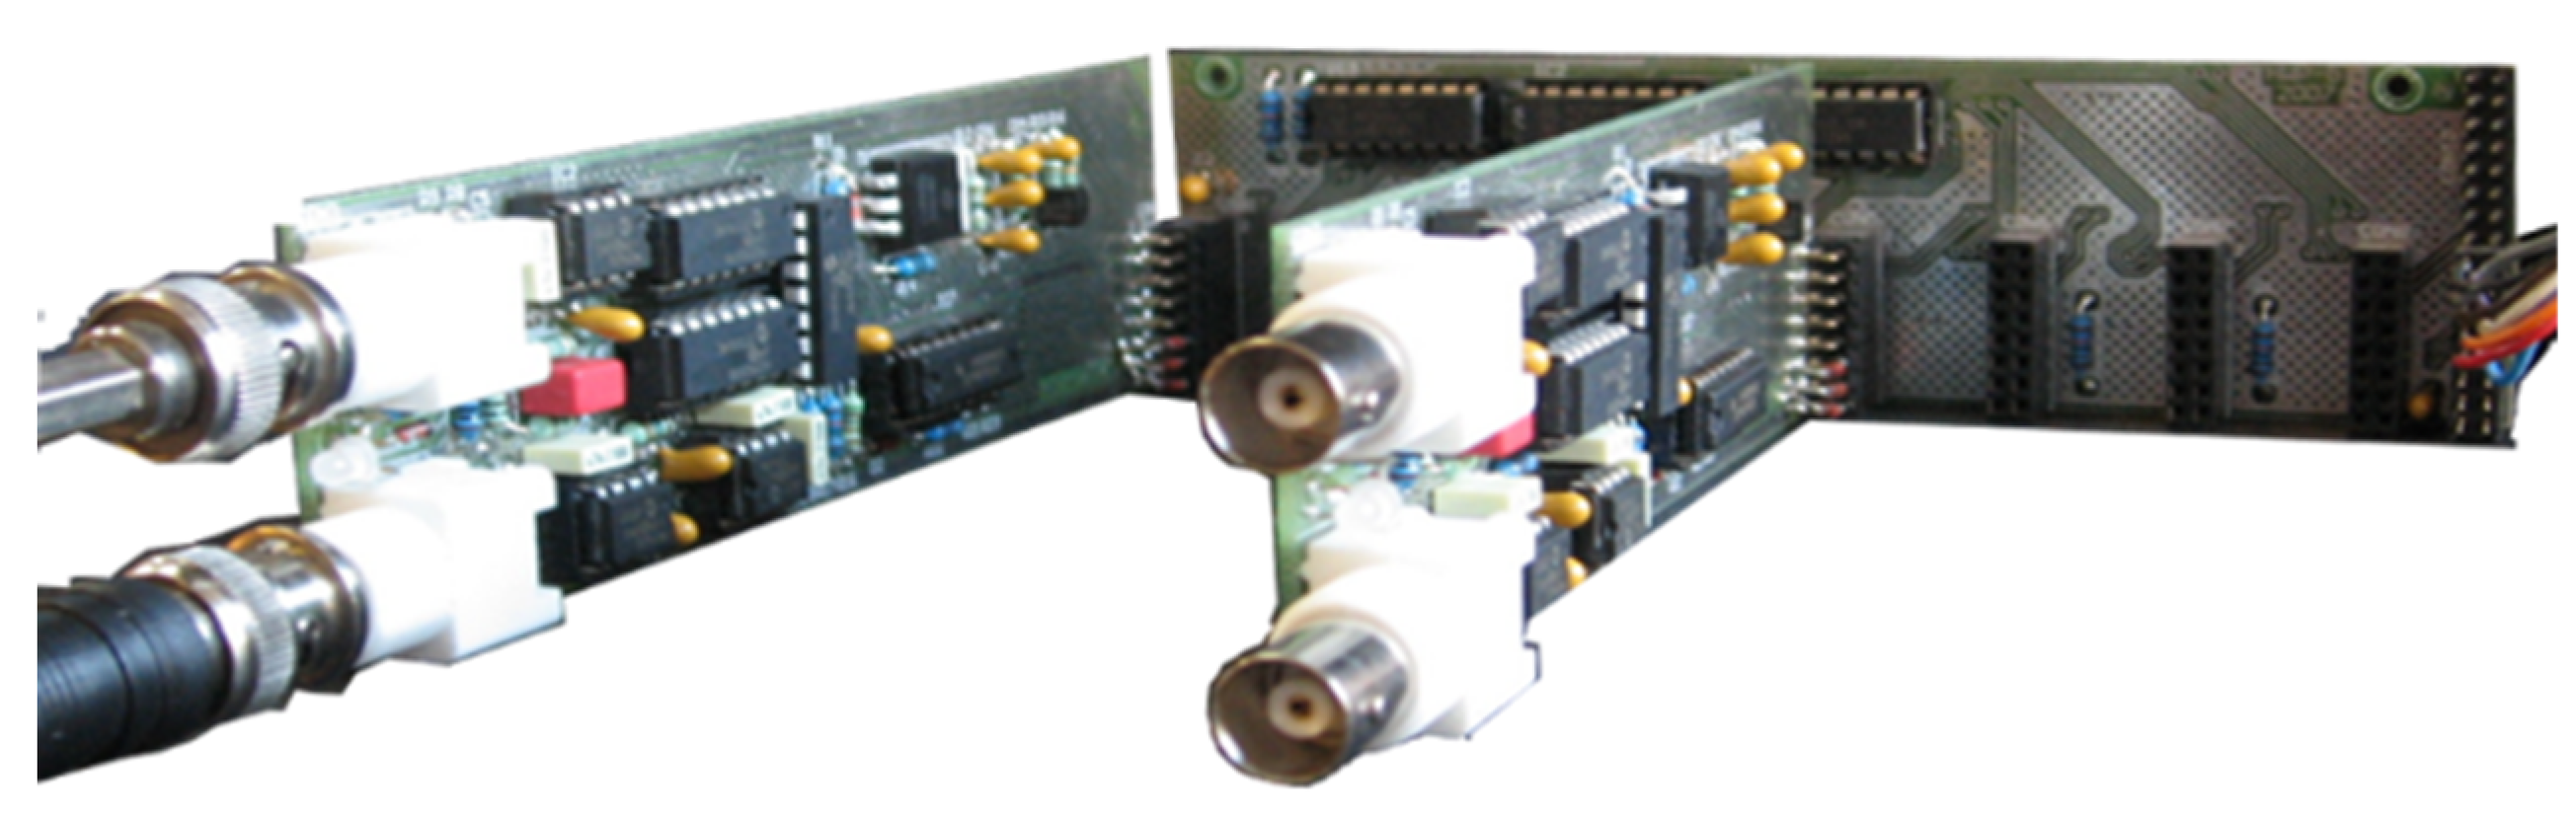
Based on this concept, an eight-channel measurement system enabling the measurement of flow velocity in a constant-temperature operational mode or the measurement of temperature in a constant-current mode was developed. The measurement system was presented in
Figure 3 and described in
Table 1. It consists of a communication module and eight measurement channels (two channels applied in
Figure 3) that can work as a constant temperature hot-wire anemometer or a constant current thermometer. The measurement system includes digitally controlled potentiometers responsible for setting the overheat ratio of the wire sensor, amplification of measured signal, and the control of the frequency and amplitude of rectangular voltage wave generated in one of the branches of the hot-wire anemometer’s bridge circuit. The processes of control and measurement data acquisition are realized with the use of a multifunction measurement card and dedicated software package developed in the LabVIEW environment.
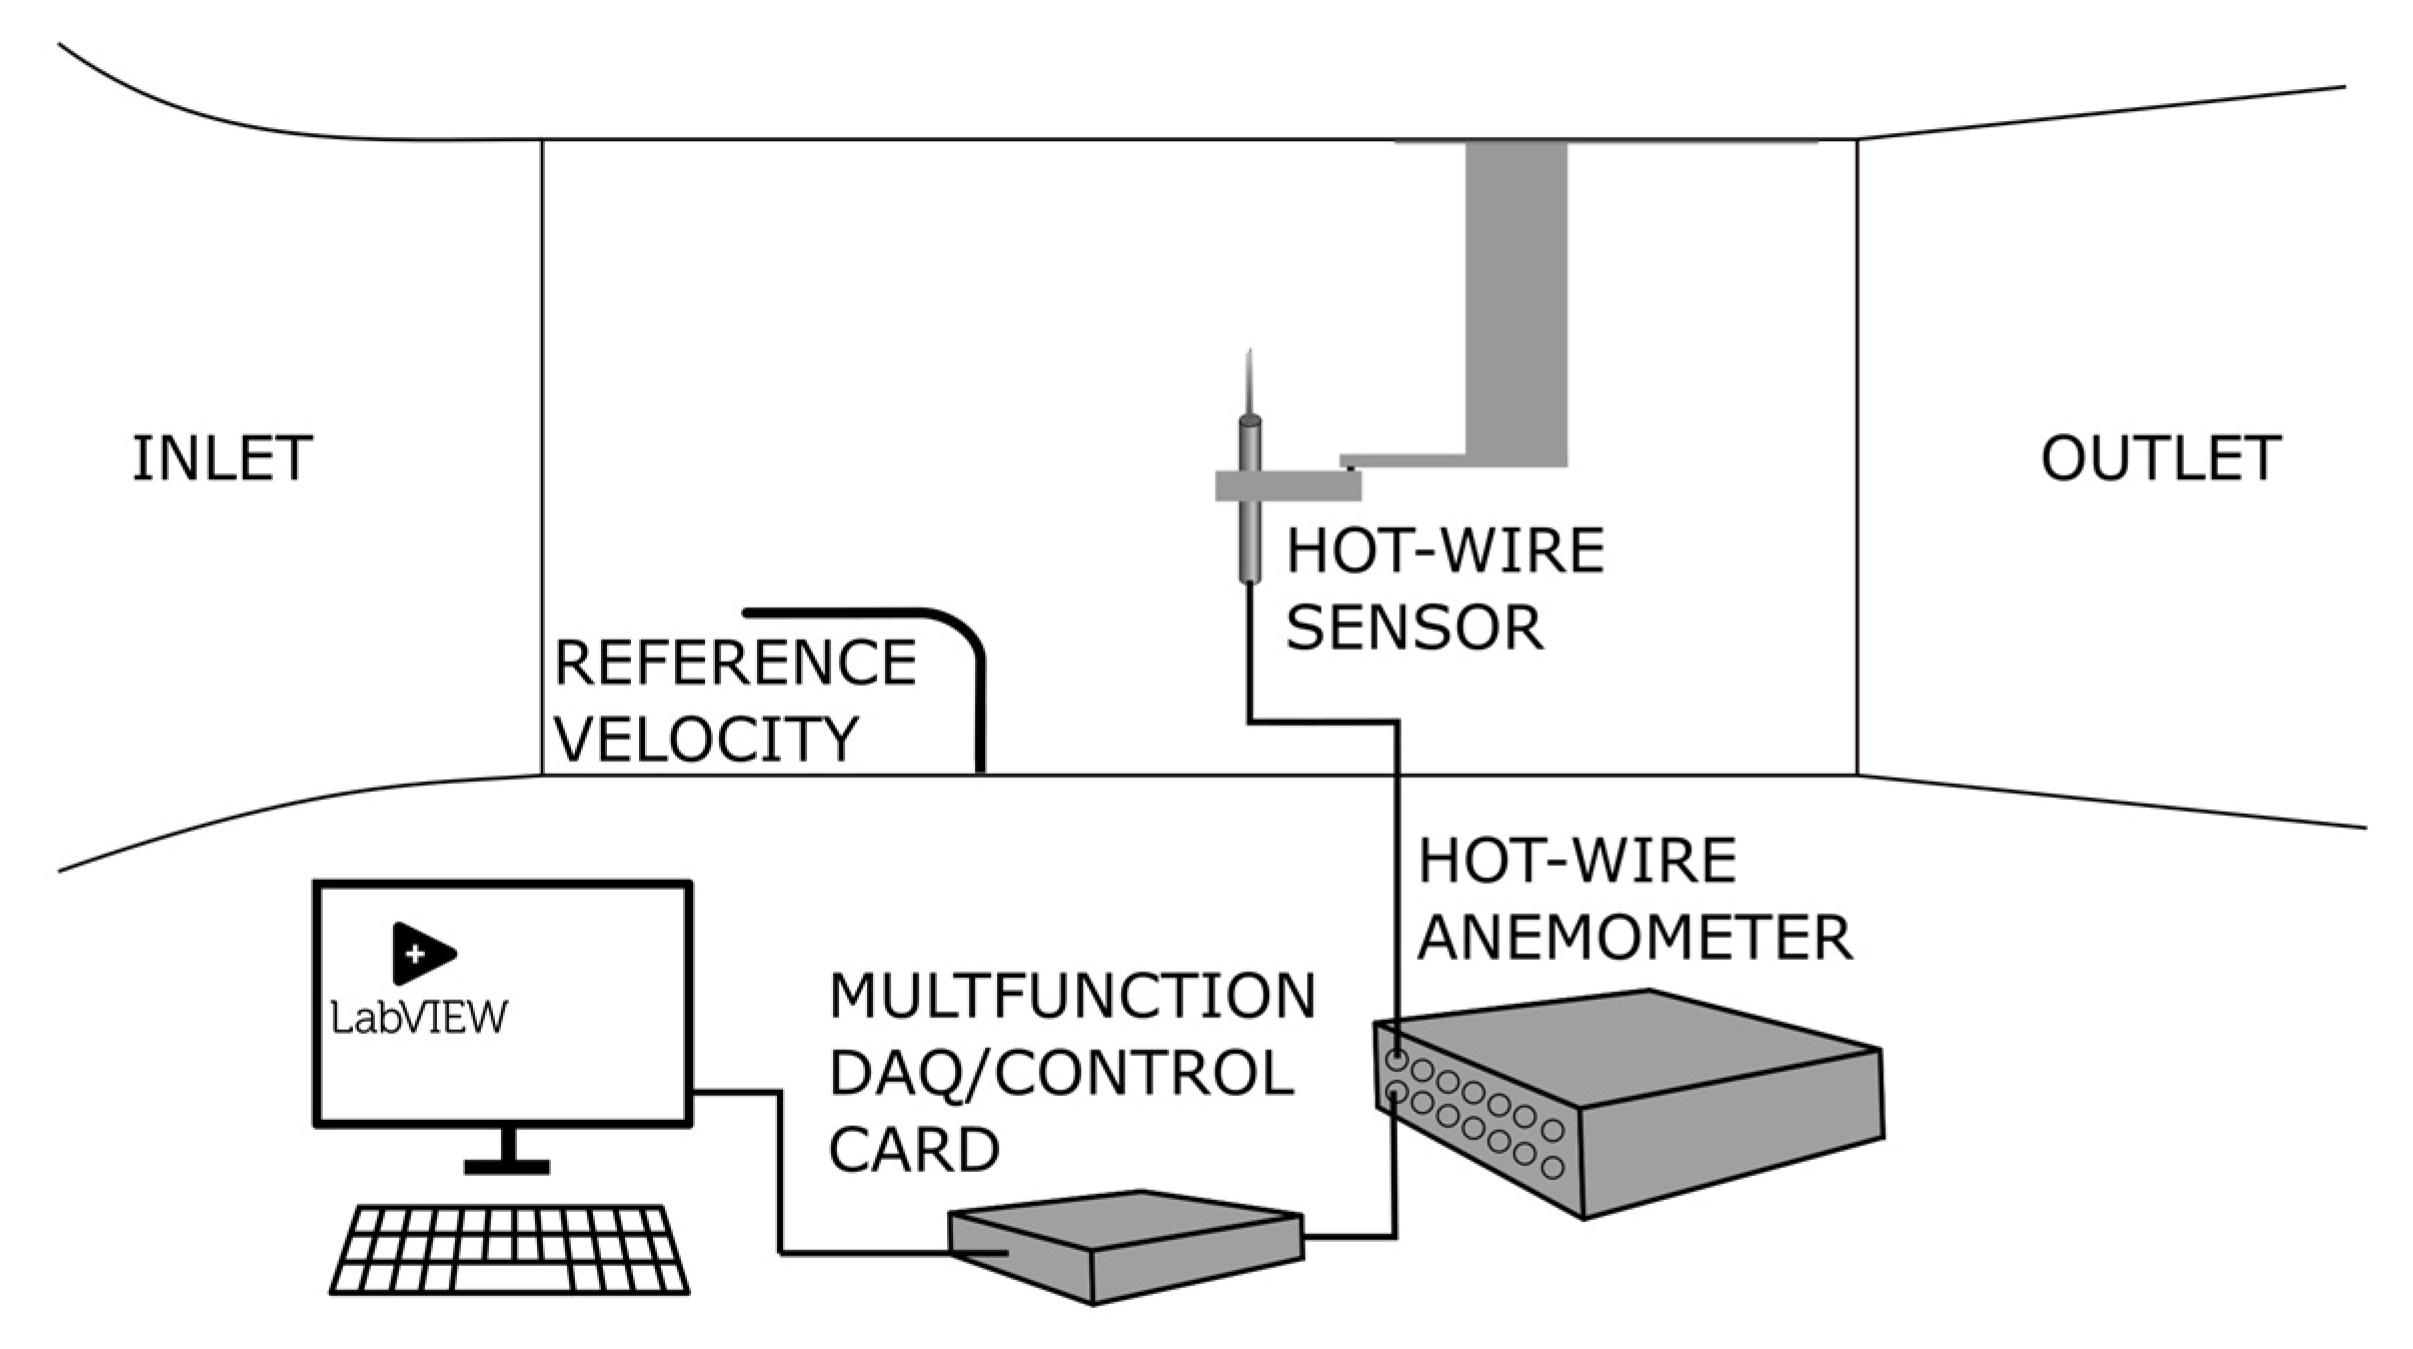
The properties of the system were tested in a laboratory wind tunnel, dedicated to the analysis of the characteristics of hot-wire anemometric probes, which allows us to generate flows with a velocity ranging from 0.1 to 17 m/s. Single-wire hot-wire anemometric sensors including wires 3 and 5 µm in diameter were used in the study. The scheme of the measurement setup is presented in
Figure 4.
Probes of this type are often used in flow experiments related to the study of turbulence. They are characterized by a large bandwidth up to 100 kHz depending on the diameter and material used. These probes have a unique properties such as resistance, which can cause changes in dynamic characteristics of the measurement channel, resulting in a non-optimal frequency measurement range.
During measurement experiments, the dynamic response of the system was generated by the rectangular voltage wave generator. The output signal was acquired under various measurement conditions. The frequency of the testing signal was adjusted such that it allowed the steady state of the system’s response to the leading slope of the rectangular voltage wave to be obtained before the trailing slope occurrence. Such frequency was equal to 1 kHz. The output signal was registered as the voltage across the measuring wire URS, with the sampling frequency of 25 MHz.
4. Manual Adjustment of Dynamic Properties of the Measurement System
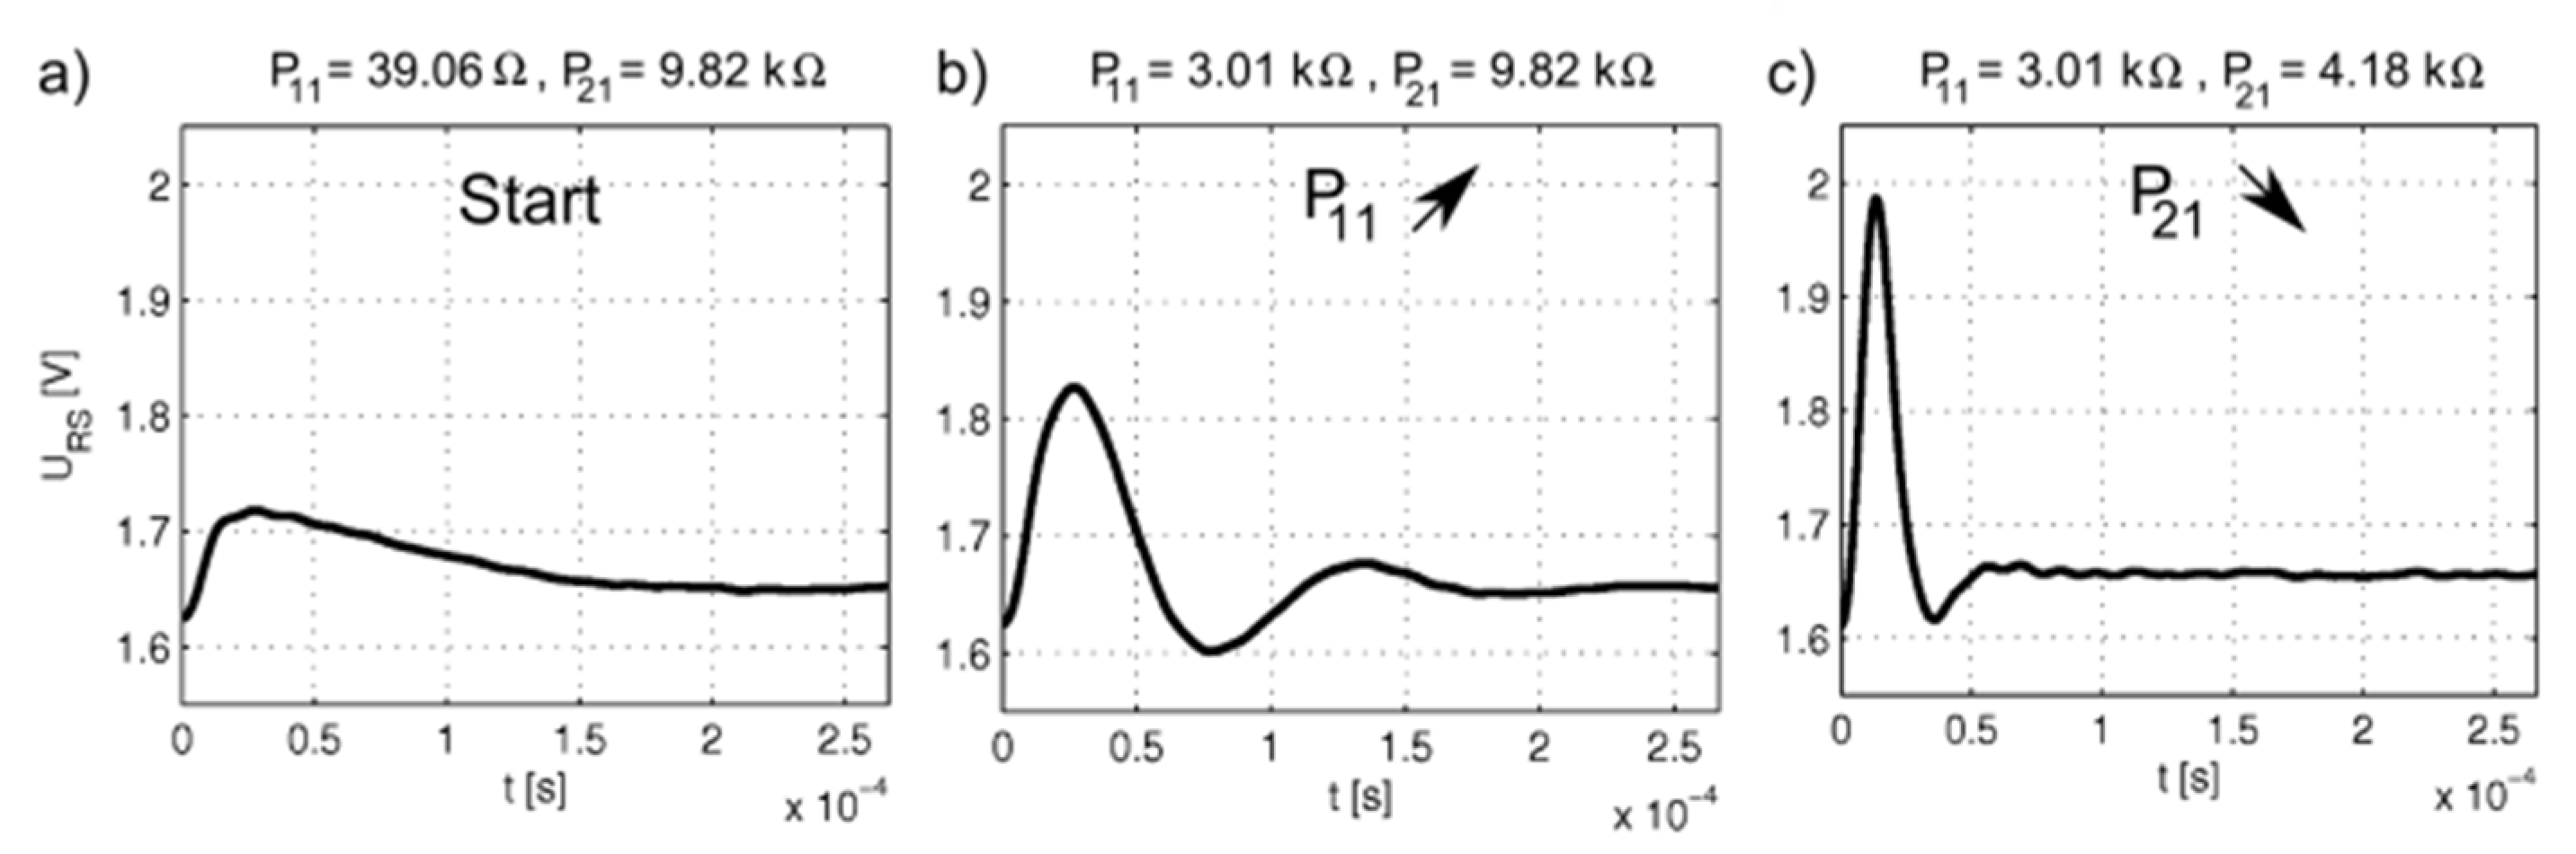
In the first stage of the study, the possibility to adjust the developed measurement system was verified. The system included a probe with a 3 µm-diameter measuring wire and was placed in a flow of which the velocity was 5 m/s. Subsequently, the setting of adjustment potentiometers P
1 and P
2 was changed. The adjustment started from starting values of resistance P
11 (39.06 Ω) and P
21 (9.82 kΩ), which ensured the stable yet slow response of the system to variable excitation—
Figure 5a. During the initial stage of the experiment, the value of resistance P
11 was increased until the moment, in which the response of the system was characterized by the occurrence of consecutive overshoots. One of the objectives of the regulation was to find such a value of P
11 that oscillations in the dynamic response of the system began to appear, not leading to unstable operation of the system. Such oscillations should still be possible to reduce by adjusting the potentiometer P
2. Once such a boundary (
Figure 5b) is found, it is possible to fine-tune the response of the measurement system.
In the case under investigation, such a response was recorded for P
11 equal to 3.01 kΩ. Such a preoptimized measuring system was the basis for the final optimization using the P
2 potentiometer—
Figure 5c. By decreasing the value of resistance P
21, one may obtain an optimal dynamic response of the measurement system characteristic of a fifteen-percent overshoot.
During adjustment performed in the above-described way, it is crucial to determine the optimal value of resistance P11, as the response of the measurement system with the characteristics ensuring the maximum bandwidth frequency can then be obtained by adjusting the setting of potentiometer P2. Excessively increasing the value of resistance P11 or decreasing the value of resistance P21 results in the unstable operation of the hot-wire anemometer, shown by means of unfading oscillations of the voltage response of the system to testing excitation and may lead to damage of the measuring wire.
5. Automatic Adjustment Algorithm of Dynamic Properties of the Measurement System—Experimental Case
The performed experimental study confirmed the possibility of dynamic properties of analyzed measurement system to be adjusted. It allowed for the algorithm enabling the automatic adjustment of the measurement system to be applicated and successfully implemented. The aim of such automatic adjustment is to find optimal settings of potentiometers P
1 and P
2 to ensure that maximum bandwidth frequency of the measurement signal is obtained. The algorithm is divided into four stages, during the realization of which the character of the hot-wire anemometer’s dynamic response changes from the initial stable but slow response to final optimal one, consistent with the one presented in
Figure 1.
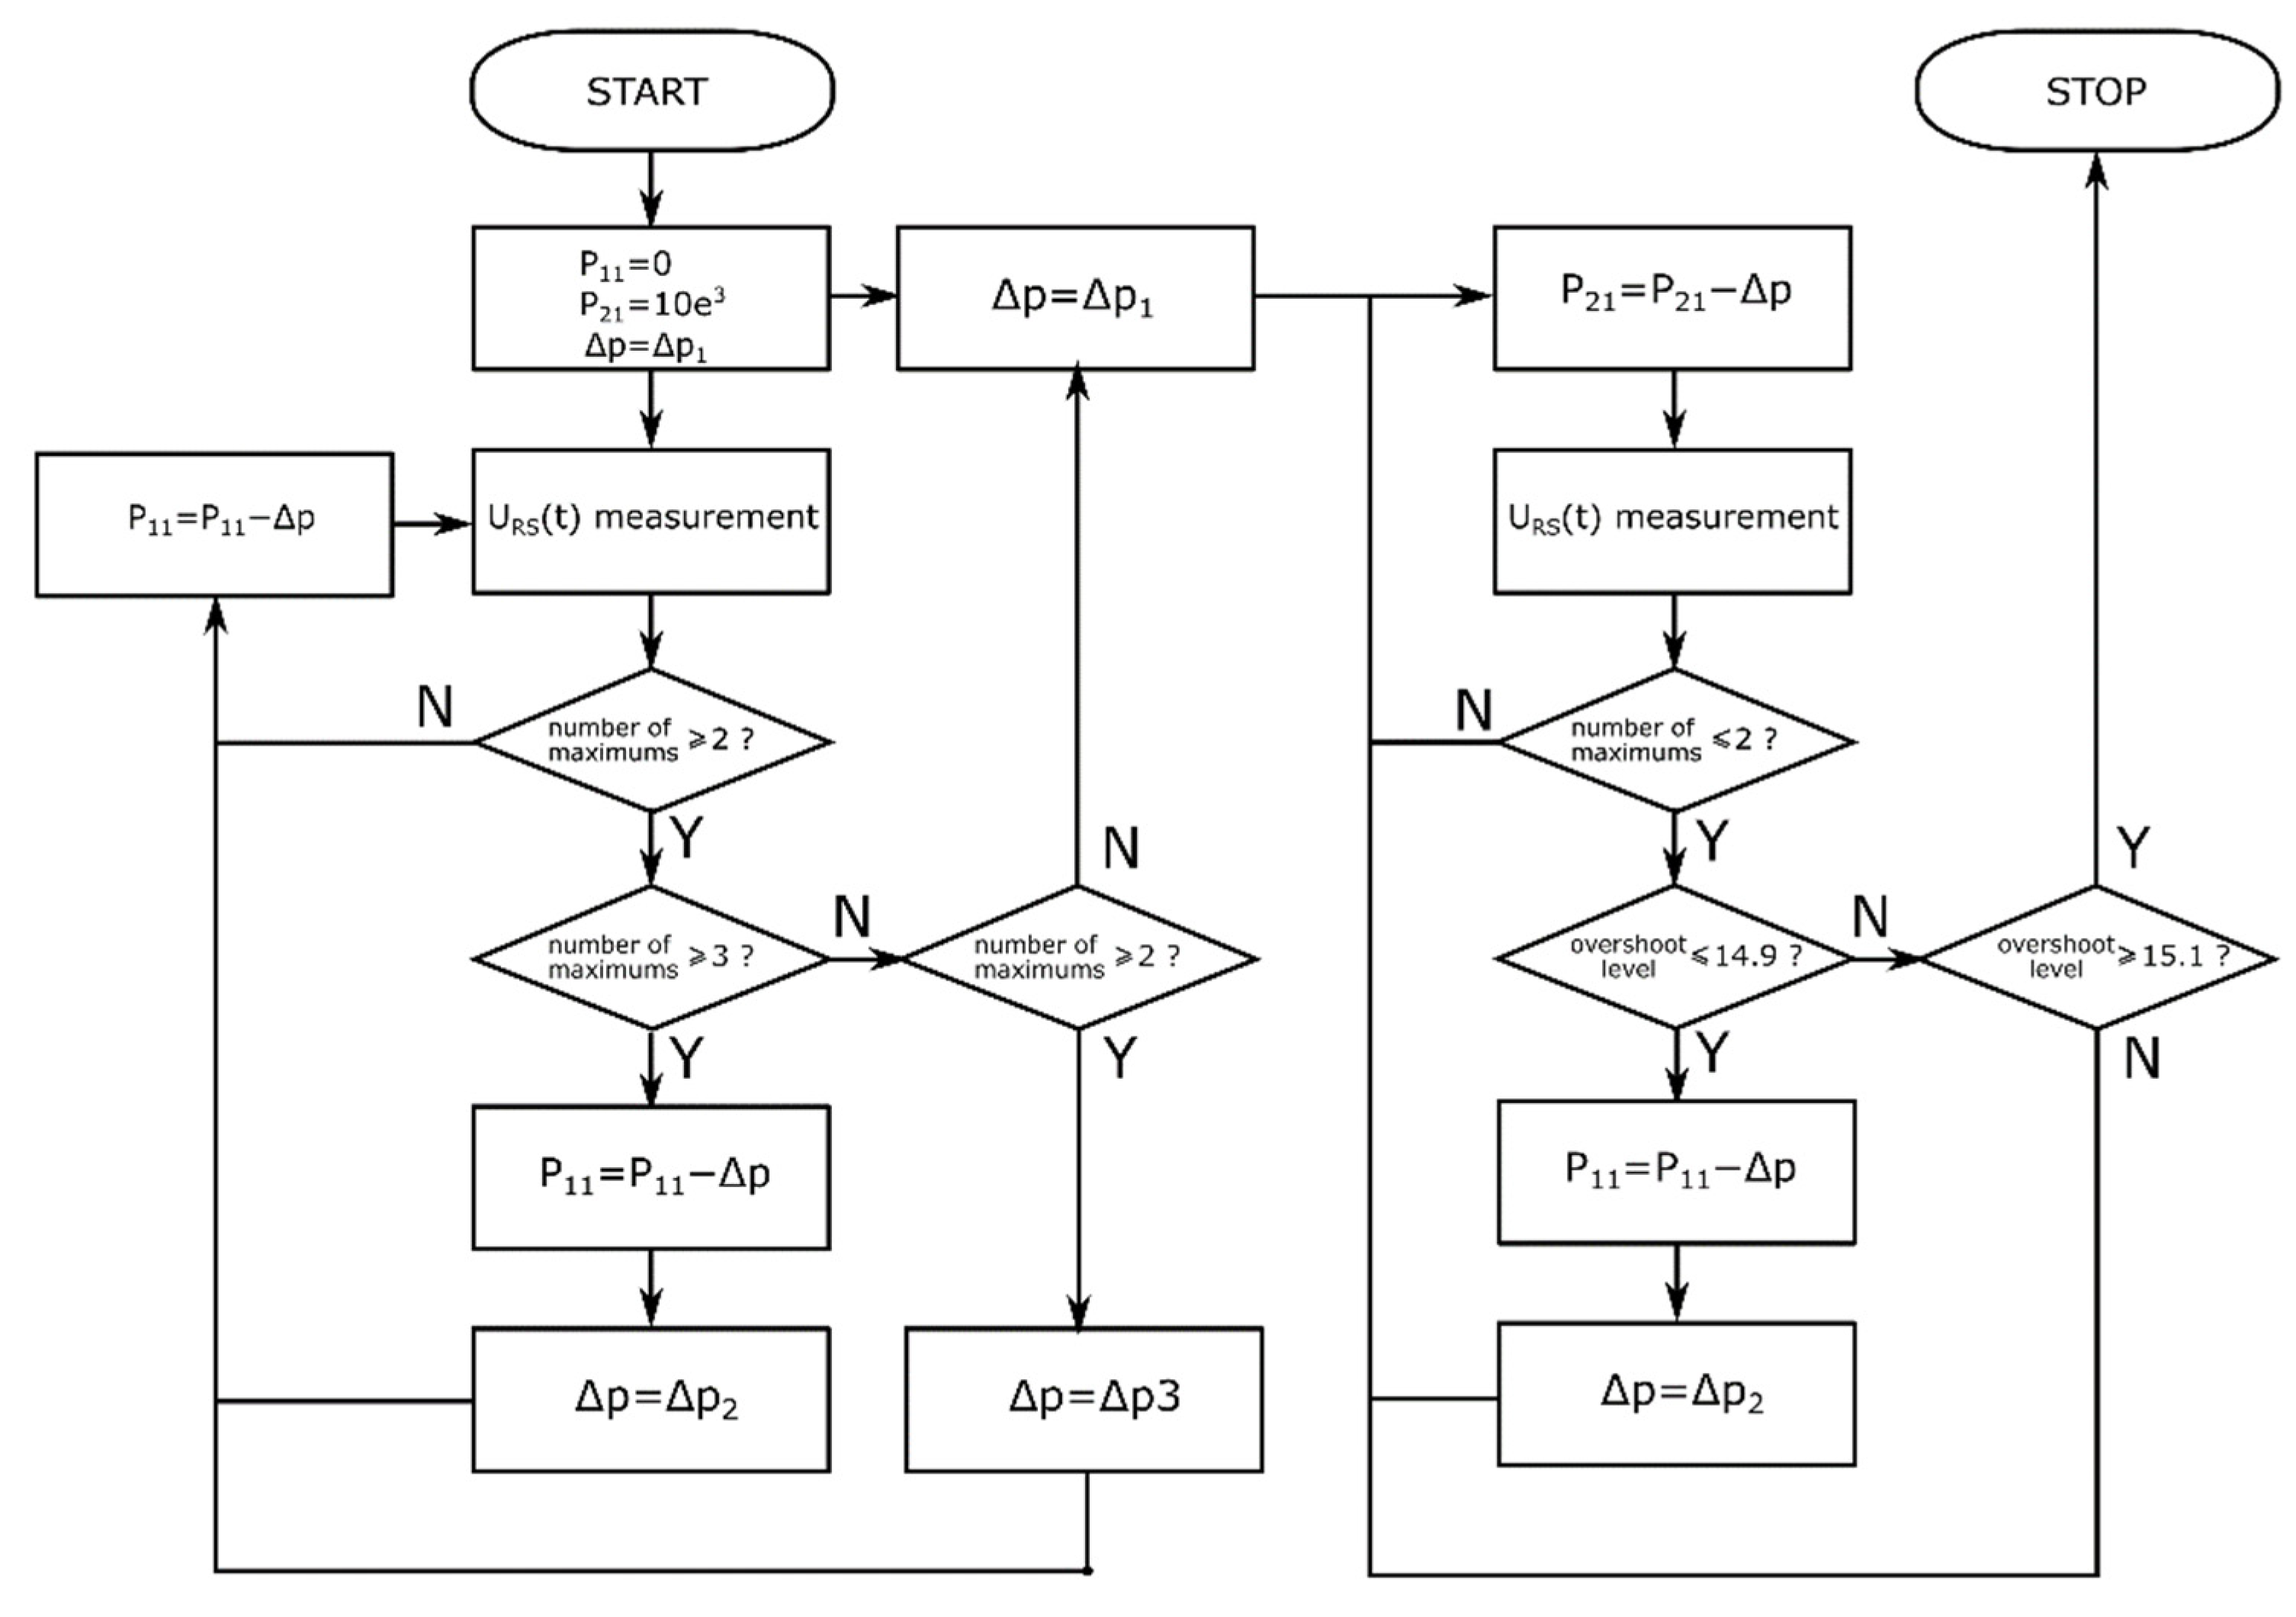
The detailed operation of the discussed adjustment algorithm can be explained with the use of the block diagram describing the individual steps of its implementation—
Figure 6. In the initial phase, the P
1 potentiometer settings are increased with the assumed step Δp, until the dynamic response of the object with three maxima is obtained. If, in the response of the control system, the number of peaks is greater than three, it returns to the previous value of P
11 and decreases the value of the step Δp. In the case where there are two maxima in the object response, the value of Δp is also decreased. The adjustment process is repeated until the obtained number of maxima in the dynamic response of the object is three. The fulfilment of this condition ends the control with the potentiometer P
1 and starts decreasing the value of the resistance P
21 on the potentiometer P
2 with the set step Δp. For each of the successive values of the P
21 resistance, the dynamic response of the system is recorded. The adjustment process lasts until the optimal dynamic response of the hot-wire measurement system is achieved with the assumed accuracy of the first overshoot. First, the number of maxima is checked, which in the ideal case should be one. Then, by appropriate selection of the control step value, the level of 15% of the first overshoot is reached. After achieving the assumed level of accuracy, the frequency response of the system is determined.
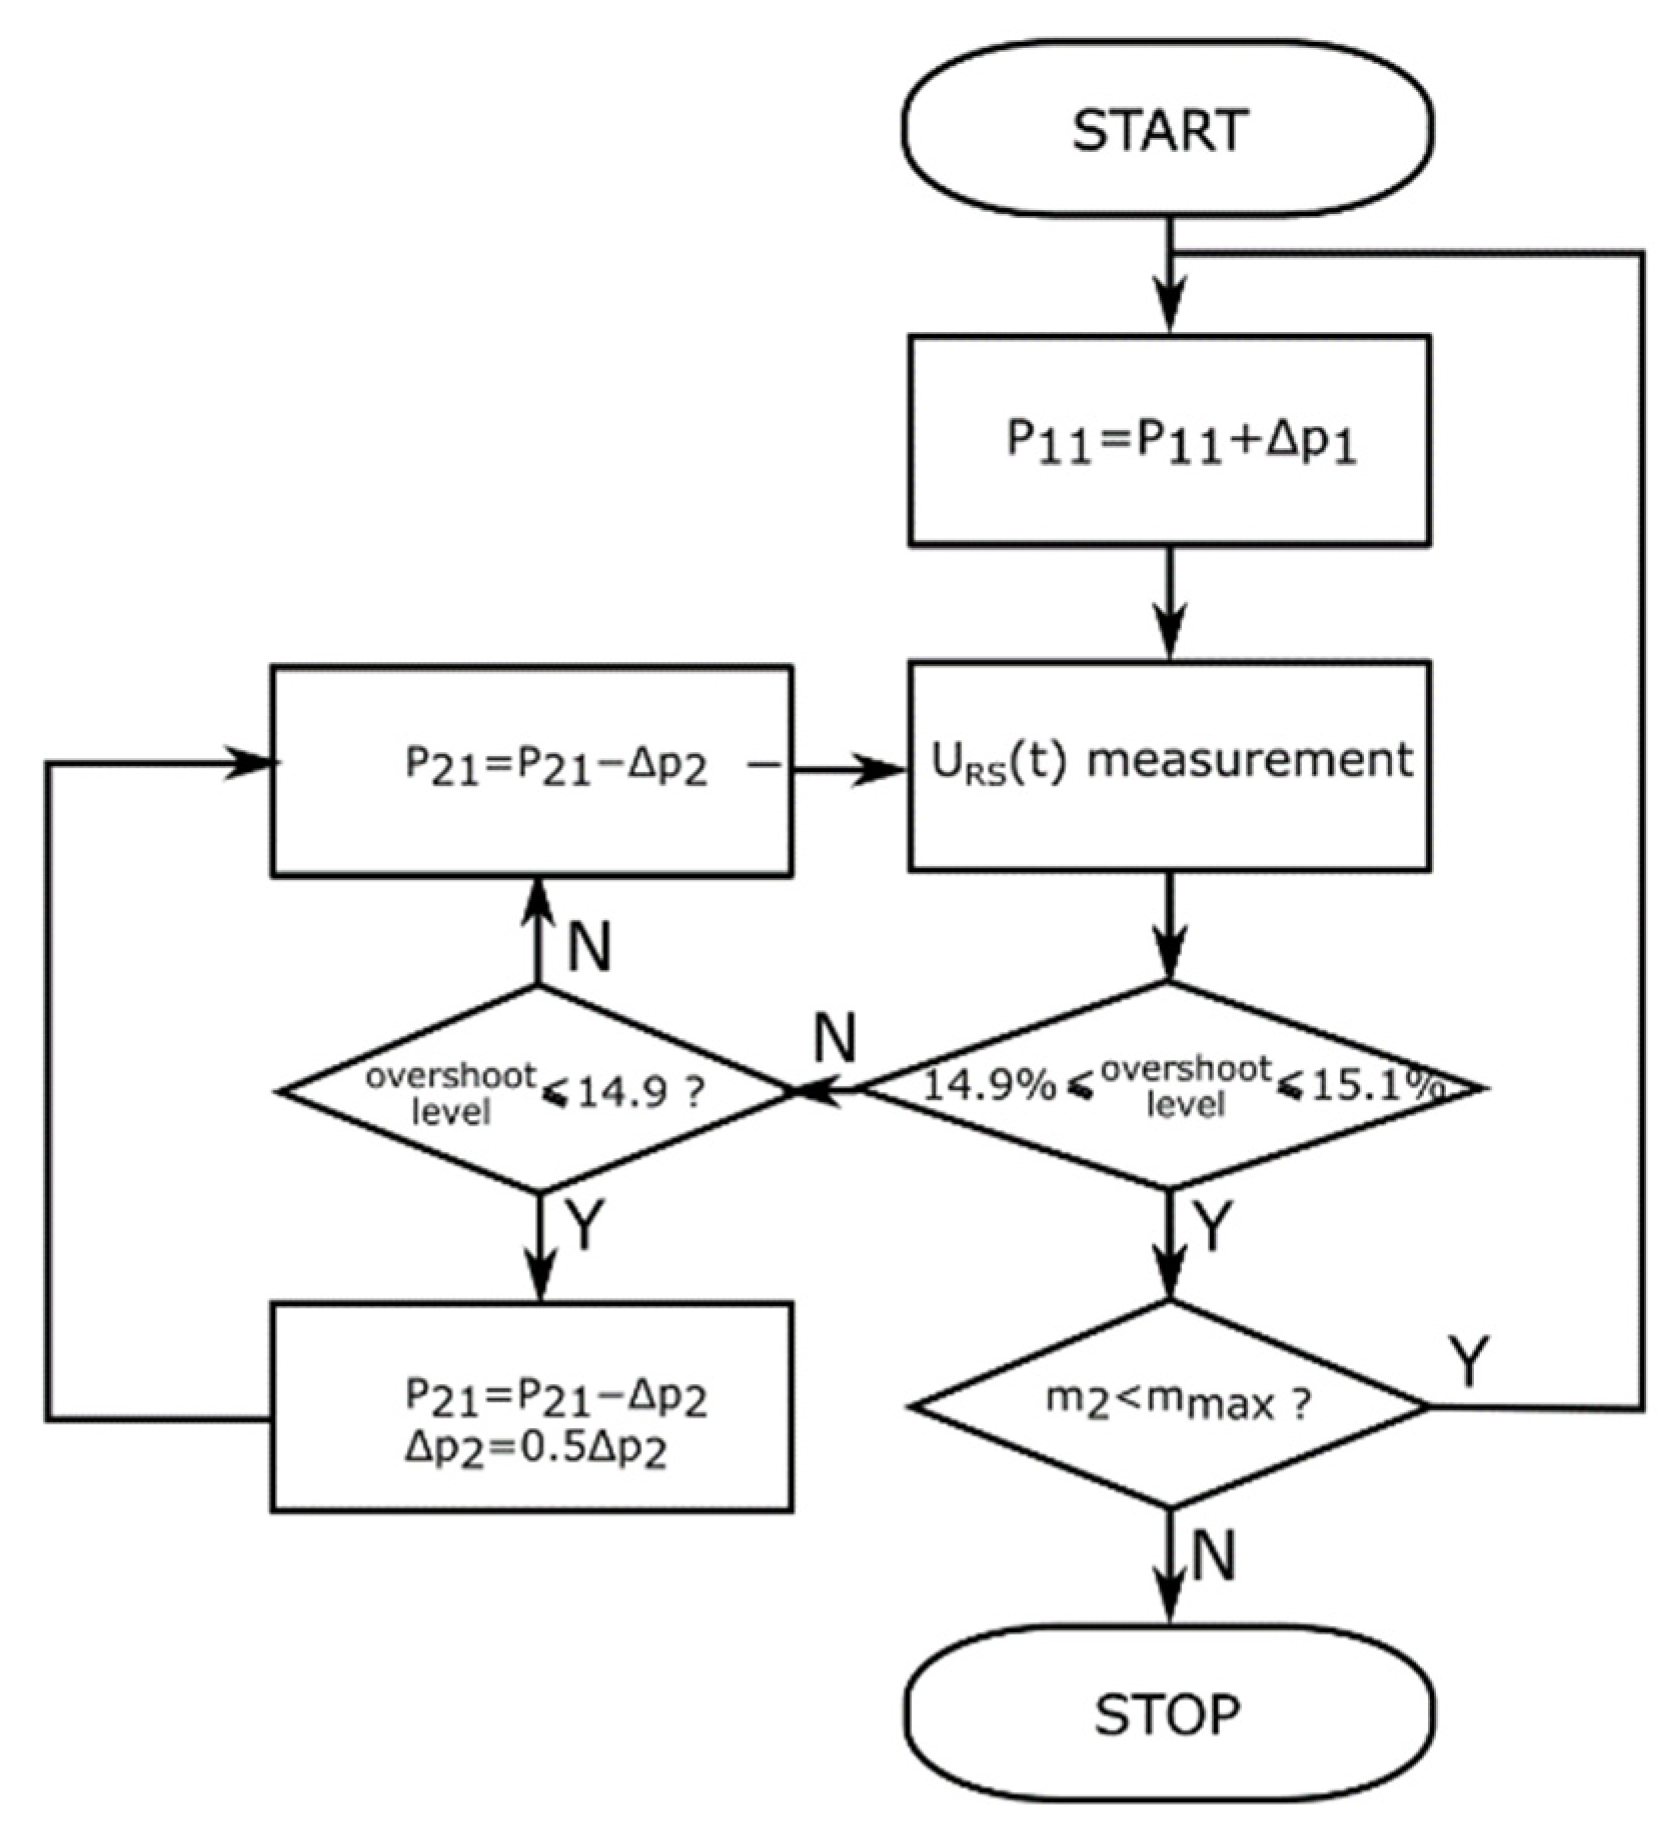
This method of regulation ensures quick tuning of the system in terms of its dynamics. However, the manual configuration shows that it is possible to achieve a wider frequency response. This requires additional, fine system adjustment. The assumption of the final control is to obtain the maximum possible bandwidth for various configurations of the system and for various measurement conditions. The optimization algorithm (
Figure 7) starts with the resistance values P
11 and P
21 obtained as a result of the preoptimization. In the first step, the resistance P
11 is increased by the value Δp
1. Then, on the basis of the performed measurement of the dynamic response of the system, the overshoot value is checked. If it is lower than 14.9%, the value of Δp
2 is reduced by half, and the resistance P
21 is increased by the new value of Δp
2. In the case when the obtained overshoot is greater than 15.1%, the resistance P
21 is decreased by the value of Δp
2. Each time the resistance value changes, the dynamic response of the system is measured. The process of such regulation lasts until the response with overshoot in the range of 14.9–15.1% is obtained.
Obtaining the optimal frequency response is associated with obtaining an ideal dynamic response characteristic with one maximum. Appearance of the next maximum determines its overshoot, therefore the level of the next maximum in relation to the set value can be treated as a criterion of the final regulation. If this criterion is met, the value of resistance P11 is increased by Δp1, and the variable Δp2 is assigned an initial value. The optimization algorithm ends its operation when it is impossible to find for the next P11 value increased by the step Δp1 the resistance value P21 ensuring the reduction of the second maximum level below the limit mmax.
6. Automatic Adjustment of Dynamic Properties of the Measurement System—Experimental Case
The presented algorithm was implemented in the measurement system and tested in various configurations (3.5 and 8 µm probes, various cables connecting the sensors with the anemometer, velocities, etc.).
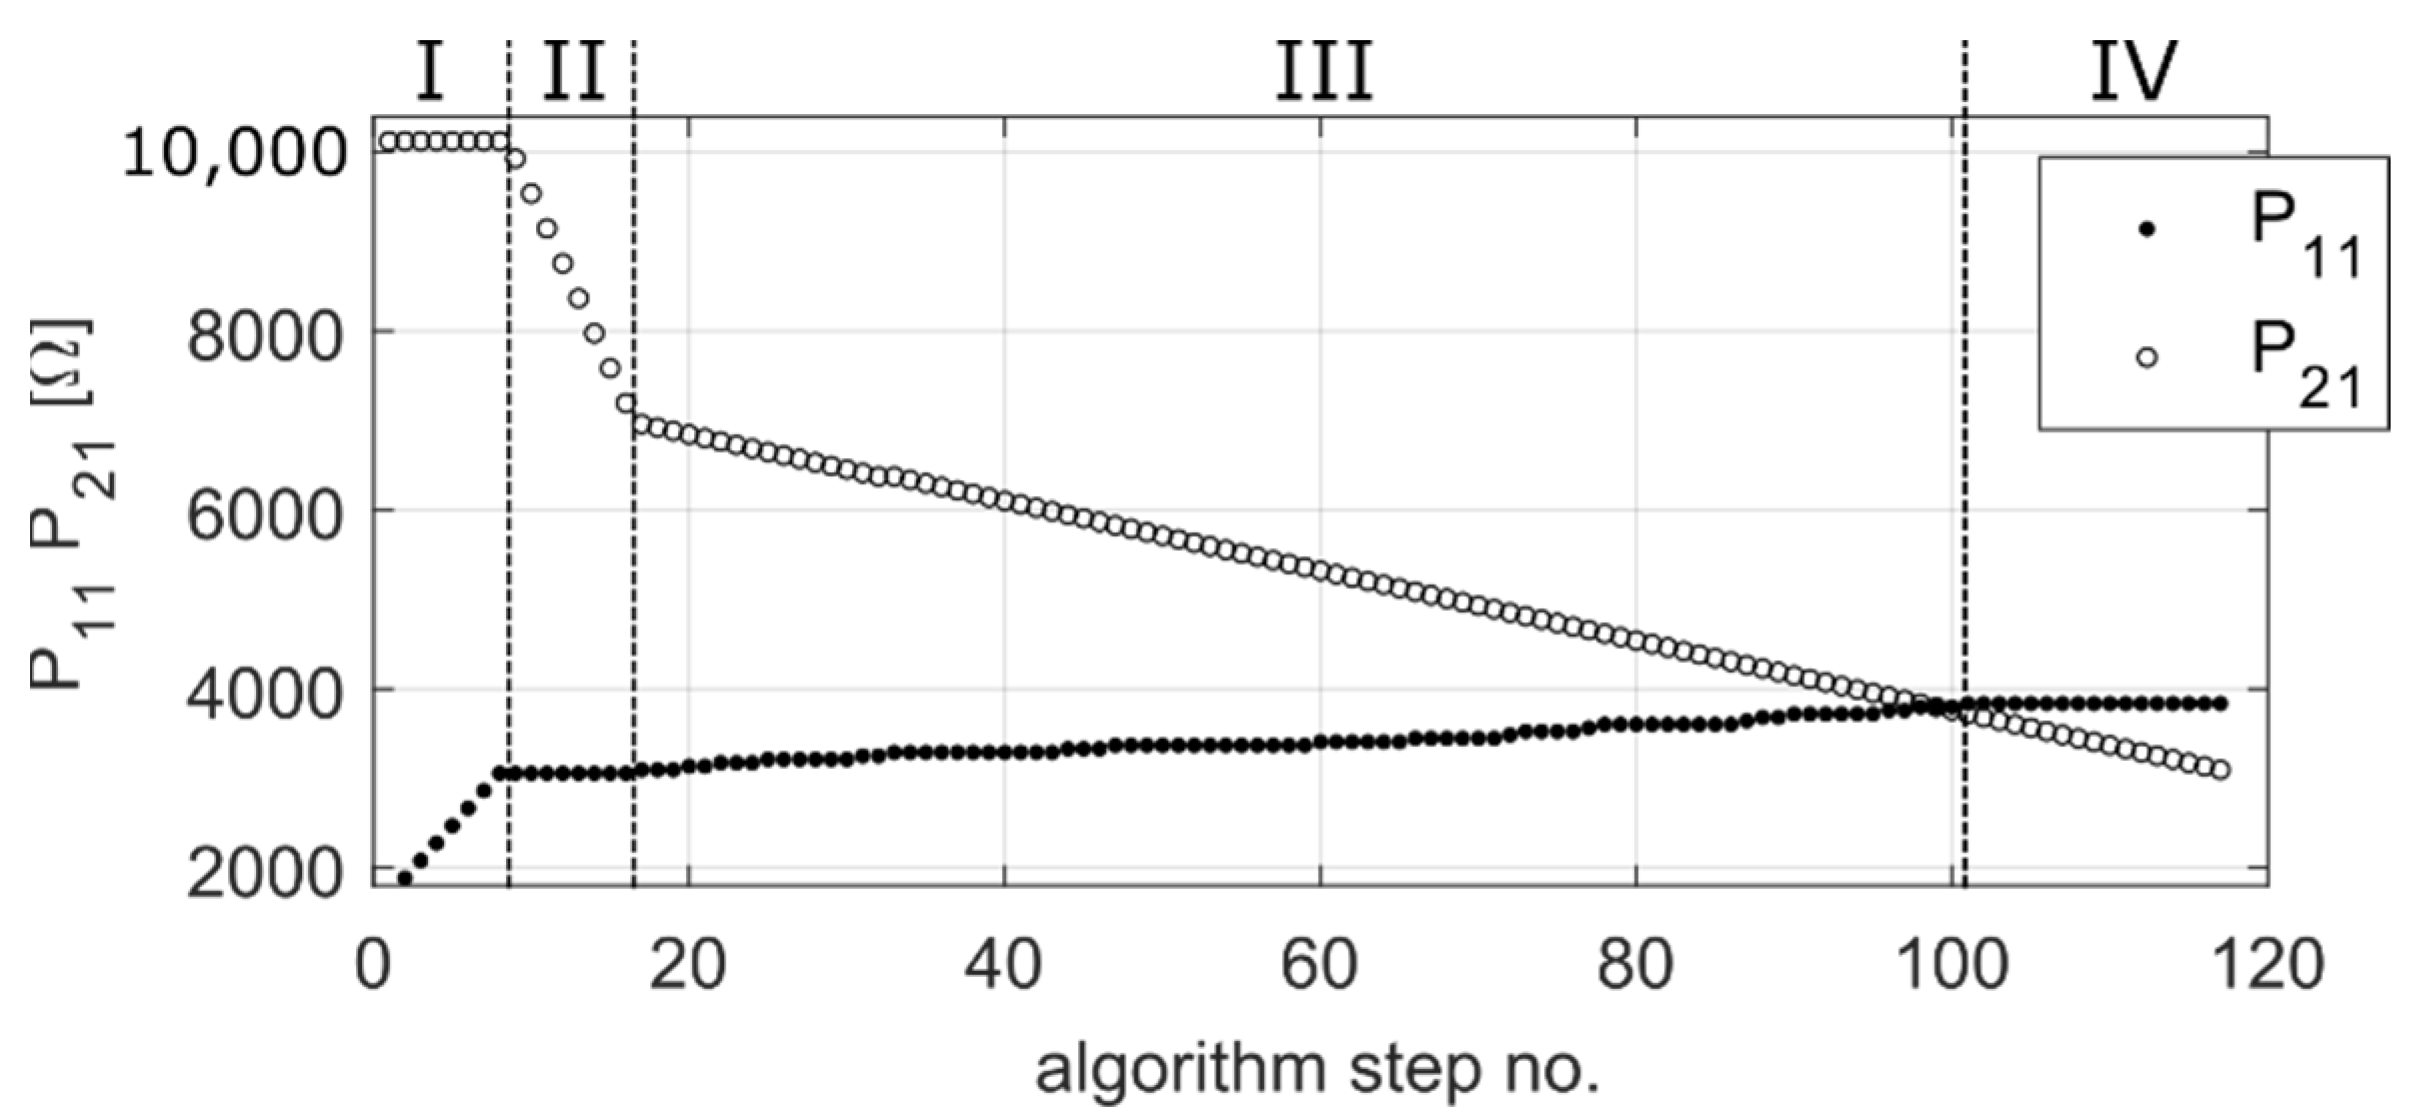
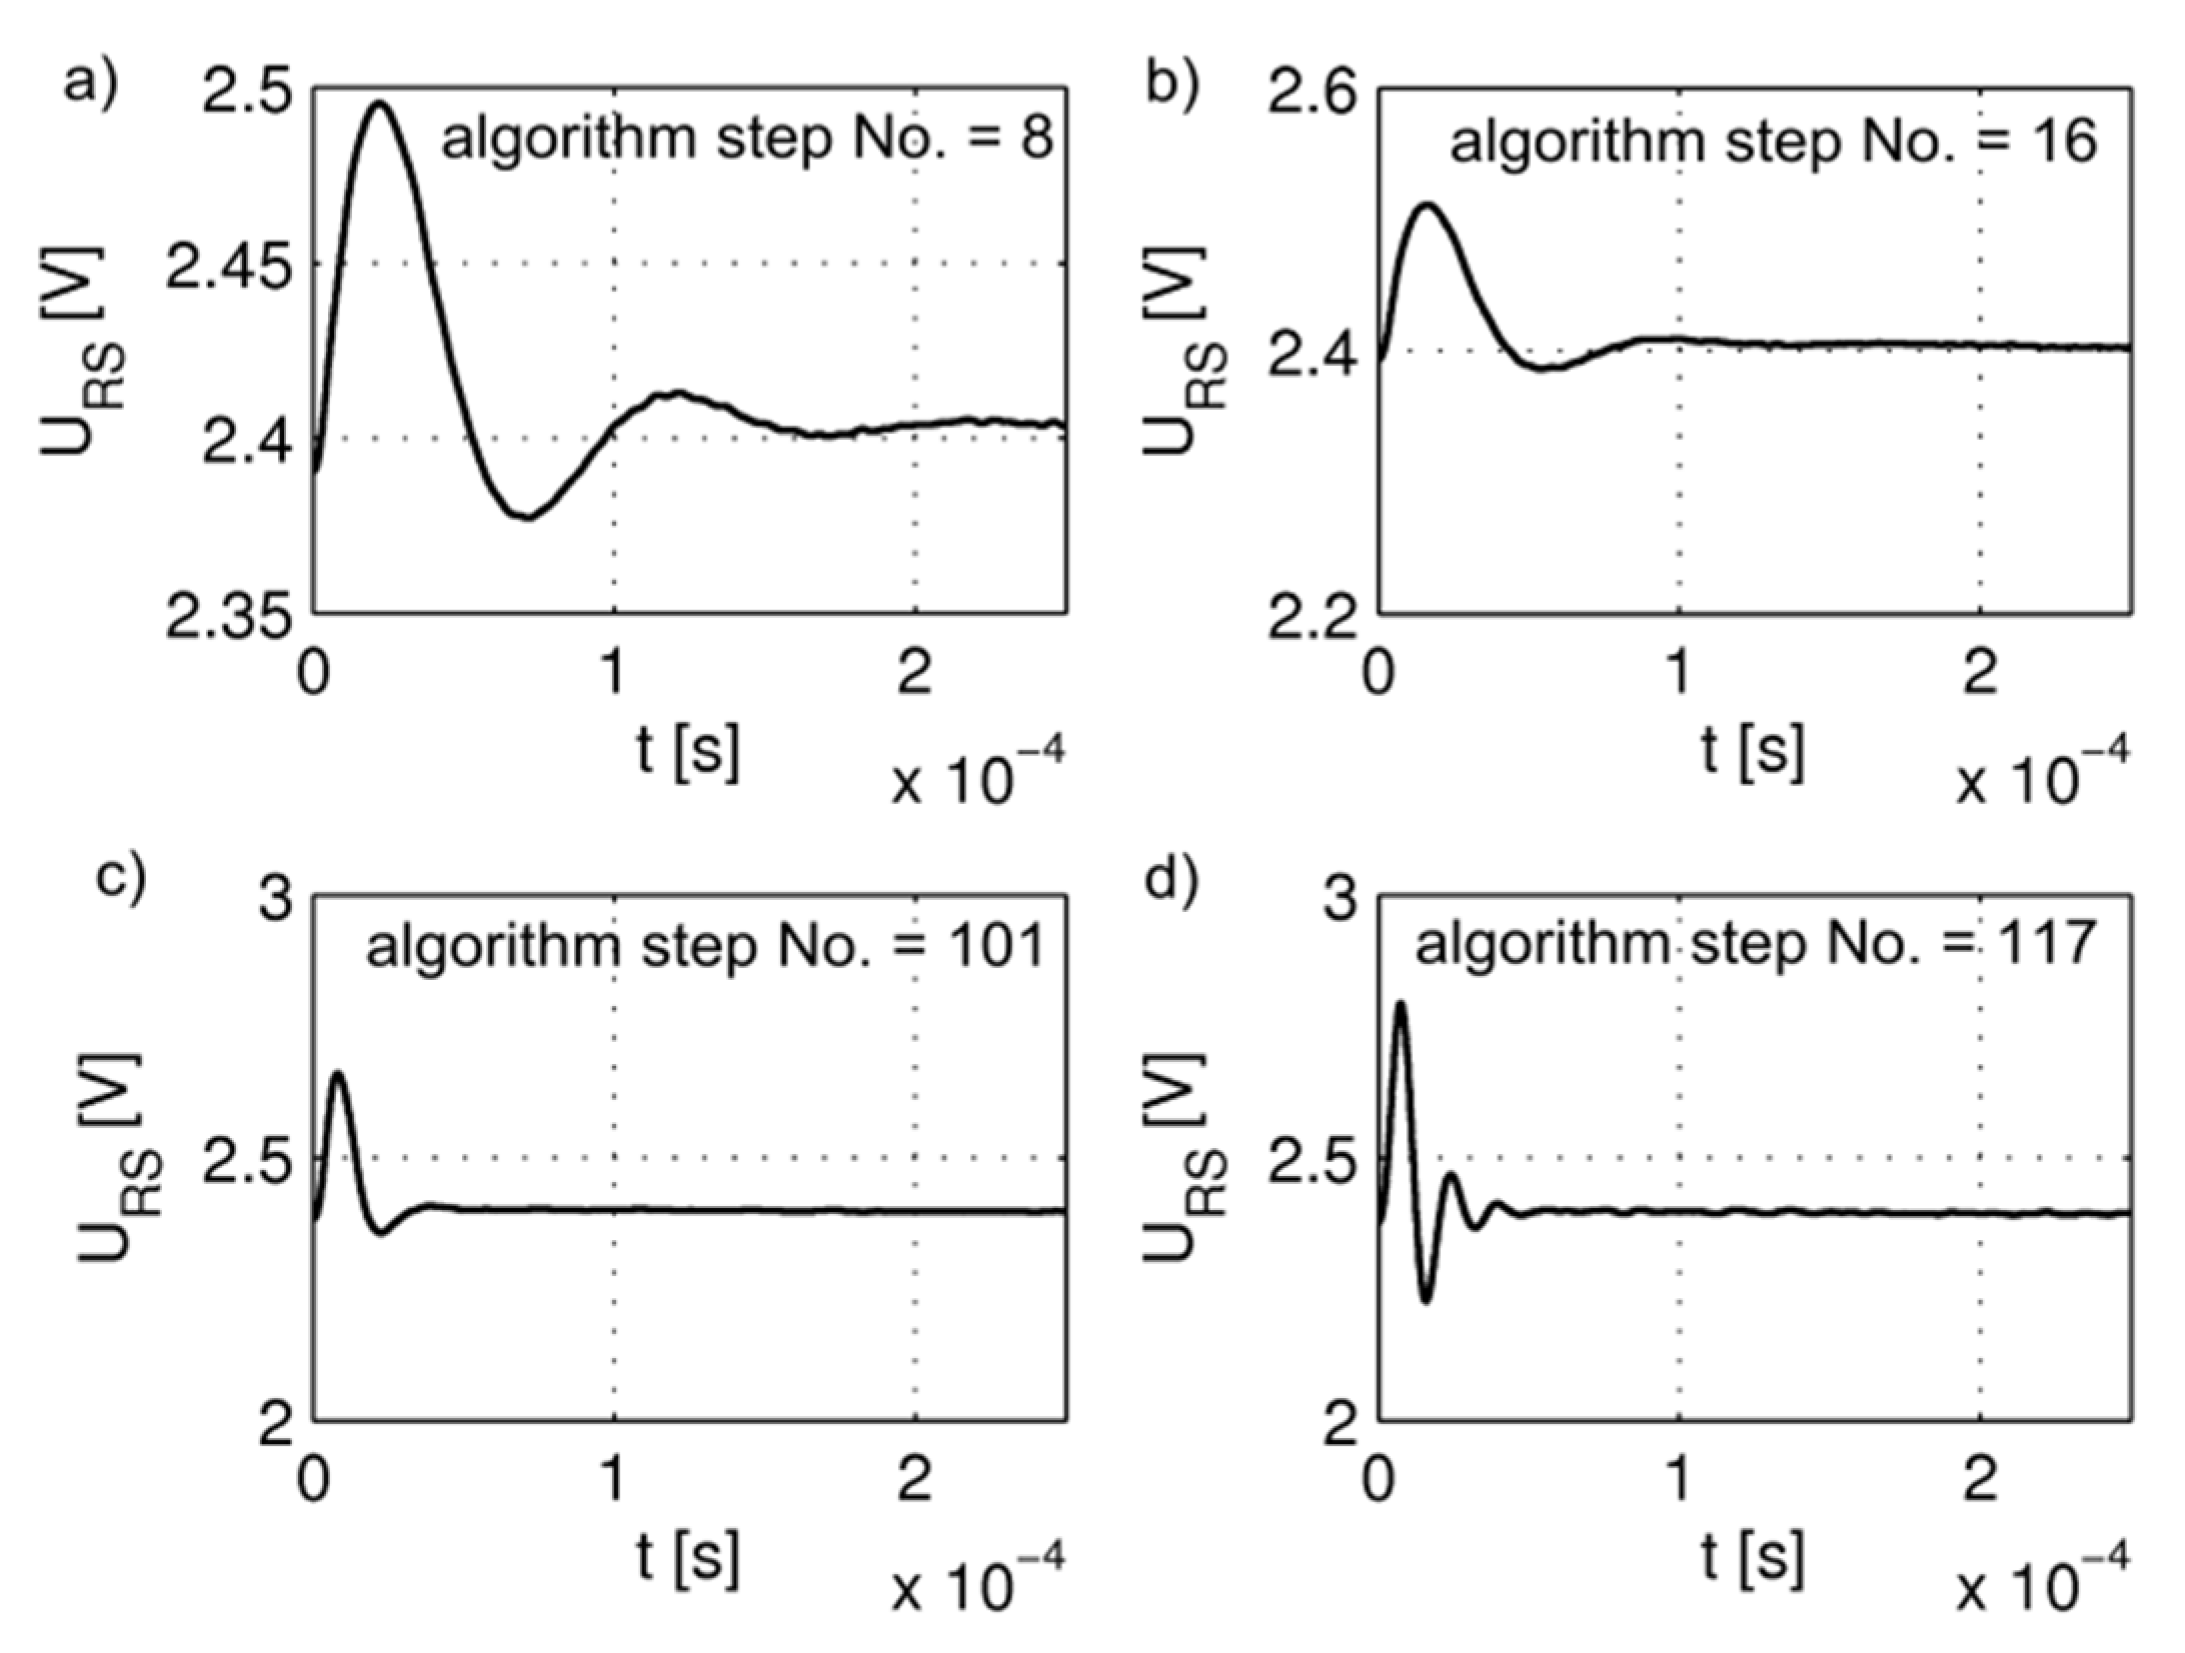
Figure 8 shows the next steps of the algorithm implementation. It contains a graph of changes in the resistance of the potentiometers during the automatic adjustment process. The example of the process of automatic adjustment shown here refers to study performed upon the measurement system connected to the sensor including the wire of 5 µm in diameter, placed in the air flow of velocity of 15 m/s.
In the first stage of the process of automatic adjustment, the value of resistance P
11 is increased in eight iterations from 1.69 to 3.05 kΩ with the value of resistance P
21 being simultaneously kept constant at the value of 10.13 kΩ. At the same time, the dynamic response of the measurement system is automatically analyzed. The second stage of the adjustment process starts once the system’s response characterized by the occurrence of third maximum of assumed level is obtained (
Figure 9a). The value of resistance P
21 is gradually reduced until the recorded signal of the dynamic response is fifteen percent over-regulated (
Figure 9b). In the example of the presented measurement, this takes place after the next eight iterations, following which the second stage of the process of preliminary optimization of the hot-wire anemometric measurement system is finished, and the resistances P
11 and P
21 are set to values 3.05 and 7.20 kΩ, respectively. The bandwidth frequency obtained in this way equals 20.15 kHz.
The third stage of adjustment realizes the algorithm of optimization of the hot-wire anemometer’s dynamics, consisting of increasing the resistance P
11 with the least possible step, the value of which is given by the resolution of settings of the adjustment potentiometers. For gradually increasing values of the resistance P
11, appropriate values of resistance P
21 (decreasing) ensuring the model characteristic of the dynamic response of the system are sought. Individual consecutive settings allowing for the above-mentioned dynamic response to be obtained are recorded until the maximum value of bandwidth frequency is obtained. In the case of the example presented, such a frequency was equal to 44.92 kHz (
Figure 9c).
Further adjustment causes additional over-regulation maxima to appear in the dynamic response of the hot-wire anemometric system, which as a consequence leads to an unstable operation of the system. In order to prevent the system from reaching this state, the number of consecutive maxima and amplitude of over-regulations are analyzed in the fourth stage of the process of automatic adjustment. If the parameters of the response of the measurement system, i.e., the number of recorded maxima and their amplitude level (
Figure 9d), exceed beyond the preset boundary values, the optimization process is terminated and the values for which the optimal value of bandwidth frequency of the system was obtained in the third stage of the process are taken as final settings.
7. Application of the Hot-Wire Anemometer with Automatic Adjustment of Its Dynamic Properties
One of the main factors influencing the dynamic properties of hot-wire anemometric measurement systems is the mean value of flow velocity. It is related to the intensity of heat exchange between the measuring wire and flowing medium. Due to the optimization of hot-wire anemometric measurement systems to low velocities, the initially obtained response of the system, which is ideally adjusted for high velocities, becomes distorted. In the dynamic response of the system, additional overshoots begin to appear, which leads to a considerable confinement of the whole system’s transmission band. Therefore, at the stage of planning of hot-wire anemometric measurement systems, their dynamic response is adjusted to high values of velocities. This allows the risk of damage to the measurement probe to be eliminated when performing measurement in high-velocity flows. It does not eliminate the problem of reduction of bandwidth frequency in measurements in which the mean value of velocity is lower than the one for which the system was optimized at the stage of planning. When performing the multi-point measurements, it is also necessary to use various measurement probes. As shown by the study [
22], the type of measurement probe used for the measurement is of crucial importance with respect to dynamic characteristics of the measurement system, and the use of different types of measurement probes (i.e., different wires, properties of material of which the measuring wires are made) makes the development of a universal measurement system impossible.
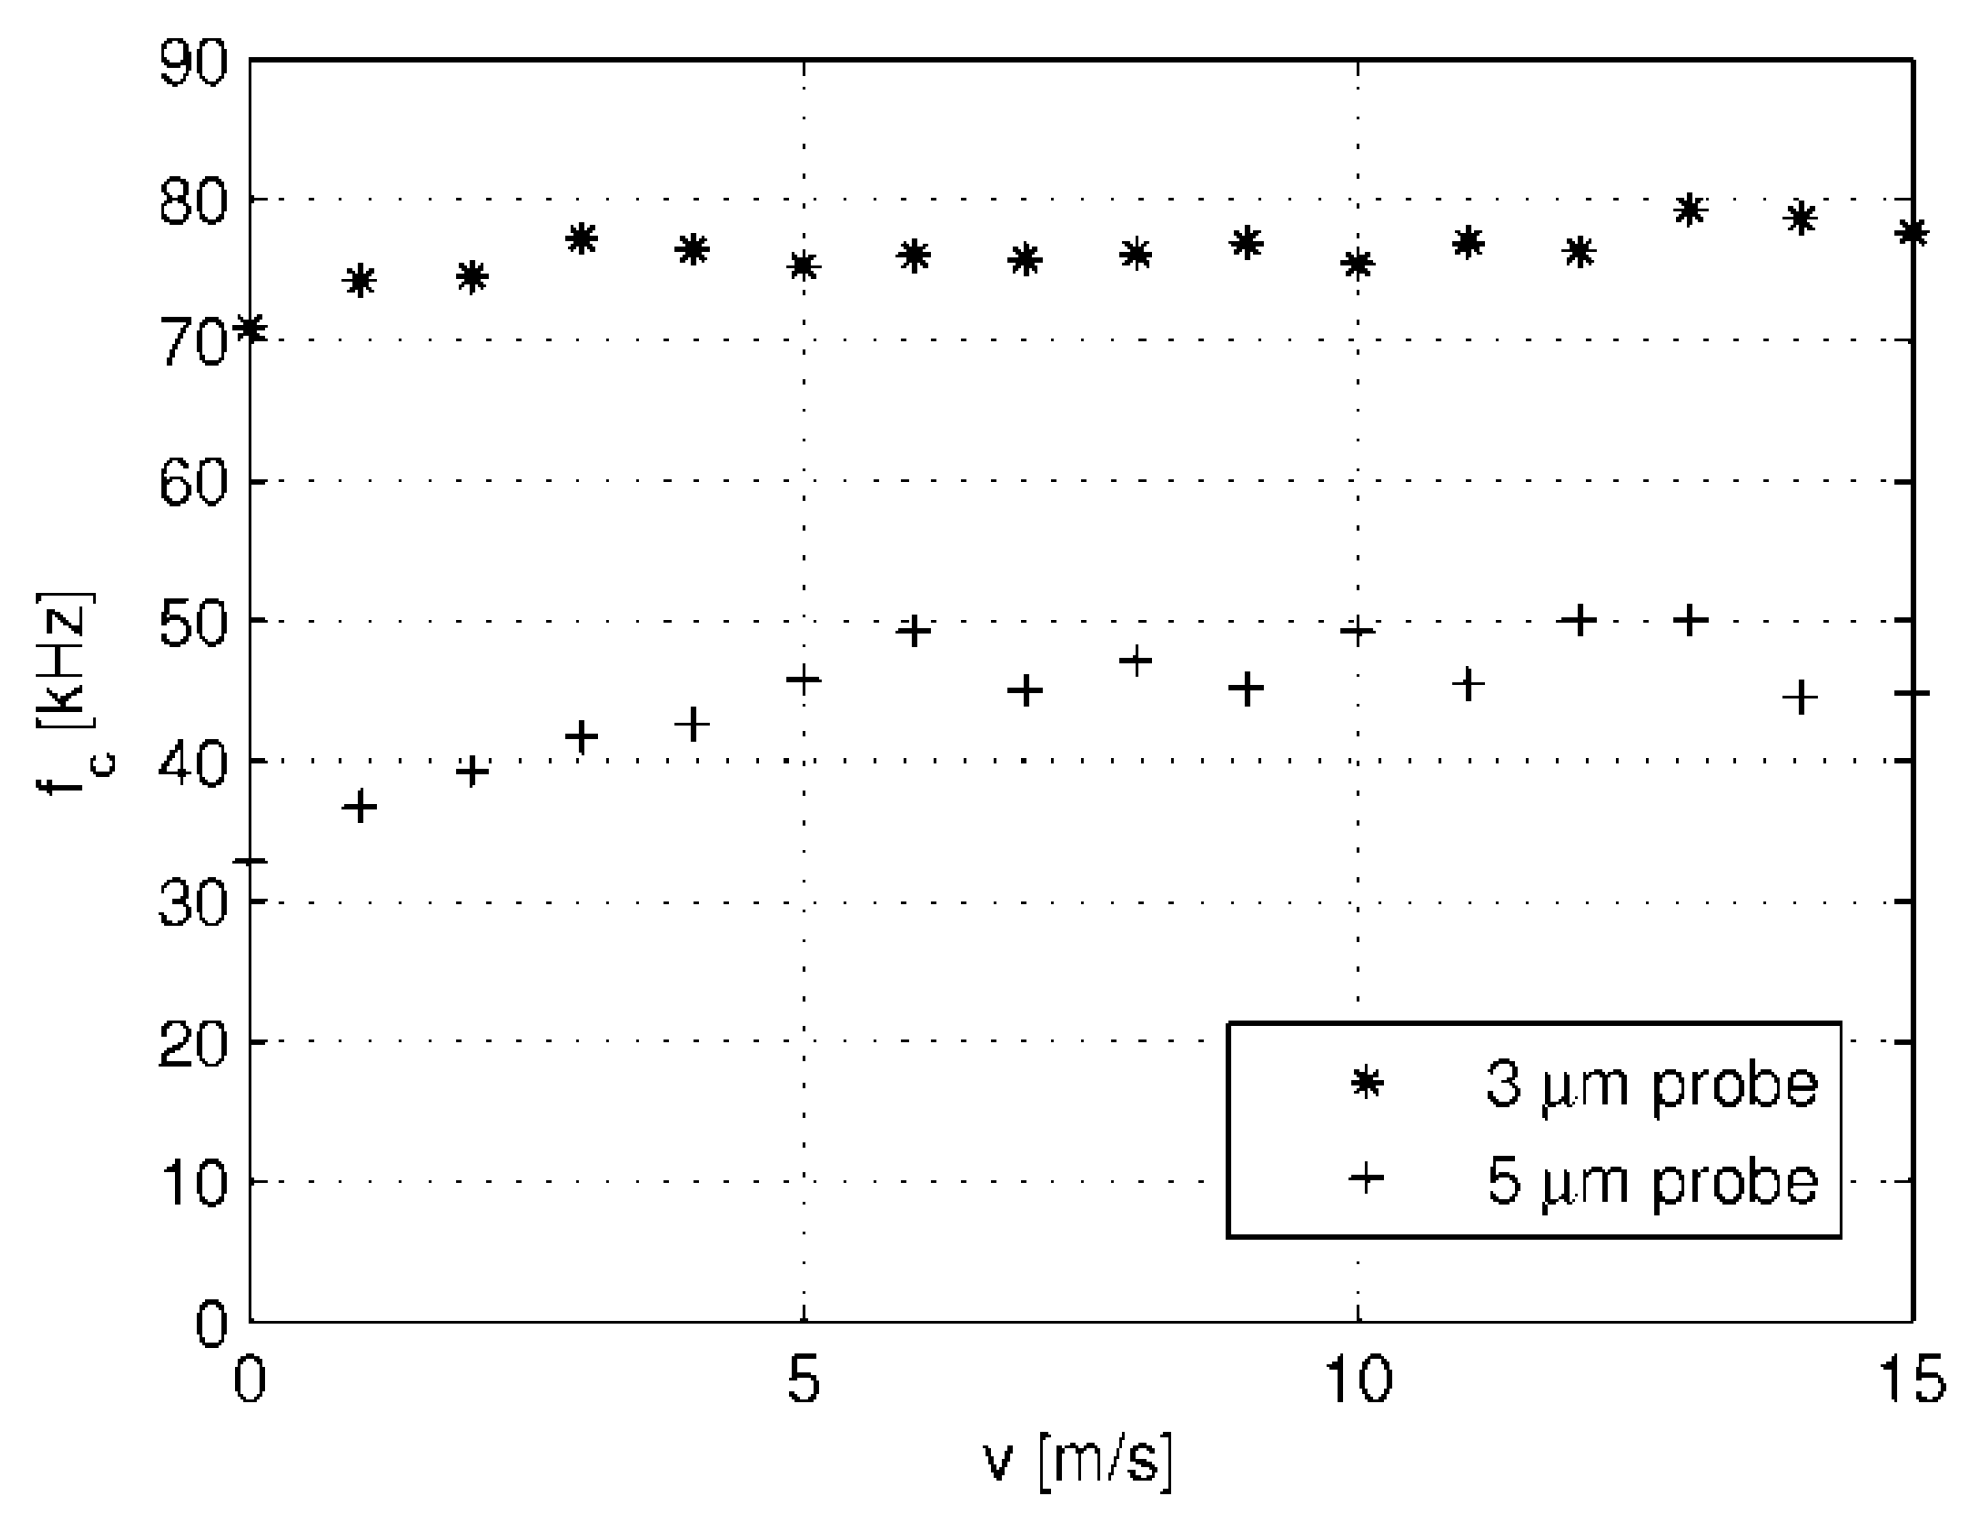
The basic test of the developed system is its ability to maintain the optimal bandwidth in the case of a change in the mean velocity value and the use of different types of sensors. The measurement system, together with the algorithm for automatic adjustment of dynamic properties, was tested in a wide range of velocities, during which two types of measuring probes including the wires of 3 and 5 µm in diameter were used.
Figure 10 presents the results of the performance of the above-described algorithms in real-life measurement experiments.
The presented results for bandwidth frequency of the measurement system in the function of flow velocity confirm the efficacy of the developed procedure of automatic adjustment. Bandwidth frequencies obtained for two types of commonly used measurement probes are characterized by their constancy in a wide range of flow velocities (above 3 m/s), reaching the level of 78 kHz and 46 kHz for 3 µm and 5 µm probes, respectively. In the case of lower velocities, the values of the bandwidth frequencies of the measurement system are insignificantly lower, reaching the minimal values in the case of optimization under the no-flow conditions. This effect may be explained by the fact that the characteristic of heat exchange between the sensor and its surroundings changes under these conditions. As the flow velocity decreases, the role of free convection in such a heat exchange increases, resulting in a change in thermal conditions around the sensor and thus hindering the possibility of compensation.
The use of the algorithm for the automatic optimization of the transmission band of the hot-wire anemometric measurement system thus allowed for optimal values of bandwidth frequency of the system to be obtained in a single channel, irrespective of installed measurement probe or adopted flow velocity.
8. Conclusions
In routinely performed hot-wire anemometric measurements, the measurement system’s dynamics are influenced by factors related to properties of flowing medium in which such measurements are performed (the mean velocity value), the used type of measurement probe, or the length of used signal wires. Every change of measurement system configuration leads to perturbations in the ideal characteristics of the originally designed measurement system and changes its dynamic properties in an unspecified manner. Performing measurements using a measurement apparatus with unknown dynamic properties undermines the reliability of results obtained from measurements of high-frequency phenomena, including determination of the intensity of turbulence. One solution to this problem may exist in the presented measurement system, allowing for the effect of various factors interfering with dynamic characteristic of hot-wire anemometric measurement systems to be compensated for. As a result of performed investigations, the full ability of the system to automatically compensate for the effect imposed by various measurement-related factors on the bandwidth frequency of the system was confirmed.
Author Contributions
Conceptualization, P.L.; methodology, P.L. and P.J.; software, P.J.; validation, P.L. and P.J.; formal analysis, P.J.; investigation, P.L. and P.J.; data curation, P.J.; writing—original draft preparation, P.L. and P.J.; writing—review and editing, P.L. and P.J.; visualization, P.J.; supervision, P.L. All authors have read and agreed to the published version of the manuscript.
Funding
This research received no external funding.
Data Availability Statement
The data presented in this study are available on request from the corresponding author. The data are not publicly available due to company’s policy.
Conflicts of Interest
The authors declare no conflict of interest.
References
- Ligęza, P. Basic, Advanced, and Sophisticated Approaches to the Current and Forecast Challenges of Wind Energy. Energies 2021, 14, 8147. [Google Scholar] [CrossRef]
- Sathyajith, M. Wind Energy Fundamentals, Resource Analysis and Economics; Springer: Berlin/Heidelberg, Germany, 2006; 236p. [Google Scholar]
- Tian, W.; Ozbay, A.X.; Wang, D.; Hu, H. Experimental investigation on the wake interference among wind turbines sited in atmospheric boundary layer winds. Wind. Energy 2017, 33, 742–753. [Google Scholar] [CrossRef]
- Kumer, V.; Reuder, J.; Eikill, R. Characterization of turbulence in wind turbine wakes under different stability conditions from static Doppler LiDAR measurements. Remote Sens. 2017, 9, 242. [Google Scholar] [CrossRef] [Green Version]
- Schümann, H.; Pierella, F.; Sætran, L. Experimental Investigation of Wind Turbine Wakes in the Wind Tunnel Energy Procedia. Energy Procedia 2013, 35, 285–296. [Google Scholar] [CrossRef] [Green Version]
- Wolff, S.; Brunner, S.; Fottner, L. The Use of Hot-Wire Anemometry to Investigate Unsteady Wake-Induced Boundary-Layer Development on a High-Lift LP Turbine Cascade. J. Turbomach. 2000, 122, 644–650. [Google Scholar] [CrossRef]
- Al-Abadi, A.; Kim, Y.J.; Ertunç, Ö.; Delgado, A. Turbulence Impact on Wind Turbines: Experimental Investigations on a Wind Turbine Model. J. Phys. Conf. Ser. 2016, 753, 032046. [Google Scholar] [CrossRef] [Green Version]
- Hansen, K.S.; Barthelmie, R.J.; Jensen, L.E.; Sommer, A. The impact of turbulence intensity and atmospheric stability on power deficits due to wind turbine wakes at horns rev wind farm. Wind. Energy 2012, 15, 183–196. [Google Scholar] [CrossRef] [Green Version]
- Wittwer, A.R.; Dorado, R.; Alvarez, G.A.; Degrazia, G.A.; Loredo-Souza, A.M.; Bodmann, B. Flow in the Wake of Wind Turbines: Turbulence Spectral Analysis by Wind Tunnel Tests. Am. J. Environ. Eng. 2016, 6, 109–115. [Google Scholar]
- Kanevce, G.; Oka, S. Correcting Hot-wire Readings for Influence of Fluid Temperature Variations. DISA Inf. 1973, 15, 21–24. [Google Scholar]
- Ligęza, P. Simultaneous Velocity and Temperature Measurements in Transient Gas Flows; Strata Mechanics Research Institute Polish Academy of Science: Krakow, Poland, 2009. [Google Scholar]
- Kidron, I. Measurement of the transfer function of hot-wire and hot-film turbulence transducers. IEEE Trans. Instrum. Meas. 1966, 15, 76–81. [Google Scholar] [CrossRef]
- Jamróz, P. Relationship Between Dynamic Coefficients of Two Temperature Sensors Under Nonstationary Flow Conditions. IEEE Sens. J. 2011, 11, 335–340. [Google Scholar] [CrossRef]
- Nabielec, J. Error in the method of sensor dynamics parameter identification. Przegląd Elektrotechniczny 2011, 87, 99–103. [Google Scholar]
- Ligęza, P. Dynamic Error Correction Method in Tachometric Anemometers for Measurements of Wind Energy. Energies 2022, 15, 4132. [Google Scholar] [CrossRef]
- Jamróz, J.P. Nabielec Adaptive Sensors for Dynamic Temperature Measurements. In Smart Sensors for Industrial Applications; Iniewski, K., Ed.; CRC Press: Boca Raton, FL, USA, 2013. [Google Scholar]
- Freymuth, P. Frequency response and electronic testing for constant-temperature hot-wire anemometers. J. Phys. E.Sci. Instrum. 1977, 10, 705–710. [Google Scholar] [CrossRef]
- Watmuff, J.H. Investigation of the constant-temperature hot-wire anemometer. Exp. Therm. Fluid Sci. 1995, 11, 117–134. [Google Scholar] [CrossRef]
- Li, D.J. Dynamic response of constant temperature hot-wire system in turbulence velocity measurements. Meas. Sci. Technol. 2004, 15, 1835–1847. [Google Scholar] [CrossRef]
- Li, D.J. The effect of electronic components on the cut-off frequency of the hot-wire system. Meas. Sci. Technol. 2005, 16, 766–774. [Google Scholar] [CrossRef]
- Jamroz, P.; Ligeza, P.; Socha, K. Dynamic properties of hot-wire anemometric measurement circuits in the aspect of measurements in mine condition. Arch. Min. Sci. 2012, 57, 699–714. [Google Scholar]
- Jamróz, P.; Ligęza, P.; Socha, K. Advanced metrological tool designed to natural environment parameters measurements. Hot-wire-anemometer with bandwidth optimization. Trans. Strat. Mech. Res. Inst. 2010, 12, 197–208. (In Polish) [Google Scholar]
| Publisher’s Note: MDPI stays neutral with regard to jurisdictional claims in published maps and institutional affiliations. |
© 2022 by the authors. Licensee MDPI, Basel, Switzerland. This article is an open access article distributed under the terms and conditions of the Creative Commons Attribution (CC BY) license (https://creativecommons.org/licenses/by/4.0/).


