Abstract
During the use and management of lead–acid batteries, it is very important to carry out prediction and study of the state of the health (SOH) of the battery. To this end, this paper proposes a SOH prediction method for lead–acid batteries based on the CNN-BiLSTM-Attention model. The model utilizes the convolutional neural network (CNN) to carry out feature extraction and data dimension reduction in the input factors of model, and then these factors are used as the input of the bidirectional long short-term memory network (BiLSTM). The BiLSTM is used to learn the temporal correlation information in the local features of input time series bidirectionally. The attention mechanism is introduced to assign more attention to key features in the input sequence with more significant influence on the output result by assigning weights to important features, and finally, multi-step prediction of the battery SOH is realized. Compared with the prediction results of battery SOH using other neural network methods, the method proposed in this study can provide higher prediction accuracy and achieve accurate multi-step prediction of battery SOH. Measured results show that most of the multi-step prediction errors of the proposed method are controlled within 3%.
1. Introduction
1.1. Background
Lead–acid batteries have the advantages of mature production technology, high reliability, low production cost, and strong environmental applicability, which is widely used in various fields such as power, energy storage, communication and emergency response as a secondary power source. The state of health (SOH) of battery not only affects its service life and performance, but with the degradation of SOH, it may also become difficult to meet the application requirement of electrical equipment, further causing safety issues of electrical equipment and the electrical system. Therefore, it is of great significance to study the prediction of the SOH of lead–acid batteries for the scientific management and safe use of batteries [1].
1.2. Related Works
At present, the developed prediction models of battery SOH can be roughly divided into three types. The first model is based on the battery principles, including the electrochemical models [2,3,4] and equivalent circuit models [5,6] of battery. In the literature [4], the electrochemical model of the battery is modeled with partial differential equations, based on which the health state of batteries is evaluated. However, a large number of thermodynamic and kinetic equations need to be applied in the electrochemical model. Additionally, this type of model often involves a lot of mathematical equations, many parameters and variables as well as complicated calculation processes, and it is difficult to comprehensively consider the environmental factors and service factors. In [6], a lithium battery model based on equivalent circuit and electrochemical impedance spectroscopy (EIS) was proposed and used to monitor the SOH of high-power density lithium-ion batteries. due to the high cost of the impedance spectrogram equipment used to monitor, the strict test conditions, and the difficulty in parameter identification, the online application of this method has certain limitations.
The second model is based on statistical methods, including Gaussian regression models [7,8] and statistical filtering models [9,10,11,12]. The literature [7] proposed a double-exponential empirical model for the capacity degradation process of lithium batteries based on the Gaussian regression model. The convergence of the model was good; however, the Gaussian model has many training parameters. Additionally, the model parameters need to be continuously updated in the iterative calculation process, which greatly increase the complexity of model calculation. Statistical filtering algorithms are mainly divided into optimization methods based on Kalman filter [9,10] and improvement methods based on particle filtering [11,12]. Based on the Thevenin second-order equivalent circuit model and through the adaptive unscented Kalman filter (AUKF) algorithm, the ohmic internal resistance of the battery is estimated in real time in [7]. Additionally, through the functional relationship between the ohmic internal resistance and the battery SOH, the SOH prediction for the battery is obtained. Although the EKF algorithm is more accurate in predicting the SOH and SOC of the battery in some cases, the algorithm itself is closely related to the selection of the initial estimated value, the algorithm tends to converge slowly when the deviation of the initial estimated value is large. Additionally, for the non-steady battery working system, the problem of covariance matrix selection in the calculation process may lead to the instability of the algorithm, so there are certain limitations. The literature [12] constructed a double-exponential degradation model of battery capacity, updated the initial degradation model with known capacity data, and introduced a standard particle filter algorithm to predict battery SOH and RUL. However, it is difficult to directly predict capacity data, and the accuracy of the particle filter algorithm also requires a large amount of sample data.
The third model is based on the data-driven methods, which mainly include the support vector machines [13], extreme learning machine [14] and neural networks [15,16,17]. The literature [15] adopted an adaptive neural network and used the battery capacity of the last used as the input of the subsequent battery capacity. The experiment result showed that the single-step prediction performance is good. The literature [16] used an improved support vector machine and alleviated the problem of excessive computation by using the fast marginal likelihood maximization of the sparse Bayesian model to achieve SOH and remaining life prediction. In the literature [17,18], the method of combining BP neural network and extended Kalman filter is used to predict the capacity of a single battery, and the prediction accuracy is high. The data-driven method does not require building a complex physical model of battery, and the SOH information of battery and possible development and evolution rules can be inferred from massive amounts of state data, which can reflect the influence of the working environment and working method on the battery use process. Many researchers have put their focus on this method.
1.3. Research Gap
However, current methods for battery SOH study are mainly applicable to lithium batteries and often used in the single-step prediction of battery SOH. There are few studies on lead–acid batteries and on the multi-step prediction of battery SOH. Compared with lithium batteries, lead–acid batteries have significantly different structure, composition and working principles. In complicated application environment and with varying application methods, the change mechanism and degradation trend of the SOH of lead–acid batteries are also different from those of lithium battery [19,20]. As a result, it is difficult to use the prediction model for lithium battery SOH to directly predict the SOH of lead–acid batteries, which cannot provide high accuracy of prediction or applicability [21,22]. Therefore, it is necessary to optimize and improve the existing SOH prediction methods for lithium batteries or to propose new data-driven methods, which are suitable for the research object of this paper.
1.4. Contribution
The research object of this paper is a large-capacity lead–acid battery. Taking the battery life cycle as the time axis, the data recorded on the battery is based on the time series streaming data. Among the prediction methods for time series data, the short- and long-term memory (LSTM) network has obvious advantages [23,24]. Convolutional neural network (CNN), as an effective means of processing spatial information, has excellent performance in feature extraction of complex data [25]. Models that integrate CNN and LSTM have been applied in fault diagnosis [25,26], data prediction [27] and other directions, and have achieved certain results. In view of the above problems, this paper proposes a method to predict and study the battery SOH based on the CNN-BiLSTM-Attention model. First, this method utilizes the convolutional neural network (CNN) to carry out feature extraction of influencing factors on the battery SOH; then, a bidirectional long and short term memory (BiLSTM) network is employed to bidirectionally learn the temporal association information between the input sequences; finally, the attention mechanism is introduced to enhance emphasis on key features by the model, and achieve multi-step accurate prediction of the SOH of a large-capacity lead–acid battery.
2. Related Deep Learning Theories
2.1. Bidirectional Long and Short Term Memory (BiLSTM) Network
2.1.1. Long- and Short-Term Memory (LSTM) Network
In the LSTM network, the input gate, forget gate and output gate are constructed for control of the memory cell. Among them, the forget gate analyzes the information of memory cell, and retains or abandons the information; the input gate is used to update the state of memory cell; the output gate controls the output of LSTM.
The structure of LSTM is as shown in Figure 1. If LSTM is regarded as a model black box, the input vector of the model is the hidden layer state of the previous stage and the input sample of the current stage of the model. The output vector of the model is , and when is processed using the output activation function, the real output value of the model can be obtained. and are the memory cells of the model, and during the operation of LSTM, and are the mainline memory part. During a training update process, the mainline memory information of previous round is affected by the memory attenuation effect of the forget gate, and then supplemented by the information of the input gate. In this way, the update of memory information is completed, the new memory information is formed, and the output is generated under the control of the output gate.
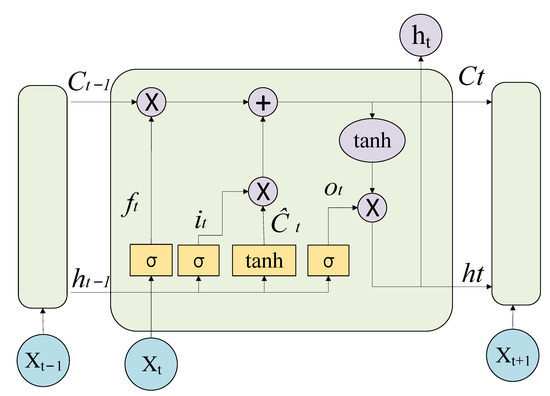
Figure 1.
Structure of the LSTM model.
After being processed by the forget gate, the information can be expressed as:
where represents the weight matrix and represents the bias term.
The attenuation effect of the forget gate on the mainline memory information can be expressed as:
After being processed by the input gate, the information can be expressed as:
The update process of mainline memory information by the output gate can be represented as:
After being processed by the output gate, the information can be expressed as:
The update process of hidden layer state by the output gate can be represented as:
2.1.2. Working Principle of BiLSTM
As an improved algorithm of LSTM network, the BiLSTM network consists of the forward LSTM network and backward LSTM network, the structure of the BiLSTM network is as shown in Figure 2. During the learning process of the BiLSTM network, the input sequence is input to the forward LSTM network in a positive order, and the backward LSTM network is input in reverse order. The forward LSTM network and backward LSTM network perform feature extraction and knowledge memory of the context of the input sequence, respectively. The final output result of BiLSTM network can be obtained by integrating the output results of the forward and backward output results. The forward LSTM network and backward LSTM network have the same composition and working principle, but with opposite orders of input sequences. During the entire service life of battery, the SOH is a time series, and the SOH value in the series is not only related to the trend change in forward data, but also is the basis for the change of the backward SOH data. Compared with LSTM network, BiLSTM network analyzes and processes the bidirectional temporal relationship of the battery SOH data. It performs memory extraction of both the past and future features of data, thereby further improving the prediction accuracy of the model [28].
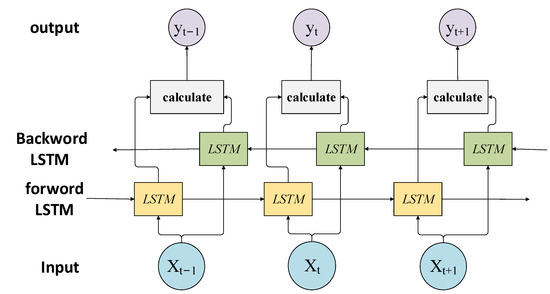
Figure 2.
Structure of the BILSTM model.
2.2. Convolutional Neural Network (CNN)
The convolutional neural network (CNN) is a feedforward neural network mainly composed of the convolutional layer, pooling layer and fully connected layer via alternate stacking, and the back propagation algorithm is utilized to train the weights in the network. TheCNN has the structural characteristics of local correlation and weight sharing, and can perform feature extraction and data dimension reduction for each input influencing factor of the model, which is conducive to reducing the amount of feature parameters and model complexity in the model. In addition to the robustness, it can also prevent the model from overfitting. Its structure is as shown in Figure 3.
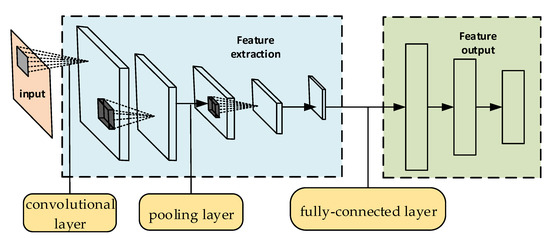
Figure 3.
Schematic diagram of the CNN structure.
During the learning process of the CNN model, the convolutional layer extracts features of the input samples via its convolution kernel, and these features are the input of the next layer. After the convolutional layer completes feature extraction of the input data, based on the idea of local correlation, the pooling layer carries out local data sampling or processing to the output from the convolutional layer, so as to complete the extraction and information screening of data features. The fully connected layer is usually at the end of CNN, and the neurons between adjacent layers have weighted connections instead of local connections. After the input samples are processed by multiple layers such as the convolutional layer and pooling layer, they are finally fused and compressed via the fully connected layer, and the final classification or regression analysis of the input samples is carried out using the excitation function.
2.3. Attention Mechanism
The attention mechanism is a special structure embedded into the machine learning model, which automatically learns and calculates the contribution of input factors to output factors. Let represent the input information of groups, and the –dimensional vector represent the input information of one group. To reduce the computational overhead and the complexity of algorithm, we do not need to input all information of into the neural network, but only need to select the information related to the task, which is the function of the algorithm based on the attention mechanism.
To analyze and choose information related to a certain task in N input vectors , a representation related to the task is introduced, called the query vector . The correlation between each input vector and the query vector is calculated according to the scoring function.
Given a task-related query vector , the index position of selected information can be represented by the attention variable (e.g., if , it means that the -th input vector is selected). To facilitate calculation, the “soft” information selection mechanism is adopted, and given and , the probability of selecting the -th input vector can be represented as:
where represents the attention distribution, and is the attention scoring function.
3. Prediction Process and Indicators
3.1. Prediction Process of Battery SOH
3.1.1. Data Composition
The time series data in this paper is based on the battery life cycle as the unit of the data sequence. Assume the battery capacity of the k-th cycle is , The content of the data sequence corresponding to the k-th cycle is represented as , in which, is the current cycles, is the initial temperature of battery, is the battery temperature at the end of charging, is the initial density of battery, is the battery density at the end of charging, is the initial voltage of battery, and is the charging time of battery.
3.1.2. Model Structure
The CNN extracts features of the time series data via the convolution layer, and reduces the dimension of the input data via the pooling layer, but it cannot learn the time information of adjacent data. BiLSTM can better learn the coupling relationship between adjacent time series data on the time axis, but it has poor performances in mining and extraction of data features. In this paper, the CNN network and the BiLSTM network are integrated to complement each other′s advantages. Finally, the attention mechanism is employed to enable the model focus on key features, so as to improve the generalization ability of the model and realize the multi-step prediction of the SOH of the large-capacity lead–acid battery. The learning process of each functional layer on the sample is as follows:
- Step 1: The normalized samples are used as the input of the entire model;
- Step 2: In the CNN layer, the convolution layer uses the convolution kernel to adaptively extract the feature information of the input factors; the pooling layer operates on the extracted feature information, reduces the data dimension, and retains the main feature information; the Dropout layer makes the neurons in the model stop working randomly to prevent overfitting of the model and improve the generalization ability of the model;
- Step 3: The BiLSTM layer trains and learns the data processed by the CNN layer from two directions through the forward LSTM network and the backward LSTM network;
- Step 4: The information processed by BiLSTM layer is sent to the attention layer, and the weights of the input factors of the model are assigned through calculation and mapping relationship to deepen the importance of the model to the important input factors;
- Step 5: Complete multi-step prediction of battery SOH through fully connected layers.
The algorithm structure of the model is as shown in Figure 4:
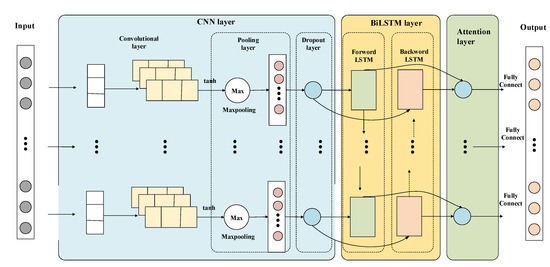
Figure 4.
Structure diagram of the CNN-BiLSTM hybrid network model.
3.1.3. The Process of Model Prediction
The CNN-BiLSTM-Attention hybrid network model designed in this paper mainly consists of the signal input layer, convolutional layer, pooling layer, Dropout layer, BiLSTM layer, attention mechanism layer and fully connected layer. The process of predicting the SOH of lead–acid batteries based on the CNN-BiLSTM-Attention hybrid network model is as follows:
- Step 1. Use sensors to collect the parameter data and of the large-capacity lead–acid battery during the accelerated life experiment, and build a data sample for the model;
- Step 2. After the data samples are supplemented and eliminated, the sample data is normalized based on the min-max normalization method. After mapping each variable element of the data set to [0, 1], the training set and the test set are divided;
- Step 3. Use the grid search algorithm to find the optimal initial model parameters, and set parameters including batch size (B), learning rate (rL), number of iterations (N) and other parameters according to the results;
- Step 4. The training set is used to train the model, and the learning process of the training samples is as described in Section 3.1.2, and the model parameters are updated and adjusted according to the training results;
- Step 5. Determine whether the number of network training M reaches the set number of iterations N, if so, go to the next step, otherwise repeat step 4;
- Step 6. The test set tests the performance of the trained model, outputs the evaluation indicators and calculation results, and finally ends the calculation.
Based on the CNN-BiLSTM-Attention model, the process to predict the SOH of large-capacity lead–acid batteries is as shown in Figure 5.
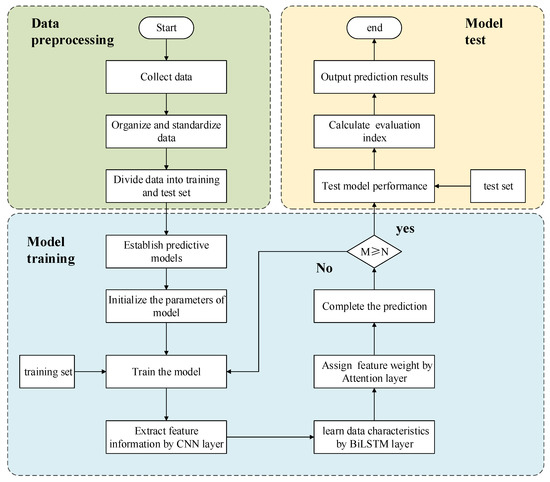
Figure 5.
Prediction process of large-capacity lead–acid batteries SOH by CNN-BiLSTM-Attention model.
3.2. Experimental Indicators
The mean absolute error (MAE), mean absolute percentage error (MAPE) and mean-square error (MSE) are used to evaluate the model prediction performance. MAE can well reflect the error of the predicted value; MAPE is a percentage value, which represents the average deviation of the predicted value from the actual value; MSE reflects the deviation of the predicted value from the actual value. The calculation formulas of various indicators are as follows.
where and represent the predicted value and actual value of the -th sample, respectively, and represents the number of samples. The smaller values do these three indicators have, the higher the prediction accuracy, and the better the model performance.
4. Example Analysis
4.1. Experimental Scheme
The battery capacity refers to the battery′s ability to store charges. The SOH calculation formula defined from the perspective of capacity is as follows [29]:
where is the maximum discharge capacity of the battery at the current stage, and is the rated capacity of the battery. According to related specifications in the IEEE Standard 1188.1996, when SOH < 80%, the battery reaches the disposal standard and needs to be replaced in time. Therefore, the prediction of battery SOH can be equivalent to the prediction of battery capacity.
In our study, accelerated life experiments were carried out to three groups of flooded large-capacity lead–acid batteries of a specific model according to related industrial standards. The three groups of batteries had 400 cycles, 402 cycles and 391 cycles of charging–discharging, respectively.
4.2. Analysis of Model Input Factors
In the accelerated life experiment, related data was collected and recorded during the first stage of charging by combining the actual use and management of battery, including the ambient temperature, initial temperature, temperature at the end of charging, initial density, density at the end of charging, initial voltage, and charging time of the battery. With the cycles of battery use as units on the time axis, and with one group of battery data as example, the maximum discharging capacity in each cycle is calculated and normalized, and the change process on the time axis is as shown in Figure 6.
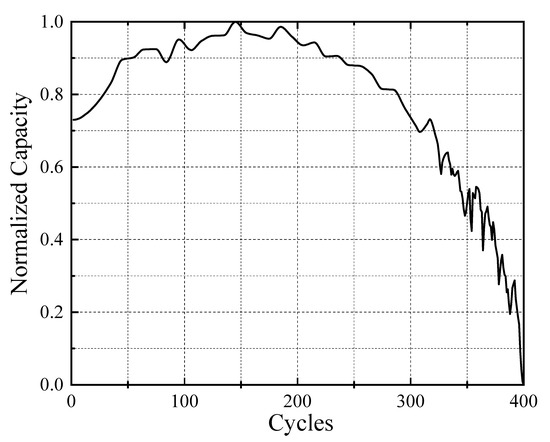
Figure 6.
Change trend of battery capacity.
The SOH change of large-capacity lead–acid batteries is essentially the change in the number of active substances that can participate in chemical reactions on the internal plate. During the middle and late stages in the service life of battery, some active substances on the plate gradually change to irreversible lead sulfate under repeated oxidation-reduction reactions. As a result, the internal resistance of battery increases, which eventually leads to decrease in the battery capacity, and this is reflected by the SOH of battery. Therefore, the change process of battery capacity can be understood as the change process of the battery SOH.
Except for the ambient temperature, the change of the collected parameters on the time axis after normalization is shown in Figure 7. Each variable has a certain change trend with the increase in the use cycle. This means the parameters collected above can map the sulfate level of active substances and the change process of internal resistance of the battery to a certain extent, and there is a coupling relationship among various parameters. Therefore, all parameters except the ambient temperature can be used as the influencing factors on the prediction of battery SOH.
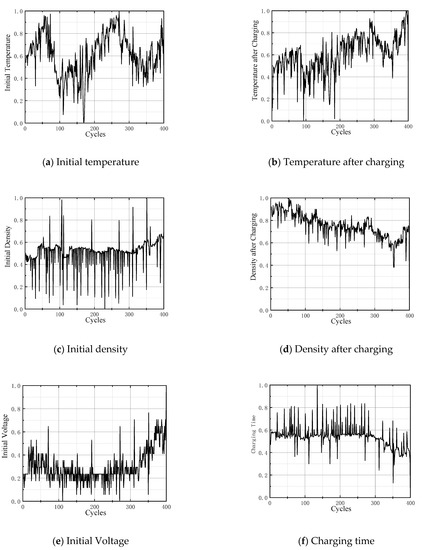
Figure 7.
Change trends of different variables.
Most current researches on the battery SOH are based on the change trend of battery capacity, the past battery capacity is used as the influencing factor on prediction of current battery capacity, and they generally obtain good prediction results [15,24,25]. However, for large-capacity lead–acid batteries, the discharging current continuously changes with load during its use, and charging operation is often performed without complete discharging. Therefore, it is difficult to accurately obtain the maximum discharge capacity of battery under current state. To meet the requirements of actual application, this study does not use the past capacity of battery as the input factor of battery SOH prediction model, which is also one of the differences between our proposed model and other battery SOH prediction models.
4.3. Experimental Verification and Analysis
4.3.1. Input Matrix and Output Matrix of Model
In this paper, keras is used to build the deep learning framework of the prediction model. Referring to the selection method of deep convolutional neural network structure parameters in references [30,31], after repeated verification and testing, the structural parameters of the model are adjusted, and the structural composition and parameters are obtained as follows:
The input data enters the one-dimensional convolutional layer (Conv1D) first. Conv1D is set with 128 filters, each filter has a kernel size of 1 and the moving step length of 1, the data filling method is “same”, and tanh is used as the activation function of the convolutional layer. After feature extraction of the input data in Conv1D, the data is transferred to the pooling layer. The pooling layer adopts the maximum pooling strategy, and the size of pooling layer is 3. After the key information of data is retained and the dimensionality of data is reduced via the pooling layer, to prevent overfitting, the Dropout layer is inserted, and the parameter is set to 0.2. The output of the Dropout layer is used as the input of the BiLSTM layer, assume there are 32 hidden layer nodes and 1 layer, and the tanh function is used as the activation function. The output of the BiLSTM layer is used as the input of the attention mechanism layer (Attention), and sigmoid is used as the activation function. After multiplying the Attention module with the BiLSTM layer, the fully connected layer is finally connected as the output of the entire model, and the tanh function is used as the activation function.
After preprocessing the collected experimental data, the battery capacity and the corresponding time series data of the battery in the k-th cycle are obtained. The experimental data of two groups of batteries and 60% of the experimental data of another group of batteries are used as training data, and the remaining 40% data of the second group are used as test data.
The mean square error is used as the loss function, the computation iterations of model are set to 300, and the data collected in the first N cycles are used to perform multi-step prediction of the battery capacity and SOH in the next M cycles. In other words, the input matrix of the model is expressed as , the expected output matrix of model is denoted as , and the predicted output matrix of model is . Under different values of N and M, the corresponding prediction accuracies are listed in Table 1, and the corresponding evaluation indicators are compared as shown in Figure 8.

Table 1.
The prediction accuracy of N and M under different values.
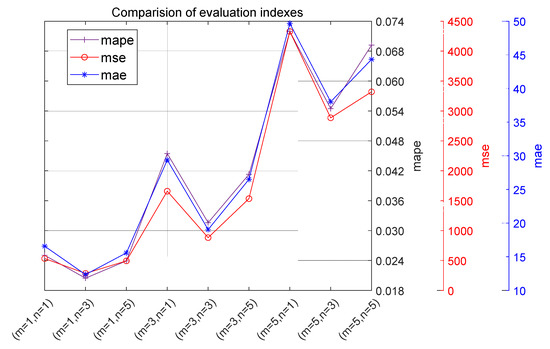
Figure 8.
Comparison of evaluation indicators under different values.
According to the prediction results, when single-step prediction is performed on the model, that is, when M = 1, different values of N can obtain relatively ideal prediction results, and when N = 3, the corresponding prediction accuracy is the highest, but the model at this time does not realize multi-step predicted function. In the multi-step prediction model, that is M > 1, when M = 3 and N = 3, the prediction accuracy is the highest, and the prediction accuracy meets the needs of use, realizing the multi-step prediction function of the model.
4.3.2. Comparison of the Prediction Performances of Different Models
Take the same training samples and test samples, and compare the multi-step prediction of battery capacity through the CNN-BiLSTM-Attention model and models such as LSTM.CNN-LSTM and CNN-BiLSTM-, and take N = 3 and M = 3 for the input and output of each model. Get the predicted results shown in Table 2 and Figure 9, where Amax is the value of the maximum APE and Amin is the value of the minimum APE.
Table 2.
Comparison of different models’ prediction accuracy.
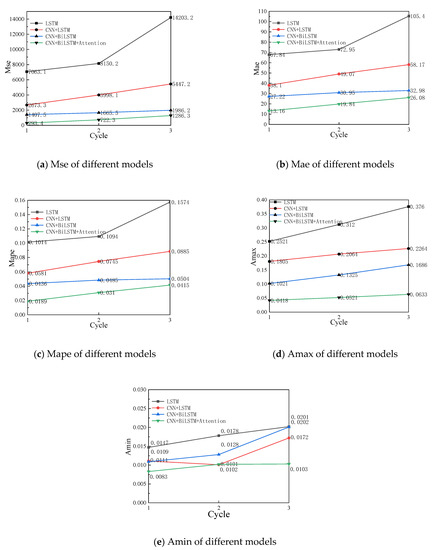
Figure 9.
Comparison of different models’ prediction accuracy.
The comparison between the predicted results under different models and the expected capacity is shown in Figure 10. According to the prediction results of each model, the closer the distance to the current cycle, the better the prediction results of each model for the battery SOH, ie . For the multi-step prediction of SOH of large-capacity lead–acid batteries, the prediction accuracy of each model is ranked as LSTM < CNN-LSTM < CNN-BiLSTM < CNN-BiLSTM-Attention. It can be seen that the prediction results of the CNN-BiLSTM-Attention model used in this paper are obviously better. This ranking of accuracy can account for:
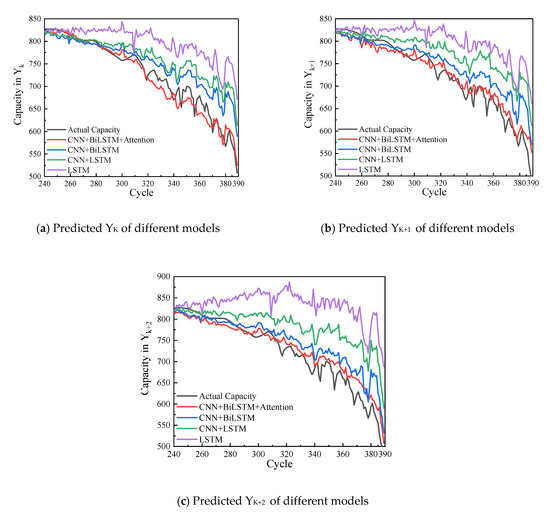
Figure 10.
Comparison of forecasting capacity of different models.
- (1)
- CNN is used for feature extraction and dimensionality reduction in the influencing factors on battery SOH, which can optimize the prediction results of the model.
- (2)
- For the research object of this paper, the BiLSTM method is better than the LSTM method.
- (3)
- The attention mechanism algorithm can further improve the prediction accuracy of the model.
Taking the 3% error of the rated capacity of the battery as a reference for the upper and lower limits, the comparison between the multi-step predicted capacity of the battery and the actual capacity of the battery is shown in Figure 11. It can be seen that most of the multi-step prediction accuracy of the battery is within the range of the upper and lower limits. Although a small number of capacity prediction results deviate from the upper and lower limits in a small range, they are all less than 5% of the rated capacity error, and the prediction accuracy can meet the actual use requirements.
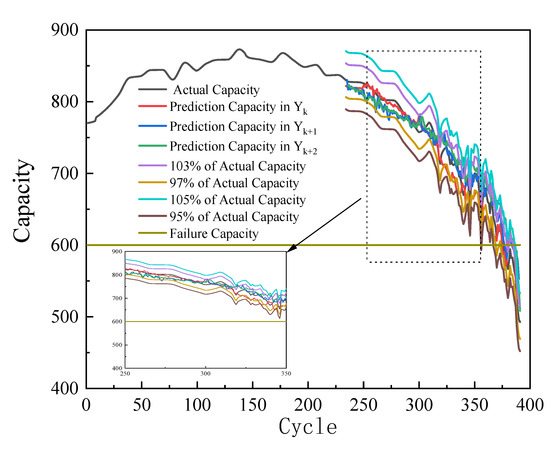
Figure 11.
Comparison of forecasting capacity of different models.
4.3.3. Comparison with State-of-the-Art Methods
In order to verify the performance of the proposed method, a comparation between the proposed method and the state-of-the-art approaches such as ELM, SVM, RVM, LSTM, DCNN and RF has been performed. Single-step (M = 1, N = 3) and multi-step (M = 1, N = 3) prediction has been performed with the above models based on the same training and testing set, which are used in this manuscript. The comparison results are shown in the Table 3.
Table 3.
Comparison between proposed model and state-of-the-art methods.
According to the comparison results, the ELM model has the maximum computational efficiency, but the prediction performance is not ideal, and it is difficult to meet the actual needs. When the single-step SOH prediction is per-formed on the large-capacity lead–acid battery, the prediction accuracy of the proposed model in this paper is basically the same as that of RF method, and the calculation efficiency of RF algorithm is higher. However, when multi-step prediction is performed on batteries, the method proposed in this paper is obviously superior to other algorithms, and achieves a relatively accurate multi-step prediction function for the SOH of large-capacity lead–acid batteries.
5. Conclusions
Flooded large-capacity lead–acid batteries have broad applications in marine propulsion power, whereas multi-step prediction of the SOH of these batteries is very important for battery health management. In this paper, a CNN-BiLSTM-Attention model is constructed to carry out multi-step SOH prediction of battery by establishing, and our main conclusions are as follows:
- (1)
- By carrying out accelerated life experiments on large-capacity lead–acid batteries, and based on collection, sorting and analysis of the experimental data, it is proved that the CNN-BiLSTM-Attention model can achieve multi-step accurate prediction of battery SOH.
- (2)
- The multi-step prediction results of battery SOH by different models show that the prediction accuracy of model can be optimized by using CNN for feature extraction of input factors and dimensionality reduction in data, and the BiLSTM method outperforms the LSTM method in multi-step prediction of battery SOH.
- (3)
- Compared with the prediction results of other models, the CNN-BiLSTM-Attention model proposed in this paper can achieve higher prediction accuracy, which can fully integrate the advantages of CNN and BiLSTM, and further optimize the prediction results of model based on the attention mechanism. Measured results show that most of the multi-step prediction errors of the proposed method are controlled within 3%, which can meet the actual needs. Our method has laid down a theoretical basis for the safe use and scientific management of large-capacity lead–acid batteries.
Author Contributions
Conceptualization, S.S. and J.S.; methodology, S.S.; software, W.C.; validation, Z.W. and Z.Z. All authors have read and agreed to the published version of the manuscript.
Funding
Project Supported by National Natural Science Foundation of China (51407193).
Conflicts of Interest
The authors declare no conflict of interest.
References
- Xiong, R.; Li, L.; Tian, J. Towards a smarter battery management system: A critical review on battery state of health monitoring methods. J. Power Sources 2018, 405, 118–129. [Google Scholar] [CrossRef]
- Zhang, W.H.; Wu, S.M.; Liu, P.; Wu, F.Y. Study on EIS of C/LiFePO4 power battery. Chin. J. Power Sources 2015, 39, 1838–1842. [Google Scholar]
- Tian, J.; Xiong, R.; Yu, Q. Fraction al-order model-based incremental capacity analysis for degradation state recognition of lithium-ion batteries. IEEE Trans. Ind. Electron. 2019, 66, 1576–1584. [Google Scholar] [CrossRef]
- Smith, K.A.; Rahn, C.D.; Wang, C.Y. Control oriented 1DElectrochemical model of lithium-ion battery. Energy Convers. Manag. 2007, 48, 2565–2578. [Google Scholar] [CrossRef]
- Li, Y.; Monem, M.A.; Gopalakrishnan, R.; Berecibar, M.; Nanini-Maury, E.; Omar, N.; van den Bossche, P.; Van Mierlo, J. A quick online state of health estimation method for Li-ion battery with incremental capacity curves processed by Gaussian filter. J. Power Sources 2018, 373, 40–53. [Google Scholar] [CrossRef]
- Eddahech, A.; Briat, O.; Bertrand, N.; Delétage, J.Y.; Vinassa, J.M. Behavior and state-of-health monitoring of Li-ion batteries using impedance spectroscopy and recurrent neural networks. Int. J. Electr. Power Energy Syst. 2012, 42, 487–494. [Google Scholar] [CrossRef]
- Guha, A.; Vaisakh, K.V.; Patra, A. Remaining useful life estimation of lithium-ion batteries based on a new capacity degradation model. In Proceedings of the IEEE Transportation Electrification Conference and Expo, Asia-Pacific, Busan, Korea, 1–4 June 2016; pp. 555–560. [Google Scholar]
- Mejdoubi, A.E.; Oukaour, A.; Chaoui, H.; Gualous, H.; Sabor, J.; Slamani, Y. State of charge and state of health lithium—ion batteries diagnosis according to surface temperature variation. Trans. Ind. Electron. 2016, 63, 2391–2402. [Google Scholar] [CrossRef]
- He, H.; Xiong, R.; Zhang, X.; Sun, F.; Fan, J. State-of-charge estimation of the lithium-ion battery using an adaptive extended Kalman filter based on an improved Thevenin model. IEEE Trans. Veh. Technol. 2011, 60, 1461–1469. [Google Scholar]
- Yan, X.W.; Deng, H.R.; Guo, Q.; Qu, W. Study on the state of health detection of power batteries based on adaptive unscented Kalman Filters and the battery echelon utilization. Trans. China Electrotech. Soc. 2019, 34, 3937–3948. [Google Scholar]
- Bi, J.; Zhang, T.; Yu, H.; Kang, Y. State-of-health estimation of lithium-ion battery packs in electric vehicles based on genetic resampling particle filter. Appl. Energy 2016, 182, 558–568. [Google Scholar] [CrossRef] [Green Version]
- Zhang, N.; Xu, A.D.; Wang, K.; Han, X.; Hong, S.H. Research on prediction of the remaining useful life of lithium-ion batteries based on particle filtering. Chin. High Technol. Lett. 2017, 27, 699–707. [Google Scholar]
- Yang, D.; Wang, Y.; Pan, R.; Chen, R.; Chen, Z. State-of-health estimation for the lithium-ion battery based on support vector regression. Appl. Energy 2018, 227, 273–283. [Google Scholar] [CrossRef]
- Pan, H.H.; Lu, Z.Q.; Fu, B. Online estimation of lithium-ion battery state of health using extreme learning machine. Automot. Eng. 2017, 39, 1375–1381. [Google Scholar]
- Babu, G.S.; Zhao, P.; Li, X. Deep Convolutional Neural Network Based Regression Approach for Estimation of Remaining Useful Life; Springer: Dallas, TX, USA, 2016. [Google Scholar]
- Zhou, Y.; Huang, M.; Chen, Y.; Tao, Y. A novel health indicator for on-line lithium-ion batteries remaining useful life prediction. J. Power Sources 2016, 321, 1–10. [Google Scholar] [CrossRef]
- Mohammad, C.; Mohammad, F. State-of-charge estimation for lithium-ion batteries using neural networks and EKF. IEEE Trans. Ind. Electron. 2010, 57, 4178–4187. [Google Scholar]
- Dai, H.; Zhao, G.; Lin, M.; Wu, J.; Zheng, G. A novel estimation method for the state of health of lithium—ion battery using prior knowledge-based neural network and Markov chain. IEEE Trans. Ind. Electron. 2019, 66, 7706–7716. [Google Scholar] [CrossRef]
- Zhang, Y.F.; Yu, Y.; Zhang, B. Overview of the current situation and development of lead-acid battery. Chin. LaBat Man 2021, 58, 27–31. [Google Scholar]
- Han, Y.B. Life cycle comparative study of lithium batteries and lead-acid batteries. Chin. LaBat Man 2014, 51, 186–189. [Google Scholar]
- Wu, H.B.; Gu, X.; Zhao, B.; Zhu, C.Z. Comparison study on model and state of charge estimation of typical battery. J. Electron. Meas. Instrum. 2014, 28, 717–723. [Google Scholar]
- Liu, B.; Bi, X.X.; Dang, J.P.; Liu, Q.; Wang, J. Degradation trend prediction of battery in substation based on support vector regression. J. Power Supply 2020, 18, 207–214. [Google Scholar]
- Song, S.L.; Huang, H.T.; Ruan, T.X. Abstractive text summarization using LSTM-CNN based deep learning. Multimed. Tools Appl. 2019, 78, 857–875. [Google Scholar] [CrossRef]
- Graves, A.; Mohamed, A.R.; Hinton, G. Speech recognition with deep recurrent neural networks. In Proceedings of the 2013 IEEE International Conference on Acoustics, Speech and Signal Processing, Vancouver, BC, Canada, 26–31 May 2013; IEEE: Piscataway, NJ, USA, 2013; pp. 6645–6649. [Google Scholar]
- Qu, J.L.; Yu, L.; Yuan, T.; Tian, Y.; Gao, F. Adaptive fault diagnosis algorithm for rolling bearings based on one-dimensional convolutional neural network. Chin. J. Sci. Instrum. 2018, 39, 134–143. [Google Scholar]
- Zhao, J.J.; Zhao, Z.H.; Yang, S.P. Rolling bearing fault diagnosis based on residual connection and 1D-CNN. J. Vib. Shock 2021, 40, 1–6. [Google Scholar]
- Peng, D.G.; Zhu, Q.; Che, Q.; Zhao, H. Short-term coal storage forecasting of thermal power plant for power grid dispatching based on CNN-LSTM neural network. Electr. Power Autom. Equip. 2021, 41, 127–141. [Google Scholar]
- Jin, X.C.; Wu, Z.R.; Shi, M.; Zhu, D.M.; Zhou, J. Geological segment horizon prediction method based on BiLSTM. Chin. High Technol. Lett. 2021, 31, 607–615. [Google Scholar]
- Li, X.J.; Zhao, J.H.; Yang, J.B. Research on the charge model of lead-acid batteries onboard modern submarines. Ship Sci. Technol. 2011, 33, 58–61. [Google Scholar]
- Zhang, W.; Peng, G.L.; Li, C.H.; Chen, Y.; Zhang, Z. A new deep learning model for fault diagnosis with good anti-noise and domain adaptation ability on raw vibration signals. Sensors 2017, 17, 425. [Google Scholar] [CrossRef]
- Hu, N.Q.; Chen, H.P.; Cheng, Z.; Zhang, L.; Zhang, Y. Fault diagnosis for planetary gearbox based on EMD and deep convolutional neural networks. J. Mech. Eng. 2019, 55, 9–18. [Google Scholar] [CrossRef] [Green Version]
Publisher’s Note: MDPI stays neutral with regard to jurisdictional claims in published maps and institutional affiliations. |
© 2022 by the authors. Licensee MDPI, Basel, Switzerland. This article is an open access article distributed under the terms and conditions of the Creative Commons Attribution (CC BY) license (https://creativecommons.org/licenses/by/4.0/).