Abstract
The power sector plays a significant role in carbon neutrality strategies, and the grid system is a crucial part of the power sector. In particular, with less mitigation potential from technology efficiency, the credit from whole life cycles is critical. This paper describes the investigation of the environmental impacts of various scenarios from the perspective of life cycles. By using the life cycle assessment (LCA) method, various grid systems are examined as a case study, including a traditional, renewable energy, and power storage grid system, as well as a microgrid, in Guangdong. The results highlight the fact that with the systematic improvement of a grid, significant environmental benefits can be achieved. For a grid system, optimization through technology has significant carbon reduction effects even if the power grid structure is not changed. Using renewable energy instead of traditional fuel can reduce the emission of 0.05 kg of CO2-equivalent greenhouse gas per 1 kWh of electricity produced, which is 7.9% of the baseline, and microgrid technology leads to a much greater carbon reduction potential of 23.8% of the baseline. The role of energy storage is undervalued due to the limitations of the data.
1. Introduction
The power sector plays a significant role in carbon neutrality strategies. At present, there are various carbon reduction technologies emerging for power generation, grids, storage, and demand. These emerging technologies can also be combined to adapt to different situations. Renewable energy is regarded as the most important solution to carbon neutrality strategies, and there are many emerging technologies in this field. However, the utilization of renewable energy relies on the adaptation capacity of a grid. Energy storage can increase the flexibility of a grid, improve the load, frequency modulation, and voltage regulation ability, and optimize the grid tide distribution to improve the reliability of the power grid so that it can improve the adaptive capacity of renewable energy. Therefore, a power grid is the interface of the interaction of various elements in a power system for which either side’s dependence on a novel grid system will not only enable the projection of more renewable electricity and increase stability, but also enhance the efficiency in reducing carbon emissions [1,2,3].
While technological innovation has significantly reduced pollution in the past few decades, the understanding of the environmental impact of the power grid system has long been limited to the narrowly defined power transmission process, including line losses, the ecological environmental impact of power grid projects, solid waste, and the environmental impact of office facilities. In recent years, with the tightening of national environmental protection regulations and standards, the above environmental problems have been improved, especially line losses. At present, some companies have reached the best international level, and the possibility of further reducing their environmental impact is very limited. However, with the requirements of ecological civilization and carbon neutrality, a country will have higher environmental protection and energy conservation requirements for enterprises. Determining how to further tap the potential for this has become a major issue for power grid enterprises [4,5,6].
China is one of the main countries that has committed to achieving carbon neutrality by 2060, for which the grid system is a critical target. As illustrated in Figure 1, for China’s national target towards carbon neutrality, the technology for roadmap highlights, low-carbon electricity, and the grid system are important. Furthermore, with the shrinking carbon mitigation potential, determining how to uncover the mitigation potential via system innovation is critical. As shown in the highlights of Figure 1, the deep electrification model, as well as whole-life grid management including “source, grid, load, and storage,” has a significant second potential for environmental protection and energy conservation [4,7,8,9,10]. However, determining what kind of electrification model the grid companies will choose requires systematic accounting and identification using advanced methods.
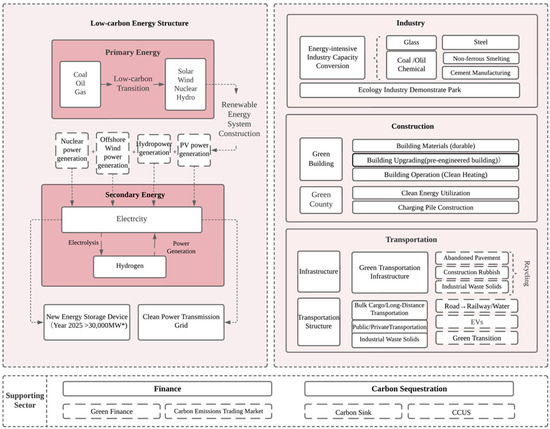
Figure 1.
China’s carbon neutralized technologies highlights. * According to “State Council of the Action Plan for Carbon Dioxide Peaking Before 2030”, China aims to develop the new energy storage devices under the installation volume of 30,000 MW by 2025.
Existing environmental impact accounting tools such as ecological designs, cleaner production audits, and ISO14001 are mostly principle-based regulations lacking specificity for different industries that have not been widely promoted. At present, some scholars have carried out research in the field of the comprehensive evaluation of a low-carbon grid. Carbon emission is taken into consideration for grid planning through the method of super-efficiency data envelopment analysis (SE-DEA) [11]. Existing studies with a particular focus on the Chinese context include, but are not limited to, the following: Tan Wei et al. categorized the main methods for a smart grid to reduce carbon emissions in power generation, transmission, distribution, and electricity consumption; they developed the low-carbon index evaluation system for a smart grid and discussed the specific steps to evaluate the low-carbon level of a smart grid [12]. Gu Wenzhao established a low-carbon efficiency evaluation method framework [13]. Sun Yanlong developed a set of comprehensive evaluation index systems based on the life cycle of a grid for planning, construction, operation, and equipment and applied this to the Jiangsu grid and some cities in Shandong [14]. Niu Xinsheng et al. analyzed the low-carbon development of the Shandong grid in terms of the transmission loss, utilization rate, and comprehensive evaluation of the low-carbon benefit [15]. Tan et al. evaluated the carbon dioxide emission coefficient and energy consumption of a regional distributed grid in Jiangxi Province using the life cycle evaluation method [4].
Life Cycle Assessment (simplified as LCA in the following context) is a prevailing analytical tool that quantifies the entire life of a product from design, manufacture, assembly, transportation, use, maintenance, and scrapping to recycling and regeneration, and finally, to disposal. The environmental impacts of energy and raw material consumption, waste discharge, and other indicators in the cycle are evaluated [16,17,18,19,20,21]. The life cycle perspective can fully reflect the environmental impact of the power grid production methods and technical routes, expand the scope of the power grid environmental impact, and highlight the criticality of technology path selection in a diverse technology and market environment. There have been emergent studies that assessed the environmental impacts of grid systems [22,23], storage technologies [24,25,26], and grid management from the life cycle perspective with LCA applied [27,28]. However, these studies were mainly focused on the technology level, e.g., materials for storage technologies, or on the macro level for national or regional grids. Applying LCA as a support tool to analyze and optimize a grid system’s structure and supply chain in a Chinese context is still an emerging field requiring more intensive study.
Based on the above, the aim of this study is to contribute to the following research gaps: (1) The establishment of the existing evaluation system mainly focuses on the identification of low-carbon elements in a grid, and the measurement of the low-carbon potential of structural elements has not been unified. In this study, LCA is conducted to investigate the systematical effects and perform a comparison with traditional technical innovation. (2) Existing studies have paid more attention to traditional grids, and there has been little discussion on energy storage systems, microgrids, and other new technologies. In this study, a comprehensive evaluation of a low-carbon grid is performed with the incorporation of multiple elements, including a micro-grid, structural optimization, and location-oriented renewable energy projection. (3) We collected first-hand data from the power grid enterprise to conduct research within the Chinese 14th Five-Year Plan context.
2. Methods and Materials
2.1. LCA
LCA is a technique used to quantify the environmental impact of a product (or service) from raw material acquisition through end-of-life disposition (cradle-to-grave). As an environmental management tool and preventive environmental protection method, life cycle assessment is mainly used to assess the environmental load caused by a product, process, or production activity by determining and quantifying the use of energy and materials and the environmental discharge of waste, by evaluating the impact of energy, material utilization, waste discharge, and environmental improvement methods.
In this study, a standard LCA is performed using the steps illustrated in Figure 2:
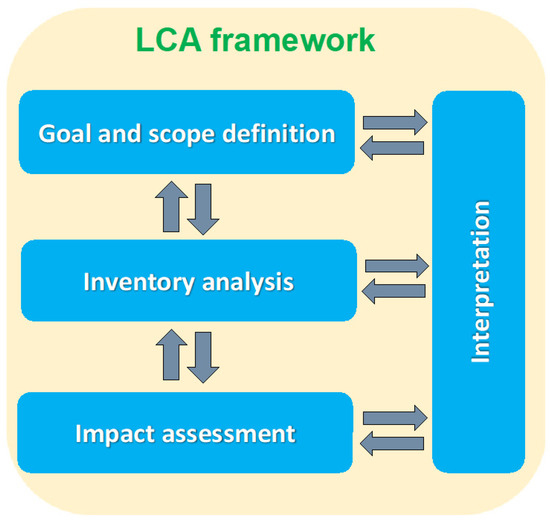
Figure 2.
LCA framework.
- (a)
- Defining the analysis (the scope of the LCA): The purpose and significance of carrying out the life cycle assessment and the expected use purpose of the research results, such as improving the environmental performance of the system itself, using it for environmental declarations, or obtaining environmental labels are explained. The research objects that need to be determined include the functional units, system boundaries, time ranges, impact assessment ranges, and data quality requirements.
- (b)
- Inventory analysis (Life Cycle Inventory, simplified as LCI in the following context) or logistics inventory (Inventory Analysis): Data are collected, and the calculation program is designed. The purpose is to quantify the relevant input and output variables of the product system. Input and output variables generally include the resource usage related to a system, as well as emissions to air, water, and land. After the data collection is completed, the above data are explained based on the results of the purpose and scope of the LCA.
- (c)
- Impact Analysis: A product system is reviewed from an environmental perspective by using impact types and type parameters related to the LCI results, and information for the life cycle interpretation stage is provided. The impact analysis consists of four steps: determining the type of impact and the types of parameters, selecting a characterization model, classifying and characterizing the impact, and quantifying the results of the evaluation.
- (d)
- Life cycle interpretation: The life cycle interpretation is based on the findings of the previous stages of LCA or LCI research. This includes analyzing results, forming conclusions, explaining limitations, making recommendations, and reporting the results for the life cycle interpretation.
- (e)
- Improvement Analysis: Recommendations are made based on the evaluation results.
In developed countries such as European countries and the United States, due to the relatively complete life cycle databases, life cycle concepts and LCA analysis methods have been widely used in energy system analysis and renewable energy evaluation. The applications mainly involve designing system analysis and evaluation indicators such as carbon emissions, climate change, acid rain, ozone layer holes, land use, economic costs, and the impact on society for the energy system or new energy technology from resource extraction to power generation. Then, the whole life cycle process of waste discharge is examined for comprehensive analysis or evaluation. Although the current international life cycle method can systematically and comprehensively evaluate different renewable energy technologies from multiple angles, because China does not currently have a complete database, it is not yet possible to use this method for the development of new energy systems and sources. In China, the existing research that cannot be used is mostly focused on the elaboration of concepts and the construction of a framework, and quantitative analysis is lacking. One of the key development directions in the future is to improve the construction of life cycle databases related to energy systems and new energy technologies, improve new energy technology information databases, and provide a higher-level information platform for the analysis and evaluation of energy technologies and policies.
2.2. Scenario Design
In this study, a mature comparative LCA analysis is performed based on the design of novel scenarios. Mainstream grid technology and the recent pilot practices of the company are taken into consideration for scenario design. We try to explore the differences between various technology schemes from the perspective of carbon emissions. To answer this, we design four scenarios for analysis. The detailed scenario considerations are illustrated as follows:
Typical life cycles of the grid system are simplified into four aspects, as shown in Figure 3: (1) Source: This refers to power generation, including thermal power, wind power, photovoltaics, hydropower, and nuclear power. (2) Grid: This refers to power transmission and distribution, including through substations, overhead lines, and cable lines. (3) Storage: This refers to electricity storage for electric vehicles and others. (4) Load: This refers to electricity consumption, including by enterprises, users, and electric vehicles, as well as for storage.
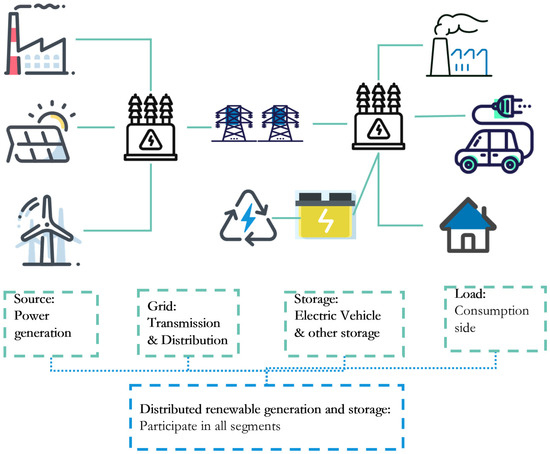
Figure 3.
Life cycle process for the grid system.
It should be noted that the grid system involves the entire process of the source, grid, storage, and load. Therefore, the grid system has various modes based on whether there is energy storage and the location of the energy storage, which can be determined from the situation. The actual production model includes all the components of the whole life cycle process illustrated in Figure 3. The transmission, transformation, and distribution processes are mainly supported by various facilities, equipment, chemicals, and fuels. The facilities and the equipment refer to the primary and secondary equipment such as transmission lines, towers, insulator strings, overhead lines, transformers, reactors, and capacitors. Power refers to the actual power generation structure. For thermal power, efficiency is an indicator of coal consumption. Other energy sources have their own efficiency indicators, and their facilities and equipment are not included in the life cycle of the power grid. Energy storage includes chemical energy storage and physical energy storage. This includes investment in facilities and equipment as well as inputs in materials. The user side mainly includes the level of electrification and efficiency, and its facilities and equipment are generally not included.
Based on the typical life cycles of the grid system, and with consideration of the local situation, the scenarios are designed and summarized, as shown in Figure 4.
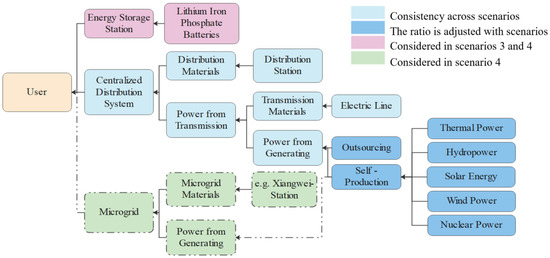
Figure 4.
Scenario design in this study.
The details of the scenarios are as follows:
- Baseline scenario (Scenario 1): This is the current status (2020), including the current power supply structure and current grid layout.
- Scenario 2: This contains an optimized power supply structure and introduces renewable energy power generation scenarios.
- Scenario 3: The power structure in this scenario is the same as that in scenario 2, while energy storage is added and the per kilowatt amount of electricity is transmitted to the user, and the energy storage accounts for 0.023 degrees.
- Scenario 4: The power supply structure and the energy storage in this scenario are the same as those in scenario 3, but a distributed function mode is added, and 30% of the power supply share is selected.
The basic data for scenario setting are presented in Table 1.

Table 1.
Summary of scenario data for energy structure.
2.3. System Boundary and Functional Unit
Based on the scenario design, the system boundary of this study goes from resource exploitation to product delivery and includes the production stage of the upstream raw materials, as well as that of the auxiliary materials and energy; the power generation stage of thermal power, hydropower, solar power, nuclear power, and wind power; and the transmission and distribution process, energy storage process, and microgrid process, as shown in Figure 4. The system boundary does not include power station construction, transportation of raw materials and auxiliary materials, or the infrastructure of other facilities in the power generation stage. The detailed system boundary for key scenarios is shown in Figure 5, Figure 6 and Figure 7.
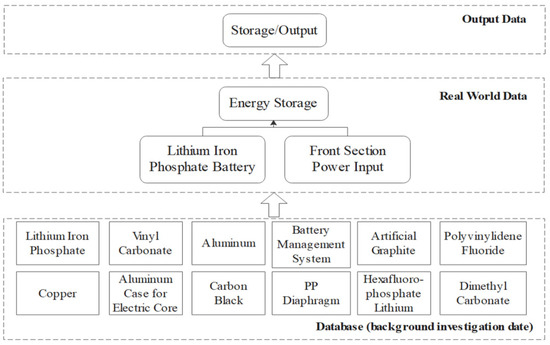
Figure 5.
System boundary of the Guangdong Power Grid for users.
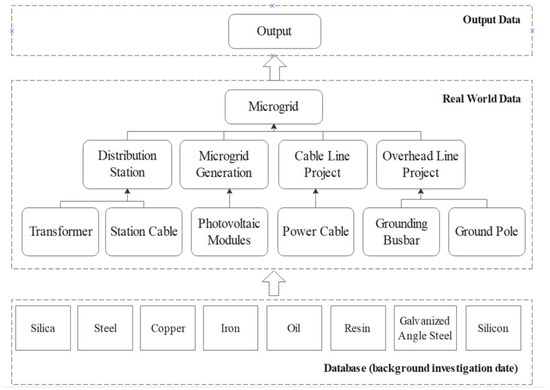
Figure 6.
System boundary of the microgrid.
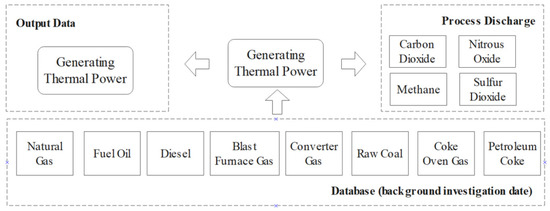
Figure 7.
System boundary of thermal power.
According to the system boundary and scenario design, the functional unit is defined as 1 kWh power passing through the regional power grid to end-users.
2.4. Data and Assumptions for Scenarios
According to the scenario design and the baseline data collection in Table 1, the basic data analysis for each scenario for follow-up LCA is presented below:
Scenario 1 is the baseline, and the data are presented in Table 1 (left column). The first scenario is the situation in 2020 for the Guangdong power grid. The data are the real data that are provided by the company. In terms of the total power generated in 2020, 28.95% was purchased from outside Guangdong, while the remainder was generated in Guangdong, of which thermal power, hydropower, nuclear power, wind power, and solar power account for 67.86%, 5.65%, 22.99%, 2.04%, and 1.46%, respectively. Scenario 2 focuses on the optimization of the power supply structure. The second scenario is the planned situation for 2025 for the Guangdong power grid, which is different from the first scenario in terms of the power source. The purchased percentage of power from outside the province falls from 28.92% to 25%, while the other 75% is generated inside the province. The percentage of thermal power falls from 67.86% to 60%, the percentage wind power and solar power rise, and the percentages of hydropower and nuclear power remain unchanged. The data are from the 14th Five-Year Plan of the company.
For scenario 3, the energy storage is added. The third scenario adds the storage component, which is not listed in the 14th Five-Year Plan of the company but is strongly encouraged. The power source is the same as that for the second scenario. According to national policy, any electricity generated from renewable sources should be equipped with a storage capacity of at least 20%. It is calculated that for every 1 kWh of electricity for the user, the power transmitted through the energy storage link is 0.023759 kWh. According to the analysis results given in the literature, some studies have shown that the efficiency of the charger is 95–96%. It is assumed that the charge and discharge efficiency of the lithium iron phosphate battery in the energy storage station in this report is 0.9 (the discharge efficiency refers to the ratio of the energy released by a battery to the energy input during a charge and discharge cycle). The real data for the material consumption of the storage process are from a pilot project in the province.
Scenario 4 is the focus of the research. The fourth scenario is the most recommended, and it represents the future trends of the power system that includes the source, grid, storage, and microgrid. The real data for material consumption are from the Xiangwei station demonstration project in Dongguan city. For the input proportion of the microgrid and the central power, according to the scenario setting, 30% of the microgrid power supply is defined, and the centrally generated power supply accounts for 70% of the energy storage component; that is, for 1 kWh of power for the user, the power transmitted through the storage path is 0.0759 kWh. In terms of central power generation, the proportions of thermal power, hydropower, wind power, solar power, and nuclear power are the same as those for the second and third scenarios.
The assumption of the LCA model of scenarios is summarized in Table 2.

Table 2.
Assumptions of the LCA model.
2.5. Data Sources and Software
The data for the scenarios are composed of two parts: (1) The main inventory data come from the China Life Cycle Basic Database (CLCD) and the Ecoinvent 3.6 databases. (2) The scenario-related data, e.g., the engineering data and volume data, come from the firsthand survey based on the project. The data temporal representativeness is 2019, and the geographical representativeness is Guangdong Province.
Due to the large scale of the data, in this study, LCA software is applied to quantify the impact assessment for scenarios comparison. We apply the software to build the scenarios (material and energy input and output relations) based on the scenario design. We also calculate the impact assessment based on the impact coefficients. The built-in database of the software offers the coefficients for the materials and energy, which is applied to calculate the environmental impact such as the global warming potential (GWP). The software will support the calculation on large scale inventory data.
Considering this study applies many first-hand data, the localized database “China Life Cycle Basic Database (CLCD)” is applied. One prevailing online LCA analytical platform, named “eFootprint” (https://www.efootprint.net (accessed on 10 January 2022)) is applied. It is developed by EKE Environmental Technology Co., Ltd., Chengdu, China, which is a major local commercial company for LCA software development. The software system supports full life cycle process analysis and has a built-in mainstream LCA database such as the EU ELCD database and Ecoinvent database, as well as Chinese localized database CLCD. The CLCD database used in the research is an industrial average database developed by EKE based on the core model of the life cycle of China’s basic industrial systems. It includes inventory datasets for major domestic energy, transportation, and basic raw materials.
The eFootprint (Beta version) supports analysis on 14 environmental impacts categories, has the built-in algorithms for material composition and emission factors. The online interface is also user friendly to build scenarios. It also integrates many supply chain data based on the survey to improve the built-in database.
3. Results and Discussions
The inventory analysis and the impact assessment for the indicator according to the scenario design are listed in Table 3, Table 4, Table 5 and Table 6.

Table 3.
Results for scenario 1.

Table 4.
Results for scenario 2.

Table 5.
Results for scenario 3.

Table 6.
Results for scenario 4.
The detailed impact assessment is shown in Figure 8a–d. Through the LCA, it can be seen that the environmental impacts of different scenarios are different. When examining the impact of a grid’s entire life cycle, one cannot focus only on carbon emissions. The power structure has a decisive impact on carbon emission reduction. The use of renewable energy instead of traditional fuel can reduce the emission of 0.05 kg of CO2-equivalent greenhouse gas per 1 kWh of electricity produced, which is 7.9% of the baseline. However, for the grid system, optimization through technologies has significant carbon reduction effects even if the power structure is not changed. In scenario three, energy storage stations are added based on clean energy, thus increasing the power grid’s capacity to absorb renewable energy. Theoretically, this optimization on the grid side should further increase the carbon reduction potential of the power grid, but the calculated result for the carbon reduction potential in scenario three is almost the same as that in scenario two. The current energy storage technology is not mature, and phosphoric acid batteries used in the process of adding energy storage stations usually produce more carbon emissions. Although storage can increase the clean energy power proportion and decrease the power loss, which can lead to carbon emission reduction, this potential cannot be calculated due to the lack of data. Scenario four applies microgrid technology to the power grid, showing a good carbon reduction potential. In this case, the production of 1 kWh of electricity can reduce 0.15 kg of CO2-equivalent greenhouse gas emissions, which is 23.8% of the baseline, and the carbon reduction potential is 300% of that of scenario two.

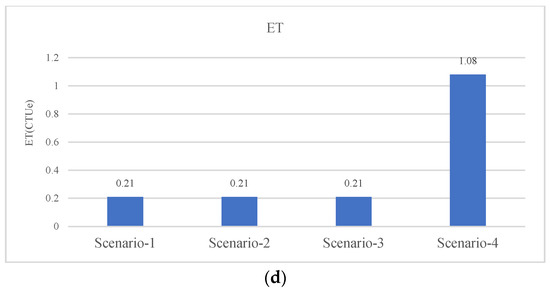
Figure 8.
Results of impact assessment. (a) Results and comparison of global warming potential (GWP). (b) Results and comparison of primary energy demand (PED) and water utilization (WU). (c) Results and comparison of acidification effect (AP) and eutrophication effect (EP). (d) Results and comparison of ecological toxicity (ET).
According to the general analytical results, several points are highlighted:
- (1)
- Although scenario four has the lowest lifetime carbon emissions, its other environmental impacts, including metal resource consumption, ecotoxicity, and eutrophication, are significant compared to the other scenarios. Its metal consumption, water consumption, eutrophication potential, and ecotoxicity per unit yield are 5.07 times, 2.48 times, 4.48 times, and 5.14 times, respectively. These results suggest that the contribution of the microgrid to carbon emission reduction may be accompanied by an increase in other aspects of environmental compliance.
- (2)
- The above is mainly caused by the following factors. First, a microgrid is a type of distributed model, and compared with a traditional centralized grid, it requires the construction of a larger number of smaller but fully functional sites, including power stations, substations, and transmission lines, which results in more consumption. Second, the construction and use of a microgrid have a scale effect. The larger the power generation is, the lower the environmental cost is. The data used in this study are from the Xiangwei Station project in Guangdong Province, which is only involved in a small part of power transmission as a pilot project at present. Compared with the power transmission in the first three scenarios, the scale of this project is much smaller; so, the materials consumed per unit of power and the impact caused by the project are relatively larger.
- (3)
- In some cases, the construction of the infrastructure only accounts for a very small percentage of the total impact that is usually not included in the inventory, while in our case, this percentage accounts for a very large proportion of the total impact due to the very small scale.
- (4)
- The calculation result of the environmental impact is very large. A microgrid and means for energy storage will increase metal consumption, which can be offset by resource recovery. It is suggested that resource recovery or a waste recycling strategy should be implemented to offset metal consumption.
4. Conclusions and Policy Implications
4.1. Conclusions
On 25 February 2021, the National Development and Reform Commission of China issued the development guidance of “promoting the integration of source-grid-load-storage” and “multi-energy complementary” drafted by the National Energy Bureau. This policy put forward the idea of optimization of the local power supply side, the grid side, and the load side, and could foster the advanced technology breakthroughs and innovation of the mechanism of a power system. In this study, we examine the full life cycle of a grid, which is in line with the national policy. The conclusions have implications for the technical improvement and policymaking of a power grid.
This study shows that thermal power is still the main source of carbon emissions on the power generation side. Accelerating the transformation of the energy structure and improving the proportion of renewable electricity such as wind power, photoelectric power, and nuclear power can significantly reduce carbon emissions.
The results of the LCA prove that the structural reform on the power grid side can greatly promote carbon emission reduction. The carbon reduction potential of applying microgrid technology to the grid is three times greater than that of adjusting the energy structure alone. However, in practice, the potential of carbon reduction in the grid has not been fully explored. At the technical level, large capacity storage technology and pumped storage technology are relatively immature. The microgrid scenario has a promising prospect of carbon reduction, but it could lead to a significant increase in resource consumption and environmental pollution, which is not in line with the concept of the coordinated development of pollution reduction and carbon reduction. At the management level, most of the current optimization reforms are in the initial and pilot stages, meaning they cannot provide the full range of the scale effect of new technologies and can easily lead to the waste of construction and operation costs.
4.2. Policy Implications
According to the critical findings, several policy implications are highlighted for further discussion:
- (a)
- This study uncovers the fact that the second mitigation potential can be achieved via grid system improvement, e.g., incorporating a micro-grid. From the perspective of the implementation of this type of systematic innovation, the fundamental infrastructures will be important. Therefore, we recommend that the policymakers offer the necessary support and an incentive package for the grid infrastructure construction.
- (b)
- We also highlight the benefits of thinking and managing power systems in terms of the life cycle. In operation, this requires more harmonious collaboration with multiple stakeholders over the complete life cycles (or rather, the complete supply chains). In addition, this calls for attention from policymakers to address novel regulations with consideration of the complete life cycles.
- (c)
- Finally, we perform an accounting of environmental and low-carbon benefits for the grid system. The LCA is proven to be a powerful and systematic method. Therefore, we recommend the further application of LCA for carbon credit accounting and the relevant databases, particularly the enterprise data reporting schemes for database construction.
4.3. Limitations
Finally, as a preliminary study, there are also several limitations that need to be discussed and resolved in the future. The processes are interconnected with a tree structure, require a wide range of data, and are difficult to collect data for. Additionally, some scenarios in this study are forward-looking. Considering possible scenarios in the future, there is no completely consistent case for research. Only analogous research can be performed. Therefore, this study cannot achieve optimal data integrity, and appropriate adjustments are made. For the energy storage link, the analogy of the car energy storage battery is used. For the power transmission link, the cable insulation shell is not considered. For the power generation link, the grid demand is oriented, and the construction of various power stations is not considered. The role of power storage is not obvious because of the cost. This study takes a power grid as the primary research object and does not consider the consumption and waste of electricity before going online; as a result, the role of energy storage cannot be quantified.
Concerns about future improvements include the following: (1) Calculating the electricity before going online, taking into consideration the electricity wasted because of the loss of the energy storage link, and studying and comparing the environmental impact changes before and after the grid system is added to the energy storage link. (2) Strengthening the integrity and accuracy of the data and trying to add things such as cable insulation shells for research.
Author Contributions
Data curation, S.L.; Formal analysis, L.D.; Investigation, S.L. and L.H.; Methodology, L.H.; Project administration, J.H.; Resources, L.D.; Software, L.D.; Supervision, B.Q.; Validation, L.H.; Visualization, J.H.; Writing—original draft, S.L.; Writing—review & editing, J.H. and B.Q. All authors have read and agreed to the published version of the manuscript.
Funding
This research appreciates the financial support by: International collaboration project by NSFC (NO. 72061137071) and Dutch Research Council (NWO) (No. 482.19.608). General research grant for young scientist of NSFC: 41701636; CityU start-up grant (No. 7200668); and Guangdong Power Grid Corporation Electric Power Planning Special Research Project: Guangdong Power Grid’s “14th Five-Year” Energy Conservation and Environmental Protection Planning: 031000QQ00200010.
Institutional Review Board Statement
Not applicable.
Informed Consent Statement
Not applicable.
Data Availability Statement
The study did not report any data.
Conflicts of Interest
The authors declare no conflict of interest.
References
- Khan, I. Importance of GHG emissions assessment in the electricity grid expansion towards a low-carbon future: A time-varying carbon intensity approach. J. Clean. Prod. 2018, 196, 1587–1599. [Google Scholar] [CrossRef]
- Liwen, F.; Huiru, Z.; Sen, G. An Analysis on the Low-carbon Benefits of Smart Grid of China. Phys. Procedia 2012, 24, 328–336. [Google Scholar] [CrossRef] [Green Version]
- Yadoo, A.; Cruickshank, H. The role for low carbon electrification technologies in poverty reduction and climate change strategies: A focus on renewable energy mini-grids with case studies in Nepal, Peru and Kenya. Energy Policy 2012, 42, 591–602. [Google Scholar] [CrossRef]
- Cao, Y.; Wang, X.; Li, Y.; Tan, Y.; Xing, J.; Fan, R. A comprehensive study on low-carbon impact of distributed generations on regional power grids: A case of Jiangxi provincial power grid in China. Renew. Sustain. Energy Rev. 2016, 53, 766–778. [Google Scholar] [CrossRef]
- Verbong, G.P.; Beemsterboer, S.; Sengers, F. Smart grids or smart users? Involving users in developing a low carbon electricity economy. Energy Policy 2013, 52, 117–125. [Google Scholar] [CrossRef]
- Wrapson, W.; Devine-Wright, P. ‘Domesticating’ low carbon thermal technologies: Diversity, multiplicity and variability in older person, off grid households. Energy Policy 2014, 67, 807–817. [Google Scholar] [CrossRef] [Green Version]
- Baumgärtner, N.; Delorme, R.; Hennen, M.; Bardow, A. Design of low-carbon utility systems: Exploiting time-dependent grid emissions for climate-friendly demand-side management. Appl. Energy 2019, 247, 755–765. [Google Scholar] [CrossRef]
- Protopapadaki, C.; Saelens, D. Towards metamodeling the neighborhood-level grid impact of low-carbon technologies. Energy Build. 2019, 194, 273–288. [Google Scholar] [CrossRef]
- Yadoo, A.; Gormally, A.; Cruickshank, H. Low-carbon off-grid electrification for rural areas in the United Kingdom: Lessons from the developing world. Energy Policy 2011, 39, 6400–6407. [Google Scholar] [CrossRef]
- Yao, X.; Fan, Y.; Zhao, F.; Ma, S.-C. Economic and climate benefits of vehicle-to-grid for low-carbon transitions of power systems: A case study of China’s 2030 renewable energy target. J. Clean. Prod. 2021, 330, 129833. [Google Scholar] [CrossRef]
- Yang, S.; Zhang, Q.; Xu, Q.; Zhang, Y. Research on grid evaluation Index by SE-DEA model based on low carbon theory. Hydropower Energy Sci. 2010, 28, 169–171. [Google Scholar] [CrossRef]
- Tan, W.; He, G.; Liu, F.; Huang, W.; Deng, Z.; Deng, Y. Preliminary study on low-carbon index sysytem of smart grid. Power Syst. Autom. 2010, 34, 1–5. [Google Scholar]
- Jia, W.; Kang, C.; Liu, C.; Li, M. Evaluation model of the ability and benefit of smart grid to promote low-carbon development. Power Syst. Autom. 2011, 35, 7–12. [Google Scholar]
- Sun, Y.; Kang, C.; Chen, S.; Meng, J.; Lu, C.; Luo, J. Evaluation index and approch about low-carbon grid. Power Syst. Autom. 2014, 38, 157–162. [Google Scholar]
- Niu, X.; Tian, X.; Zhu, X.; Zhao, G.; Dong, X.; Sun, Y. Comprehensive assessment of low-carbon grid development in Shandong Province. Electr. Power Constr. 2015, 36, 141–148. [Google Scholar]
- Chambile, E.; Ijumba, N.; Mkandawire, B.; Hakizimana, J.D.D. Data on the life cycle carbon emission in Kenyan, Rwandan, and Tanzanian grid electricity generation and transmission systems. Data Brief 2021, 40, 107692. [Google Scholar] [CrossRef]
- Ding, N.; Pan, J.; Liu, J.; Yang, J. An optimization method for energy structures based on life cycle assessment and its application to the power grid in China. J. Environ. Manag. 2019, 238, 18–24. [Google Scholar] [CrossRef]
- McCallum, C.S.; Kumar, N.; Curry, R.; McBride, K.; Doran, J. Renewable electricity generation for off grid remote communities; Life Cycle Assessment Study in Alaska, USA. Appl. Energy 2021, 299, 117325. [Google Scholar] [CrossRef]
- Santoyo-Castelazo, E.; Solano-Olivares, K.; Martínez, E.; García, E.; Santoyo, E. Life cycle assessment for a grid-connected multi-crystalline silicon photovoltaic system of 3 kWp: A case study for Mexico. J. Clean. Prod. 2021, 316, 128314. [Google Scholar] [CrossRef]
- Soimakallio, S.; Kiviluoma, J.; Saikku, L. The complexity and challenges of determining GHG (greenhouse gas) emissions from grid electricity consumption and conservation in LCA (life cycle assessment)—A methodological review. Energy 2011, 36, 6705–6713. [Google Scholar] [CrossRef]
- Gwerder, Y.V.; Marques, P.; Dias, L.C.; Freire, F. Life beyond the grid: A Life-Cycle Sustainability Assessment of household energy needs. Appl. Energy 2019, 255, 113881. [Google Scholar] [CrossRef]
- Kuo, C.-H.; Hu, A.H.; Hung, L.H.; Yang, K.-T.; Wu, C.-H. Life cycle impact assessment of semiconductor packaging technologies with emphasis on ball grid array. J. Clean. Prod. 2020, 276, 124301. [Google Scholar] [CrossRef]
- Hou, G.; Sun, H.; Jiang, Z.; Pan, Z.; Wang, Y.; Zhang, X.; Zhao, Y.; Yao, Q. Life cycle assessment of grid-connected photovoltaic power generation from crystalline silicon solar modules in China. Appl. Energy 2016, 164, 882–890. [Google Scholar] [CrossRef]
- Mori, M.; Gutiérrez, M.; Casero, P. Micro-grid design and life-cycle assessment of a mountain hut’s stand-alone energy system with hydrogen used for seasonal storage. Int. J. Hydrogen Energy 2020. [Google Scholar] [CrossRef]
- Zhao, Y.; Tatari, O. A hybrid life cycle assessment of the vehicle-to-grid application in light duty commercial fleet. Energy 2015, 93, 1277–1286. [Google Scholar] [CrossRef]
- Pellow, M.A.; Ambrose, H.; Mulvaney, D.; Betita, R.; Shaw, S. Research gaps in environmental life cycle assessments of lithium ion batteries for grid-scale stationary energy storage systems: End-of-life options and other issues. Sustain. Mater. Technol. 2019, 23, e00120. [Google Scholar] [CrossRef]
- Jalaei, F.; Guest, G.; Gaur, A.; Zhang, J. Exploring the effects that a non-stationary climate and dynamic electricity grid mix has on whole building life cycle assessment: A multi-city comparison. Sustain. Cities Soc. 2020, 61, 102294. [Google Scholar] [CrossRef]
- Norouzi, M.; Colclough, S.; Jiménez, L.; Gavaldà, J.; Boer, D. Low-energy buildings in combination with grid decarbonization, life cycle assessment of passive house buildings in Northern Ireland. Energy Build. 2022, 261, 111936. [Google Scholar] [CrossRef]
Publisher’s Note: MDPI stays neutral with regard to jurisdictional claims in published maps and institutional affiliations. |
© 2022 by the authors. Licensee MDPI, Basel, Switzerland. This article is an open access article distributed under the terms and conditions of the Creative Commons Attribution (CC BY) license (https://creativecommons.org/licenses/by/4.0/).