Abstract
Economic development is mainly dependent on fossil fuels. The massive use of fossil fuels has led to changes in the climate environment, in which the deterioration of air quality has affected people’s daily lives. This paper introduces the green growth level as a control variable to explore the connection between carbon dioxide emissions and the level of economic growth. It uses the EKC algorithm and VEC model to analyze Nanjing city’s data from 1993 to 2018. Given the data availability, the ARIMA algorithm was used to project carbon emissions for 2019–2025. It is found that the EKC curve of Nanjing City shows an N-shape, and the growth of economic level will cause the enhancement of carbon dioxide emissions. Carbon emissions will reach 7,592,140 tons in 2025. At present, we are in an essential stage of transition from N-shape to inverted U-shape, and this paper makes several recommendations based on the findings.
1. Introduction
The year 2020 is an excellent year for everyone. Since the beginning of the year, the neo-crowning epidemic has swept across the world, affecting people’s lives and production and having a massive impact on economic development. The ecological environment is the material prerequisite for economic growth, and environmental security that directly affects economic security. As the largest developing country, China’s rapid industrial development has caused many environmental problems. China has therefore taken several measures, such as accelerating the phasing out of outdated coal-fired power generation technologies, implementing a carbon disclosure mechanism, implementing stricter carbon emissions and environmental protection policies, and establishing an annual “China Low Carbon Day” on 19 June. Overall, China’s economy is mainly relying on its primary energy resources. However, such sources are located primarily in less-improved regions. The energy efficiency in these areas is substantially lower than in more developed provinces due to a lack of advanced technology, equipment, and managerial experience. The transfer of energy-intensive industry from coastal to inland areas and increased reliance on natural resources from these resource-rich locations has substantially increased the energy intensity in these regions. Furthermore, this unprecedented urbanization has brought about another challenge. Between 1997 and 2006 in China, a total of 12,869 km2 of land was converted into built-up areas, stimulating a great demand for basic infrastructure, containing water, electricity, Internet, wastewater treatment, gas, roads, and heating. Finally, improving the quality of life in cities increased the total carbon emissions due to increased demand for larger living spaces and more vehicles and increased the use of home electronic appliances. For example, China has become the world leader in vehicle manufacturing and sales since 2009, causing a massive amount of steel and gasoline consumption and an excellent investment in the transportation infrastructure. In recent years, the 13th Five-Year Plan has further set the goal of further decreasing carbon emission intensity by 18% by 2020, while China’s Independent Contribution to Emission Reductions (INDC) submitted to the Paris Agreement also promises that, by 2030, China’s carbon emission intensity will be 60–65% lower than in 2005. However, the progress to achieve these goals is not remarkable. The tasks of energy saving and emission reduction are urgent and cannot be underestimated.
At present, China’s economic development has moved from the high-speed to high-quality development stage, which puts forward higher requirements for ecological construction. Therefore, in order to promote high-quality products in the post-epidemic era, we should focus on the connection between economic development and environmental structures and deal with the link between economic benefits and environmental protection. We should use ecological and environmental protection to help promote economic development. Despite the impact of the epidemic, it will not change the momentum of China’s economic growth. China and the rest of the world can only work together to solve the global public crisis.
Economic development is primarily supported by fossil fuels, which have led to climate and environmental changes, such as the greenhouse effect, water pollution, etc. Climate change is the most significant environmental challenge facing human society today, especially in the form of environmental pollution, especially smog and other air pollutions. Jiangsu Province is in the YRD (Yangtze River Delta) region, which has the highest economic density in China and is China’s number one manufacturing base. In the first 4 years of the 13th 5-Year Plan, the carbon emission intensity of Jiangsu Province has been reduced by about 24.5%. The energy consumption per unit of the GDP of Jiangsu Province has been reduced by 3.2%. Compared with the previous year, Jiangsu Province’s energy consumption per unit of GDP decreased by 5.54% and 6.18%, respectively, in 2017 and 2018, exceeding the annual target of a 3.7% decline. In 2019, Jiangsu Province achieved remarkable achievements in energy conservation and emission reduction and exceeded the annual target, and the province’s carbon intensity decreased by a total of about 24.5% in the first four years of the “13th Five-Year Plan”. The province’s energy consumption per unit of the gross domestic product fell by 3.2%, exceeding the binding target of reducing it by 3% and reducing it by a total of 18.2% from 2016 to 2019, completing the 13th Five-Year Plan target set by the state ahead of schedule. According to the data, 2020 has arrived as promised, and environmental protection efforts have taken another step forward and achieved good results. Among them, Nanjing has the highest number of days with excellent air quality in the province.
As an essential comprehensive industrial production base, modern service center, and advanced manufacturing base in Jiangsu Province and the country, Nanjing has achieved exemplary energy conservation and emission reduction in recent years. This paper selects a scientific data analysis algorithm. It collects authoritative statistical data to empirically study the dialectical connection between economic growth, green coverage in built-up areas, and energy and carbon emissions in Nanjing, which are highly representative and scientific and can provide valuable experience for developing countries and regions.
2. Literature Review
Zhang et~al. [1] used symbolic regression to fit the PM2.5 concentration and GDP per capita data of 31 local administrative units (excluding Hong Kong, Macao, and Taiwan) in China from 1998 to 2016 to build a reliable model for each province. The main conclusions are: (1) there are four main model structures, including an inverted U-shaped model and three N-shaped models, and there may be more than one explanatory model for a province; (2) the relationship between haze pollution and economic development in China shows prominent geographic characteristics, with an east–west distribution; (3) the inverted U-shaped model is more suitable for high-income and middle-income regions, while the N-shaped model is more suitable for high-income and middle-income areas; and (4) according to local conditions, each province should take measures according to its environmental pollution level and the best-fit model.
Zhang et~al. [2] conducted a study for the second tier of emerging economy countries, the New Diamond 11 countries (NEXT 11). The EKC model added the urbanization level indicator to analyze the relationship between urbanization and carbon dioxide emissions. Finally, he added a cross term between the urbanization and economic development levels to reflect the moderating effect between the two main explanatory variables. The study’s conclusion showed that, in the development process of 11 countries, the relationship between economic development and urbanization and carbon emission level shows an environmental Kuznets curve, which was rising first and then decreasing, and the influence of economic growth on carbon emissions differed significantly among different countries.
Based on the investigation of the 3E system, Liu et~al. [3] followed the principles of science: comprehensiveness, systematization, and operability, to establish the 3E index system. A comprehensive evaluation of the 3E system in Shaanxi from 1999 to 2017 was conducted, and its coordinated development level was modeled and analyzed. According to the authors, to achieve coordinated and sustainable development, the two main challenges that should be solved were the high level of coordinated energy development and the environment, economy, and environment.
Ren et~al. [4] selected the provincial panel data in China and used a fixed-effects model to explore the differential impact of different environmental regulations and industrial clustering on green total factor productivity (TFP). The results showed that China’s overall green development [4,5] level was on the rise, and its growth momentum mainly stemmed from the progress of green technology; manufacturing, service industry agglomeration, and informal environmental regulations all had significant promoting effects on green TFP, while formal environmental regulations inhibited green productivity growth, and the eastern and central–western regions showed different promoting or inhibiting impacts due to regional differences; from the perspective of transmission channels, the manufacturing industry, service industry agglomeration, and informal environmental regulations all had significant promoting effects on green TFP, while formal environmental regulations inhibited green productivity growth. The agglomeration effects were mainly concerned with improving green technological efficiency, while services agglomeration effects were concerned with promoting green technological progress; informal environmental regulations both increased green productivity through green technological advancement and technical efficiency, but formal environmental regulations inhibited the growth of green technological efficiency; green productivity was more strongly promoted by services agglomeration under informal ecological rules.
Sarkodie and Ozturk [6] analyzed four models with data from 1971 to 2013 using the autoregressive distributed lag technique, statistical heuristic correction with PLS regression, and the U-test method, all of which confirmed the inverted U-shaped curve and verified the EKC hypothesis for Kenya. The study showed that the increased energy consumption, GDP (Gross Domestic Product) per capita, and household consumption expenditure exacerbate carbon dioxide emissions and that electricity from renewable sources plays a crucial role in reducing carbon dioxide emissions. The study emphasized the increased use of sustainable technologies, such as carbon capture and storage, in oil and coal extraction, critical to reducing pollution. There is also a need to improve energy efficiency and to involve the public in energy conservation.
Much academic work has been done on the factors that influence carbon emissions. Wen, Li, Erum, Hussain, Xie and ud din Khan [4] used the EKC environmental Kuznets model to find that there is a long-running equilibrium connection between solar technology, economic growth level, and carbon emissions in China; in the long-term, there is a U-shaped connection between economic development and carbon emissions, and carbon emissions are first positively correlated with economic development, the linkage among economic development. Carbon emissions are “N”-shaped. If the negative correlation does not persist and the two subsequently return to a positive correlation, an “N”-shaped connection among economic development and carbon emissions. In addition to economic factors that can affect carbon emissions, solar technology development and innovation can also reduce carbon dioxide emissions.
Alam and Adil [5] examined the cointegration between the variables of carbon emissions, economic growth, economic development squared, primary energy supply, financial development, and trade openness based on the ARDL (autoregressive-distributed lag) boundary test method for the period 1971–2016 and did not find a significant relationship between carbon emissions and economic growth. Therefore, the EKC hypothesis is not valid in India. However, the study found a meaningful positive relationship between the energy supply and carbon emissions, with a proportional increase in the energy supply leading to a commensurate rise in carbon emissions. This research suggests that India must increase its power generation capacity from renewable and clean energy sources to counter the positive effect of energy on carbon emissions. Zhang, Song and Yang [2] suggested that the increase in urban population and the increasing scale of urban expansion led to the gradual deterioration of the living environment. Global warming is a visual manifestation of the destruction of the domain. Urban greening construction is one of the means to achieve ecological, environmental protection. We should proactively improve and create a better ecological environment through urban gardening to benefit residents’ health.
Abdouli et~al. [7] studied the nonlinear effects of economic development, FDI, and population density on environmental degradation in Brazil, Russia, India, and China (BRIC countries) between 1990 and 2014. In the complete application of static (OLS, FE, and RE) (Ordinary Least Squares, Fixed Effects, and Random Effects) estimators and dynamic system estimator (Diff-GMM and Sys-GMM (Generalized Method of Moments)) panel data methods, it was found in each case the EKC curve dominated the CO2−GDP relationship. The results showed that population density and foreign direct investment inflows are initially enhanced, and CO2 emissions decrease, as the population and foreign direct investment inflows reach the threshold levels, thus confirming the foreign direct investment halo hypothesis.
The increase in temperature is problematic in urban areas, especially when the urban areas are too congested and overcrowded. Luber and McGeehin [8] contended that an increase in temperature may exacerbate the health impacts of the higher temperatures that are already common in urban areas. Gill et~al. [9] proposed an adaptation strategy named “green” urban areas, essentially increasing the abundance and cover of vegetation. Xu et~al. [10] argued that urban greening should be a top priority in Xinjiang. A livable urban environment can generate more significant talent aggregation and promote more frequent economic exchange activities.
Firstly, ZOU et~al. [11] used an endogenous growth model to derive whether the economy and the environment can achieve harmonious development and the conditions for its realization. Then, using panel data from 30 regions (municipalities and autonomous regions) in China’s mainland, excluding Tibet, from 1995 to 2011, he tested whether the EKC hypothesis is valid by establishing a comprehensive indicator of pollution emissions and applying the feasible generalized least squares (FGLS) method. They found the EKC hypothesis is valid in China, but it has not yet crossed the turning point of the inverted U-shaped curve at this stage. Sustainable development between the economy, resources, and environment can be achieved when the elasticity of substitution of consumers across time. He also found that industrial and environmental sectors are more efficient in reducing pollution.
In summary, how to achieve a high degree of coordination between economic development and environmental quality has been one of the hot issues that international academics have been concerned about. Many scholars have studied the linkage between carbon emissions and economic development and have reached different conclusions. According to the existing literature, most scholars agree that economic growth has a significant effect on carbon emissions; however, when verifying the relationship between the two, they do not take into account the impact of people’s increasing awareness of environmental protection and the government’s vigorous implementation of environmental protection policies on carbon emissions, thus affecting the robustness of the conclusion. At the same time, most existing papers focus on entire countries or multiple countries within international organizations, ignoring regional differences to some extent. It has been shown that, in China alone, there are significant differences between provinces, cities, and autonomous regions, such as different regional economic development, distinct industrial structures, humanistic education, and environmental awareness, all of which impact carbon emissions [4]. This thesis narrows the study’s scope to Nanjing based on the Kuznets model to avoid these problems. It introduces the control variable of green coverage Ates and Derinkuyu [12] in built-up areas, integrating greening, economic growth, and carbon emissions.
3. Methodology
Establishment of the Empirical Model
For a long time, environmentalists and economists have argued about economic development’s impact on environmental change. Scientists generally accepted that the continued expansion of the population and overall economic growth would further accelerate the depletion of the Earth’s resources and exacerbate ecological degradation. This case controls the chaotic and massive population increases and changes in economic growth and consumption patterns. Governments, industrial enterprises, families, and individuals alike should do their utmost to conserve resources, protect the environment, and promote and stabilize the ecosystem’s virtuous cycle and sustainable functioning on which human life depends.
The U curve was developed by the economist Kuznets. It was initially used as a model to study the linkage among changes in revenue distribution and the process of economic growth but has since often been used by economists to investigate the link between the economy and the environment. The basic meaning of the environmental Kuznets curve can be understood as: in the early level of economic growth, environmental pollution is not high. However, the population grows fast, and technology is relatively backwards, leading to the waste of resources and environmental degradation. With the continuous development of the economy, the progress of science and technology, and people’s increasingly rational concepts, ecological awareness is growing. The emission of pollutants has been controlled to a certain extent. When economic growth reaches a certain level, is about to get an “inflection point”, the environmental quality will slowly improve, and environmental pollution will rise from high to low. This whole evolutionary process resembles an inverted U-shape, which is why the linkage between economic development and the environment is considered “inverted U-shaped”.
Most scholarly studies construct logarithmic models of the EKC, as in model (1):
In the algorithm, the dependent variable represents the total energy carbon emissions; GDP is the independent variable, meaning economic growth. In the model, each of the independent and dependent variables’ natural logarithm is taken to the bottom of e to eliminate heteroskedasticity and allow for better follow-up testing. Additionally, it denotes the intercept; , , and represent the estimated parameters of , , and , respectively; and is the random error. The different coefficients of , , and will result in other morphological characteristics of the EKC curve. They are mainly divided into the following, as shown in Table 1.

Table 1.
EKC curve and curve shape analysis.
This paper selects data from 1993 to 2018 to study and analyze the relationship between economic development, carbon emissions (see Figure 1), and Nanjing’s environment. The data used in this research comes from the countries listed in the OECD and the world bank database. GDP represents the economic development of Nanjing; total carbon dioxide emissions are calculated from each energy source’s (see Table 2) total consumption, according to the IPCC method. Considering the data availability, this paper chooses the green coverage indicator of the built-up area (see Figure 1) to measure the level of environmental protection. As the capital of Jiangsu Province, Nanjing’s GDP reached 1282.040 billion yuan in 2018. This was an increase of 9.4% from 2017, about 38 times the total GDP in 1993. As seen in Figure 1, Figure 2, Figure 3 and Figure 4, the GDP has increased significantly and maintained a relatively fast growth rate. As shown in Table 3, the CO2 emissions increased from 26.45 million tons in 1993 to 75.86 million tons in 2018. The economy is supported by energy, so the large consumption of power is the main reason for the sharp increase in CO2 emissions. From 1993 to 2007, there was a slow upward trend in carbon dioxide emissions; in 2008 and 2009, carbon dioxide emissions decreased rather than increased, and from 2009 to 2011, carbon emissions increased sharply. From 2012 onwards, the rate of growth of carbon emissions slowed down. From the perspective of environmental protection, the green area in Nanjing’s built-up regions has also increased year by year, from 5943 hectares in 1993 to 36,866 hectares in 2018. This shows that the government’s environmental awareness and environmental protection efforts are also increasing day by day.
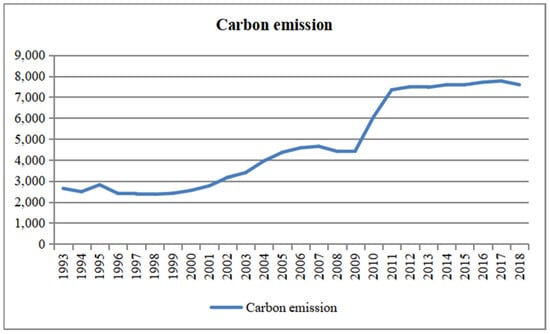
Figure 1.
Growth trends in the carbon emissions.
Table 2.
Energy classification and calculation.
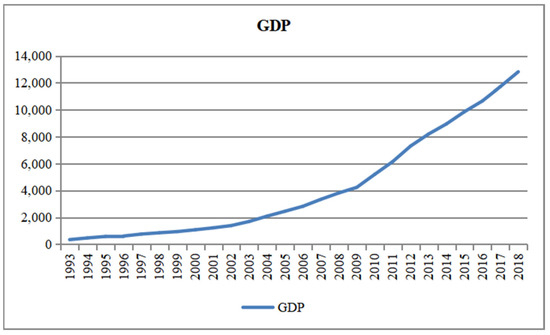
Figure 2.
Growth trends in the GDP.
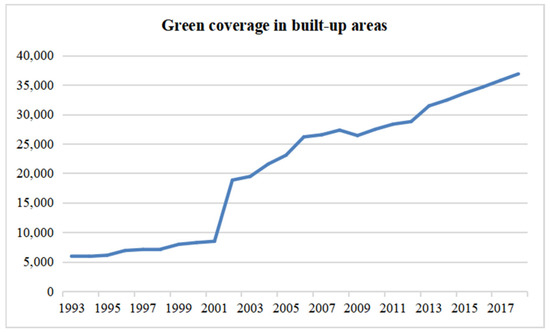
Figure 3.
Growth trends in the green coverage in built-up areas.
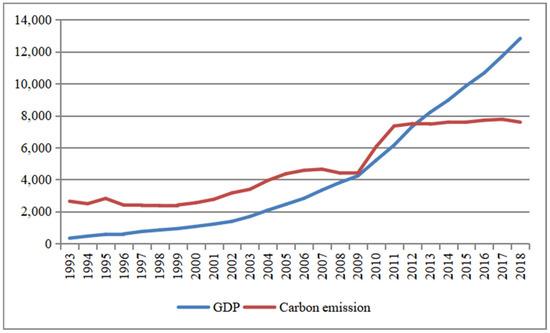
Figure 4.
Overall trends in the GDP and carbon emissions.
Table 3.
Calculation of carbon emissions based on the total energy consumption.
The variables are summarized as follows (see Table 4).
Table 4.
Variables.
4. Descriptive Analysis
The descriptive statistical results of the variables energy carbon emissions, Nanjing’s gross domestic product, and green coverage of built-up area variables and their respective post-logarithmic variables are shown in Table 5. Both the explanatory and the explained variables are more significant than the standard deviation, describing how the data are not highly discrete and can be further analyzed.
Table 5.
Descriptive statistics.
5. Inferential Analysis
Among many studies analyzing the linkage among technological progress, economic growth, and greenhouse gas emissions, an earlier quantitative research paradigm began in 1989 with the Kaya constant equation based on the Japanese scholar Kaya’s factorization method. In recent years, there has been a gradual preference for the vector autoregressive (VAR) model. In this paper, we first perform unit root tests on two variables, then perform a cointegration test, Granger causality test, environmental Kuznets curve existence test on four variables according to the vector autoregressive model, and establish that the VEC algorithm analyzes the internal logical linkage among the variables.
The EKC linkage was investigated to environmental indicators. The association states that, as an economy develops and grows, ecological degradation factors enhance to a certain point and decrease. This indicates that a growing economy might eventually reach a threshold in which stricter environmental and economic regulations, a higher percentage of imported manufactured products from developing countries, and increased investment in cleaner energy may combat pollution.
5.1. Unit Root Test
This paper used the ADF (augmented Dickey-Fuller test) to perform the variables’ unit root test to determine the corresponding lag’s smoothness. The test results in Table 6 show that the original sequences of the variables: LnCO2, LnGDP, and LnBGR have ADF statistics greater than the critical value at the 1%, 5%, and 10% significance levels, indicating that the original sequences of these four variables are nonstationary sequences. The initial hypothesis of a unit root’s existence is rejected at the 10% significance level for the first-order difference of the variables LnCO2. The original hypothesis of a unit root’s existence is denied at the 1% significance level for the variables LnGDP and LnBGR. That is, the first-order differences of all three variables pass the test, indicating that all three variables are a smooth first-order difference series, i.e., these variables are all first-order single integer series.
Table 6.
ADF test results.
5.2. Vector Autoregression (VAR) Model
These variables are same-order smooth sequences by the unit root test, satisfying the premise of constructing a vector autoregression model. Therefore, the specific vector autoregression model is built as follows:
To determine this VAR model’s optimal lag order, the paper is based on five metrics: (LR—Log-likelihood), (FPE—Final prediction error), (AIC—Akaike Information Criterion), (SC—Schwarz Criterion), and (HQ—Hannan Quinn). As shown in Table 7, the vector autoregression model’s optimal lag order is order 1, establishing the VAR (1) model. Based on this, the smoothness of the algorithm is further tested. As shown in Figure 5, most of the characteristic roots’ inverted values are inside the unit circle, indicating that the constructed vector autoregressive (1) model is smooth and ready for the next step of the cointegration test analysis.
Table 7.
Optimal lag order of the VAR model.
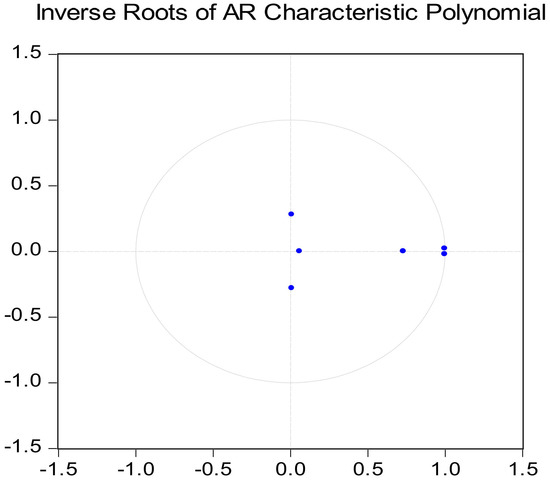
Figure 5.
Unit root distribution chart.
5.3. Cointegration Test
By the unit root test, these variables are the same-order smooth sequence; that is; they satisfy the necessary conditions for constructing a cointegrating equation. Therefore, we performed a cointegration analysis of the long-run relationship between the above three variables. According to regression coefficients, commonly used cointegration tests include the E-G two-step strategy, according to the regression residuals, and the Johansen cointegration test. The former is mainly used for cointegration tests for bivariate models, while the latter is mainly used for cointegration tests for multivariate models. Therefore, we selected Johansen’s cointegration test for the three variables in this paper. According to Johansen’s cointegration test results in Table 8, the trace statistic is greater than the threshold at the 5% level under the original hypothesis that there is no cointegration equation and, at most, two cointegration equations. That is, the initial hypothesis is rejected. Under the original hypothesis of the cointegrating equation, the trace statistic value is less than the threshold at the 5% level. That is, the initial assumption is accepted. Therefore, a cointegration relationship between , LnGDP, and LnBGR indicates a long-run equation linkage between these three variables.
Table 8.
Johansen cointegration test results.
5.4. Granger Causality Test (GC)
The cointegration test has verified a long-run Equation relationship between LnCO2, LnGDP, and LnBGR. Further research is needed to determine whether Nanjing’s energy and carbon emissions influence economic growth or a correlation, passing the GC test. Based on Table 9, the Granger causality that LnCO2 is not LnGDP is accepted, and the GC that LnGDP is not LnCO2 is rejected at the 5% level of significance. It shows a one-way causal linkage between energy carbon emissions and GDP. There is also a one-way causal linkage between the green area in built-up areas and GDP.
Table 9.
GC test results.
5.5. EKC Model
In the mid-1960s, Simon Kuznets proposed an inverted U-shaped linkage between the economy and income, confirmed by accurate statistics, and is often referred to as the EKC. The curve has been widely utilized in various fields, such as the linkage among economic development and food safety, economic development, and urban land use efficiency and agricultural growth and facultative fertilizer resources in China [13,14]. The object is the linkage between economic development and carbon emissions in Nanjing. To eliminate the effect of heteroskedasticity and improve the estimation’s accuracy, the regression equation was constructed in this research concerning the analysis of the EKC by [13,15]. The basic form of the model is as follows:
In Equation (3), , , and are algorithm parameters. is a random error term, where is the vertical coordinate. is the horizontal coordinate to plot the graph, as shown in Figure 6.
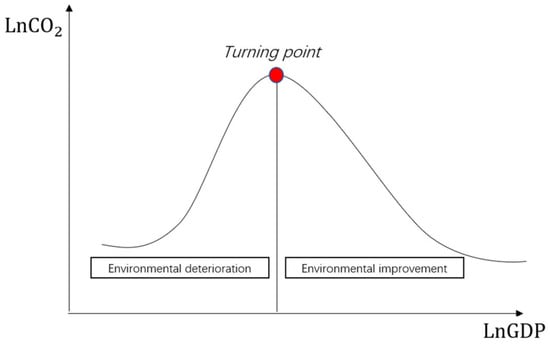
Figure 6.
EKC basic curve diagram.
We analyze the linkage between Nanjing’s GDP and carbon emissions based on the three Equations (3)–(5). A specific empirical analysis is seen in Table 10.
Table 10.
Results of the test of the EKC for carbon emissions.
Model 1 is characterized as a linear line, because it satisfies the following constraints: . At the 1% level, LnGDP has a significant positive effect on with the following regression eq:
According to Model 1, Equation (4) aims to study the linear relationship between two variables—that is, whether the logic relationship shows an “increase” or “decrease” between two variables, as shown in Figure 7.
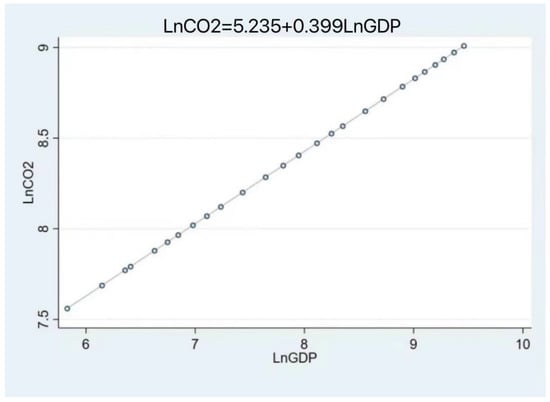
Figure 7.
Equation (4).
Model 2 is characterized as a U-shape, because it satisfies the following constraints:. At the 1% level, LnGDP and (LnGDP)2 had significant negative and positive effects on LnCO2, respectively. That is to say, there is a turning point in the EKC of carbon emissions in China, and it is a tiny value point, which indicates that there is a U-shaped linkage between carbon emissions and gross domestic products.
The corresponding regression equation is as follows:
The fitted curve for Equation (5) can be seen in Figure 8.
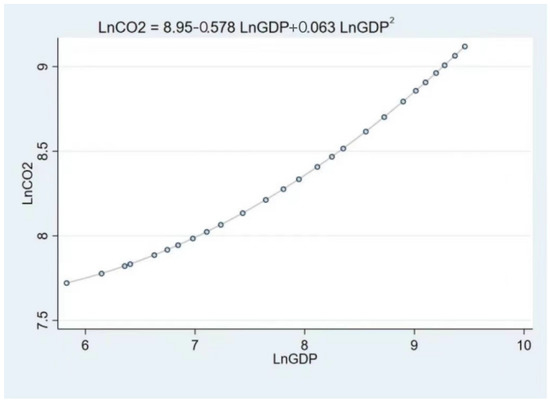
Figure 8.
Equation (5).
The turning point is counted as follows:
GDP = 98.2.
Equation (6) shows a negative connection between economic development and carbon emissions when Nanjing’s gross domestic product is below the level of 9.82 billion yuan. According to the descriptive statistical analysis in Table 5, the minimum value of Nanjing’s GDP is RMB 33.9453 billion, indicating that Nanjing’s economic development has been positively influencing carbon emissions during the period studied in this paper.
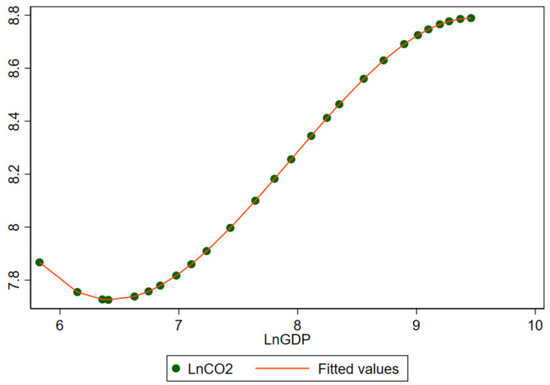
Figure 9.
Equation (7).
According to Model 3, Equation (7) is used to calculate the coefficients of the first term, the second term, and the third term—that is, Equation (7) only indicates a logical relationship among LnGDP, LnGDP2, LnGDP3, and LnCO2. In the dynamic model, an inverted U-shape relationship connects the GDP per capita and CO2 emissions per capita and supports the existence of an inverted U-shaped curve and confirms the EKC hypothesis. The findings for upper-middle-income countries also signify the existence of the EKC hypothesis as an inverted U-shape curve that connects the GDP per capita and CO2 emissions in both dynamic and static models. The results also indicate that EKC is not confirmed in lower-middle- and low-income countries. The findings from the static model specify a positive and monotonic relationship between the GDP per capita and carbon dioxide emissions, whereas the findings from the dynamic model indicates the existence of a U-shaped relationship between the two variables.
From Equation (9), there is one and only one turning point in the EKC of carbon emissions.
The calculations are as follows:
Substituting the value of Equation (10) into Equation (7), the inflection point is (7.947, 8.257). In the interval [4.587, 7.947), the value of Equation (9) is greater than 0. In the interval (7.947, +∞), Equation (8) corresponds to a value less than 0, indicating that Equation (9) shows first concave and then convex on the two-dimensional curve diagram. Additionally, on the interval [4.587, +∞), Equation (5) first-order derivatives are positive. Therefore, it is shown that the growth rate of on the interval [4.587, 7.947) is greater than the growth rate on the interval (7.947, +∞). As seen in Figure 10, the total carbon emissions caused by Nanjing’s economic development have shown a slowing trend in recent years, which positively implements the national policy of reducing emissions and has crucial environmental protection implications.
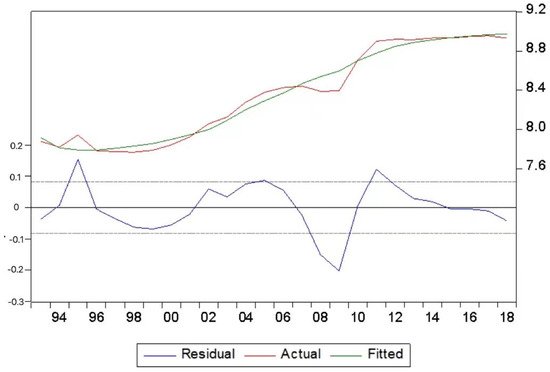
Figure 10.
Model 3.
6. Analyzing VEC Models
Based on the Johansen cointegration test, it is found that there is a common long-term stochastic trend among the three variables: LnCO2, LnGDP, and LnBGR, which provides feasibility for developing a VEC model. From cointegrating Equation (1) in the estimation results of the VEC model in Table 11 and Table 12, it can be seen that most of the coefficients of each variable are negative, showing that the algorithm has an error correction mechanism, further proving the long-run connection among the variables.
Table 11.
VEC model results.
Table 12.
Cointegration equations for the vector error correction models.
The covariance equation corresponding to the model corrected by the vector error (values in parentheses are the SD corresponding to the coefficients of the covariance equation) is expressed as follows:
The above cointegration equation indicates that there is a stable long-term equation linkage among the total amount of carbon emissions in Nanjing and the level of economic growth and the green coverage of the built-up areas during the period 1993–2018.
- Nanjing’s Gross National Product (LnGDP) significantly and positively affects the total energy carbon emissions (LnCO2). Compared to times when the level of economic growth is low, the impact of a higher level of economic growth on the total carbon emissions has slowed down, mostly since 2007 (since the logarithm of Nanjing’s GDP in 2007 was 8.1137, which exceeded the inflection point of 7.947 in the first year). The reason for this may be that the outline of the Eleventh 5-Year Plan adopted at the fourth session of the conference clearly stated the policy of “energy conservation and emission reduction”, which maximizes the use of resources and adopts technology to reduce carbon dioxide emissions while promoting economic development and green development.
- Green coverage in the built-up area (LnBGR) negatively affects the total carbon emissions (LnCO2) in Nanjing. However, the Granger causality test shows that LnBGR is a nonsignificant cause of Granger for LnCO2. This indicates that the green coverage of built-up areas can reduce CO2 to some extent, but the impact is not yet evident.
7. Modeling Forecasts
A difference test on the CO2 series shows that it is a first-order differential smooth series. Building a predictive model requires determining the lag order. According to the correlation plots in Figure 11 and Figure 12, it can be seen that the autocorrelation coefficient (see Table 13) gradually decays from period 5. The partial autocorrelation coefficient only exceeds the confidence interval in period 1. Therefore, q = 5, p = 1, and the ARIMA (1, 1, 5) model is constructed. The prediction results are shown in Table 14.
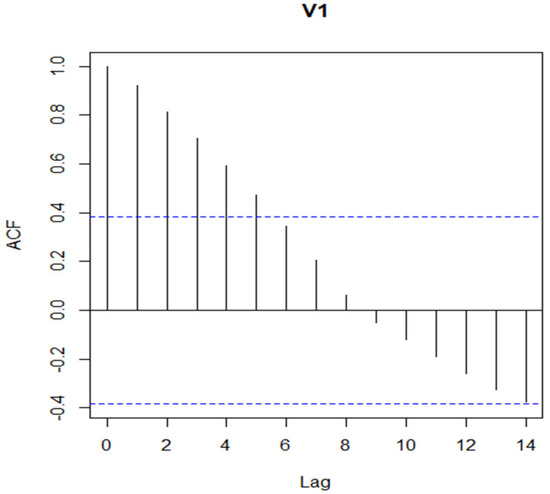
Figure 11.
ACF.
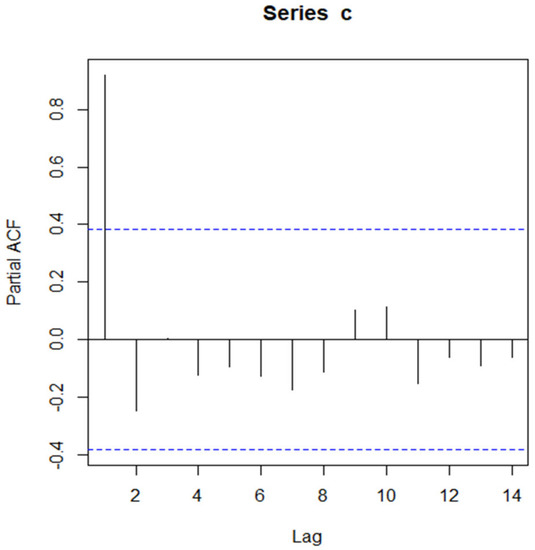
Figure 12.
PACF.
Table 13.
Coefficients.
Table 14.
Predictions.
8. Conclusions and Policy Implications
8.1. Conclusions
Although Nanjing has achieved remarkable achievements in energy saving and emission reduction, we can see from predicted data from Table 14 that the amount of carbon shows an upward trend in the coming few years, which is at the upper tail of the N-shaped curve, an essential stage in the transition to the inverted U-shape. The next step in energy conservation and emission reduction still needs to be intensified—many parties’ efforts to transition from weak decoupling of economic development and carbon emissions to complete decoupling.
Documented works using analytical and CGE (Computable General Equilibrium) algorithms represented by Li et~al. [16], Bovenberg and De Mooij [17], Parry [18], Böhringer et~al. [19] and others have cast doubt on the likelihood of a “double dividend” from environmental taxation. A review of this evolving literature is beyond the scope of this paper. A review of the “double dividend” literature is reported by [20].
It is, however, possible to explain why our results differ from and do not contradict those found in previous investigations. First, we will look at our principal impact resulting from the shift from consumption to investment resulting from the carbon price. Although gross domestic product enhances every year after the first year, it drops below the baseline in the first year of all of our carbon tax simulations. Second, the most important factor influencing our findings is our assumption that China’s labor supply is inelastic. With this specification, the real wage decrease brought about by product price enhancement has no distortionary impacts on hours worked. One of the fundamental assumptions that led to the rejection of the “double dividend” theory for developed country economies is the assumption of a positive labor supply elasticity.
Nonetheless, it appears out of place in the context of China’s transition economy. Third, labor taxes in China are nil, implying that the revenue-neutral reduction in tax rates provides little benefit to households. This has the effect of shifting the burden of the carbon tax onto households even more. Fourth, the most dynamic computable general equilibrium algorithm for developed economies has endogenously determined savings rates with perfect foresight.
The private savings rate in this study methodology, on the other hand, is exogenous (although not constant). The revenue-neutral reduction in the enterprise revenue tax influences enterprise savings, but the retained earnings have no price effect. Hence, the passive rise in investment. Finally, other distortions, such as the two-tier price structure and highly differential net production tax rates on intermediate and final commodities, open the door to a slew of welfare-boosting measures that may or may not be related to environmental goals. Following the taxation system adjustments that took place at the beginning of 1994, some of the sectoral disparities in commodity tax rates was reduced.
This study uses detailed energy consumption data at the sector level to look at China’s regional and sectoral carbon emission patterns and their driving forces. The findings revealed considerable disparities in sectoral emission intensity between provinces, reflecting a substantial technological divide between areas. Less improved regions with much higher energy-intensive technologies contribute to most of the national emission increments and cause the whole country’s economic structure to become carbon-intensive. The current study finds that disparity in technology levels between areas is a major impediment to China’s CO2 reduction efforts and that policymakers and academics should pay more attention to it.
From both a geographic and a sectoral standpoint, our findings show a large discrepancy in carbon emissions between Chinese provinces. The results are consistent with China’s economic development history and help to explain the country’s carbon emission tendencies. Regions with concentrated industrial and mining industries like Hebei, Shandong, Shanxi, and Inner Mongolia have greater total carbon emissions. These provinces are fast improving areas that demand immediate decoupling of economic growth from environmental implications. Several regions, such as Inner Mongolia, Ningxia, and Shanxi, have higher per capita carbon emissions and higher emission intensity, implicating lower energy efficiency and a great potential for carbon emission reduction.
Considering all the above materials in our research outcomes, significant policy implications can be identified and appropriate policy recommendations provided to DMs. First and foremost, the findings of this study confirm China’s uneven development and advise that present energy intensity reduction targets for various regions be amended. Many energy-intensive sectors have been transferred outside of Beijing’s control over the last decade. Liaoning Province, on the other hand, with its extensive industrial base, is unable to export its industrial base and shift its environmental load. This unequal playing field and perceived lack of fairness have caused provincial officials to take these emissions reduction goals less seriously. As a result, a careful empirical analysis taking into account changes in source endowment and regional growth is required to set the provincial emission objectives and examine the effect on the regional and industrial sectors.
8.2. Suggestions
The findings reveal that the impact of economic activity is the primary driver of overall carbon emissions. It is not easy to reduce the effect rapidly, because the entire economic scale is expanding, and China’s energy structure is still based on fossil fuels. However, efforts to optimize the energy structure and improve the energy efficiency must continue. Energy inefficient and old production facilities will be phased out and replaced with y-efficient plants to improve efficiency. An active education and outreach effort should be launched to raise the broad public knowledge of energy-saving and emission-reduction possibilities (including TV promotions, newsletters, and regional symposia and workshops). Such initiatives can provide forums for objectively reviewing and drawing conclusions from energy efficiency experiences from diverse parts of the world and various institutions. These exercises can also help stakeholders improve their mutual understanding, trust, and respect, laying the groundwork for future collaboration.
Second, during the studied years, changes in China’s industrial structure positively impacted the total carbon emissions. Due to the rising energy demands from industrial expansion and China’s fast urbanization, other construction, and power generation sectors have also experienced remarkable development. As a result, the government’s attention will shift to adjusting the country’s industrial structure. Since the service sector can significantly reduce reliance on resource/energy-intensive sectors, significant efforts should be undertaken to accelerate the transition to a more service-associated economy. A policy like this can help foster scientific and technical innovation and fuel the next phase of green growth. Supporting the circular economy is another way. Specifically, the establishment of a closed loop of material flows throughout the entire economic system. To improve performance, such a strategy should be implemented at three levels: (a) corporate eco-design and cleaner production; (b) industrial symbiosis and eco-industrial parks at the industrial section level; and (c) regional 3R (reduction, reuse, and recycling) networks.
Third, effective economic and regulatory strategies are required to achieve national energy-saving and emission-reduction goals. As a result, financial and market-related policy instruments will be used to help change industry and consumer habits. One such instrument is the use of tradable permits, granting a specific carbon emission allowance to an organization with the freedom to sell excess allowances to other organizations. It is a flexible regulatory policy instrument that can be used to compensate for higher costs of pollution prevention projects in a single region or industry sector, allowing energy-intensive companies to seek a variety of methods for reducing their carbon emissions, such as purchasing allowances (“cap-and-trade” is an example policy). Price reform is another economic policy tool. Natural resource prices (rents) are cheap and do not reflect their total social cost within China. Due to this undervaluation, businesses are more likely to use natural sources inefficiently, such as overuse or inappropriate use. Improving natural resource prices (particularly essential energy resources like coal and oil) by factoring in their availability, supply, and decisive treatment will give an economic incentive for reasonable industrial natural resource utilization.
Finally, a national coordinating structure will be built to prevent emissions between provinces (for example, Beijing’s emissions are being transferred to other regions). An unintended consequence of poor national emission coordination is the hunt for a “pollution haven”. Taking advantage of impoverished provinces’ economic prosperity, wealthy regions tend to relocate polluting or energy-intensive enterprises. As a result, a national coordinating mechanism will prevent the transfer of industrial pollutants from causing greater environmental harm to more impoverished and more susceptible regions.
8.2.1. Building a Green Development System and Optimizing Industrial Structure
Climate change is an indisputable fact. On the one hand, climate change and air pollution pose a considerable challenge to economic development and the population’s lives. But from the positive aspect, it is also a development opportunity that cannot be missed. “Green development aims to achieve efficiency and sustainability and achieve a harmonious coexistence of ecology and nature with the economy and society”. The Nanjing municipal government should build a green development system and support green enterprises as an essential measure for economic restructuring, break away from the original business and development model based on fossil energy, and promote and choose more clean energy. We will optimize the development model following the ecological environment’s capacity and the carrying capacity of resources and make environmental protection an essential pillar of sustainable development [14].
Nanjing is essential in industrialization and urbanization development, which undoubtedly requires many resources and energy. However, large energy consumption will aggravate the destruction of the ecosystem and the climate environment’s deterioration. To develop the economy and protect the ecological environment simultaneously, Nanjing should focus on new energy, materials, biomedicine, energy conservation, and environmental protection industries as a new round of industrial development to seize the high ground for future economic growth. Compared with traditional industries, China is not inferior to other countries in several new technology fields. As a critical development province, Jiangsu Province also has outstanding advantages in emerging science, technology, and other areas. Nanjing should take advantage of a broad market scale and more advanced and mature new technologies to accelerate the optimization of industrial structure and promote the use of clean energy as soon as possible to support and develop green enterprises, strategic-emerging enterprises, to build advanced new energy industry clusters, the formation of recent economic growth points. At the same time, it will reform or eliminate the backward production capacity; close down high-energy-using, high-polluting, and “scattered and dirty” industrial enterprises; and promote low-carbon development.
8.2.2. Building a High-Tech Collaborative Innovation Platform and Promoting Cooperation between Industry, Universities, and Research Institutes
Nanjing is an important science and education center in Jiangsu Province and even in the whole country, with more than 70 universities, making it a veritable capital of talent and a cultural hub of the world. The provincial and municipal governments should actively cooperate with several universities to explore green development paths. On the one hand, university scholars can analyze and organize policy formulation and plan implementation and provide objective and authoritative opinions; on the other hand, the government can also help universities research, transform research results into productivity, and raise funds for university research. Relying on the unique advantages of talent and education, we will build a high-level science and technology innovation platform with deep integration of government, industry, academia, research and application, and concerted efforts to solve the bottlenecks complex problems that restrict green development.
8.2.3. Increasing Capital Investment and Promoting Emission Reduction in Critical Areas
Taking a low-carbon green development path cannot be achieved without the support of technology and the market. First, it is necessary to increase the financial support for the green economy at all levels; accelerate the construction of resource recycling projects and large-scale environmental protection and governance projects; support the development of hydropower, nuclear energy, wind energy, solar energy, and other clean energy sources; vigorously promote energy-efficient and environmentally friendly products; and promote clean production and technological transformation. The government should actively construct green buildings and green transportation systems to form the most direct and effective demand pull for the green economy and create a broad market with good health prospects for the green economy. Secondly, we should emphasize independent technological innovation and strengthen scientific and technical support. Research funds support critical technologies in research fields such as energy efficiency, clean energy utilization, comprehensive pollution control, new energy, and new materials.
Additionally, specific traditional manufacturing and transport sectors, such as shipping, coal, steel, cement, and other industries, need to be centrally prioritized. The government should place overwhelming and absolute priority on restoring the ecological environment, focusing on transforming and upgrading these high-energy-intensive and high-emission industries, implementing safe and clean production, promoting energy recycling, promoting energy-saving and emission-reducing technologies, and deepening green development.
8.2.4. Improving Policy Support for Low-Carbon Development and Actively Conducting Low-Carbon Publicity
Halfway through 2020, Nanjing completed an excellent “ecological report card”. The average PM2.5 concentration is the best in the province, with the most significant decrease in the region. “Good weather is managed”. The municipal party committee and the municipal government should maintain a high degree of importance and strict control over ecological protection and carry this heavy responsibility of environmental protection with an iron will and action. The government should strengthen the source of pollution and monitor the air quality in real time. The government can establish and improve carbon emission responsibility mechanisms and focus on and precisely control energy-based enterprises. Disciplinary measures should be taken against enterprises with high carbon emissions and pollution, and incentives and support should be given to enterprises that actively transition to a green development path.
Additionally, the Nanjing government must vigorously implement systematic low-carbon environmental protection policies to promote the healthy and sustainable development of a low-carbon economy. Efforts will be made to improve the appraisal policy system for ecological civilization construction under government departments’ leadership and correct the shortcomings of the previous performance evaluation and assessment system. It should also actively construct a low-carbon GDP accounting system; build an incentive and evaluation mechanism to promote low-carbon economic growth; and realize the harmonious and unified development of performance appraisal and the critical value of the social, economic, and ecological environment low-carbon economic development. The government can also grasp the advantage of including carbon intensity targets in the evaluation system of ecological civilization construction and then raise the entry threshold and standards of low-carbon enterprises to promote the construction of low-carbon development goals to achieve the primary assessment system to ensure that the development of the low-carbon economy advances.
All units and individuals must protect the environment. The government, institutions, organizations, and communities should carry out more civilized practical activities and publicity campaigns with the theme of “green and low-carbon”. In this way, residents can be trained to conserve and recycle resources, and a healthy atmosphere of energy conservation can be created for all. Additionally, the government should popularize knowledge of the Work Safety Law, the Environmental Protection Law, and the Air Pollution Prevention and Control Law among residents, advocate “one day less driving and one day less air-conditioning”, call on the public to enjoy green and low-carbon travel, increase energy conservation and environmental protection awareness, and appreciate the importance of energy in a different way.
8.3. Prospects and Policy Implications
What should be clear is that, in practice, many factors will have an impact on carbon emissions. Still, the EKC algorithm can only provide theoretical guidance and direction on reducing carbon emissions, and its role in practice is relatively weak. Furthermore, economic development does not directly impact carbon emissions; instead, it is necessary to promote strategies to significantly reduce carbon emissions through sustainable economic growth [21].
Synergies should also be highlighted throughout the stages of achieving China’s energy conservation and emission reduction targets. First, it is essential to highlight the synergies between price, policy, and technology, mainly implementing an active policy environment to promote and apply low-carbon technologies. Innovation and the application of low-carbon technologies, on the other hand, can help control the actual price of industrial products, so Nanjing should take advantage of this and coordinate the three relationships mentioned above and their synergies. Secondly, it is necessary to bring out the synergy between the various stakeholders. As prices, policies, and technologies affect consumers and governments; it is essential to measure and satisfy each stakeholder’s demands and interests as much as possible and then develop an excellent low-carbon implementation plan so that the former electricity consumers can gradually become consumers of production. Finally, to promote reciprocal cooperation, Nanjing should change its collaboration to see win–win cooperation as a priority to encourage cooperation and introduce new low-carbon technologies, thus genuinely opening up a path to win–win cooperation.
The study presents following recommendations based on the analysis:
- (1)
- Jiangsu Province uses a traditional energy consumption approach that needs to be changed in order to optimize energy usage structure and promote the usage of green energy. The usage of coal should be gradually transformed, because its causes pollution. Likewise, the process to utilize renewable energy sources like hydropower, natural gas, and nuclear energy should be increased. Jiangsu Province needs to augment the proportion of clean energy in the production process and expand the peak shaving capacity of the pristine energy reserves in order to enhance its utilization range.
- (2)
- The promotion of green energy use in Jiangsu Province is essential for Jiangsu Province to reduce the pressure on the ecological environment and promote sustainable and healthy economic development. Therefore, it is suggested that Jiangsu Province focuses on the dual effects of green energy use in reducing carbon emissions, promoting economic growth, and actively promoting clean and green energy use. Jiangsu Province needs to actively introduce energy-saving and emission reduction green equipment, upsurge the proportion of investment in renewable and clean energy, and comprehend the usage of green energy from the production side. The government should introduce policies to ensure the usage of clean production techniques in construction for making the production process smooth, provide R&D tax credits, subsides, and other associated measures to promote rapid development. For green industries in the transportation sector, the government may introduce financial support like R&D tax incentives and subsidies. There is a need to start the construction and bidding of green and clean energy projects at the whole provincial level. By implementing various measures related to green energy, the process of green and clean energy in Jiangsu Province will continue to advance. After that, a beautiful and green Jiangsu will be realized as soon as possible, and the harmonious coexistence between man and nature will be truly realized.
Author Contributions
The conception, design, analysis, and material preparation of this study were performed by Y.S., N.E., M.L., M.Z. and H.S.; data collection was performed by N.E., A.H. and S.K., who edited the final draft of the manuscript. All authors have read and agreed to the published version of the manuscript.
Funding
This study was financed by the National Natural Science Foundation of China (72174076 and 71974081), Jiangsu Postgraduate Scientific Research Innovation Project (B1810012).
Institutional Review Board Statement
Not applicable.
Informed Consent Statement
Informed consent was obtained from all subjects involved in the study.
Data Availability Statement
The datasets generated for this study were obtained from the China Statistical Yearbook. The analyzed data are available and will be submitted upon request.
Acknowledgments
This study was supported by Key Research Base of Universities in Jiangsu Province for Philosophy and Social Science “Research Center for Green Development and Environmental Governance”.
Conflicts of Interest
The authors declare that the research was conducted in the absence of any commercial or financial relationships that could be construed as a potential conflict of interest.
References
- Zhang, M.; Anaba, O.A.; Ma, Z.; Li, M.; Asunka, B.A.; Hu, W. En route to attaining a clean sustainable ecosystem: A nexus between solar energy technology, economic expansion and carbon emissions in China. Environ. Sci. Pollut. Res. 2020, 27, 18602–18614. [Google Scholar] [CrossRef] [PubMed]
- Zhang, T.; Song, Y.; Yang, J. Relationships between urbanization and CO2 emissions in China: An empirical analysis of population migration. PLoS ONE 2021, 16, e0256335. [Google Scholar] [CrossRef] [PubMed]
- Liu, H.; Liu, Y.; Wang, H.; Yang, J.; Zhou, X. Research on the coordinated development of greenization and urbanization based on system dynamics and data envelopment analysis—A case study of Tianjin. J. Clean. Prod. 2019, 214, 195–208. [Google Scholar] [CrossRef]
- Wen, M.; Li, M.; Erum, N.; Hussain, A.; Xie, H.; Salah ud din Khan, H. Revisiting Environmental Kuznets Curve in Relation to Economic Development and Energy Carbon Emission Efficiency: Evidence from Suzhou, China. Energies 2021, 15, 62. [Google Scholar] [CrossRef]
- Alam, R.; Adil, M.H. Validating the environmental Kuznets curve in India: ARDL bounds testing framework. OPEC Energy Rev. 2019, 43, 277–300. [Google Scholar] [CrossRef]
- Sarkodie, S.A.; Ozturk, I. Investigating the environmental Kuznets curve hypothesis in Kenya: A multivariate analysis. Renew. Sustain. Energy Rev. 2020, 117, 109481. [Google Scholar] [CrossRef]
- Abdouli, M.; Kamoun, O.; Hamdi, B. The impact of economic growth, population density, and FDI inflows on CO2 emissions in BRICTS countries: Does the Kuznets curve exist? Empir. Econ. 2018, 54, 1717–1742. [Google Scholar] [CrossRef]
- Luber, G.; McGeehin, M. Climate change and extreme heat events. Am. J. Prev. Med. 2008, 35, 429–435. [Google Scholar] [CrossRef] [PubMed]
- Gill, S.E.; Handley, J.F.; Ennos, A.R.; Pauleit, S. Adapting cities for climate change: The role of the green infrastructure. Built Environ. 2007, 33, 115–133. [Google Scholar] [CrossRef] [Green Version]
- Xu, L.-j.; Fan, X.-c.; Wang, W.-q.; Xu, L.; Duan, Y.-l.; Shi, R.-J. Renewable and sustainable energy of Xinjiang and development strategy of node areas in the “Silk Road Economic Belt”. Renew. Sustain. Energy Rev. 2017, 79, 274–285. [Google Scholar] [CrossRef]
- Zou, Q.; Chen, X.; Jun-Na, L. Study on the coordinated development of economic growth and environment in China: Based on endogenous growth model and EKC hypothesis. J. Cent. Univ. Financ. Econ. 2014, 1, 564-255. [Google Scholar]
- Ates, S.A.; Derinkuyu, K. Green growth and OECD countries: Measurement of country performances through distance-based analysis (DBA). Environ. Dev. Sustain. 2021, 23, 15062–15073. [Google Scholar] [CrossRef]
- Zhang, J.; Qu, X.; Sangaiah, A.K. A study of green development mode and total factor productivity of the food industry based on the industrial internet of things. IEEE Commun. Mag. 2018, 56, 72–78. [Google Scholar] [CrossRef]
- Zeng, J. Fostering path of ecological sustainable entrepreneurship within big data network system. Int. Entrep. Manag. J. 2018, 14, 79–95. [Google Scholar] [CrossRef]
- Zhang, H.; Zhou, F.; Yang, H.; Guo, Q. Regulation performance of the win-win of environmental protection and economic development. Econ. Res. J. 2009, 3, 14–26. [Google Scholar]
- Li, M.; Sun, H.; Agyeman, F.O.; Heydari, M.; Jameel, A.; Salah ud din Khan, H. Analysis of Potential Factors Influencing China’s Regional Sustainable Economic Growth. Appl. Sci. 2021, 11, 10832. [Google Scholar] [CrossRef]
- Bovenberg, A.L.; De Mooij, R.A. Environmental levies and distortionary taxation. Am. Econ. Rev. 1994, 84, 1085–1089. [Google Scholar]
- Parry, I.W. Pollution taxes and revenue recycling. J. Environ. Econ. Manag. 1995, 29, S64–S77. [Google Scholar] [CrossRef]
- Böhringer, C.; Pahlke, A.; Rutherford, T. Environmental Tax Reforms and the Prospects for a Double Dividend; University of Colorado: Boulder, CO, USA, 1997; Unpublished Manuscript. [Google Scholar]
- Goulder, L.H. Environmental taxation and the double dividend: A reader’s guide. Int. Tax Public Financ. 1995, 2, 157–183. [Google Scholar] [CrossRef]
- Gu, W.; Wang, J.; Hua, X.; Liu, Z. Entrepreneurship and high-quality economic development: Based on the triple bottom line of sustainable development. Int. Entrep. Manag. J. 2021, 17, 1–27. [Google Scholar] [CrossRef]
Publisher’s Note: MDPI stays neutral with regard to jurisdictional claims in published maps and institutional affiliations. |
© 2022 by the authors. Licensee MDPI, Basel, Switzerland. This article is an open access article distributed under the terms and conditions of the Creative Commons Attribution (CC BY) license (https://creativecommons.org/licenses/by/4.0/).