Abstract
A method for assessing the operation of analog filters installed in the measuring paths of current and voltage converters in the power supply system of a mining machine motor, using the example of the driving unit of a roadheader’s cutterhead, is presented. The suggested method is based on the identification of the fundamental harmonic of signals from the current and voltage sensors observed at the input and output of the tested filters, respectively. The identified parameters of the fundamental harmonic of signals before and after the filter allow the determination of points of the filter frequency’s characteristics and their comparison with the reference values. In the suggested method of assessing the operation of analog filters, the new approach consists of checking the frequency characteristics on the basis of identification of the basic harmonics of the signal at the input and output of the tested filter (installed in the measuring line of the electrical quantity) using data acquired during the frequency start-up of the mining machine driving motor under normal operational conditions. Results are presented of the filter performance assessment, using the suggested method, after three years of its operation in the measuring system. For this purpose, empirical data recorded during the operation of a roadheader on a test stand are used. The results are compared with the theoretical frequency characteristics of the tested filters.
1. Introduction
Today’s mining machines designed for mining, loading or run-of-mine transportation can be powered by frequency converters, which in such a situation, become an important part of automatic control systems for the operating parameters of mining machines. Shearers designed for thin seams may be equipped with a chain pulling system, where the driving motors are installed in longwall panels. The feed speed of the mining machine is regulated by means of frequency converters, which enables automatic control, the purpose of which is to equalize the load of the driving motors of the chain pulling system. The advanced speed of the mining machine is adjusted by frequency converters, enabling automatic control to equalize the load of the driving motors of the chain pulling system [1]. The problem of uneven load to the drives also applies to belt and scraper conveyors. The adjustment of the frequency of power supply to the conveyor driving motors has an impact on their angular speed, and thus enables the correct distribution of power to the main and auxiliary drive, reducing the unevenness of the drive load [2].
The use of a converter driving system of the roadheader’s cutterhead allows the development of an automatic control system for the parameters of the mining process, aimed at the full automation of this machine [3,4,5,6,7,8,9,10,11]. By equipping the roadheader with a converter drive, it is possible to adjust (control) the angular speed of the cutterhead to the conditions of the mining process by changing the frequency of the supply voltage of the asynchronous motor installed in the roadheader’s cutting system. The development work on the automatic control of the angular speed of the roadheader’s cutterheads is described in [12,13,14,15]. The results of simulations and tests on a real object have shown that the automatic control of the angular speed of the cutterheads is beneficial and reduces the energy consumption of cutting and the dynamic loads of the roadheader [16,17,18]. As a consequence, this leads to a significant increase in the cutting efficiency and to a reduction in time of mining. The effectiveness of the cutting process is determined by four parameters: web depth, cutting height, the speed of dislocating the cutterheads during operation and the angular speed of the cutterheads. In the case of manual control, the angular speed of the cutterheads is constant, as it results from the angular speed of the electric driving motor and the gear ratio of the cutterheads’ drive. Thus, manual control does not enable optimization of the mining process parameters, often leading to low mining efficiency, especially with regards to hard rocks.
Due to the use of converter drives in mining machines, the currents and voltages at various supply points of such a drive have distorted waveforms. The significant range of frequency changes in fundamental harmonics and higher harmonics in the currents and voltages of the motor supplied from the converter cause difficulties in recreating the analog signals in digital form. As far as the correct control and evaluation of mining machinery operations are concerned, it is important to accurately recreate the analog signal, by the highest possible sampling frequency. Therefore, analog filters should be used in the measuring paths of mining machines’ electrical converter driving systems to prevent aliasing, i.e., signal distortion in the sampling process. In such a situation, it is advisable to periodically check the analog filters, as they may become detached or damaged after a longer period of use. This can be done using the suggested method.
2. Analog Filters in Measuring Paths for Electrical Quantities of Converter Drive with an Induction Motor
To record an electrical quantity with a distorted waveform, it is necessary to apply appropriate analog filters in the measuring path to prevent aliasing. Such systems are dealt with when an induction motor is power supplied by an intermediate frequency converter. Then the measurement path can be presented schematically as in Figure 1. The electric quantity qe (t) in the form of voltage or electric current is measured by a sensor, on the output of which a signal x(t) is obtained, proportional at each moment (every sampling interval Ts) to the instantaneous value of the measured quantity qe (t). This signal is processed by an analog low-pass filter, on the output of which the signal y(t) is obtained. Analog filters should be designed so as to have appropriately selected frequency characteristics [19,20].
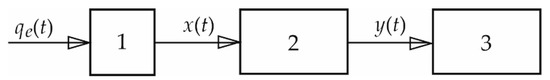
Figure 1.
Simplified block diagram of the electrical quantities measuring line. 1—electrical quantity sensor (current or voltage), 2—analog filter, 3—measuring-and-controlling device.
In a situation where several electrical quantities are measured simultaneously, to assess the voltage and current in time, or to calculate the power, analog filters with identical characteristics should be used in each current path of the tested system. The present mining machines powered by an electric motor, intended for mining and transportation of excavated material, can be powered by indirect frequency converters, which are an important part of the automatic control system of these units. The current and voltage at various supply points of such a converter drive have distorted waveforms. In such a situation, the designed and manufactured systems intended for the measurement of these electrical quantities should take into account the limitations resulting from analog-to-digital conversion of these signals. These limitations are mainly related to the digitization of the measured analog signals, and thus to the correct sampling of these waveforms. The digital form of the measured signal should contain the complete information necessary to recreate its analog form [19].
The drive of a roadheader cutterhead is an example of a system with a motor powered by a frequency converter. Development work on automation of the cutting process of such a machine, i.e., R-130 roadheader, was carried out on the test stand. The roadheader is equipped with a 132 kW motor to drive the cutting drum at a rated voltage of 500 V/50 Hz. The test stand uses a measuring system with sensors for measuring voltage and current installed in an intermediate frequency converter. The testing system of the cutterhead converter drive was designed so that it was possible to measure electrical parameters at the point of energy supply from the power grid, between the filter and the rectifier, in the intermediate circuit and at the output of the frequency converter (motor supply circuit).
An analog Bessel filter with a cut-off frequency of 450 Hz was used in the measuring paths of the stator currents and voltages of the motor, powered by a frequency converter, and the roadheader cutterhead’s drive. It is a well-performing low-pass filter in the time domain with a flat passband response in the frequency domain. The equation of the designed filter in the form of operator transfer function has the following form:
The designed analog filters were assembled, adjusted and tested on the test stand, as shown in Figure 2. The test stand consists of the following components:
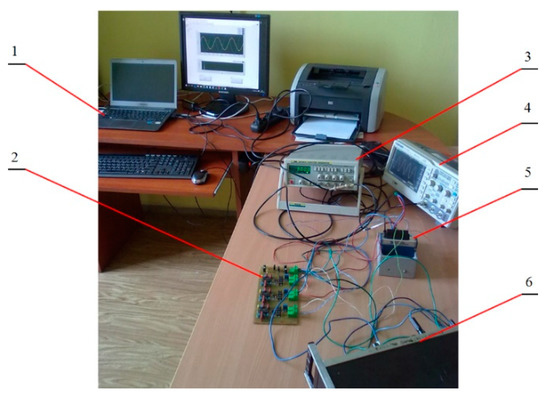
Figure 2.
The stand for testing the analog filters used in the lines for measuring the electrical quantities of a roadheader cutterhead’s drive.
The frequency characteristics of the filter described by operator transmittance (1) are shown in Figure 3.
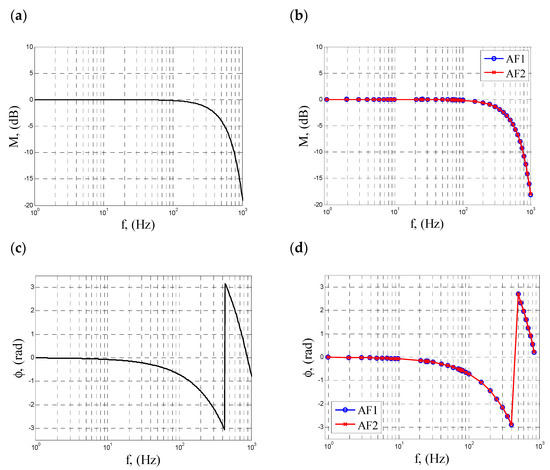
Figure 3.
Frequency characteristics of the amplitude (a,b) and phases (c,d) of analog filters used in voltage measuring paths (AF1) and in the stator current measuring paths (AF2) of the roadheader’s cutterhead driving motor; (a,c) theoretical characteristics, (b,d) empirical characteristics.
Empirical tests were aimed at determining the frequency characteristics of the amplitude and the phase of analog filters, as well as comparing these results with the theoretical characteristics resulting from Equation (1). The results of these tests are presented graphically in Figure 3.
When analyzing the graphs shown in Figure 3, significant mutual convergence can be observed of the characteristics obtained experimentally with the curves determined on the basis of Equation (1). These filters were installed in the measuring system of the electric quantities of the roadheader cutterhead’s drive. After three years of operation, their performance was assessed by the suggested method.
3. Method for Assessing the Operation of an Analog Filter Based on Analysis of the First Harmonic of a Distorted Periodic Signal
The suggested method, presented schematically in Figure 4, enables evaluation of the operation of analog filters installed in measuring lines for electrical quantities in a drive system with an induction motor, without the need to disassemble them. It is based on fundamental harmonic analysis of the signal at the filter input and output in the measuring circuit with a sensor measuring the distorted voltage or current waveform. If there is a constant component in the observed measurement signal before the filter x(t), or in the filtered signal y(t), of a system designed to measure an electrical quantity with an alternating waveform, then in order to assess its contribution and eliminate it, the suggested method can be used. It consists of identifying the fundamental harmonic and the constant component of the recorded measurement signal for any fragment (time interval). The process of identifying the fundamental harmonic of the distorted waveform is described in detail in Section 4.
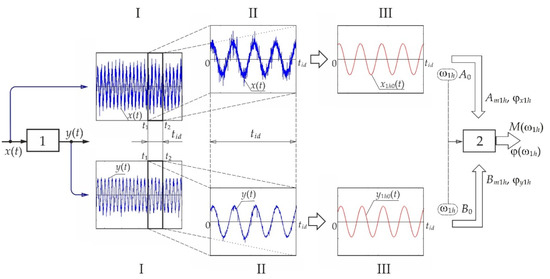
Figure 4.
Determination of the point of amplitude and phase characteristics of the analog filter based on the first harmonic of the input/output signals of the filter installed in the electrical quantities measuring path of the converter drive; 1—analog filter, 2—block for calculating the points of the filter’s frequency characteristics; Am1h—amplitude of the signal’s fundamental harmonic at the filter input; ω1h—pulsation of the signal’s fundamental harmonic, φx1h—initial phase of the signal; A0—constant component; y1h—initial phase of the signal; Bm1h—amplitude of the fundamental signal harmonic at the filter output; B0—constant component.
If the measuring signal (Figure 1) at the filter output x(t) has a periodic waveform with a constant component, then the share of first harmonic x1h(t) and the constant component A0 in this signal is expressed by the following equation:
where:
- Am1h—amplitude of the signal’s fundamental harmonic at the filter input
- ω1h—pulsation of the signal’s fundamental harmonic, ω1h = 2π∙f1h
- f1h—frequency of the signal’s fundamental harmonic
- φx1h—initial phase of the signal
- A0—constant component
A similar formula can be written for the signal y(t) at the filter output
where:
- Bm1h—amplitude of the fundamental signal harmonic at the filter output
- φy1h—initial phase of the signal
- B0—constant component
Assuming that the signal x(t) represents a re-scaled measurement signal from the current or voltage sensor at the input of the analog filter, then y(t) will be the re-scaled signal at the output of this filter (Figure 1), so x(t) and y(t) will be expressed in the units of measured quantity (A or V). Then, Equations (2) and (3) describe the waveform of the electrical quantity before and after the analog filter with the desired parameters ω1h, φx1h or φy1h, and A0, Am1h or B0, Bm1h. If the fundamental harmonic of the signal at the input and output of the filter is identified, the estimated amplitude, pulsation and the initial phase of the measured value, before and after passing through the analog filter, in the case of the transient processes’ disappearance, can be used to evaluate the filter operation. In such a situation, the points of the logarithmic amplitude characteristics for a given ω1h can be calculated using the following formula:
while the phase shift angle can be determined according to the following relationship:
Calculations of M(ω1h) and φ(ω1h) should be made for different values of the fundamental harmonic of the measured signal. Usually, the theoretical frequency characteristics of the designed filter or the characteristics determined empirically are known, but before their assembly in the measuring system. By comparing the results obtained on the basis of Formulas (4) and (5) for ω1h with the appropriate points M(ω) and φ(ω) of theoretically or empirically determined frequency characteristics (before the filter is put into operation), it is possible to evaluate the correctness of the analog filter operation after the given time of its operation.
The suggested method for assessing the operation of analog filters installed in measuring lines under operational conditions is based on an algorithm implemented in the following steps:
- (a)
- Simultaneously recording the signals at the tested filter input and output while taking measurements for different pulsations of the measured value, i.e., collection of the measurement data (I—Figure 4)
- (b)
- Separation of the waveform fragments from the measurement data, taken at the filter input and output, of any length but referring to the same time interval. e.g., tid = t2 − t1 (II—Figure 4)
- (c)
- Identification of the signal models of Equations (2) and (3), estimating ω1h and φx1h, φy1h, A0, Am1h, B0, Bm1h using the method described in Item 4 (III—Figure 4)
- (d)
- Removal of the constant component from the measurement data
- (e)
- Determination of Mf(ω1h) and φf(ω1h) based on the identified signal’s first harmonic at the tested filter input and output, for different pulsations (frequencies) (2—Figure 4)
- (f)
- Comparing the obtained results with the theoretical values M(ω) and φ(ω)
Use of the signal waveform after the disappearance of transient processes (only the forced component is present in the signal) is the condition for the correct operation of the algorithm.
4. Identification of the Measured Signal’s Fundamental Harmonic
The Formula (2) or (3) kTs can be written as:
where:
- cxk(yk)—vector of the model signal inputs; cxk = [1 sin(ω1h∙kTs − φx1h)]T or cyk = [1 sin(ω1h∙kTs − φy1h)]T
- α, β—vector of the model signal parameters; α = [A0 Am1h]T lub, β = [B0 Bm1h]T
- Ts—sampling period
- k—natural number
Thus, at the discrete observation of the waveform every sampling period Ts, the relationships (2) and (3) can be expressed by the following formulae:
where:
- n = 0, 1,…, k …, N,+
When ω1h and φx1h or φy1h are known, the amplitude of the fundamental harmonic and constant component can be determined by the least-squares method according to the following equations:
where:
- xT = [x0, x1, …, xN]
- yT = [y0, y1, …, yN]
- x1 = x(Ts), x2 = x(2Ts), …, xk = x(kTs), …, xN = x(NTs)
- y1 = y(Ts), y2 = y(2Ts), …, yk = y(kTs), …, yN = y(NTs)
When ω1h and φx1h or φx1h are unknown, vectors cxn, cyn, and thus matrixes Cx and Cy, and in a consequence, the estimated parameters (10) and (11) depend on ω1h and φx1h or φy1h, which can be written as:
The quantities ω1h and φx1h or φy1h, similar to A0, Am1h or B0, Bm1h, become the sought parameters of the Equations (2) and (3). These parameters can be determined in an iterative way. In this case, values from the adopted interval [ω1h(min) ω1h(max)] and [φx1h(min) φx1h(max)] or [φy1h(min) φy1h(max)] are successively substituted with the vector formulas cxk or cyk, and using the Equations (10) and (11), parameters α and β are calculated. The mean square error, expressed by the following formula:
or
can be a measure of the recreation of the first harmonic of the measuring signal, measured at the input and output of the filter.
Then, identification of the periodic signal’s fundamental harmonic consists of the minimization of index (14) or (15) in relation to the following parameters: ω1h, φx1h or φy1h and lub , for the signals measured at the filter input and output, where the parameters or are least-squares estimators (10 and 11).
5. Stand Tests
The driving motor of a roadheader’s cutterhead is usually started with no load. In industrial conditions, when the motor is powered by a frequency converter, the process can be used to record the signals necessary for the assessment of analog filters operating in the measuring paths of electrical quantities. This requires the conversion of the linear increase of the motor rotational speed during the start-up, with a smooth increase of the supply voltage frequency from the minimum one to near to the rated one, into a trapezoidal waveform, as shown in Figure 5. The trapezoidal increase in motor rotational speed during its start-up in idle mode enables the steady states for selected frequencies of the supply voltage to be obtained. The signals measured in the current and voltage measuring paths at the input and output of the appropriate filters can be used to determine the selected points of their frequency characteristics (using the method described in Item 3). This is to assess the performance of the tested analog filters after a specified period of operation without removing them from the measuring system.
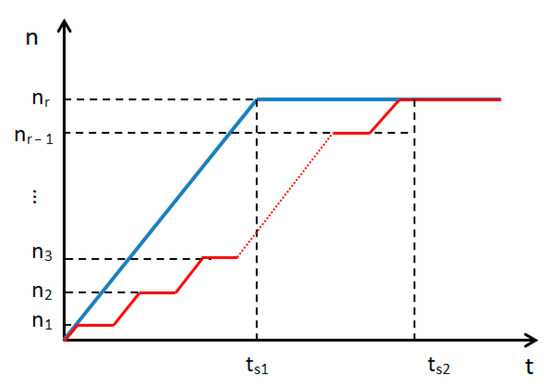
Figure 5.
An idealized start-up process of the motor driving the roadheader’s cutterhead used in the process of evaluating the analog filters operating in the measuring paths of electrical quantities.
The suggested method was used to evaluate the operation of analog filters in two measuring paths: the voltage at the output of the frequency converter and the stator current of the motor driving the roadheader’s cutterhead. A schematic diagram of the system for recording the required signals during the measurements is presented in Figure 6.
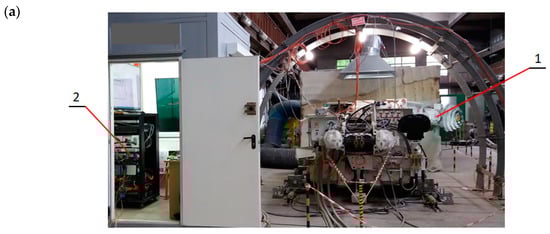
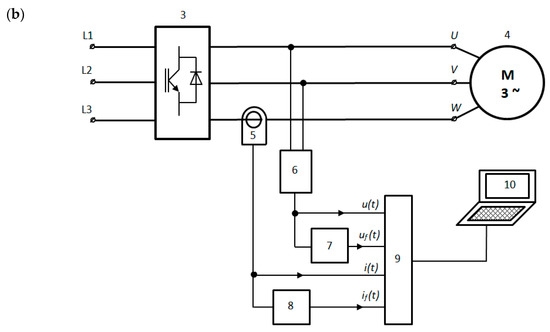
Figure 6.
Stand for testing the converter drive system of the roadheader’s cutterhead; (a) view of the stand, (b) block diagram of the measuring system used during the measurements aimed at evaluating the analog filters’ performance; 1—roadheader, 2—stand for control and measurements of electrical and mechanical parameters of a roadheader with an analog filter system.
Taking into account the re-scaling of the input and output signals of the filter in the current measuring path, the signal x(t) corresponds to i(t), and the signal y(t) represents if(t). However, in the voltage measuring path, the signal at the filter input x(t) corresponds to u(t), and y(t) represents uf(t) (Figure 6).
For the purpose of checking the suggested method, two filters installed in the following measuring paths were selected:
- voltage—measurement of phase-to-phase voltage at the output of the frequency converter
- current—measurement of the stator current of the motor driving the roadheader’s cutterhead
The measuring stand shown in Figure 6 was used to evaluate the operation of selected analog filters; it consists of the following components:
- electric motor for driving the cutterheads (4—Figure 6)
- frequency converter (3—Figure 6)
- LEM type LF 505-S sensor for current measurement (5—Figure 6)
- LEM type LV 25-P/SP5 sensor for voltage measurement (6—Figure 6)
- analog filters (7, 8—Figure 6)
- control and measuring system based on the NI USB-6259 device with 32 analog inputs with a maximum sampling frequency of 1.25 MS/s (9—Figure 6)
- PC with LabView and Matlab software (10—Figure 6)
The control and measuring system was connected in a way that allowed the simultaneous recording of the selected electrical quantities both before and after the analog filters. Thanks to this, it was possible to record the original signal after it passed through the analog filter. During the tests, the current and voltage supplying the motor were recorded at six frequency parameters, from low, approx. 4 Hz, to nominal, approx. 47 Hz. The required the electrical quantities of the converter driving system of the roadheader’s cutterhead during start-up in the cutterhead’s motor idle mode, with a sampling frequency of 100 kHz, to be recorded. An application developed in the LabView environment was used to record the measurement data, and the author’s own program operating in the Matlab environment was used to determine the points of frequency characteristics of the tested filters.
6. Tests Results
The results of the identification tests are given in Table 1 and Table 2, and the sample waveforms of the voltage and current measurement signals at the input and output of the filter with the determined fundamental harmonic are shown in Figure 7 and Figure 8.

Table 1.
Estimated parameters of the fundamental harmonic of the measurement signal of the voltage supplying the motor at the input and output of the analog filter and the values determined in accordance with the Formulas (4) and (5).
Table 2.
Estimated parameters of the fundamental harmonic of the measurement signal of the motor’s stator current at the input and output of the analog filter and the values determined in accordance with the Formulas (4) and (5).
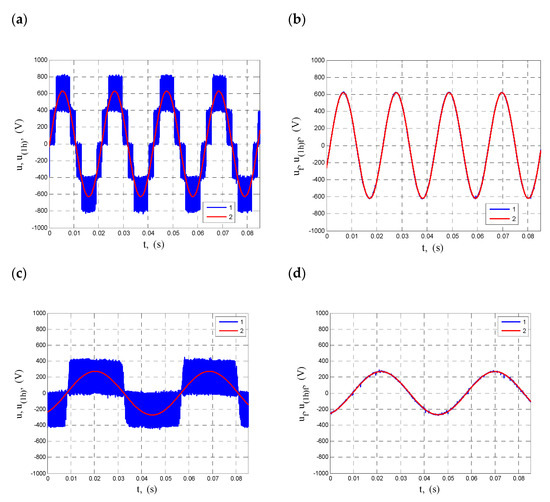
Figure 7.
Estimated waveforms of the fundamental harmonic of the voltage supplying the motor against the background of the measuring signal at the input (a,c) and the output of the analog filter (b,d) with the frequencies (a,b) 47.59 Hz and (c,d) 20.64 Hz; 1—measurement data, 2—identified voltage fundamental harmonic.
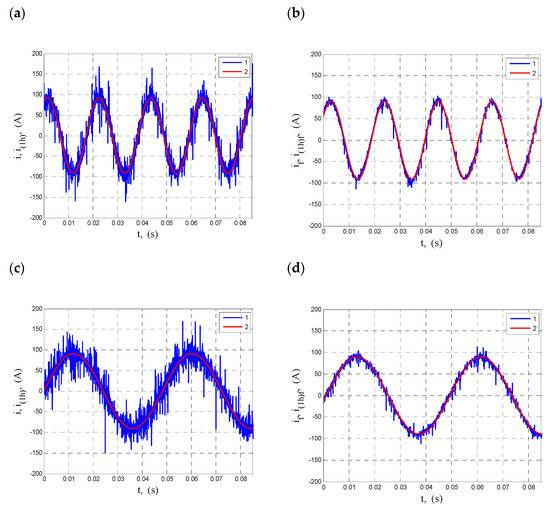
Figure 8.
Estimated waveforms of the fundamental harmonic of the motor’s stator current against the background of the measuring signal at the input (a,c) and the output of the analog filter (b,d) with the frequencies (a,b) 47.61 Hz and (c,d) 20.67 Hz; 1—measurement data, 2—identified current fundamental harmonic.
As it can be seen in Figure 7, the waveforms of the fundamental voltage harmonics show a good fit with the empirical data, and the filter perfectly suppresses higher harmonics.
The waveforms of the basic current harmonics presented in Figure 8 fit the empirical data, and the filter in the measuring line of the current consumed by the motor shows a significant attenuation of the fast-changing component.
For the purpose of comparative analysis of the results, the calculated M(ω) and φ(i), given in Table 1 and Table 2, were superimposed on the theoretical frequency characteristics of the filter, which were determined on the basis of spectral transmittance with the equation resulting from Formula (1) (Figure 9 and Figure 10).
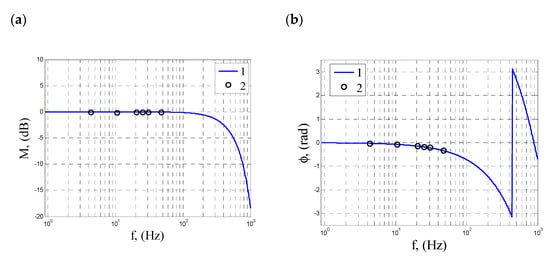
Figure 9.
Points of the frequency characteristics of the (a) amplitude and (b) phase of the tested analog filter used in the measuring line of the voltage supplying the motor, determined by the suggested method, against the theoretical Bodé characteristics of this filter; 1—theoretical frequency characteristics of the filter, 2—results of the suggested method.
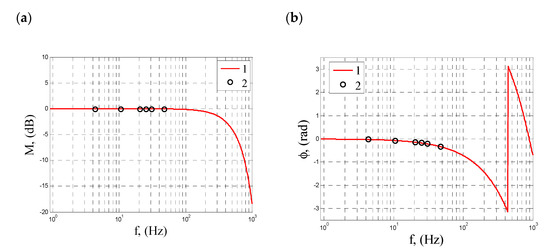
Figure 10.
Points of the frequency characteristics of the (a) amplitude and (b) phase of the tested analog filter used in the measuring line of the current supplying the stator, determined by the suggested method, against the theoretical Bodé characteristics of this filter; 1—theoretical frequency characteristics of the filter, 2—results of the suggested method.
For the purpose of comparative analysis of the results, the calculated M(ω) and φ(i), given in Table 1 and Table 2, were superimposed on the theoretical frequency characteristics of the filter, which were determined on the basis of spectral transmittance with the equation resulting from Formula (1) (Figure 9 and Figure 10).
The calculated values of M (ω1h) show compliance with the filter passband in both considered cases. The phase shift between the input and output signals of the analog filter of Equation (1) increases significantly with the increase of frequency, so it is a more convenient parameter for observation and evaluation of the filter operation, even at frequencies still present in the passband. For this reason, Table 3 presents the phase shift angles for a given frequency, resulting from filter Equation (1) and the test results. As well as this, the deviations in phase shifts are given, as determined by the suggested method from theoretical values.
Table 3.
Deviation in phase shift angle φu(i) between the input and output signals of the tested analog filter, determined by the suggested method, and the theoretical values φt.
7. Discussion
On the basis of the results given in Table 1 and Table 2, it can be observed that the estimated fundamental harmonic frequencies of the signal at the input and output of the analog filter do not differ by more than 0.06 Hz. The amplitude of the fundamental harmonic of the voltage at the input and output of the filter, calculated in accordance with (10) and (11), increases with the increase of frequency, and in case the current is constant, which results from the operation of the frequency converter. The constant voltage and current components do not exceed 2 V and 1.8 A, respectively, so they do not exceed 2% of the fundamental harmonic amplitude of the measured signal. This shows that they are low. As can be seen in Figure 7 and Figure 8, the basic voltage and current harmonics determined on the basis of the suggested method show a good fit with the empirical data, regardless of the frequency parameters.
By analyzing the results given in Table 1, Table 2 and Table 3 and as shown in Figure 9 and Figure 10, both in relation to the results obtained for the current measuring system and the voltage supplying the driving motor, it is possible to find a significant convergence of the module and phase shift parameters determined using the suggested methods, with parameters resulting from the theoretical frequency characteristics of the analog filter. This conclusion particularly applies to the phase characteristics. The deviation of the determined module parameter from the reference parameter does not exceed 0.2 dB, and for the phase shift, does not exceed 0.01 rad. This indicates the usefulness and effectiveness of the suggested method to evaluate the operation of the analog filter used in the system, measuring the electrical quantities of the motor powered by an intermediate frequency converter.
8. Conclusions
In the measuring system of electrical quantities of the mining machine drive, the signals at the input and output of the low-pass analog filter, described by Equations (2) and (3), represent the fundamental harmonics of the voltage or current of an induction motor supplied from a frequency converter. The signals described by Equations (2) and (3) can be identified in an iterative way (frequency, initial phase) with the estimation (by the least-squares method) of the fundamental harmonic amplitude and the possible constant component present in the measurement signal. By identifying the fundamental harmonics of the measured quantity at the input and output of the analog filter, described by Equations (2) and (3), while minimizing the value of the criterion in the form of mean square error for different frequency values, it is possible to evaluate the operation of this filter after a certain time of its operation in industrial conditions without the need for disassembly. Due to the fact that the frequencies of the fundamental harmonics of the supply voltage, and thus the motor current, are contained in the filter passband, the amplitude characteristics of the tested filter can only be assessed by a statement on whether the designated points are not exposed to excessive attenuation. When assessing the filter’s operation, it is advantageous to analyze the determined points of the phase characteristics, because the phase delay significantly (non-linearly) increases even at frequencies lower than the rated frequency of the motor. The suggested method was used to evaluate the operation of analog filters used to process the measurements data of electrical quantities of the converter driving system of the roadheader’s cutterheads, after three years of their operation. In the case of the cutterhead drive, the motor start-up was used to collect measurement data for various frequencies of the voltage supplying the motor. As far as the assessment of the amplitude characteristics of the filter is concerned, it was found that all the determined points lie in the passband and do not differ significantly from the theoretical amplitude characteristics. The location of the empirically determined points of the phase characteristics on the curve representing the theoretical characteristics indicates the correct operation of the filter. It should be noted that the obtained results showed the correct operation of both tested analog filters, at the same time Iproving the effectiveness of the suggested method. The partially iterative nature of the method, causing that accuracy and the time of calculations to depend on the adopted range and the value of the pulsation change step, as well as on the initial phase of the identified signal, is its disadvantage. Difficulties are also caused by the need to ensure that the motor speed is stabilized at a given frequency. Nevertheless, the obtained results indicate that the suggested method can be successfully used to evaluate the operation of analog filters installed in the current or voltage measuring lines of a driving system with an induction motor powered by a frequency converter, under their operational conditions.
Author Contributions
Conceptualization, J.J.; formal analysis, A.P.; methodology, J.J.; software, J.J.; writing—original draft preparation, J.J., A.P., D.P. and K.N.; supervision—J.J.; investigation—J.J.; validation—J.J. and A.P.; visualization—A.P., J.J., D.P. and K.N.; funding acquisition—D.P. All authors have read and agreed to the published version of the manuscript.
Funding
The work was conducted under the research project titled, “Control of roadheader cutting heads movement for the reduction of energy consumption of mining and dynamic loads”, co-financed by the Polish National Centre for Research and Development under the Applied Research Projects (agreement no. PBS3/B2/15/2015).
Institutional Review Board Statement
Not applicable.
Informed Consent Statement
Not applicable.
Data Availability Statement
Not applicable.
Conflicts of Interest
The authors declare no conflict of interest.
References
- Remiorz, E. Dynamics of Chain Haulage Systems of Longwall Cutting Machines; Silesian University of Technology: Gliwice, Poland, 2021. (In Polish) [Google Scholar]
- Dolipski, M.; Remiorz, E.; Sobota, P. Dynamics of non-uniformity loads of AFC drives. Arch. Min. Sci. 2014, 59, 155–168. [Google Scholar] [CrossRef]
- Cheluszka, P. Optimization of the cutting process parameters to ensure high efficiency of drilling tunnels and use the tech-nical potential of the boom-type roadheader. Energies 2020, 13, 6597. [Google Scholar] [CrossRef]
- Cheluszka, P.; Dolipski, M.; Sobota, P. Significance of cutting process parameters as related to improving dynamic state of roadheader and minimizing power consumption. Min. Inform. Autom. Electr. Eng. 2017, 2, 59–68. [Google Scholar] [CrossRef][Green Version]
- Cheluszka, P.; Sobota, P. Automatic control of working process parameters as a condition for robotisation of mining ma-chines. In Proceedings of the 23rd International Conference on Methods and Models in Automation and Robotics MMAR 2018, Międzyzdroje, Poland, 27–30 August 2018; pp. 211–216. [Google Scholar]
- Jenkinson, N.D. Monitoring Systems for Roadheaders. Technical Coal Research; Final Report; Office for Official Publications of the European Communities: Luxembourg, 1997. [Google Scholar]
- Wang, S.Y.; Du, Y.B.; Wu, M. Remote Control Techniques and Monitoring System for Roadheader. Adv. Mater. Res. 2013, 791-793, 878–883. [Google Scholar] [CrossRef]
- Dudek, M.; Pieczora, E.; Prostański, D.; Winkler, T. Bolting mechanization in Polish coal mines. Coal Int. 2001, 249, 176–178. [Google Scholar]
- Daobin, W.; Yi, C.; Rui, L.; Liang, L. Research on automatic boom–type roadheader profiling. In Proceedings of the 7th World Congress on Intelligent Control and Automation, Chongqing, China, 25–27 June 2008. [Google Scholar]
- Tong, M.; Kang, D.; Liu, P. Research on Automatic Section Cutting Control of Roadheader. In Proceedings of the 2010 International Conference on Measuring Technology and Mechatronics Automation, Changsha, China, 13–14 March 2010; Volume 3, pp. 22–25. [Google Scholar]
- Wang, S.; Ma, D.; Ren, Z.; Qu, Y.; Wu, M. Study on Method of Cutting Trajectory Planning Based on Improved Particle Swarm Optimization for Roadheader. In Advances in Swarm Intelligence; ICSI Lecture Notes in Computer, Science; Tan, Y., Shi, Y., Niu, B., Eds.; Springer: Cham, Switzerland, 2019; Volume 11655. [Google Scholar]
- Heyduk, A.; Joostberens, J. Automatic control of roadheader cutting head speed and load torque. In Proceedings of the 6th World Multidisciplinary Earth Sciences Symposium (WMESS 2020), Prague, Czech Republic, 7–11 September 2020. [Google Scholar]
- Joostberens, J.; Heyduk, A. Laboratory Tests of a Speed Control System for Roadheader Cutting Heads. Multidiscip. Asp. Prod. Eng. 2018, 1, 153–159. [Google Scholar] [CrossRef]
- Heyduk, A.; Joostberens, J. Computer simulation of the roadheader cutting head speed control system. In Proceedings of the 18th International Multidisciplinary Scientific GeoConference, SGEM 2018, Albena, Bulgaria, 2–8 July 2018. [Google Scholar]
- Heyduk, A.; Joostberens, J. Hardware-in-the-Loop simulation applied to roadheader cutting head speed control system testing. Min. Inf. Autom. Electr. Eng. 2017, 55, 35–48. [Google Scholar]
- Cheluszka, P.; Sobota, P.; Głuszek, G. Studies of behaviour of the automatic control system of roadheader cutting heads movement. MATEC Web Conf. 2019, 252, 09002. [Google Scholar] [CrossRef]
- Cheluszka, P.; Remiorz, E. Energy–saving and environmental–friendly technology for construction of underground architec-tonic objects with the use of roadheaders. In Proceedings of the 17th International Multidisciplinary Scientific GeoConference, SGEM 2017, Vienna, Austria, 27–29 November 2017; pp. 535–546. [Google Scholar]
- Cheluszka, P.; Remiorz, E.; Gawlik, J. Simulation investigations of road-header dynamics for automatic control of cutting process. In Proceedings of the 17th International Multidisciplinary Scientific GeoConference, SGEM 2017, Alben, Bulgaria, 29 June–5 July 2017; pp. 805–816. [Google Scholar]
- Smith, W.S. Digital Signal Processing: A Practical Guide for Engineers and Scientists; Elsevier Inc.: Amsterdam, The Netherlands, 2002. [Google Scholar]
- Castello, J.; Espi, J.M.; García-Gil, R. A New Generalized Robust Predictive Current Control for Grid-Connected Inverters Compensates Anti-Aliasing Filters Delay. IEEE Trans. Ind. Electron. 2015, 63, 4485–4494. [Google Scholar] [CrossRef]
Publisher’s Note: MDPI stays neutral with regard to jurisdictional claims in published maps and institutional affiliations. |
© 2021 by the authors. Licensee MDPI, Basel, Switzerland. This article is an open access article distributed under the terms and conditions of the Creative Commons Attribution (CC BY) license (https://creativecommons.org/licenses/by/4.0/).