Abstract
Vehicle exhaust emission tests use exhaust sampling systems that dilute the exhaust gas with ambient air. The dilution factor DF is calculated assuming that the combustion is complete, and that the engine is operated at a stoichiometric air-fuel ratio (AFR). These assumptions are not always met. This is especially true for diesel engines. This article discusses the tests to find out what the average lambda (λ) over the ARTEMIS, WLTC and NEDC driving cycles is and how this affects the result of the emission measurements. Measurements were carried out on a chassis dynamometer equipped with a standard emission measurement system used during the homologation. The λ was calculated using the Brettschneider equation. The dilution ratio DR was also determined by measuring the CO2 concentration in the raw exhaust gas. The CO2-tracer method used for this was modified. The median of the λ for a CI vehicle was 1.23–3.31, which makes the relative percentage difference between the DF and DR (ΔDF) in the range of 28–167%. For a SI vehicle homologated under the WLTP procedure, the median of the λ for the WLTC and ARTEMIS cycles was close to one and ΔDF for most cycles does not exceed 10%. In order to reduce the influence of the error of DF determination on the result of the emission measurement, it is recommended to use exhaust gas sampling systems that allow to determine the actual dilution ratio or to use the lowest possible dilution. The PAS-CVS system seems to be the most promising.
1. Introduction
In order to calculate the mass of the pollutants emitted from a vehicle exhaust system, it is necessary to know three parameters: the concentration of the pollutant in the exhaust gas, the density of that concentration and the volume of exhaust gases in which the concentration is determined (1).
Direct measurement of the volume of exhaust gases is not applied in vehicle tests on the chassis dynamometer. Instead, a constant volume sampling system is used. Because an exhaust gas flow changes during the repetition of the driving cycle, it is necessary to bring an additional gas stream into the sampling system, which in this case is ambient air. It dilutes the raw exhaust gases with ambient air. The concentration is measured in diluted exhaust gases, while the volume is calculated as the product of the known constant flow rate of the diluted exhaust gases in sampling system and the duration of the measurement.
In order to calculate the mass of the pollutant emitted from the exhaust system, it is necessary to know the extent to which the raw gases have been diluted. This dilution ratio DR is defined as the ratio of the volume of the diluted exhaust gas to the raw exhaust gas (2):
For its calculation, a dilution factor (DF) determined by Equation (3) is used instead of dilution ratio (DR). It first appeared in the Code of Federal Regulations (CFR) [1]. The formula for this indicator has been derived on the assumptions that the combustion is complete and that the air-fuel mixture in the engine has stoichiometric a composition:
The factor a in Equation (2) represents the concentration of carbon dioxide in undiluted (wet) exhaust gases determined under the abovementioned assumptions. The general formula for calculating the value of the factor a for fuel composed of CXHYOZ (C—carbon, H—hydrogen, O—oxygen) is as follows: [2]:
At the time when the CFRwas published [1], the adoption of the above simplification assumptions had a little effect on the accuracy of determining the dilution factor since most vehicles were powered by gasoline engines which, in terms of the operation of the engine subject to approvaltests, were powered by astoichiometric or near-stoichiometric mixture andtheconcentrations measured inthedilutedexhaust gas were significantly higher than those measured in thedilution air.
Reducing exhaust emissions leads to a decrease in the measured concentrations in the exhaust gases, which in turn increases the impact of the adopted simplification assumptions on the accuracy of determining the dilution ratio. In the case of vehicle approval tests, the resulting method errors are irrelevant because the essence of those tests is to compare the measured values with the limit values laid down in the legislation, and since all laboratories apply the same calculation methodology, they make the same systematic error. That is not the case with tests conducted to determine emission factors, which are then used to estimate emissions from vehicles. In this case, we want to determine the actual value of the emissions and should, therefore aim to obtain the most accurate result without systemic errors.
The assumption of the stoichiometric composition of the air-fuel mixture used to calculate the dilution of the exhaust gas during the pollutant emissions measurements performed on the chassis dynamometer is not always met. This applies in particular to the following cases [3]:
- the vehicles with CI engines,
- warming the SI engines after a cold start,
- driving at high acceleration values, especially in cars with low power to weight ratio,
- braking with switched off fuel supply,
- turning off the engine in vehicles with the start-stop system.
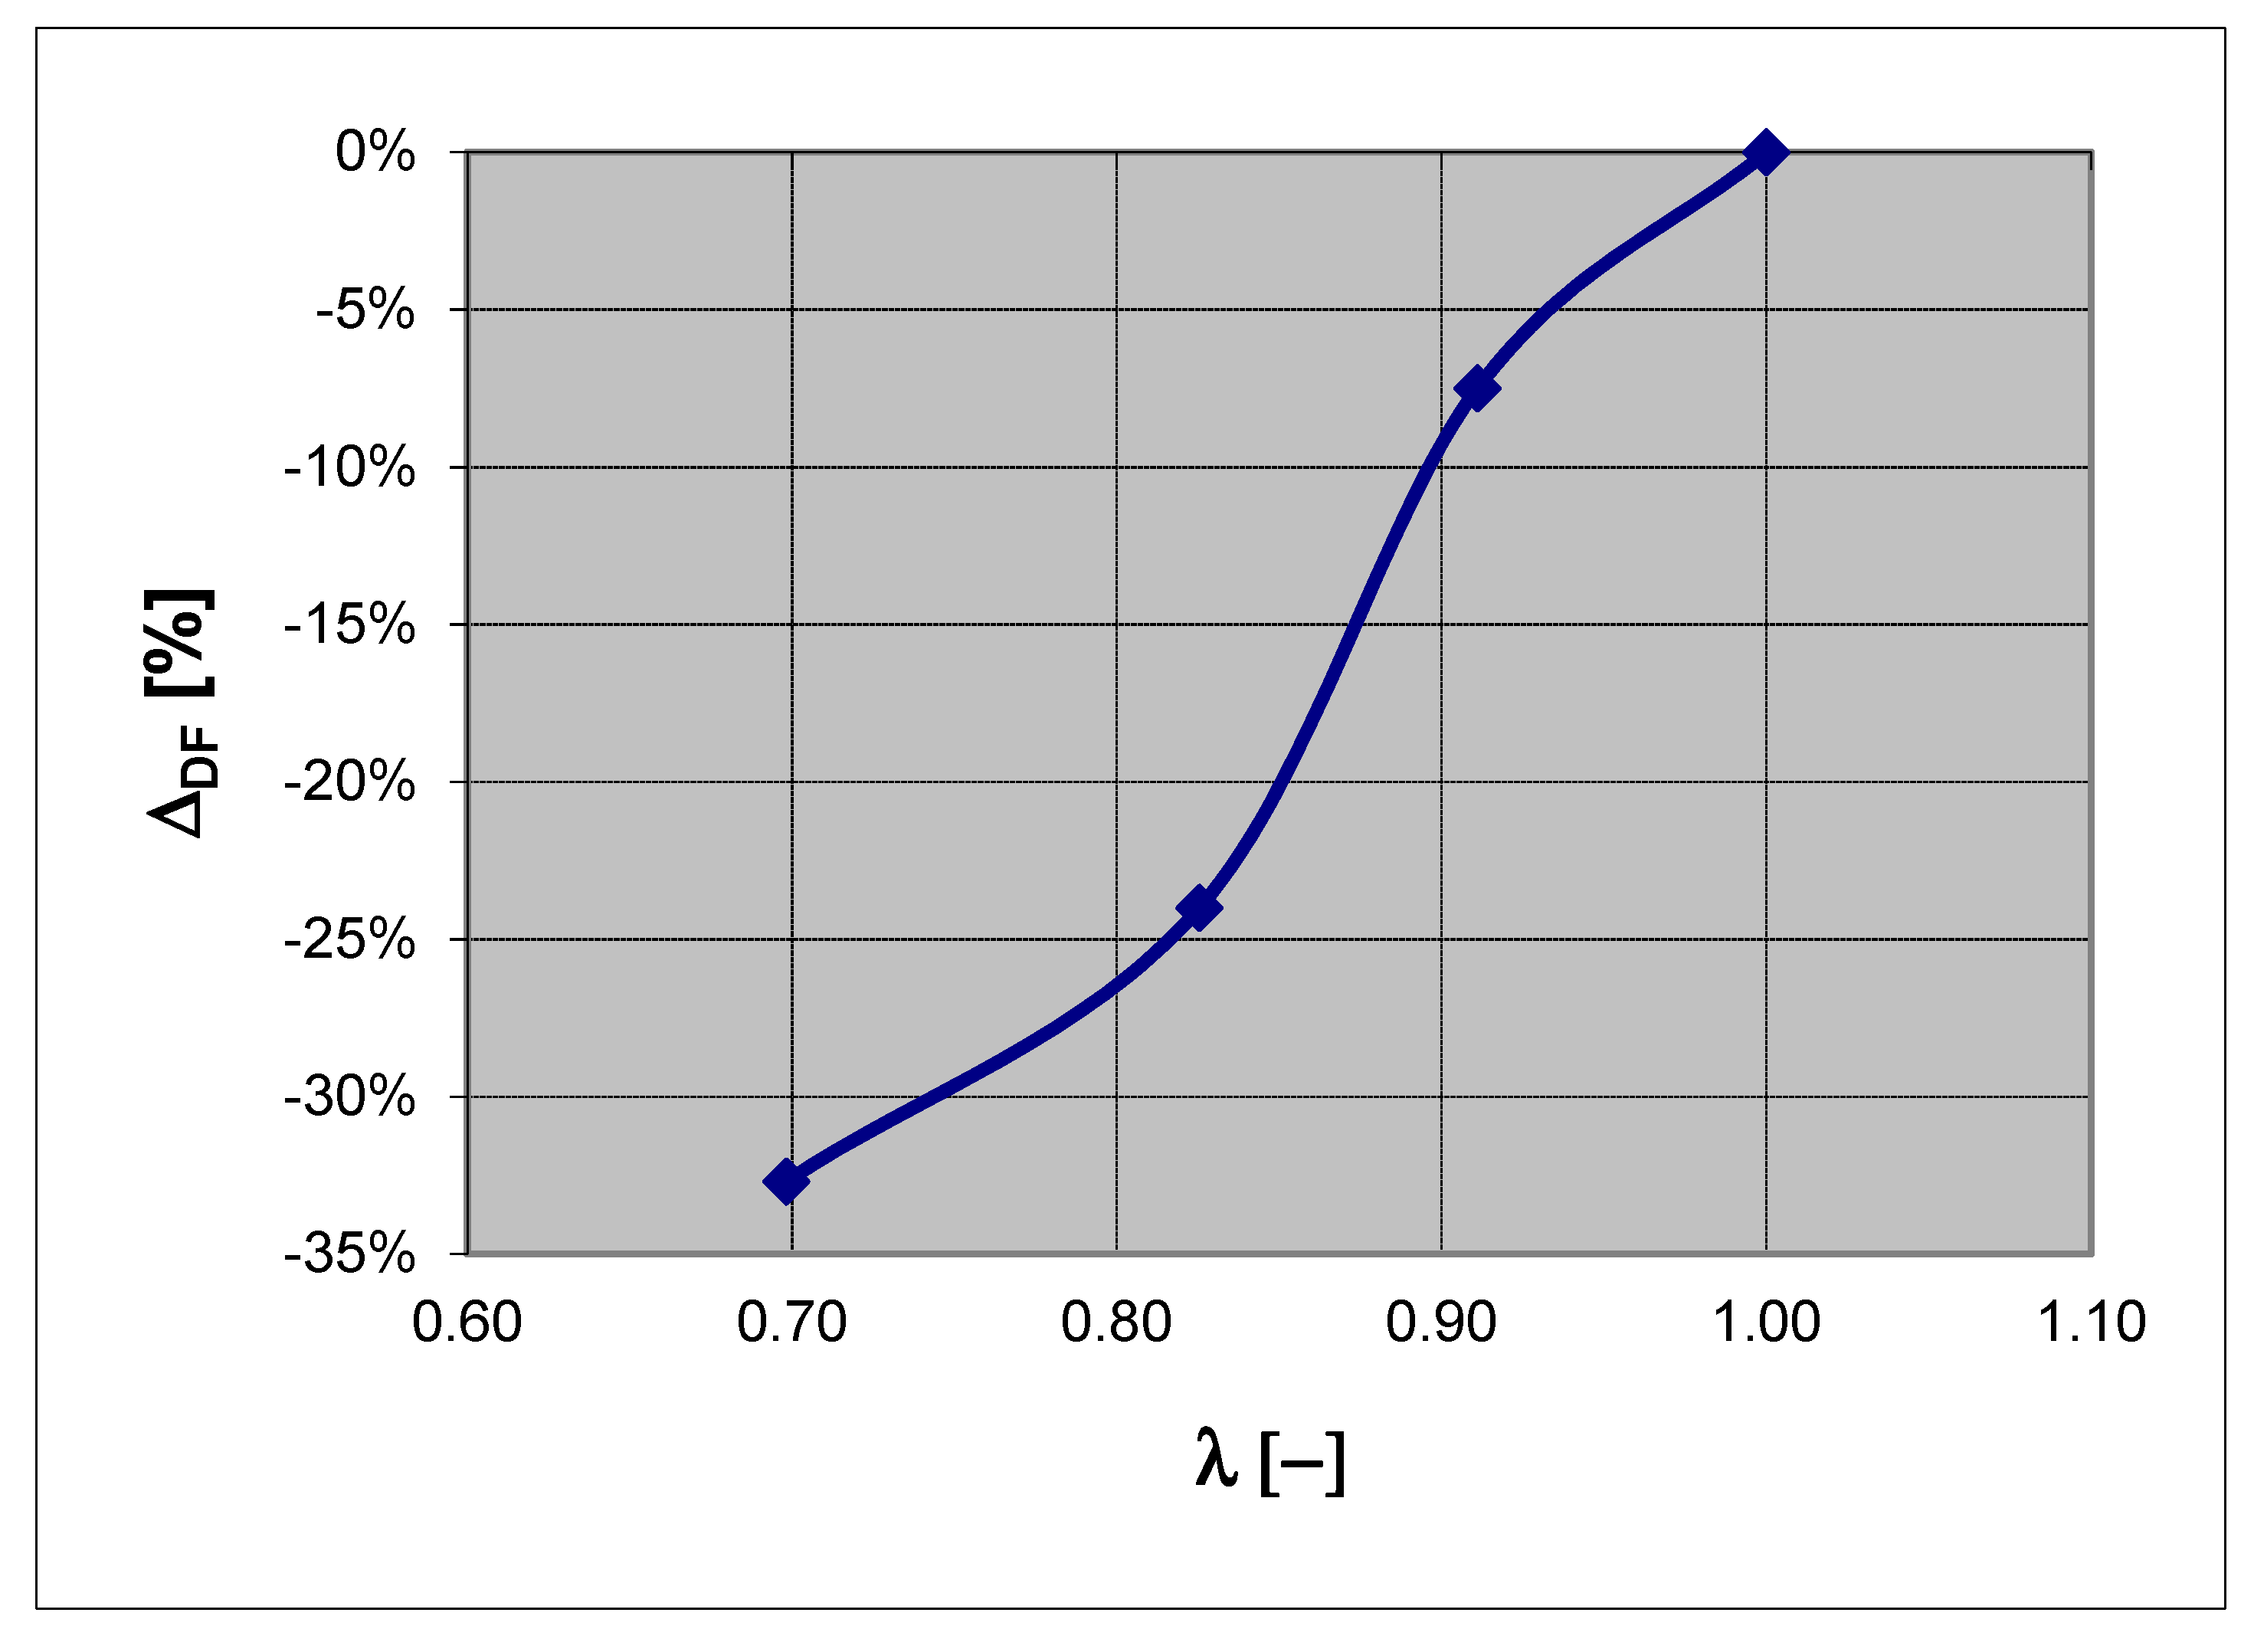
In the 1990s, new formulas were developed for the exhaust gas dilution factor, which eliminated the primary sources of errors in determining DF using Equation (2) [4,5,6,7]. In [8] shown the results of a comparison of dilution factor (DF) and dilution ratio (DR) depending on the different values of the air-fuel ratio. It analysed only the composition of the air-fuel mixture corresponding to a stoichiometric or rich mixture. The relative error ΔDF in the determination of DF changed from zero for the stoichiometric mixture to −33% for the λ = 0.70 (Figure 1).
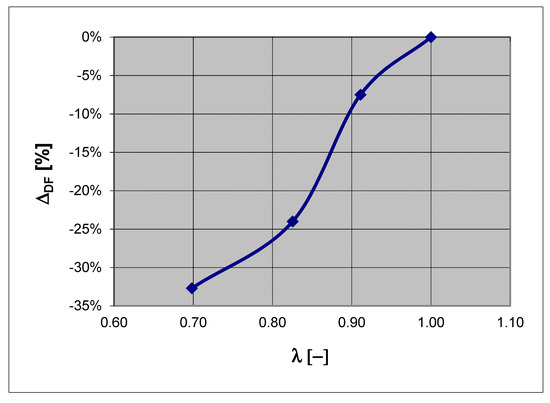
Figure 1.
Error in determining the dilution factor DF depending on the λ [8].
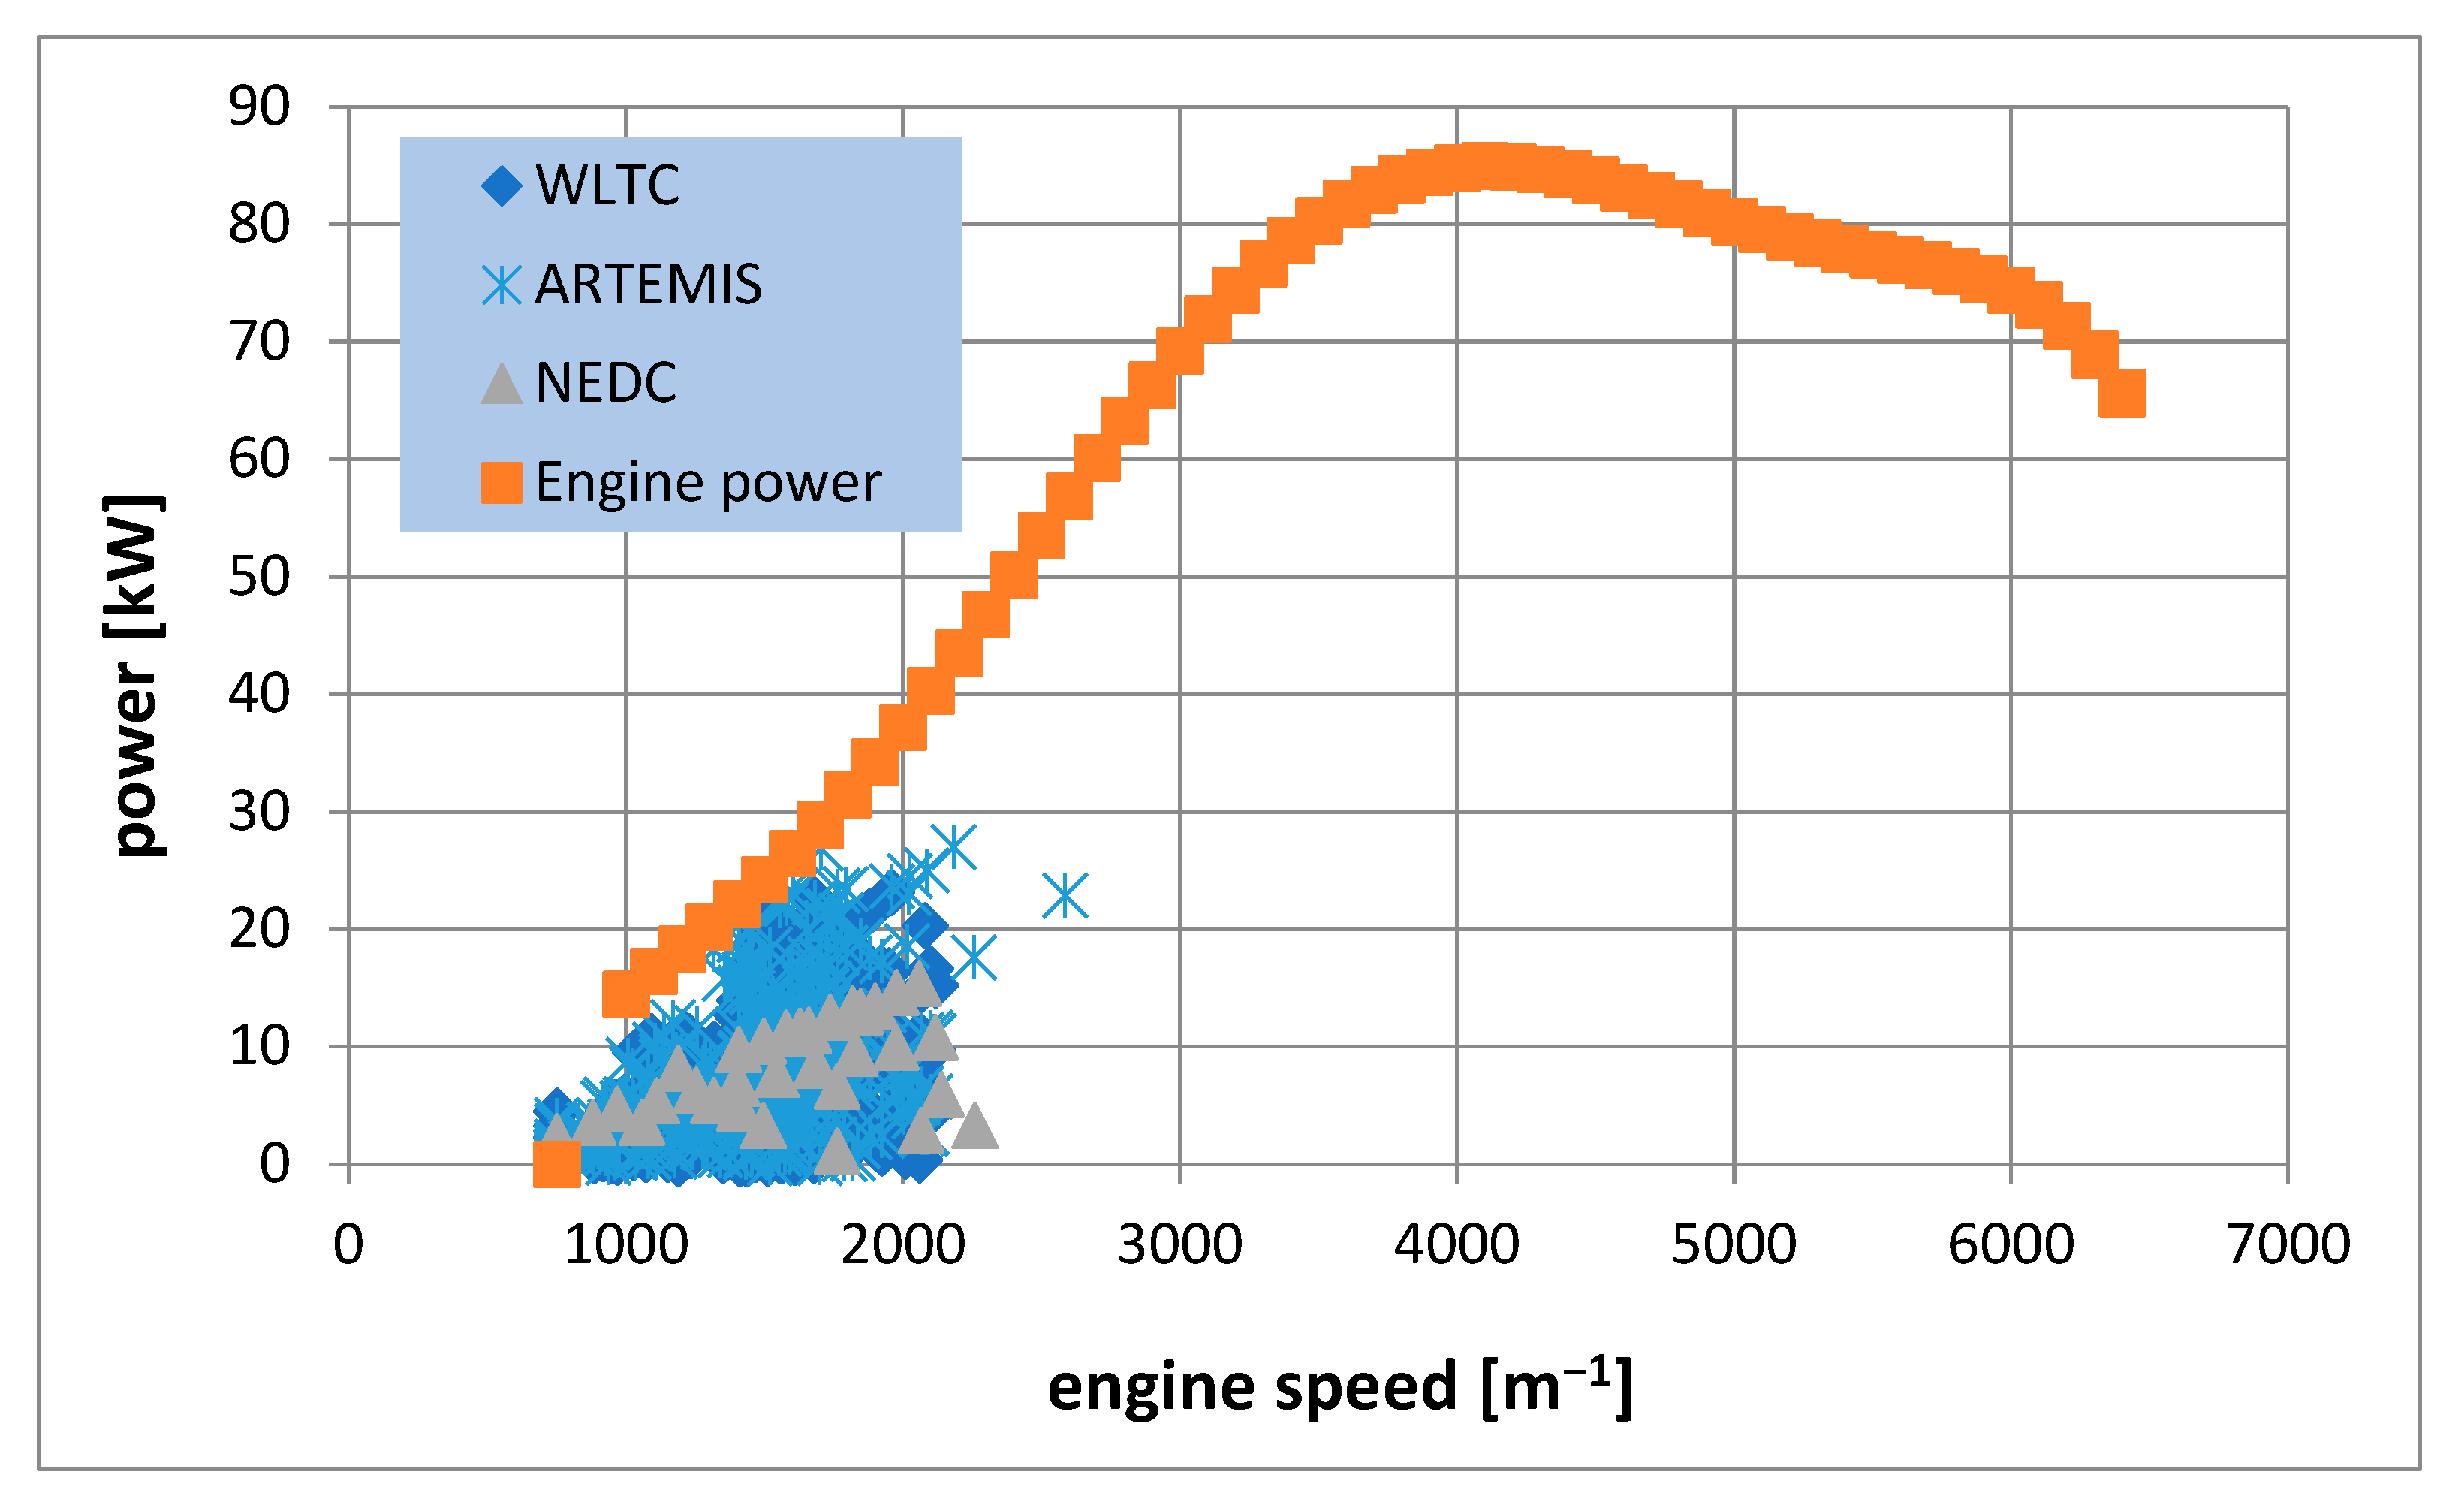
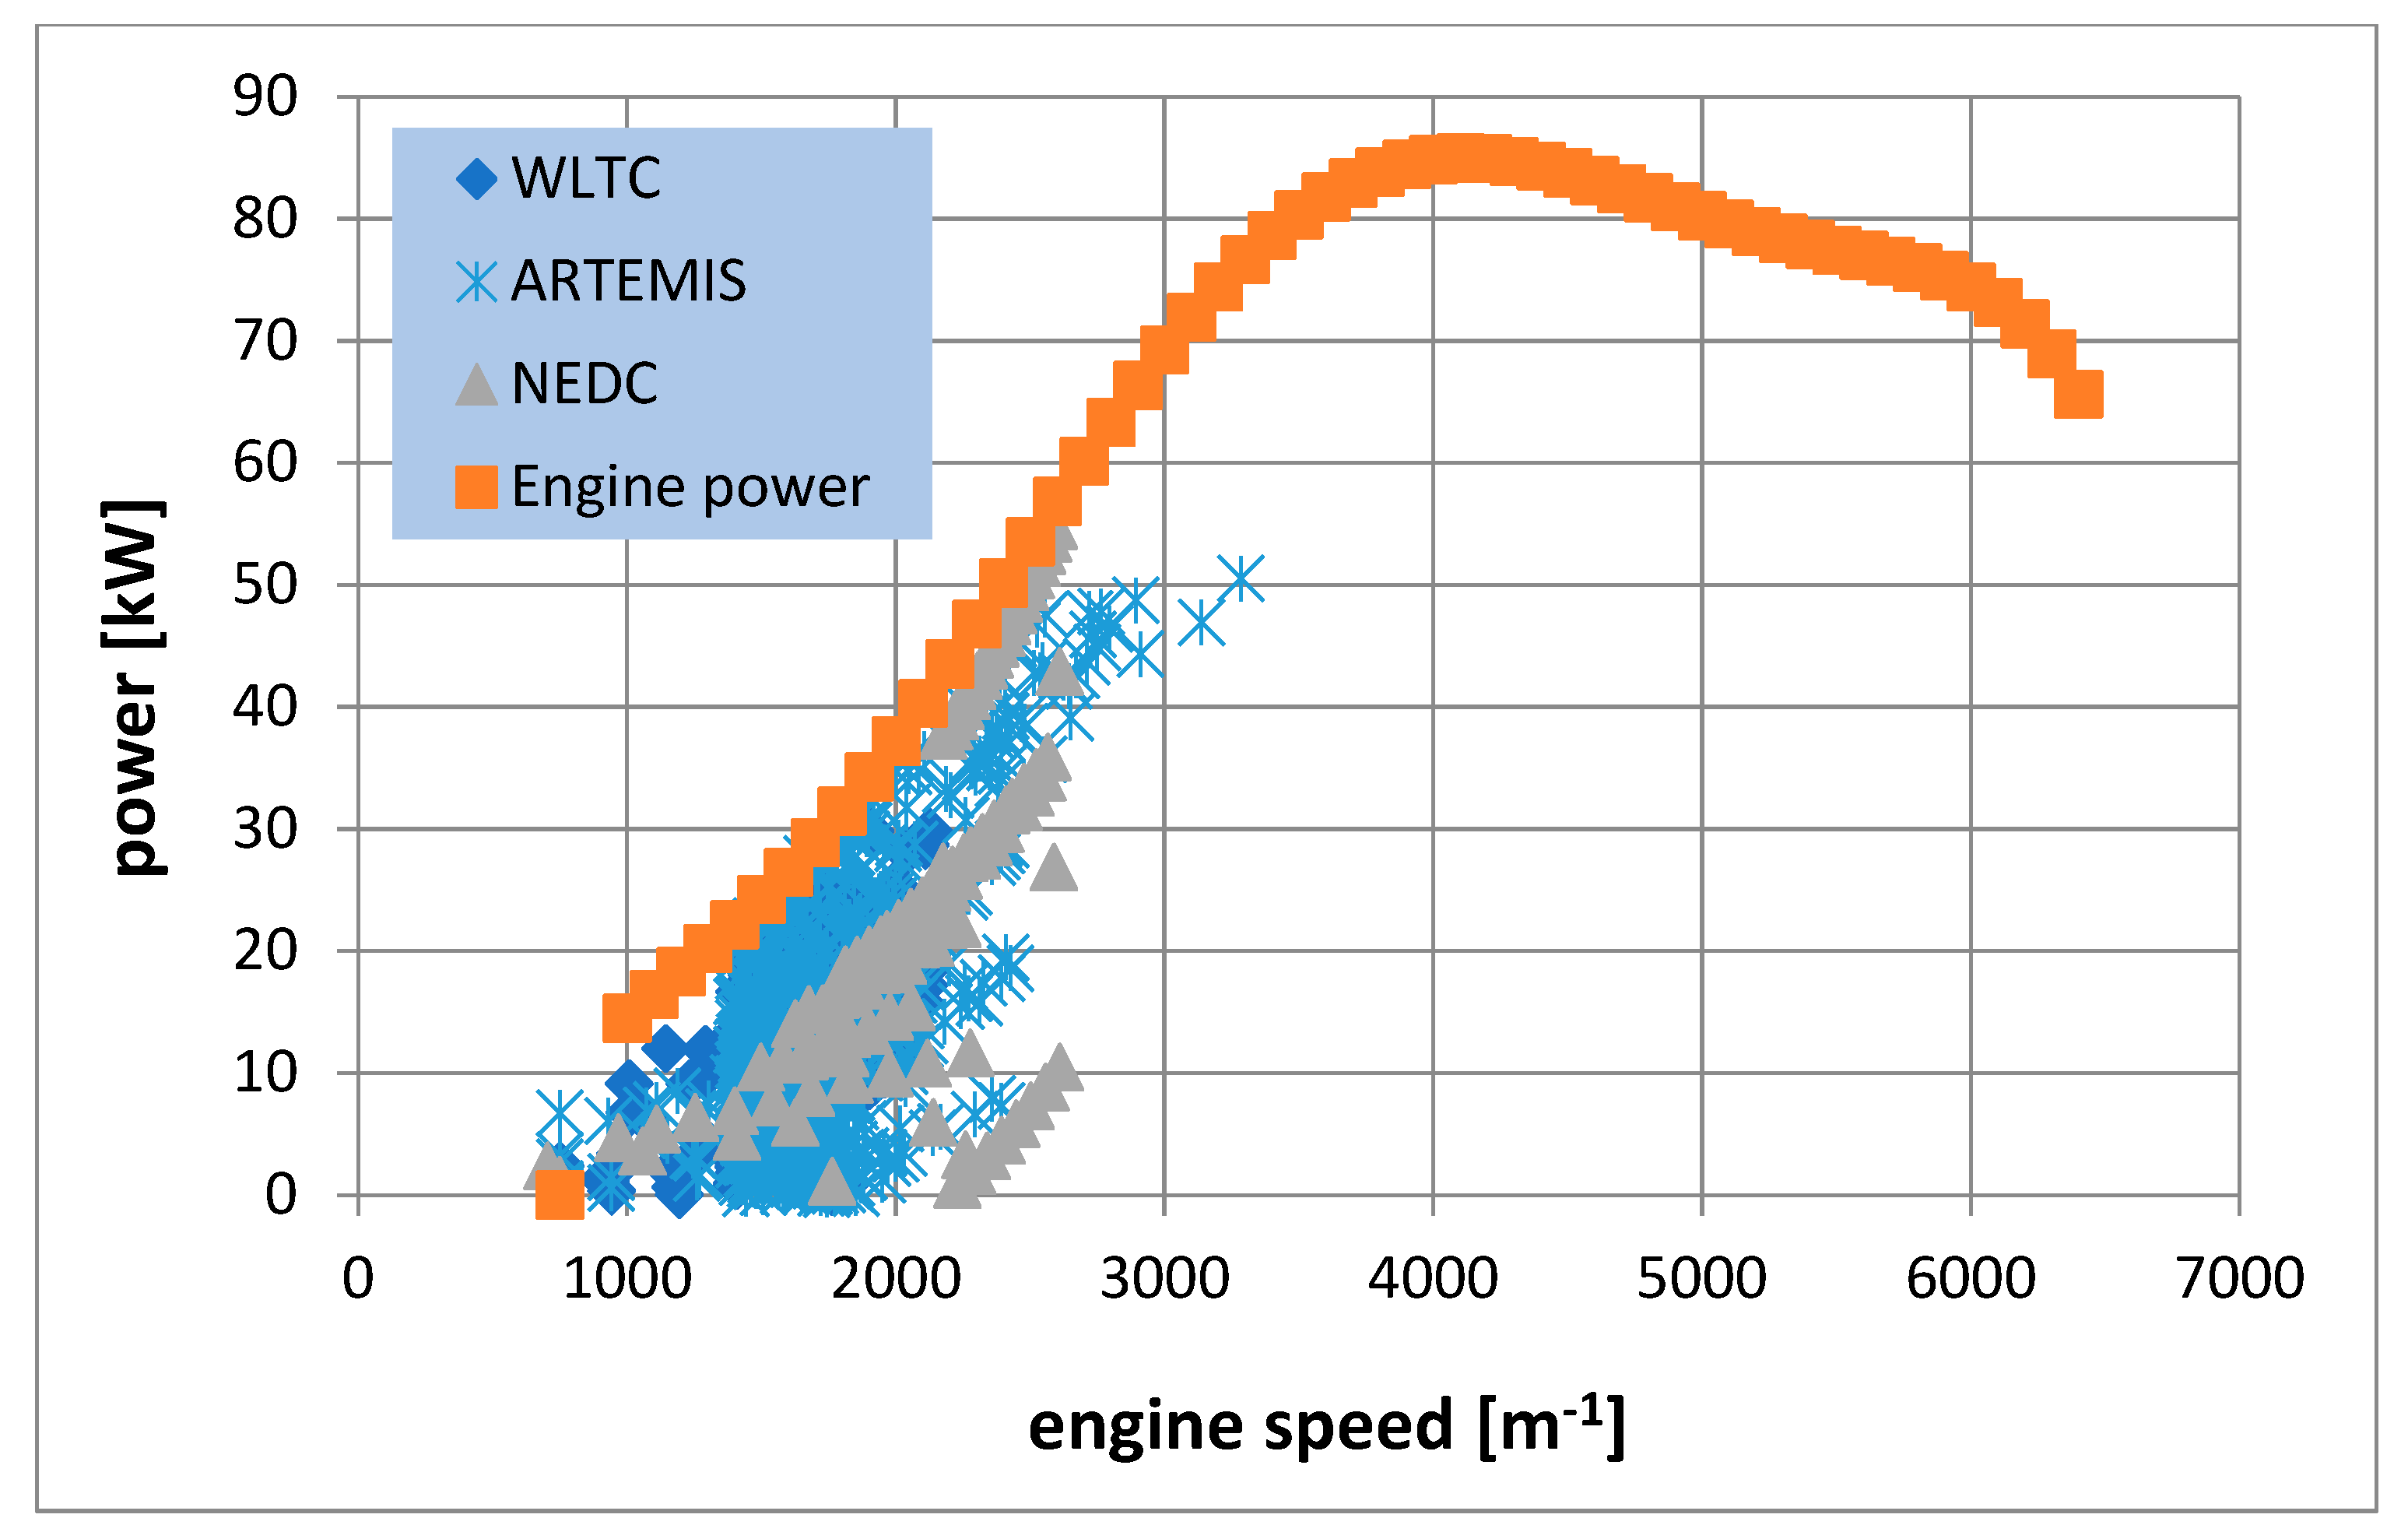
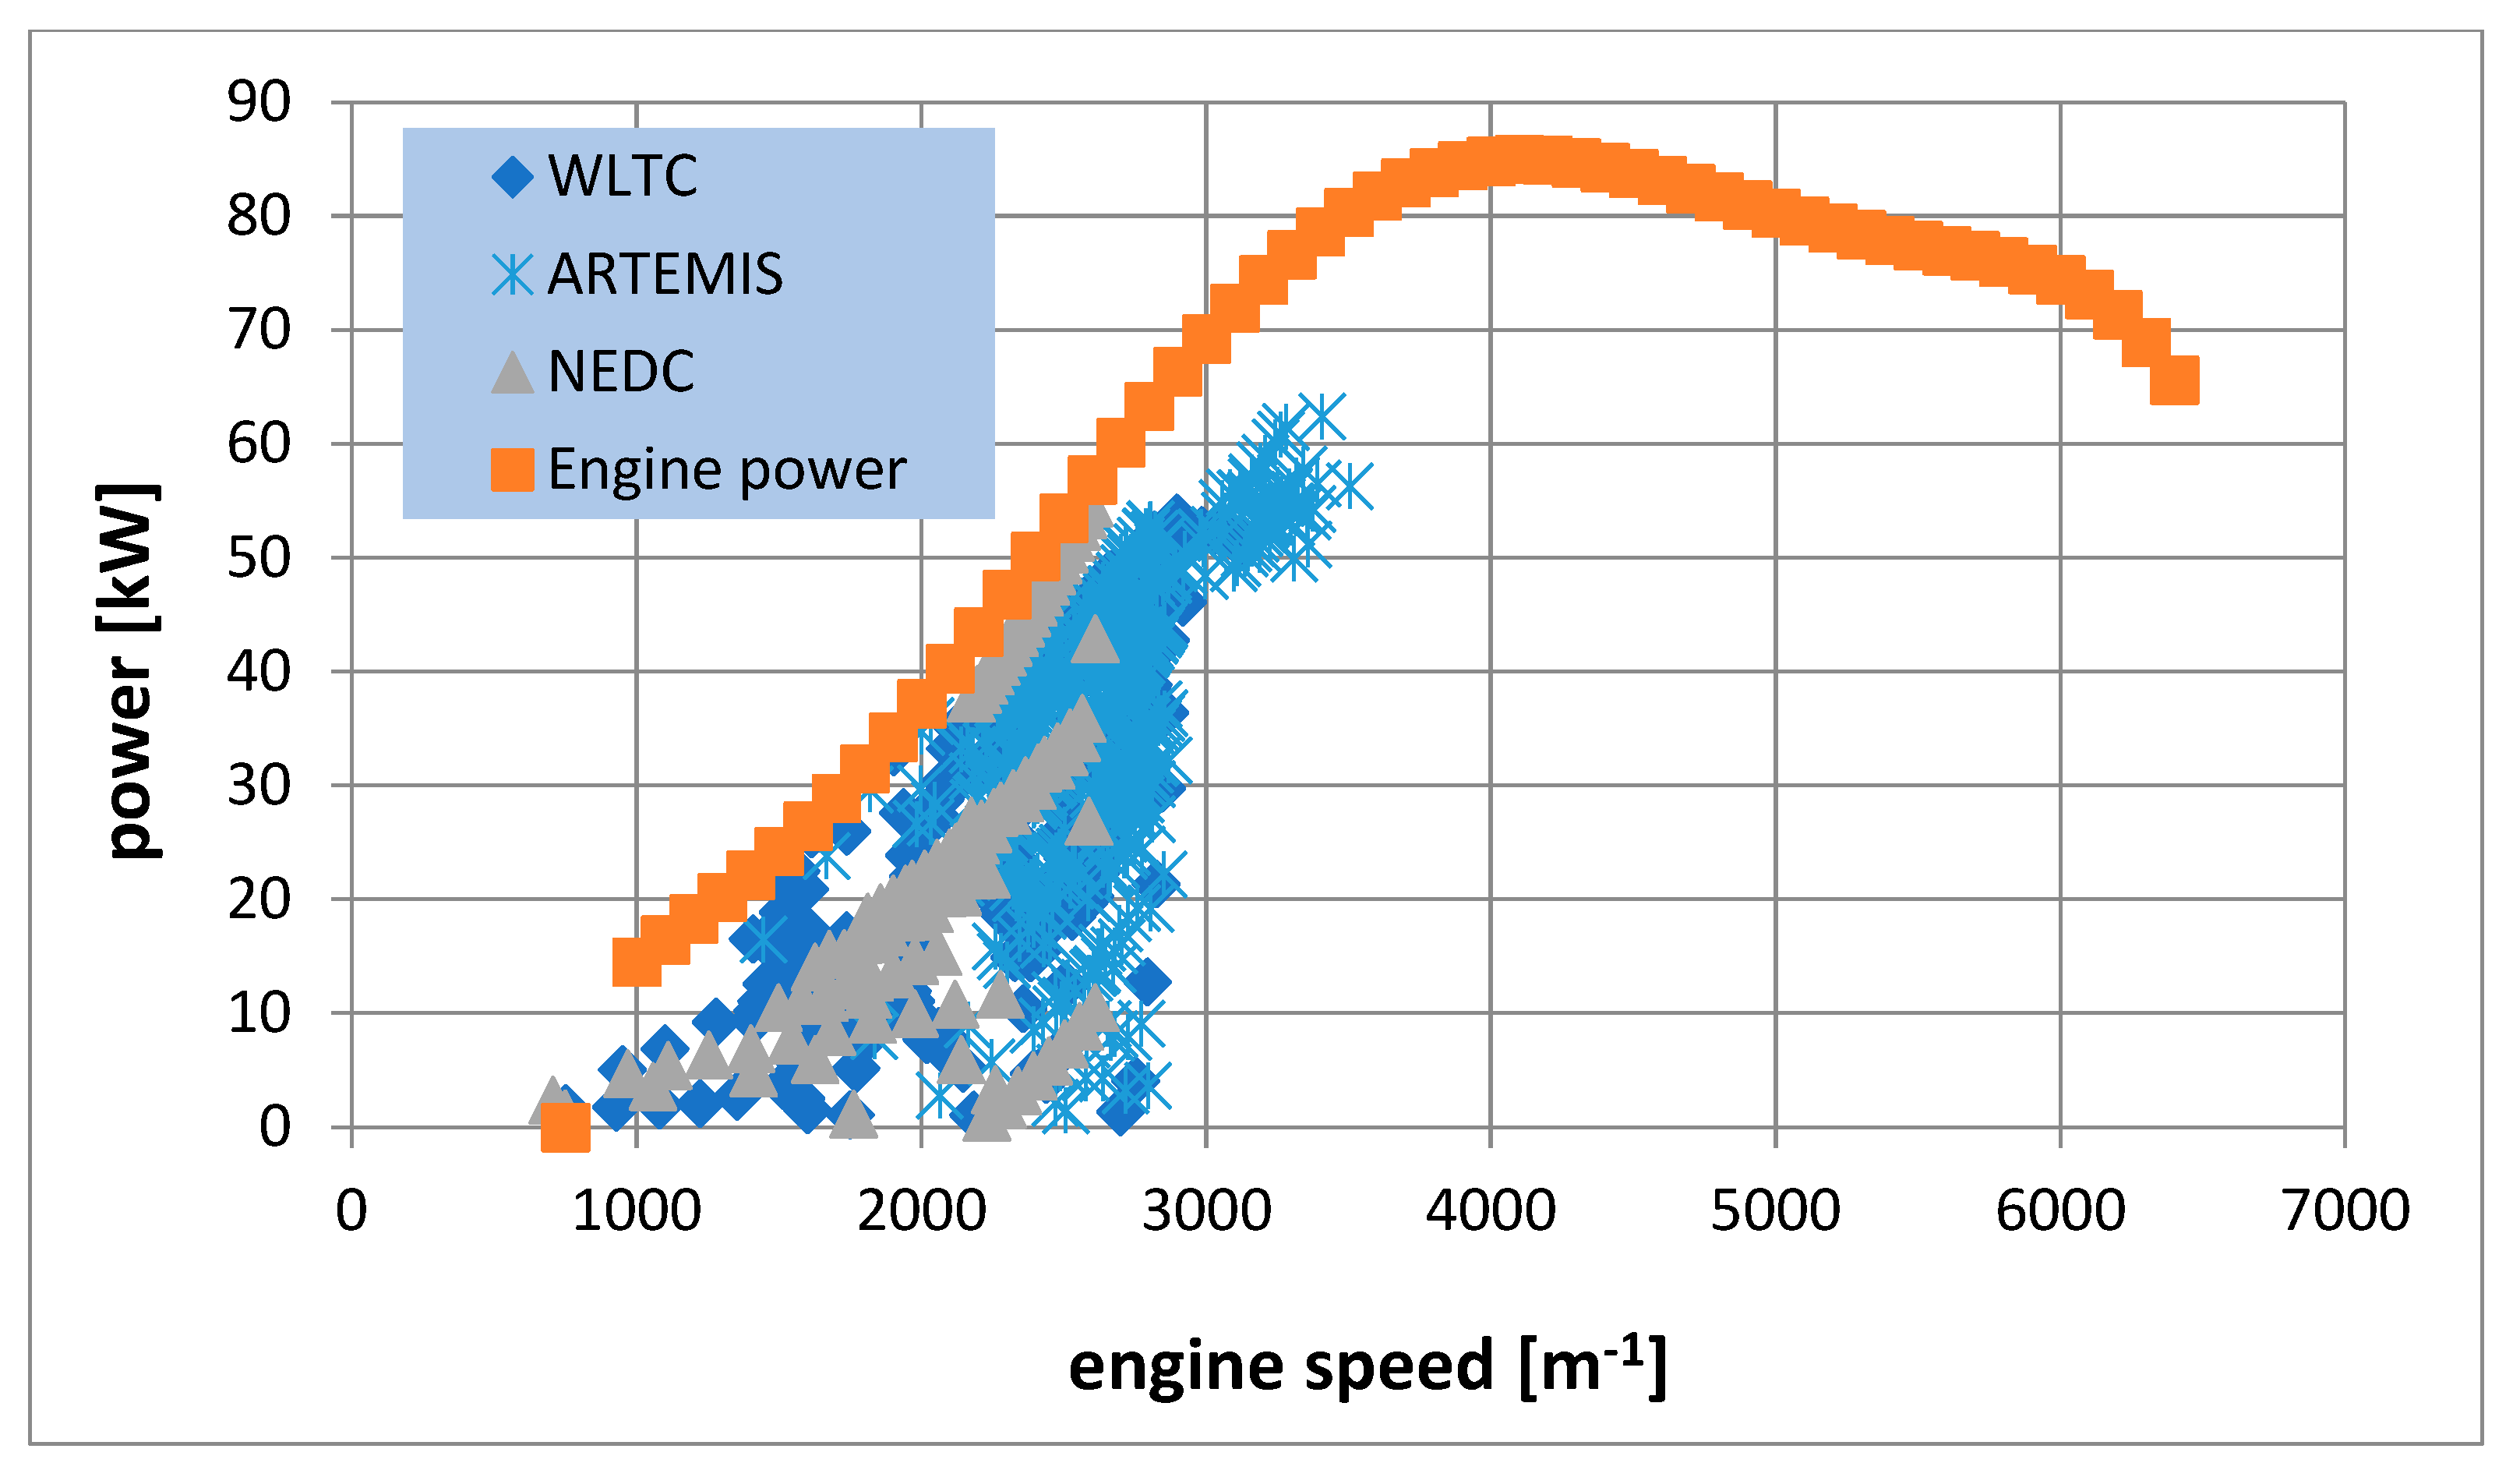
In real driving conditions of a vehicle, the engine of the tested car operates in a broader range of engine speeds and loads than in the NEDC cycle used during approval tests. This may result in entering operating areas of the engine for which the optimisation criterion was not to meet exhaust emission requirements, but rather to achieve low fuel consumption (mixture depletion) or the assumed engine power (mixture enrichment), which in the case of spark-ignition engines requires that they be powered by an air-fuel mixture with a composition deviating from the stoichiometric composition. It may lead to an incorrect determination of the dilution factor DF and, as a result, to the determination of the value of emissions subject to a systemic error. Figure 2, Figure 3 and Figure 4 show the required road load power versus engine speed for phases of the ARTEMIS, WLTC and NDEC driving cycles corresponding to urban, rural and motorway traffic conditions. It was calculated for Vehicle 3 (see Table 1). The ARTEMIS and WLTC driving cycles are considered representative of the real driving conditions.
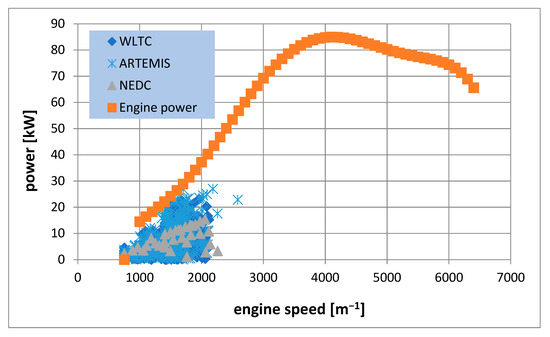
Figure 2.
The required road load power versus engine speed for phases of ARTEMIS, WLTC and NDEC driving cycles corresponding to urban traffic conditions.

Figure 3.
The required road load power versus engine speed for phases of ARTEMIS, WLTC and NDEC driving cycles corresponding to road traffic conditions.
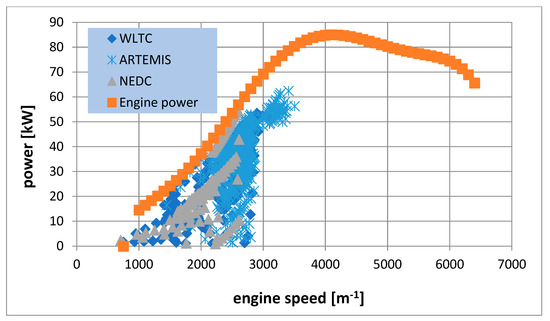
Figure 4.
The required road load power versus engine speed for phases of ARTEMIS, WLTC and NDEC driving cycles corresponding to expressway and motorway traffic conditions.

Table 1.
Essential data of the tested vehicles
There are several methods to avoid this error. The first method is to eliminate the measured pollutants from the dilution air. As a result, the concentration of Cdil in Equation (5) is equal to or very close to zero. Thanks to this, the error resulting from the method of determining the DF factor becomes negligible. In order to remove pollutants from the dilution air, exhaust gas sampling systems of the DAR-CVS type are used [6,9,10]:
The second method is to use the lowest possible dilution of the exhaust gas. As a result, the difference between the concentration of the pollutant measured in the diluted exhaust gas and its concentration in the dilution air increases, which leads to a reduction in the error of emission determination (Figure 1), [11,12]. However, the reduction in the dilution ratio is limited due to the possibility of condensation of water vapor contained in the exhaust gas. That is why the so-called heated exhaust gas sampling systems are used [13,14]. These systems heat both the dilution air and all sampling lines.
The last method is to determine the actual dilution ratio. For this, it is sufficient to measure either the raw exhaust gas volume Vexh or the dilution air volume Vdil by substituting Equation (6) in Equation (2):
The volume Vexh can be measured with the PEMS flow meter operates under Bernoulli’s principle using averaging pitot tubes [15], or with ultrasonic exhaust flow meter or with the CO2-tracer method by measuring the concentration of carbon dioxide in the exhaust gas [16,17,18]. For the measurement of the dilution air volume, exhaust gas sampling systems equipped with an ultrasonic flow meter are most often used. This flow meter is installed at the dilution air inlet to the sampling system [19].
The research was focused on two issues. The first issue was the checking the correctness of the assumption about the stoichiometric composition of the air-fuel mixture in various driving cycles considered representative for road traffic conditions and the measuring of the dilution ratio DR in these cycles. The second issue was to estimate the error resulting to not meet this assumption on the exhaust emission measured in these cycles.
2. Materials and Methods
Three driving cycles were selected to analyse the changes in the instantaneous values of the air-fuel ratio: the ARTEMIS cycle considered representative for real driving conditions [20,21], the WLTC cycle introduced in 2017 [22], which, according to the authors, also accurately reflects the real driving conditions and, for comparison, the NEDC cycle used in approval tests until 2017. The tests were conducted on three cars belonging to segment C. Two of them were equipped with a spark-ignition engine, the third with a compression ignition engine. The vehicle with a compression ignition engine had an emission approval confirming the fulfilment of Euro 5 emission requirements, whereas vehicles with spark-ignition engine—Euro 6. The first gasoline vehicle was approved under the previous procedure according to which exhaust emissions are measured in the NEDC cycle, the second according to the latest WLTP procedure. This article uses further the terms Euro 6 NEDC and Euro 6 WLTP respectively (Table 1).
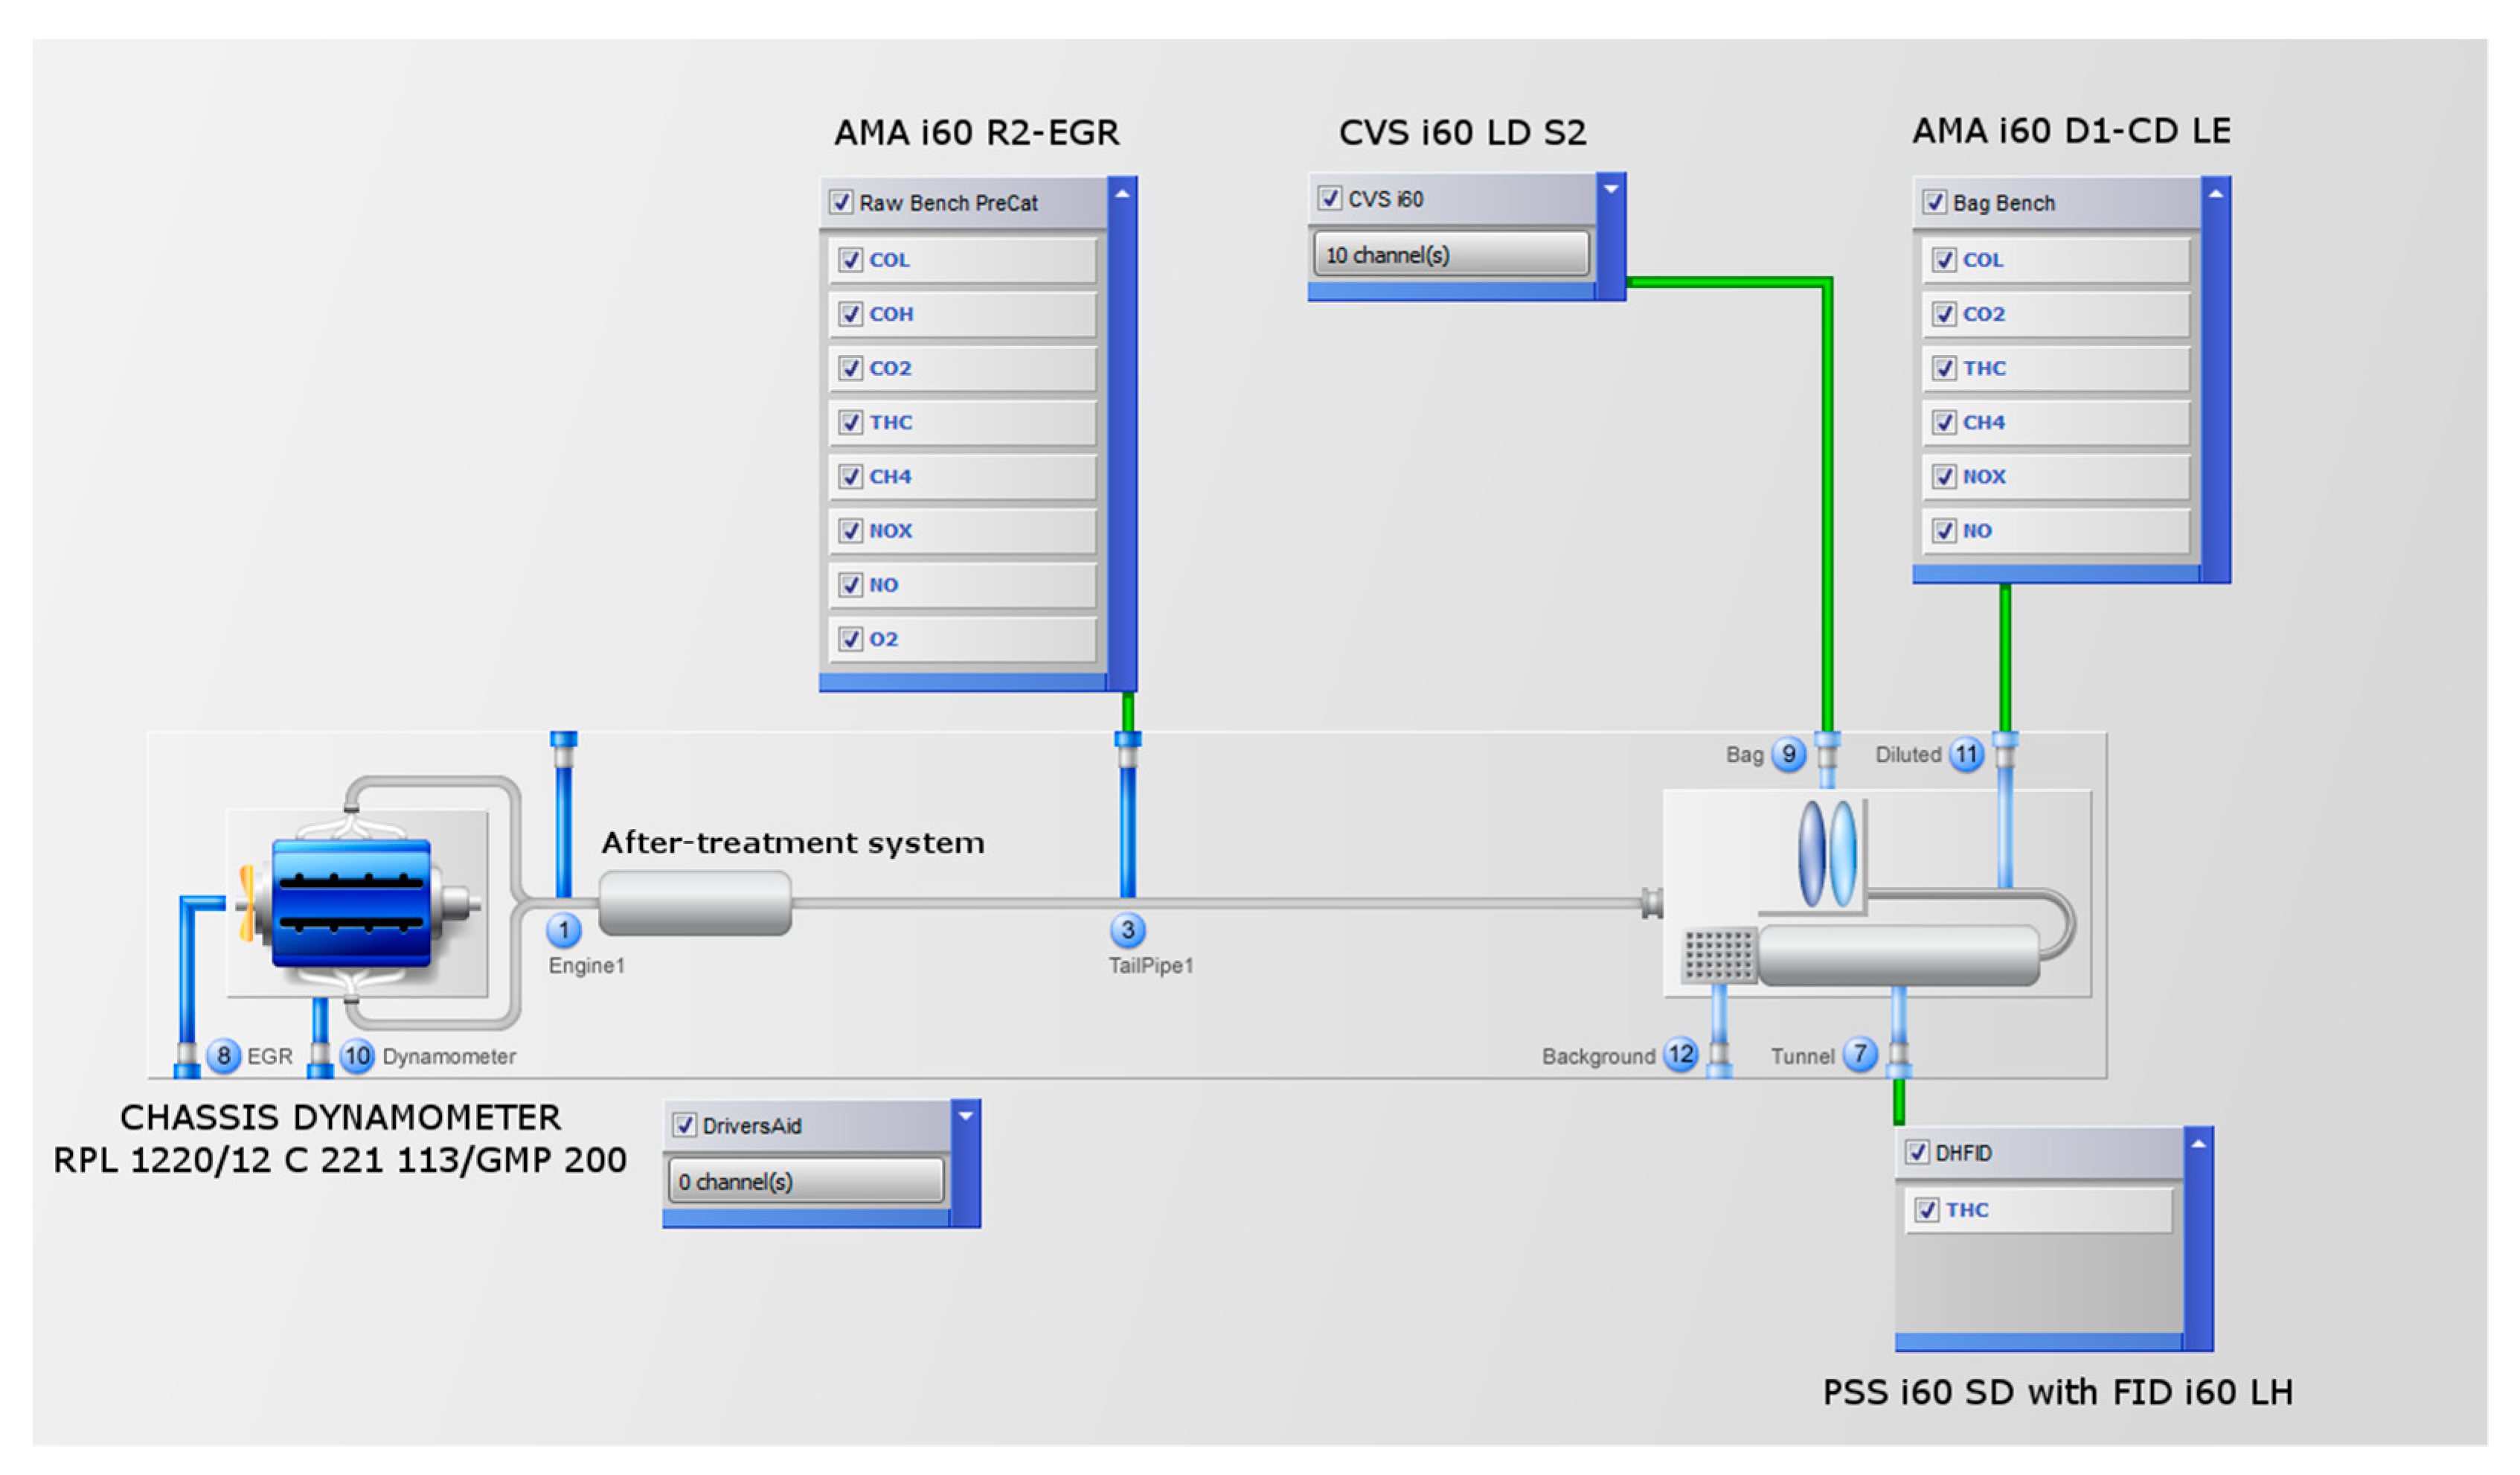
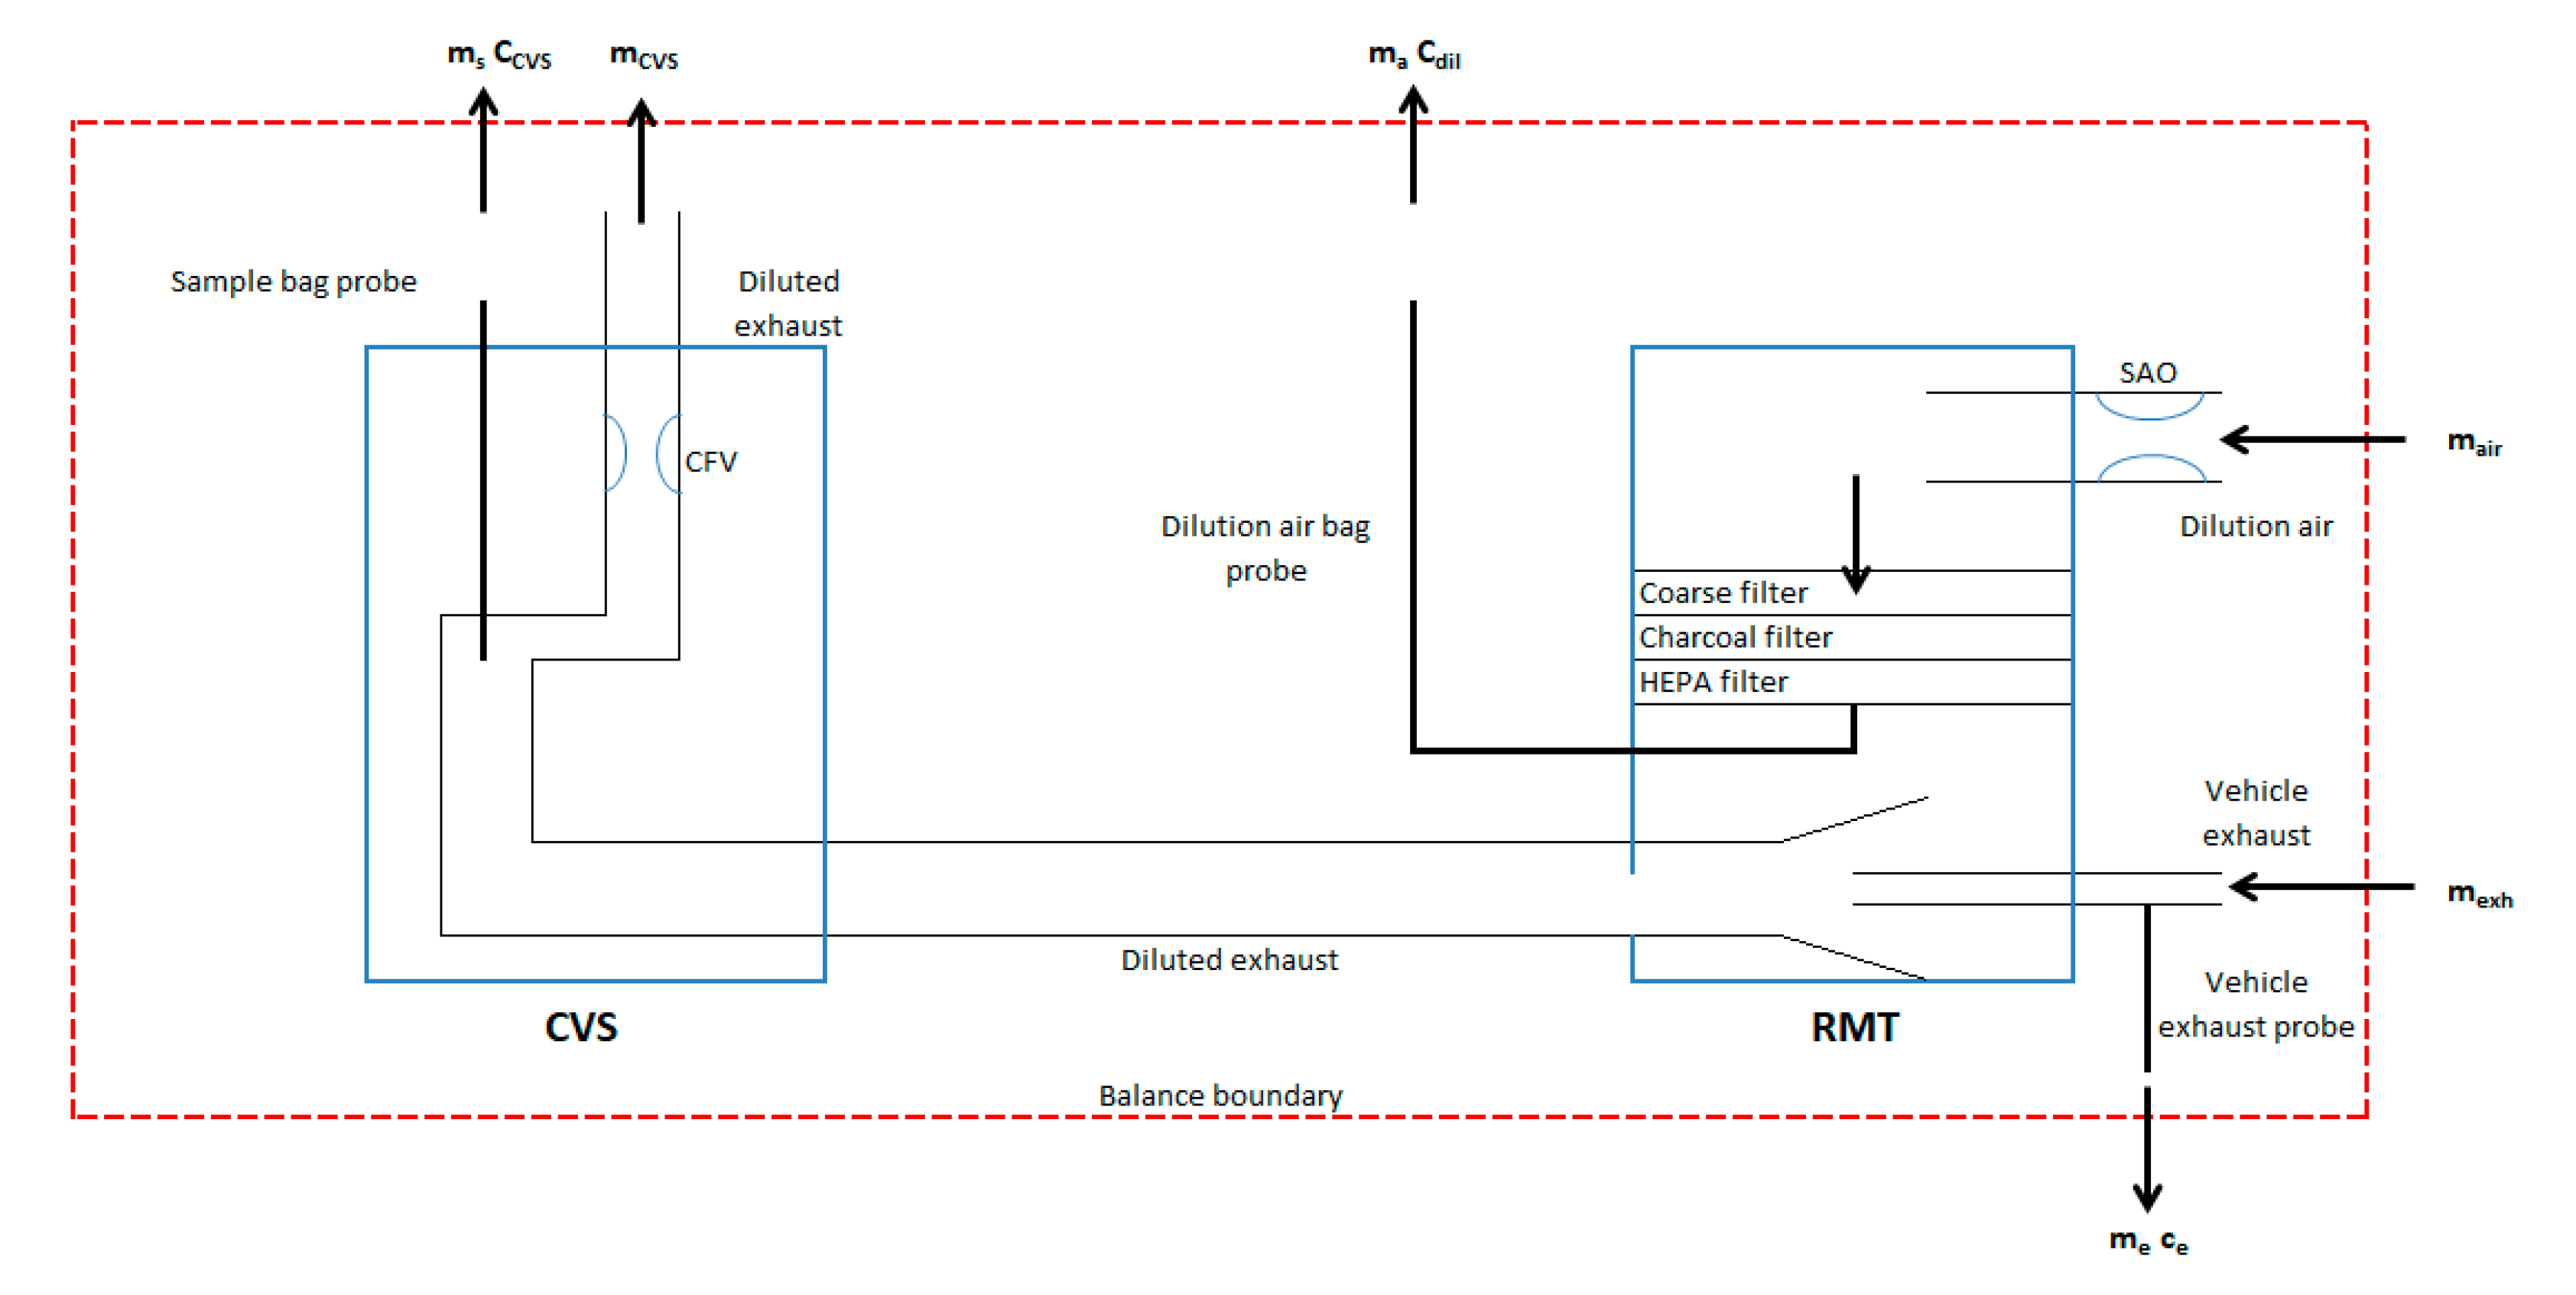
The tests were carried out on a chassis dynamometer equipped with a system for measuring emissions from the exhaust system, meeting the requirements of the normative documents for approval tests within the scope of exhaust emissions. The tests was performed at the Motor Transport Institute, Warsaw, in the laboratory equipped with the following measuring devices (Figure 5):

Figure 5.
Chart of the measuring system used in the tests.
- type RPL 1220/12 C 221 113/GPM 200 one roller chassis dynamometer with adjustable resistance curve by AVL-Zoellner (Bensheim, Germany),
- exhaust sampling and emissions analysis system by AVL consisting of:
- type CVS i60 LD S2 full-flow CFV-CVS exhaust gas sampling system by AVL with critical flow Venturies allowing for flow rates from 2 to 30 m3/min,
- type PSS i60 SD particulate sampling system by AVL equipped with a heated FID i60 LH type analyzer by AVL, measuring the concentration of the sum of hydrocarbons in the diluted exhaust gas, the sample of which is taken from the dilution tunnel using a heated line. The analyzer was used for measuring THC concentration in the diluted exhaust gases from CI engines,
- set of AMA i60 D1-CD LE analyzers by AVL equipped with two-range analyzers for analyzing the diluted exhaust, consisting of:
- type AVL IRD i60 CO2 L/CO SL two-channel analyzer by ABB measuring the low CO2 concentration and very low CO concentration in the dry exhaust gases;
- type AVL CLD i60 LHD two-channel, heated analyzer by AVL equipped with to detectors enabling the simultaneous measurement of low NOx and NO concentrations;
- type CUTTER FID i60 CLD two-channel analyzer by AVL, equipped with to detectors enabling the simultaneous measurement of the low total hydrocarbon (THC) and CH4 concentrations;
- set of AMA i60 R2-EGR analyzers by AVL equipped with two-range analyzers for analyzing the raw exhaust, consisting of:
- type IRD i60 CO2/COH two-channel analyzer by ABB measuring the CO2 and high CO concentrations in the dry exhaust gases;
- type COMBI i60 CO2/COL/O2 three-channel analyzer by AVL measuring the CO2, low CO and O2 concetration in the dry exhaust gases;
- type CUTTER FID i60 HHD two-channel, heated analyzer by AVL measuring the high total hydrocarbon (THC) and CH4 concentrations;
- type CLD i60 HDD two-channel, heated analyzer by AVL with to detectors enabling the simultaneous measurement of high NOx and NO concentrations;
- a set of calibration gases with accuracy of 1% used for calibration of the analyzers,
- PTU303 weather station (VAISALA, Helsinki, Finland) for measuring air temperature, pressure and humidity in a chassis dynamometer room,
- iGEM Vehicle measurement automation system produced by AVL, which was responsible for controlling the operation of measuring devices, analyzing exhaust gas samples and recording selected parameters in the database.
The used measurement equipment allowed to ensure the accuracy of emission measurements of 4%. During the measurements, instantaneous concentrations of the pollutants in diluted exhaust gases and wet raw exhaust gases were recorded. The raw exhaust gas sample point was behind the after-treatment system (Figure 5).
Based on the recorded instantaneous concentration values in raw exhaust gases, the instantaneous value of λ was calculated using a simplified Brettschneider Equation (7) [2]:
HCV and OCV values corresponding to reference fuels E5 and B5 with fuel molecule structure were used for the calculation of the air-fuel ratio: C1H1.89O0.016 and C1H1.86O0.005, i.e., HCV,E5=1.89, OCV,E5=0.016, HCV,B5=1.86 and OCV,B5=0.005.
The real exhaust gas dilution factor DR was calculated on the basis of the CO2-tracer method. In order to derive the formula for the dilution ratio of the exhaust gas DR as a function of the pollutant concentration, a mass balance shall be used. It will be most convenient to use the mass of carbon dioxide due to the high concentration values of this compound. Based on Figure 6, it can be written that:
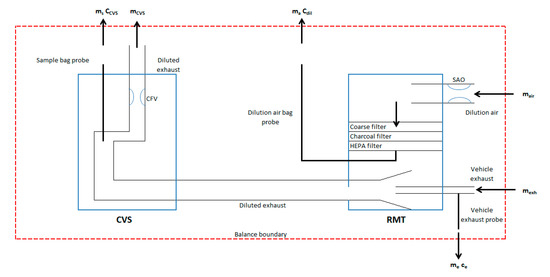
Figure 6.
Mass balance area for the method of determining the DR dilution ratio by measuring the CO2 concentration in the raw exhaust gas.
The left side of the equation shows the mass of CO2 entering the mass balance area shown in Figure 6, while the right side of the equation shows the mass of CO2 coming out of this area. Substituting the dependence (1) on the mass of the pollutant into the formula (8) we get:
Dividing both sides of the equation by the density of CO2 and grouping according to CO2 concentration we get:
In most sampling systems, the volumes Vs and Va are neglected due to their small values relative to the total dilute exhaust volume VCVS and dilution air volume Vdil. The newest systems include taking into account the volume Vs. in the calculation of the mass of the emitted pollutant. However, the volume of Va is neglected. This solution was used in the sampling system used in the research.
The total volume of diluted exhaust gas passed through the sampling system over the cycle, corrected for the amount of diluted exhaust gas collected in the bag, can be defined as:
If we define the exhaust gas volume corrected by the volume taken by the raw exhaust gas sampling probe, as:
and taking into account that we assumed that Va = 0, we get:
Taking into account the correction of the diluted exhaust gas and raw exhaust gas volumes with volumes taken for analysis, the Equation (2) on the dilution ratio DR takes the form:
Dividing both sides othe Equation (13) by we get:
Taking into account that:
we get:
Substituting Equation (14) into Equation (17) and transforming, we get:
Hence, the formula for determining the dilution ratio DR expressed in terms of carbon dioxide concentrations measured in the diluted exhaust gas (CCO2,CVS), raw exhaust gas (CCO2,exh) and in the dilution air (CCO2,dil) is as follows:
In order to accurately determine the DR dilution ratio, it is necessary to measure the CO2 concentration in the dilution air. In some studies [12], this value has been neglected. In order to assess the error caused by adopting such a simplification, the following analysis was performed. For the measurements made in this research, the value of the DR dilution ratio was calculated based on the relationship (19). The CO2 concentrations in the raw exhaust gas, the diluted exhaust gas, and the dilution air were calculated as the average value of the instantaneous values recorded during the driving cycles. The value for the DR dilution ratio was then calculated using two methods: taking into account the CO2 concentration in the dilution air and assuming that this concentration is equal to 0. Table 2 shows the values for the DR dilution ratio calculated by the two methods. The table also shows the relative percentage difference in determining the value of the dilution ratio ΔDR.
Table 2.
The dilution ratio DR calculated with and without considering the CO2 concentration in the dilution air.
The average relative percentage difference in determining the value of the dilution ratio ΔDR is equal −7% and ranged from −2.5% to −11.1%. Therefore, the calculation of the DR dilution factor should take into account the CO2 concentration in the dilution air, the more that this value is measured in standard measurements and does not require modification of the measuring equipment used in the test.
3. Results
3.1. Lambda
Based on the recorded instantaneous concentrations of the measured pollutants, instantaneous values of the λ were calculated. For each phase of respective driving cycles the median of the λ was calculated. The values are presented in Table 3.
Table 3.
Median of the λ in each phase of NEDC, WLTC and ARTEMIS cycles.
Figure 7 shows the instantaneous values of the λ in the time function in the WLTC cycle for a car with a compression ignition engine. The graphs show the phases of increase in the value of the λ above the values corresponding to the flammability limit of the mixture. That occurs during engine braking phases when fuel injection is cut off, which leads to a gradual decrease in concentrations of carbon dioxide, hydrocarbons and nitric oxide and an increase in the oxygen concentration in the exhaust system.
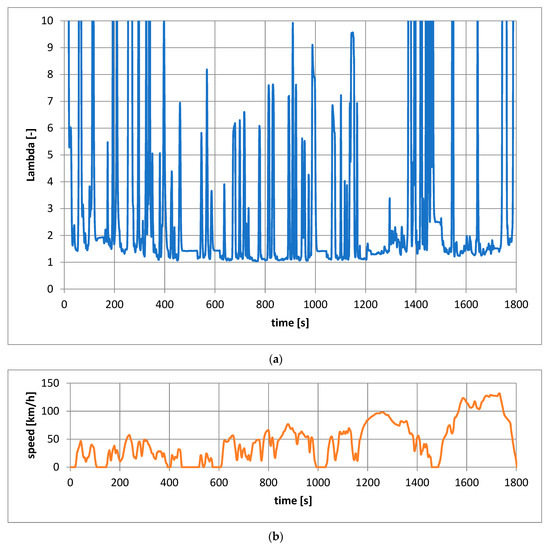
Figure 7.
(a) Instantaneous values of λ (Lambda) in WLTC for a vehicle equipped with a compression ignition engine, (b) real vehicle speed in WLTC cycle.
Figure 8 graphically presents the median of the λ in the different phases of the NEDC, WLTC and ARTEMIS driving cycles for a car with a compression ignition engine with a Euro 5 approval. The median of the λ in each phase of the WLTC, NEDC and ARTEMIS cycles is greater than 1.5 and within the range of 1.532–3.307. Only in the Medium phase of the WLTC cycle, the median is less than 1.5 and equal to 1.230.
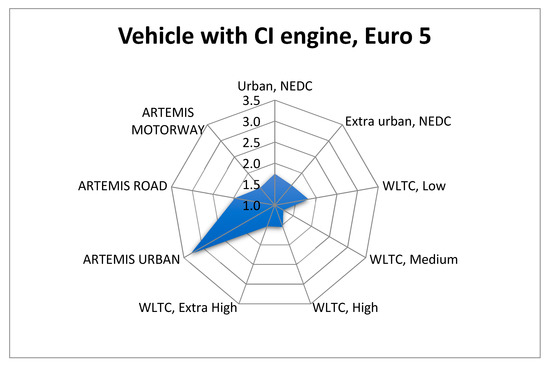
Figure 8.
The median λ in driving cycles for a vehicle equipped with compression ignition engine, Euro 5.
Figure 9 graphically shows the median of the λ in the different phases of the NEDC, WLTC and ARTEMIS driving cycles for a car with a spark-ignition engine with a Euro 6 WLTP approval. The median of the λ in each phase of the WLTC cycle is similar to the value corresponding to the stoichiometric composition and within the range of 1.022–1.094. The same is true of the ARTEMIS cycle, for which it falls within the range of 1.010–1.081. In the NEDC cycle, the median of the λ is within 1.198–1.225 and is higher than the values measured for that vehicle in the WLTC and ARTEMIS cycles.
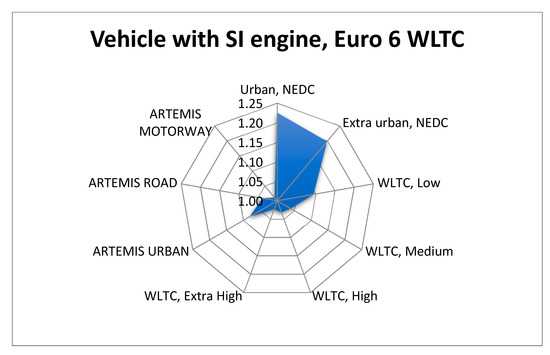
Figure 9.
The median of the λ in driving cycles for a vehicle equipped with spark ignition engine, Euro 6 WLTP.
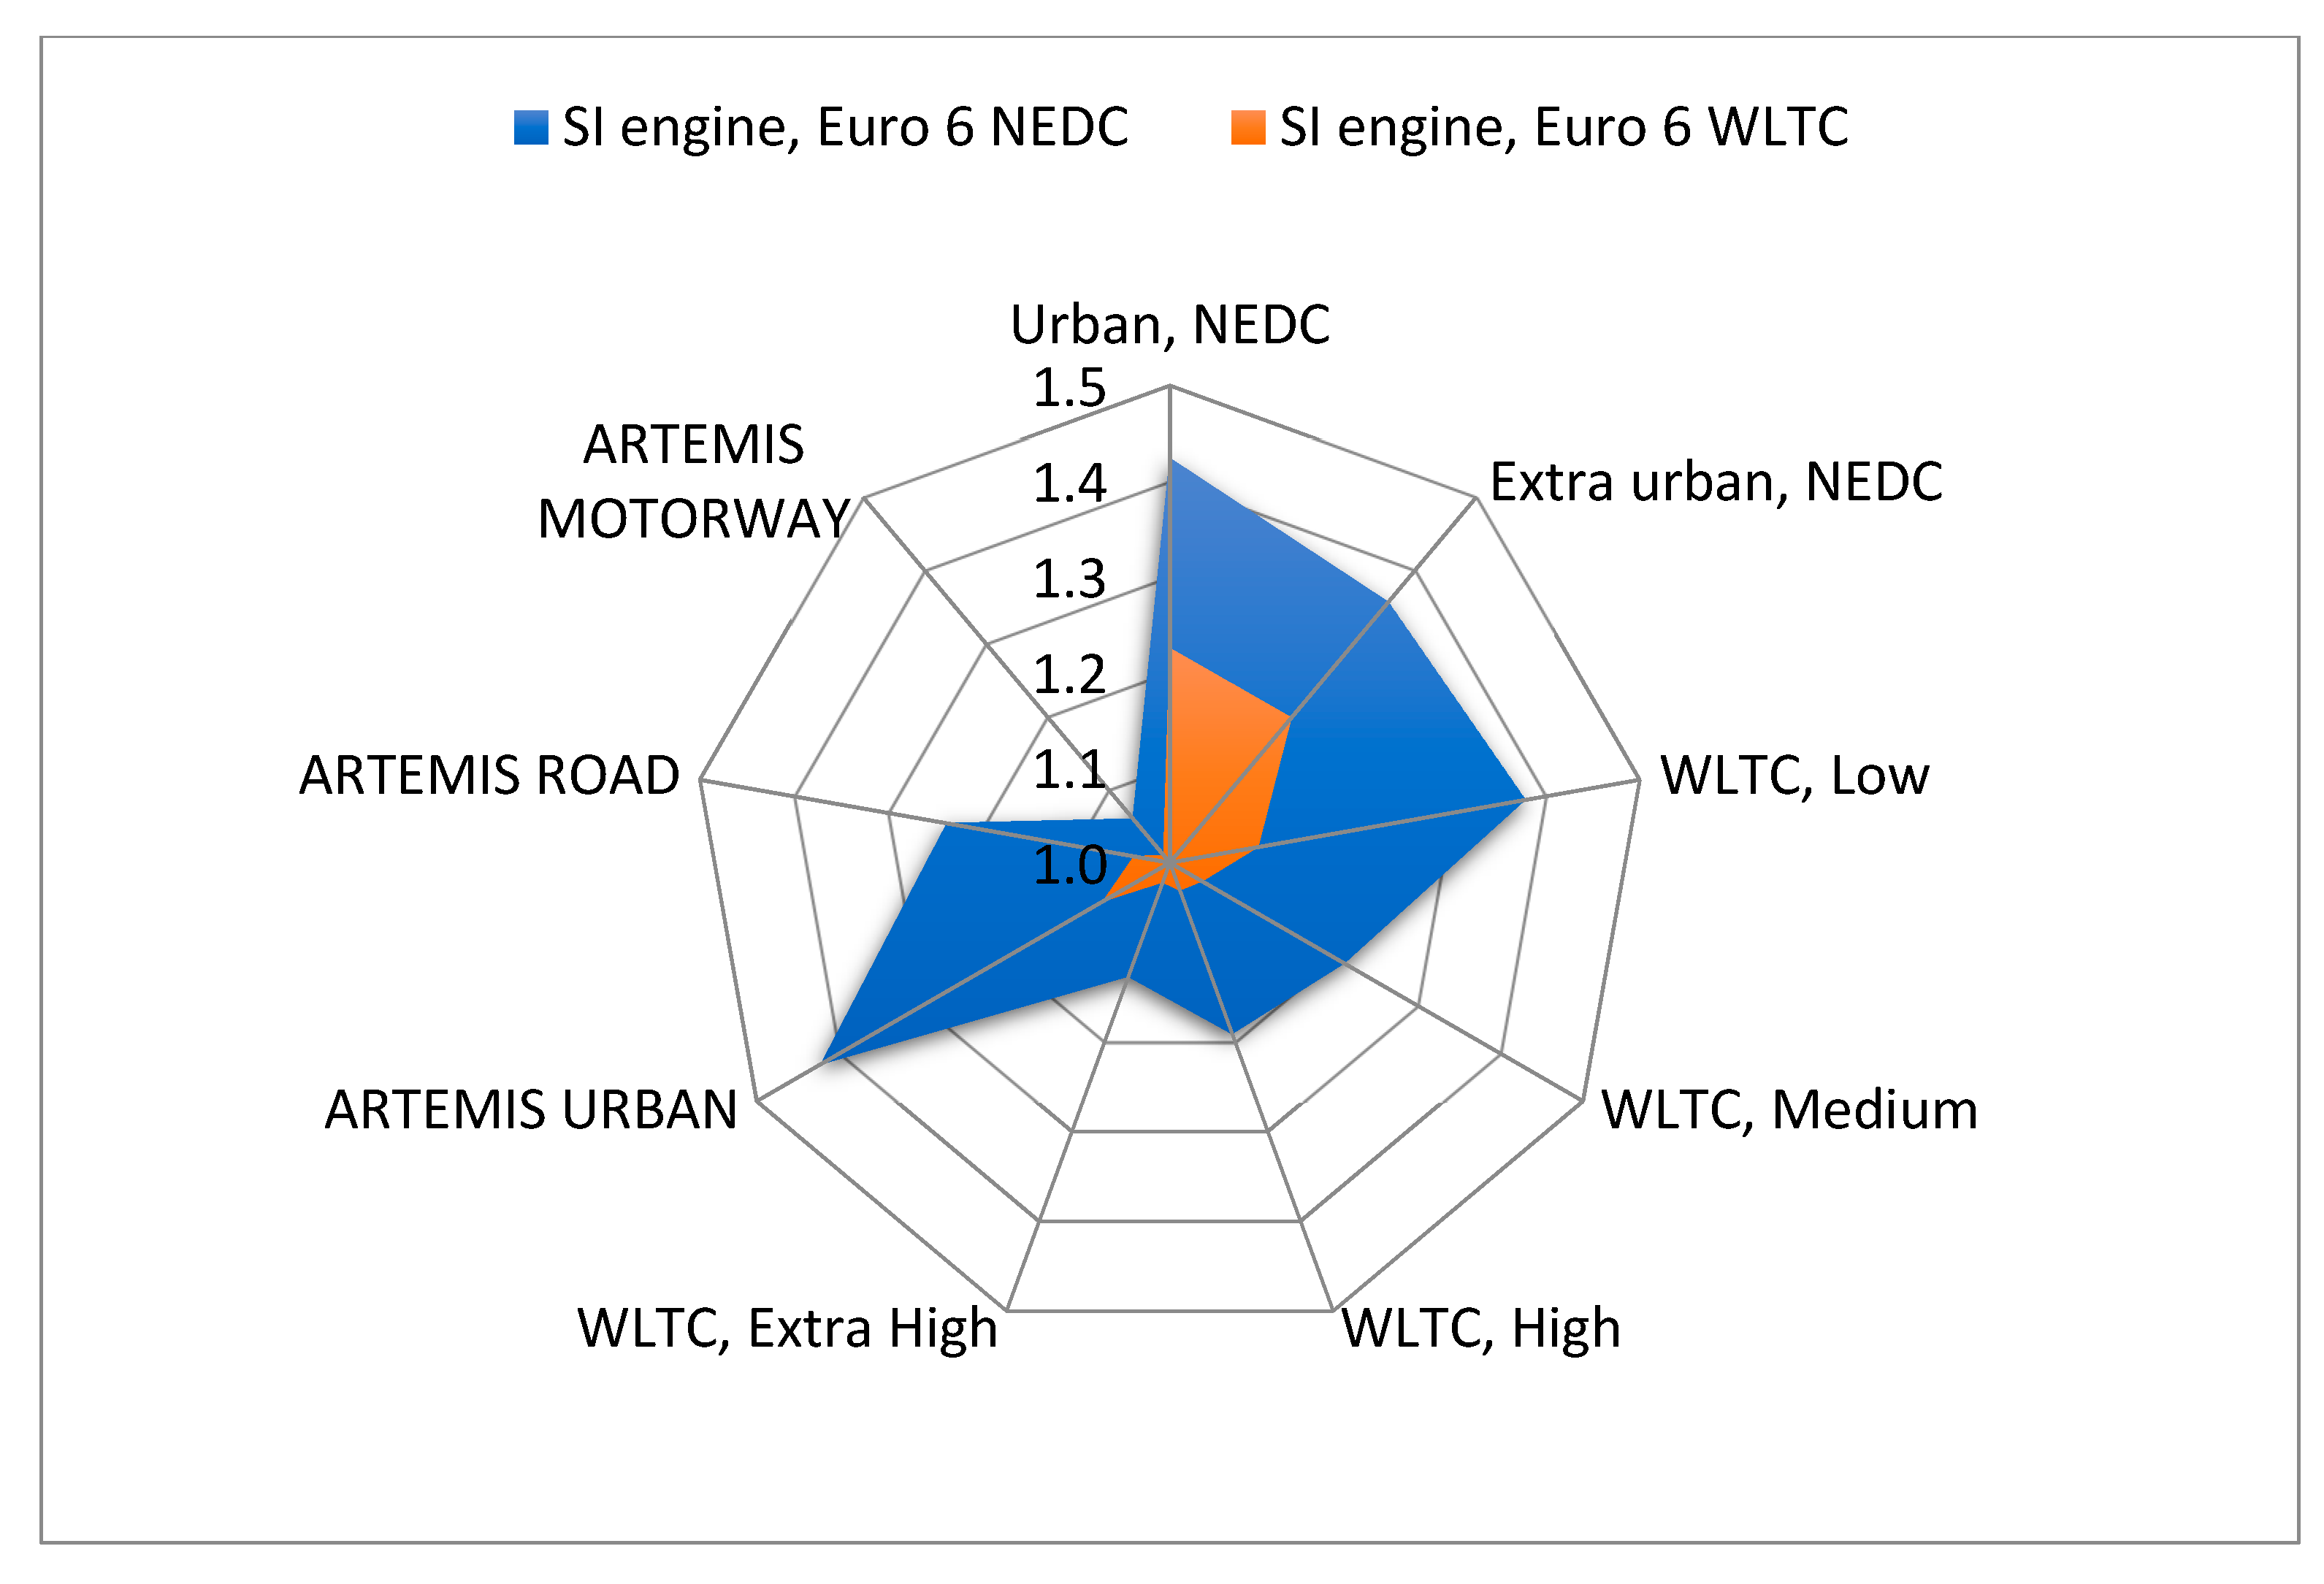
Figure 10 provides a comparison of the median of the λ in respective phases of NEDC, WLTC and ARTEMIS driving cycles for two vehicles with a spark-ignition engine that have approvals confirming the fulfilment of Euro 6 NEDC and Euro 6 WLTP requirements. For each phase of the WLTC cycles and the URBAN and ROAD phases of the ARTEMIS cycle, the median values of the Euro 6 NEDC vehicle are higher than the corresponding values of the Euro 6 WLTP vehicle. The median of the λ is with the ranges of 1.191–1.422 and 1.022–1.094, respectively. However, for the MOTORWAY phase of the ARTEMIS cycle, the air-fuel ratio was close to the stoichiometric composition and amounted to 1.060 for the Euro 6 NEDC car and 1.010 for the Euro 6 WLTP vehicle.
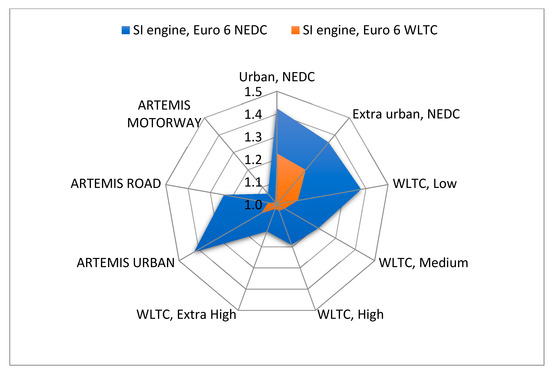
Figure 10.
Comparison of the median of the λ in driving cycles for vehicles equipped with a spark ignition engine conforming to exhaust emissions Euro 6 requirements, approved according to NEDC and the new WLTP procedure.
3.2. Dilution Ratio DR
For the purposes of the described research, the real exhaust gas dilution factors DR for each phase of the driving cycles were calculated according to the Formula (19). The CCO2,CVS, CCO2,exh and CCO2,dil values were calculated as the average of the recorded instantaneous values of CO2 concentrations in the diluted exhaust gas, the raw exhaust gas and the dilution air. They were compared with the values of the DF dilution factor calculated according to Equation (3). The results are shown in Table 4, Table 5 and Table 6. In these tables also are presented the calculated relative percentage difference of the DF dilution factor to the DR dilution ratio according to Equation (20):
Table 4.
Dilution ratio (DR) and dilution factor (DF) in each phase of NEDC, WLTC and ARTEMIS driving cycles for vehicle with SI engine, Euro 6 NEDC.
Table 5.
Dilution ratio (DR) and dilution factor (DF) in each phase of NEDC, WLTC and ARTEMIS driving cycles for vehicle with SI engine, Euro 6 WLTP.
Table 6.
Dilution ratio (DR) and dilution factor (DF) in each phase of NEDC, WLTC and ARTEMIS driving cycles for vehicle with CI engine, Euro 5.
3.3. The Concentration of the Pollutant in the Diluted Exhaust Gas, Corrected for Its Content in the Dilution Air CCVS,corr
To calculate the mass emissions of the pollutant, the concentration of the pollutant in the diluted exhaust gas corrected for its content in the dilution air, needs to be known. It is defined by Equation (21).
According to the regulations [1,2,22], the dilution factor DF (2) is used instead of the DR (1). In this case, the CCVS,corr concentration of the pollutant, is determined by the formula (5).
For each test vehicle, the CCVS,corr concentration of the pollutant, was calculated according to Equations (5) and (21). The results are presented in the Table A1, Table A2, Table A3, Table A4, Table A5, Table A6, Table A7, Table A8, Table A9, Table A10, Table A11, Table A12, Table A13, Table A14 and Table A15 (Appendix A). In these tables are shown the relative percentage difference in determining the CCVS,corr concentration of the pollutant as calculated from dilution ratio DR (19) and dilution factor DF (3).
4. Discussion
The median of the λ in each phase of the WLTC, NEDC and ARTEMIS cycles is greater than 1.5 and within the range of 1.532–3.307. This result is consistent with the principle of operation of these engines.
The median of the λ in each phase of the WLTC and ARTEMIS cycles for the Euro 6 WLTP vehicle with SI engine are similar to the value corresponding to the stoichiometric composition. That is due to the need for vehicles to meet the requirements regarding emissions of the exhaust system in the driving cycle, which covers a larger engine operating area than the NEDC cycle (Figure 2, Figure 3 and Figure 4), and also to introduce RDE (real driving emission) tests into the approval procedure. It has forced vehicle manufacturers to increase the engine’s operating areas, where it works with an air-fuel mixture close to the stoichiometric composition, which has a positive effect on the efficiency of the exhaust after-treatment systems of vehicles with spark-ignition engines. In these vehicles, three-way catalytic converters are most commonly used, which achieve a reduction efficiency of not less than 98% in the λ within the range of 0.997–1.003 [23,24,25].
In the NEDC cycle, the median of the λ is higher than one. This maybe for two reasons. First, in the engine operating areas in the NEDC cycle, the main criterion for optimizing the controller could be to reduce fuel consumption, which is achieved by depleting the air-fuel mixture. Second, the NEDC cycle has more engine braking phases of longer duration than the WLTC and ARTEMIS cycles. The fuel supply is cut off during engine braking. Therefore, in this phase, the actual concentration of CO2 in the exhaust gas is 0. Due to the response time of the analyzer, the concentration measured by the analyzer decreases more slowly than the concentration in the exhaust gas. The longer the engine braking phase lasts, the closer the CO2 concentration shown by the analyzer is to 0. This increases the λ calculated from the Equation (7).
For each phase of the WLTC cycles and the URBAN and ROAD phases of the ARTEMIS cycle, the median values of the Euro 6 NEDC vehicle are higher than the corresponding values of the Euro 6 WLTP vehicle. The reason for this probably is because, in the engine operating areas that do not occur in the NEDC cycle, the main criterion for optimizing the engine controller was to reduce fuel consumption, which is achieved by depleting the air-fuel mixture.
The assumption of the stoichiometric composition of the air-fuel ratio is not always met. This introduces an error in the calculation of the exhaust dilution factor DF. For a vehicle with a CI engine, the percentage relative error of the dilution factor DF in relation to the dilution ratio DR ranged from 28% to 167% (Table 6). For this reason, there is an error in determining the CCVS,corr concentration of the pollutant, calculated on the basis of Equation (5).
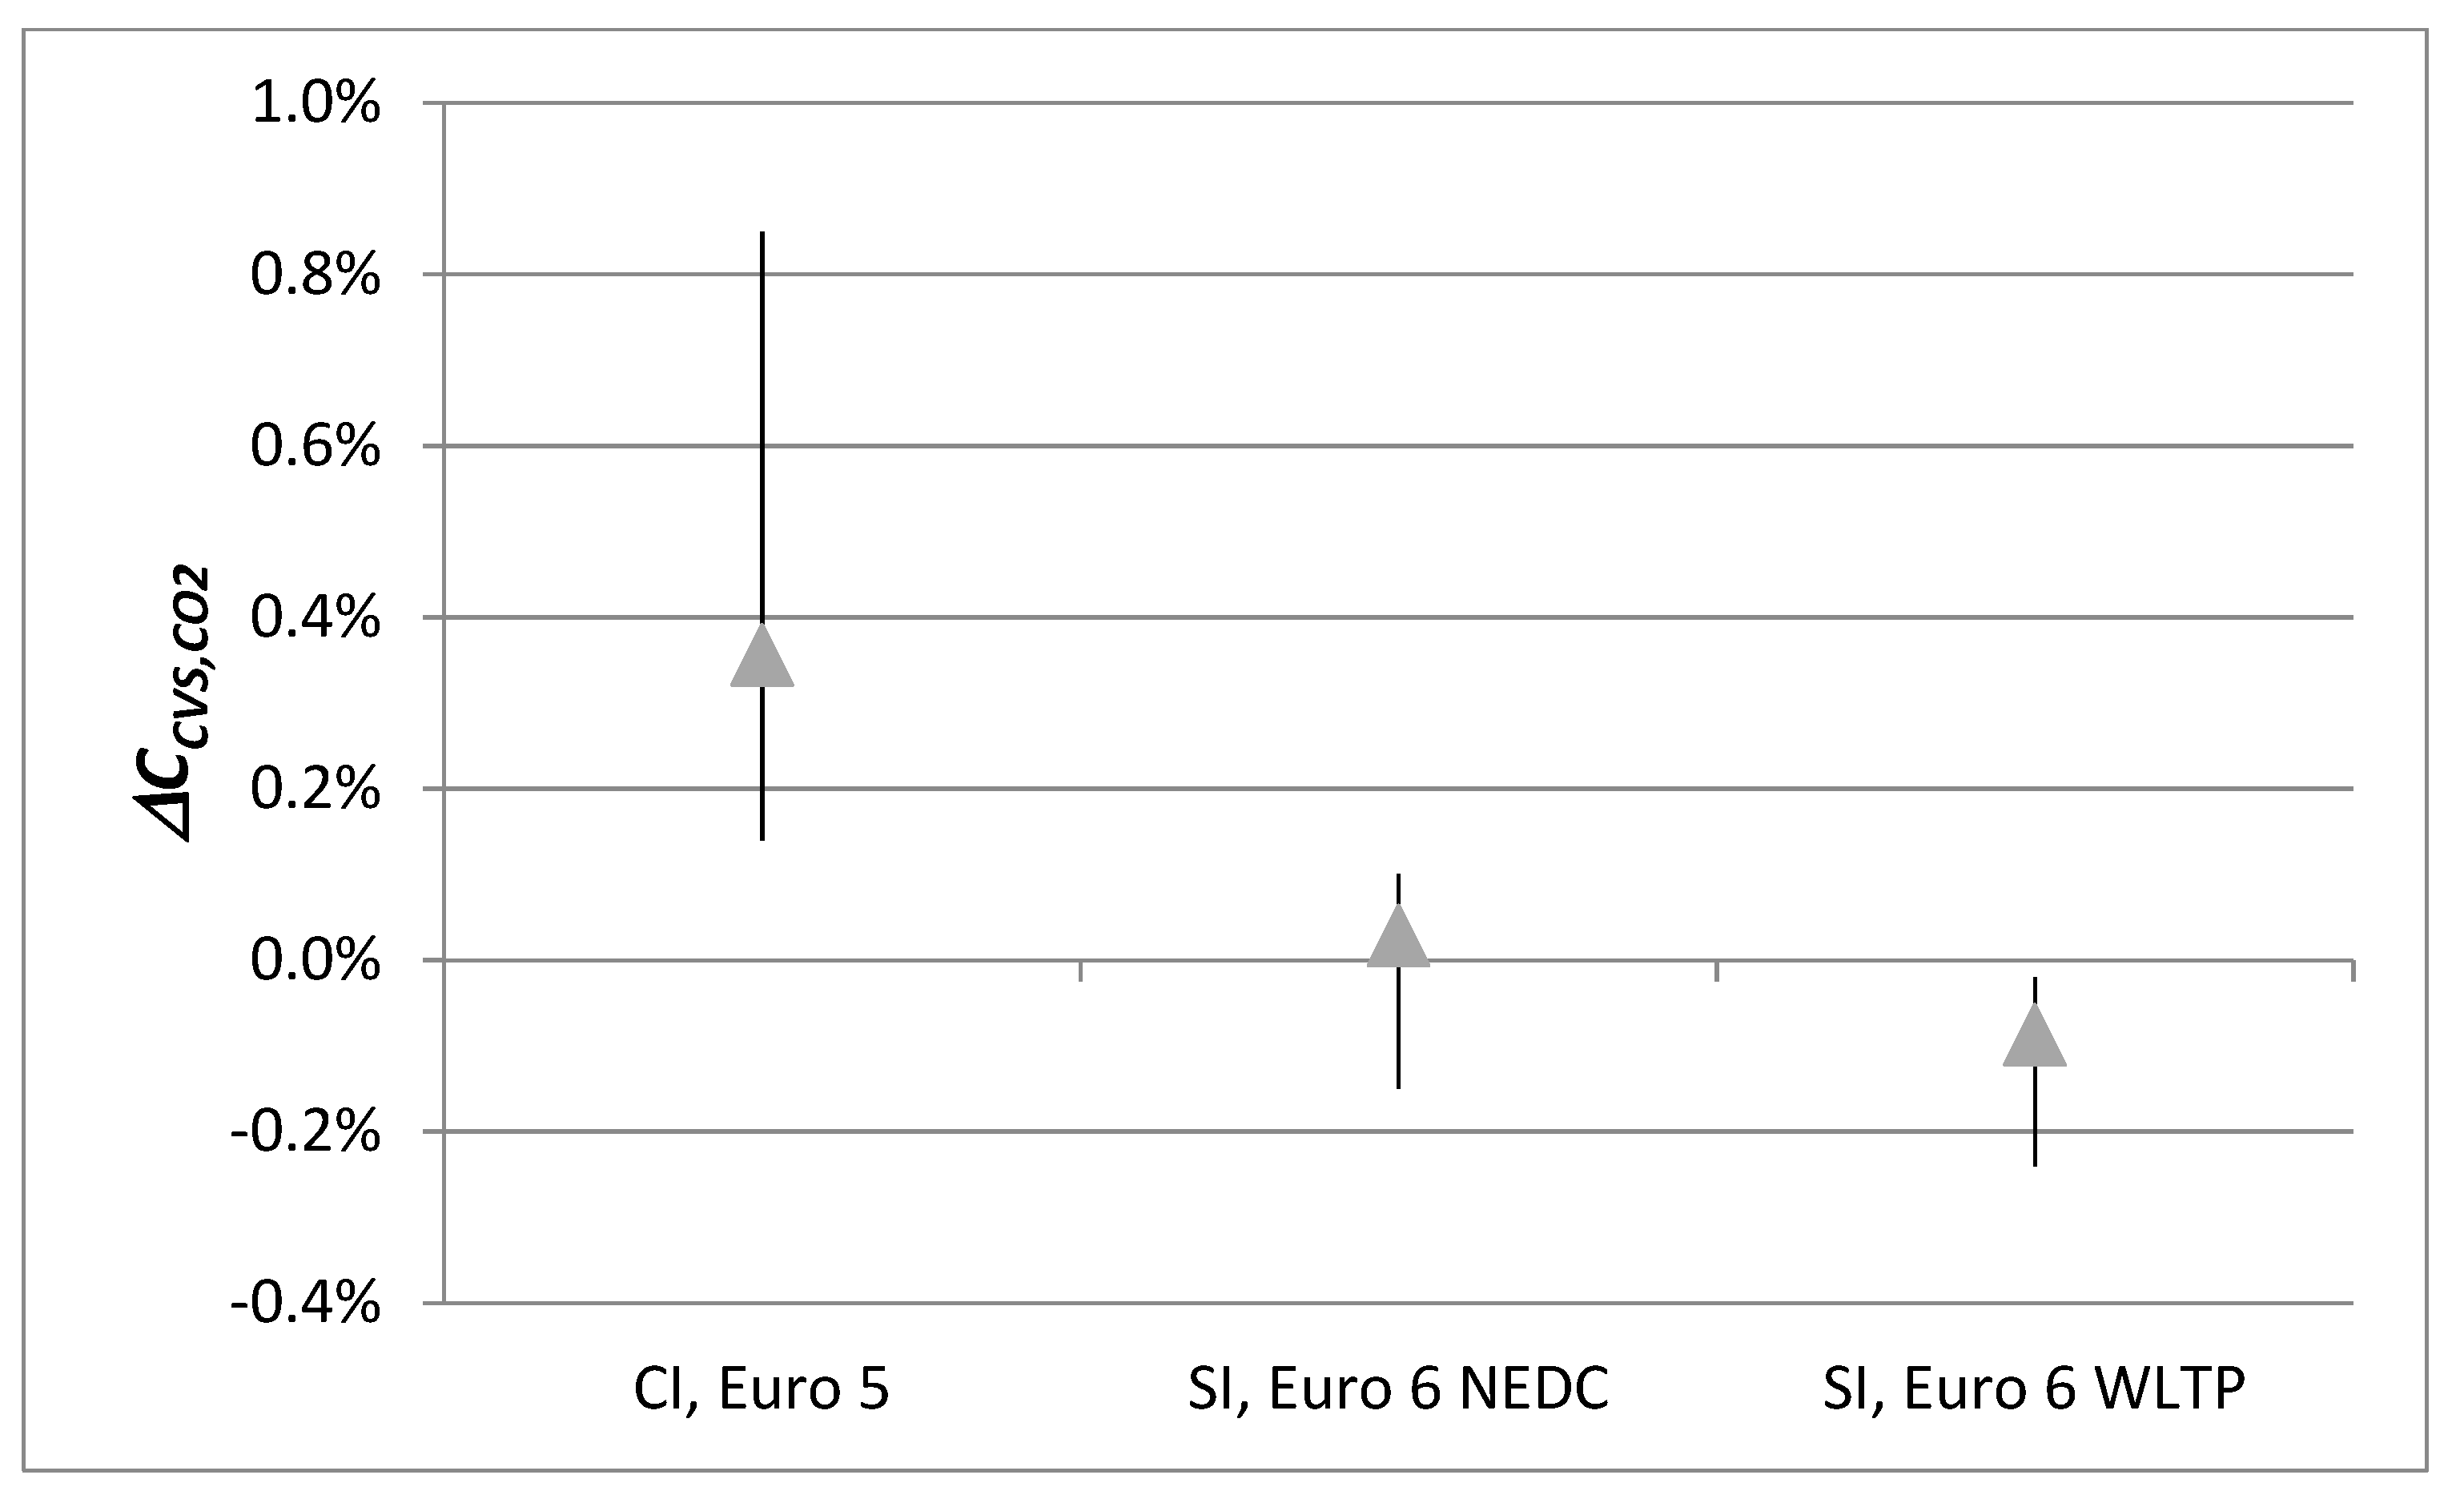
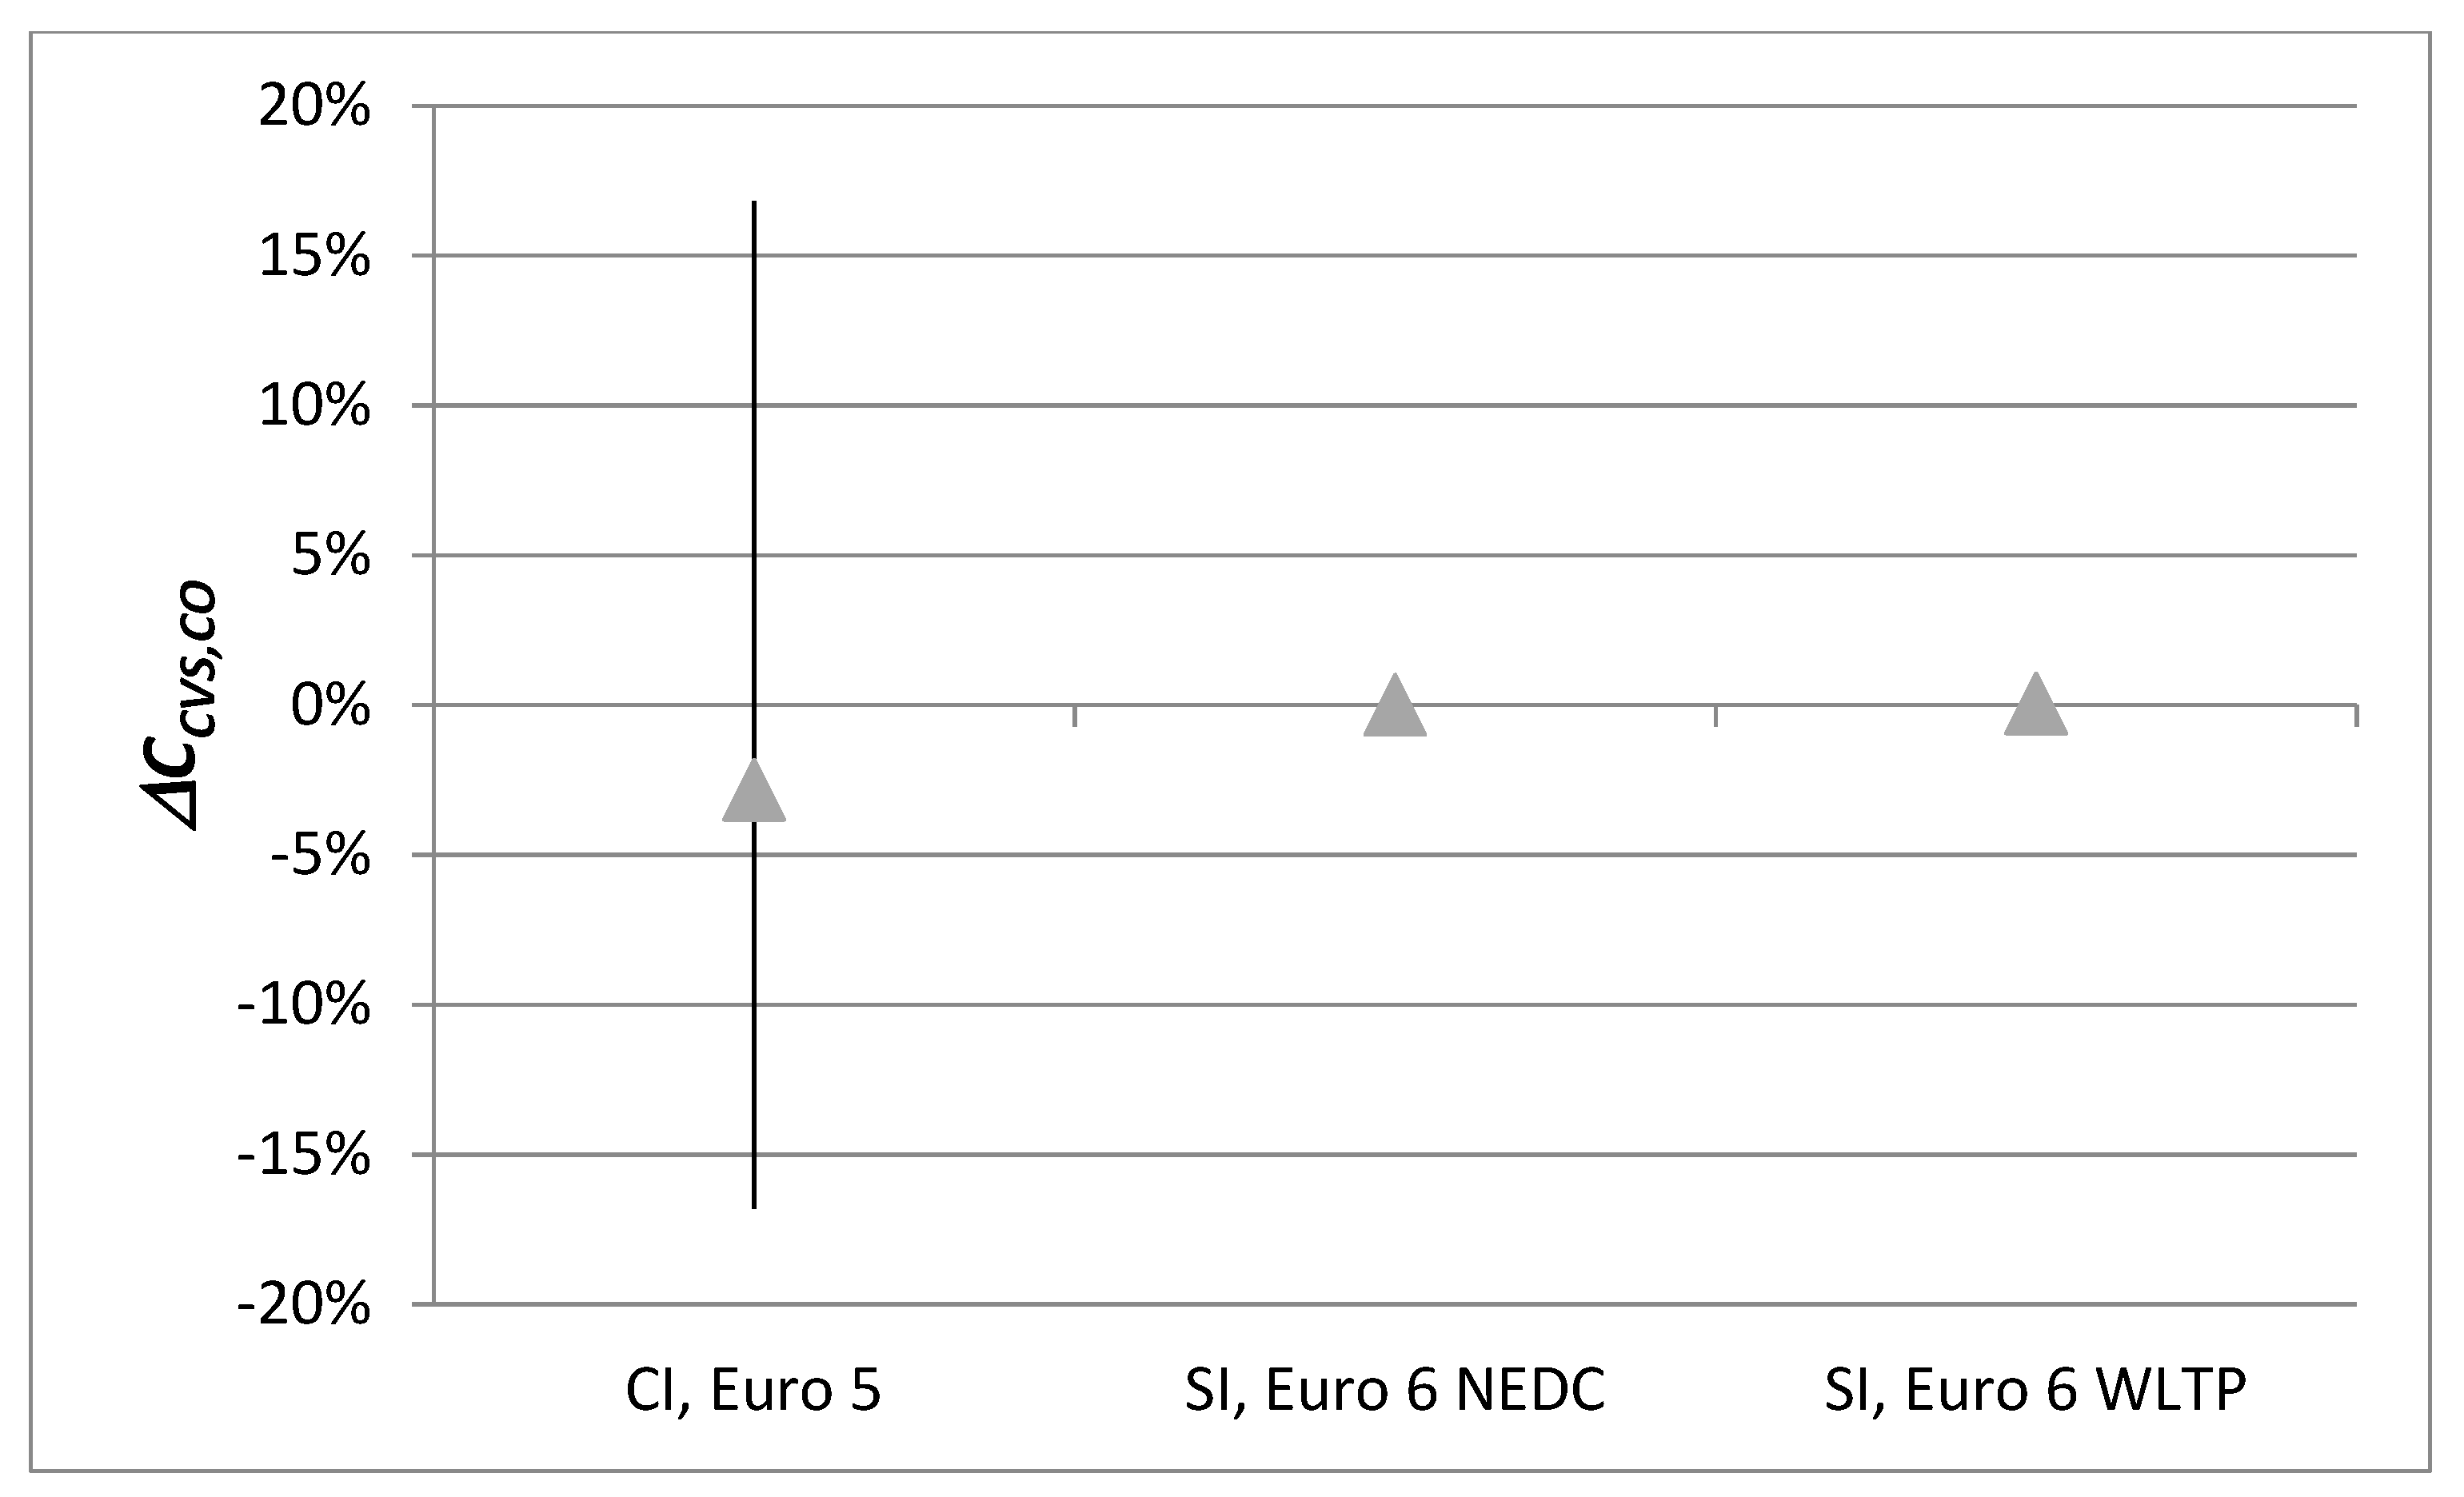
Figure 11, Figure 12, Figure 13 and Figure 14 show the minimum, maximum and average value of relative percentage difference in determining the CCVS,corr concentration of the pollutant as calculated from dilution ratio DR (19) and dilution factor DF (3) for each pollutant.
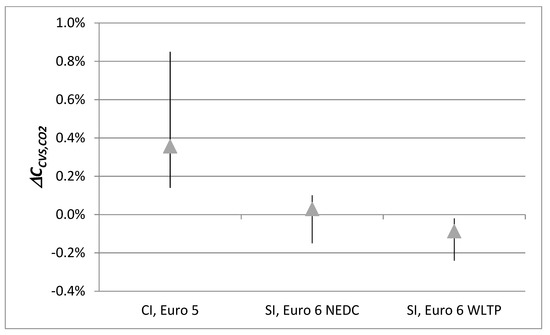
Figure 11.
Relative percentage difference in determining the CCVS,corr concentration of the pollutant as calculated from dilution ratio DR (19) and dilution factor DF (3) for CO2.

Figure 12.
Relative percentage difference in determining the CCVS,corr concentration of the pollutant as calculated from dilution ratio DR (19) and dilution factor DF (3) for CO.
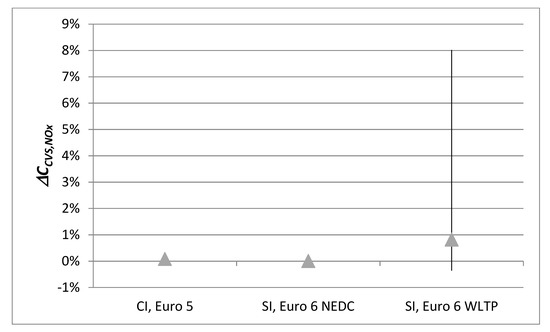
Figure 13.
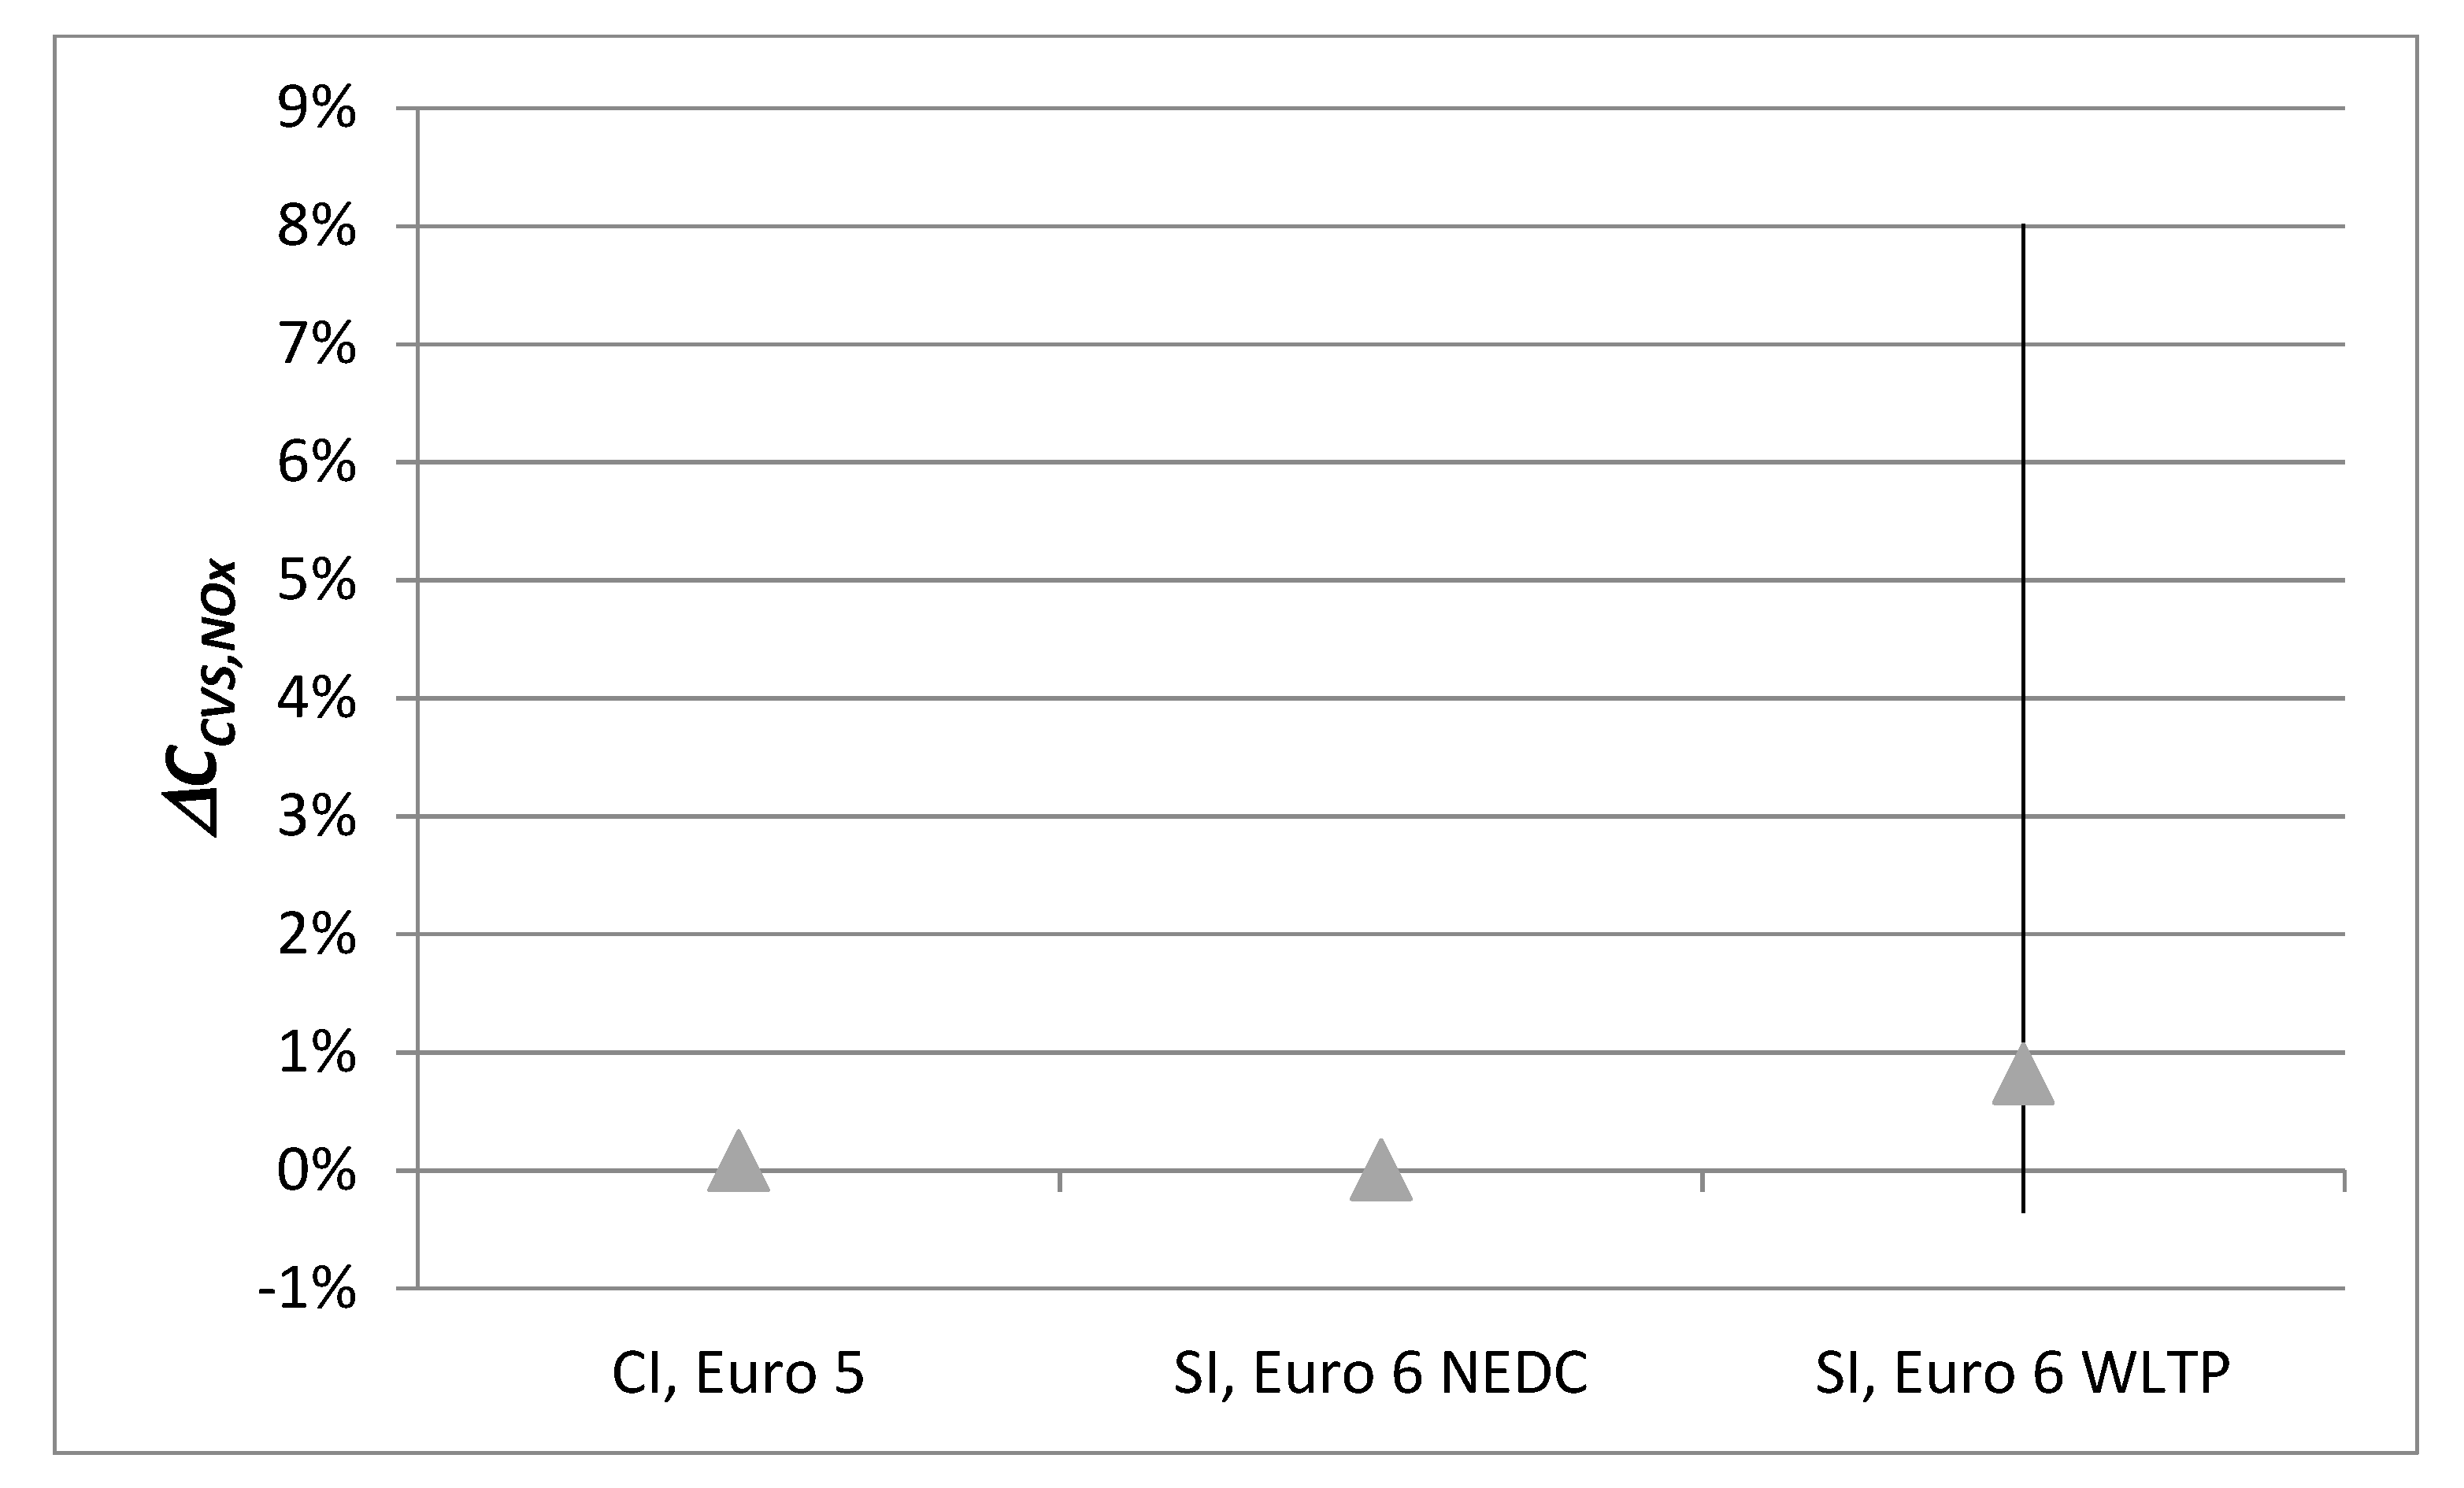
Relative percentage difference in determining the CCVS,corr concentration of the pollutant as calculated from dilution ratio DR (19) and dilution factor DF (3) for NOx.
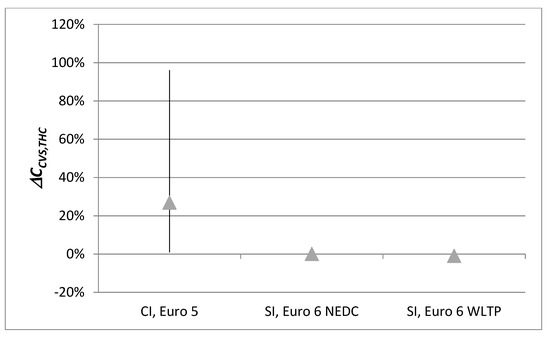
Figure 14.
Relative percentage difference in determining the CCVS,corr concentration of the pollutant as calculated from dilution ratio DR (19) and dilution factor DF (3) for THC.
In the case of CO2, CO and NOx, the average relative percentage difference in determining the CCVS,corr concentration of the pollutant was less than one for all tested cars. The value of this error resulted mainly from the concentration values of these pollutants in the dilution air close to zero. In this case, even a large error in determining the dilution factor DF has a negligible impact on the error in calculating the pollutant emission. For these pollutants, the error in determining the emissions resulting from calculating the dilution factor DF instead of the dilution ratio DR is negligible. The second reason is the large difference between the concentration measured in the diluted exhaust gas and the dilution air. It occurs in most phases of the cycles used in the tests.
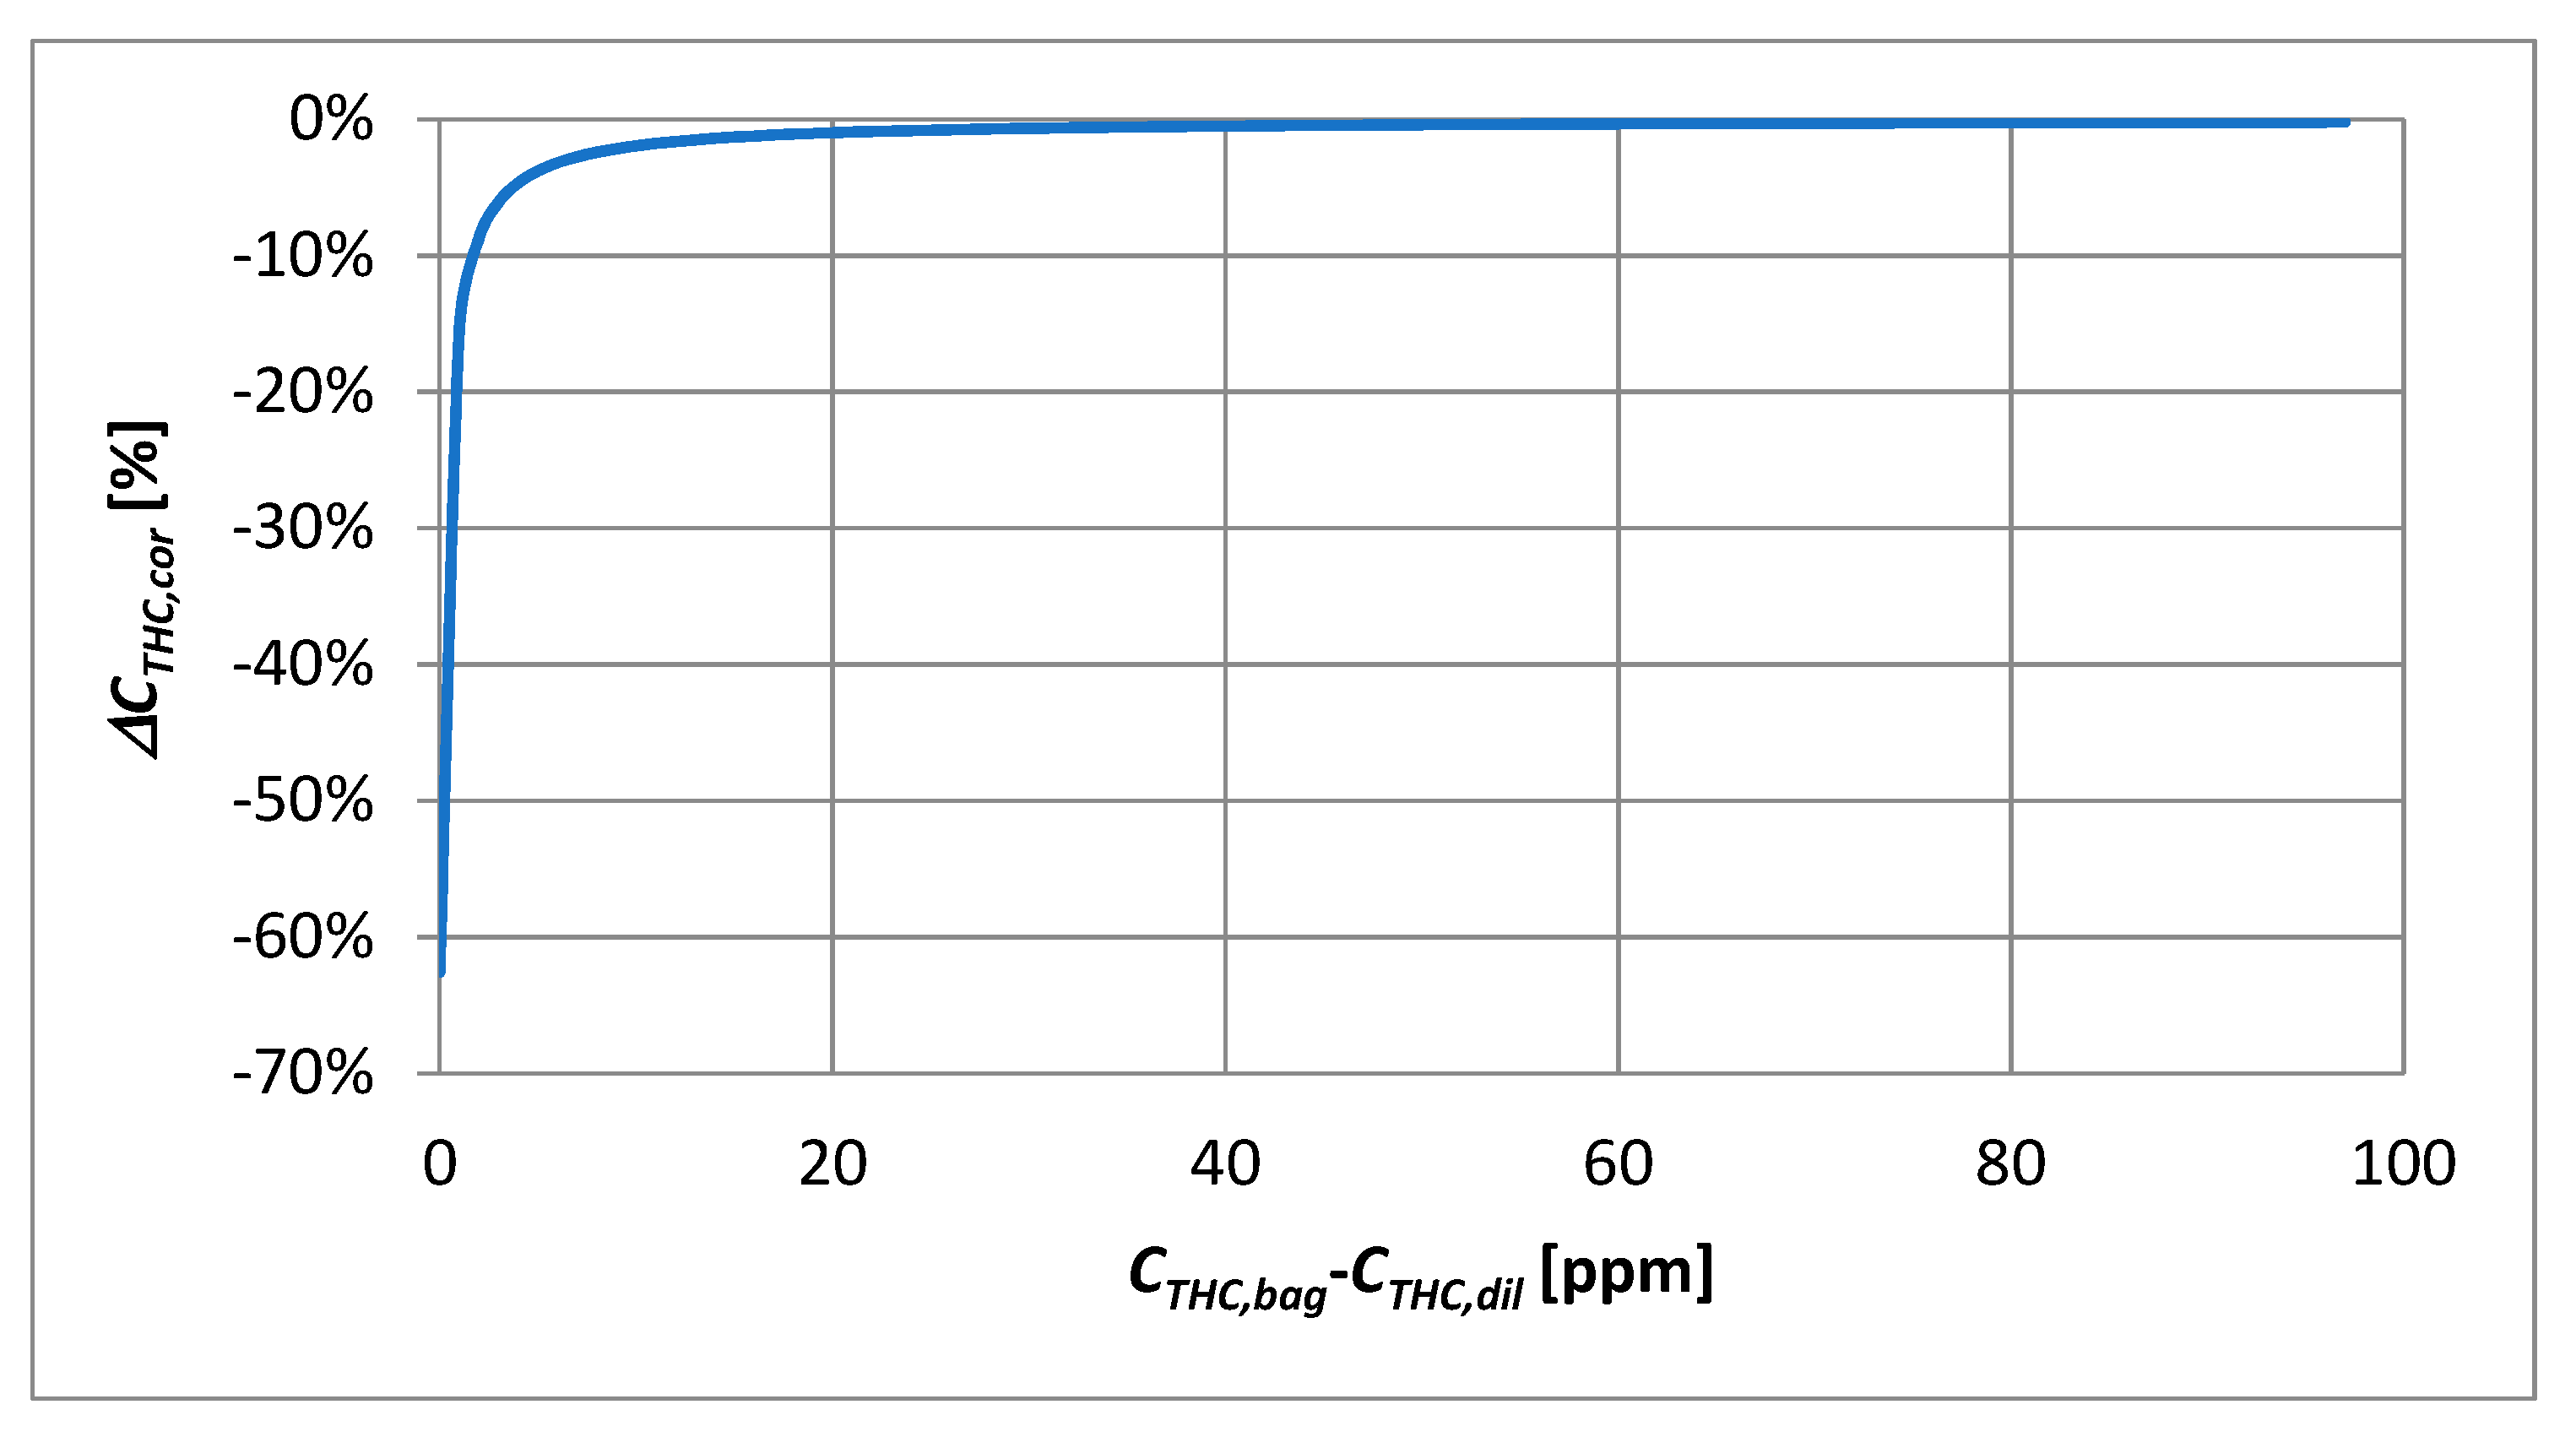
The smaller is the difference between the concentration in the diluted exhaust gas and that in the dilution air, the greater this error is. Figure 15 shows the change in the error in determining the total hydrocarbon (THC) CCVS,corr concentration as a function of the difference between the THC concentration in the diluted exhaust gas and that in the dilution air. The calculations were based on a constant THC concentration in the dilution air equal to 3 ppm expressed equivalent to carbon atoms C1 (typical background value in the MTI laboratory) and DR and DF calculated for a vehicle with a CI engine obtained in the Artemis Urban cycle (Table 6).

Figure 15.
The error of the calculated THC concentration in the diluted exhaust gas, corrected for its content in the dilution air as a function of the difference between the THC concentration in the diluted exhaust gas CTHC,bag and the THC concentration in the dilution air CTHC,dil.
In the case of THC, the relative percentage difference in determining the CCVS,corr concentration of the pollutant for both cars equipped with SI engine is also negligible. The small value of this difference is due to the large difference between the concentration measured in the diluted exhaust gas and the dilution air.
In the case of THC for a car with a CI engine, the relative percentage difference in determining the CCVS,corr concentration of the pollutant ranges from 0.86% to 96.08%, and its average value is 27%. Only for the Urban phase of the NEDC cycle and the Low phase of the WLTC cycle, the value of this error is approximately 1%. In the case of this pollutant, the main reason for the high value of this error is the very little difference in between the concentration in the diluted exhaust gas and that in the dilution air.
Note the CO concentrations in the diluted exhaust gas and dilution air for a diesel car as measured by the NEDC, ARTEMIS Motorway and High phase of the WLTC. In these cycles, the concentration of CO in the diluted exhaust gas is less than that in the dilution air. This is due to the assumption that the intake air does not contain any contaminants (which is not true). In such cases as described above, the exhaust after-treatment systems also remove contaminants that are in the intake air. Therefore, the concentration in the diluted exhaust gas can be less than the concentration in the dilution air.
5. Conclusions
Vehicles with compression ignition engines operate with an air-fuel ratio significantly greater than unity. In the tested car with a compression ignition engine, the median of the λ in most driving cycles was in the range of 1.532–3.307, only in the medium phase of the WLTC cycle was lower and equal to 1.230. Also, the vehicle with a spark-ignition engine, with an approval confirming the fulfilment of Euro 6 NEDC requirements, was powered by an air-fuel mixture with a λ greater than unity. For these vehicles, the assumption of the stoichiometric composition of the air-fuel mixture, which was adopted in determining the formula for calculating the DF dilution factor of exhaust gases, is not met. This may lead to a systematic error in the calculated value of emissions from the exhaust system, which cannot be ignored in the emission levels measured for modern vehicles.
In 2017, the new World Light Duty Procedure (WLTP) was introduced for the approval of light-duty vehicles in terms of emissions, which put particular emphasis on reproducing the real-driving conditions of the car. This applies both to the course of speed over time and to the reproduction on the chassis dynamometer of driving resistances of a vehicle on the road. Because of the above, the engines of vehicles tested according to the WLTP procedure operate in a much wider engine operating area than in the previous procedure where the NEDC cycle was in force. This leads to the need to increase the engine operating area, where the main optimization criterion is to maintain the high efficiency of the after-treatment systems. For vehicles with spark-ignition engines where three-way catalytic converters are most commonly used, this is achieved by supplying the engine with an air-fuel mixture similar to that of stoichiometric composition. It can be assumed that in these vehicles the systematic error in determining the dilution factor and the calculation of emissions, resulting from the adopted assumption of the stoichiometric composition of the air-fuel mixture in the engine will be negligible.
In order to minimize the error in determining the concentration of the pollutant in the diluted exhaust gas corrected for its content in the dilution air, it is necessary to adjust the exhaust gas sampling system to obtain the lowest possible dilution of the exhaust gas while avoiding condensation of water vapor contained in the exhaust gas. It is advantageous to use exhaust gas sampling systems that reduce the influence of this error on the result of the emission measurement: DAR-CVS, PAS-CVS, Heated CVS. If the expected concentration of a pollutant in the diluted exhaust gas is close to that of that pollutant in the dilution air, it is recommended to use the direct determination of the dilution ratio DR instead of the dilution factor DF calculated from Formula (3).
Author Contributions
Conceptualization, S.T. and W.G.; methodology, S.T.; software, S.T. and W.G.; validation, S.T. and W.G.; formal analysis, S.T.; investigation, S.T. and W.G.; resources, S.T. and W.G.; data curation, S.T. and W.G.; writing—original draft preparation, S.T. and W.G.; writing—review and editing, W.G.; visualization, S.T. and W.G.; supervision, S.T.; project administration, S.T.; funding acquisition, S.T. and W.G. All authors have read and agreed to the published version of the manuscript.
Funding
This research received no external funding.
Institutional Review Board Statement
Not applicable.
Informed Consent Statement
Not applicable.
Data Availability Statement
Not applicable.
Conflicts of Interest
The authors declare no conflict of interest.
Nomenclature
| [CO] | carbon oxide concentration in exhaust gas [% vol.]; |
| [CO2] | carbon dioxide concentration in exhaust gas [% vol.]; |
| [NO] | nitrogen oxides concentration in exhaust gas [% vol.]; |
| [O2] | oxygen concentration in exhaust gas [% vol.]; |
| [THC] | total hydrocarbons concentration in exhaust gas [% vol.]; |
| a | concentration of carbon dioxide in undiluted, wet exhaust gas, determined with the assumption that the combustion is complete and perfect and the air-fuel mixture has a stoichiometric composition [% vol.]; |
| ARTEMIS | Assessment and Reliability of Transport Emission Models and Inventory Systems; |
| llutant concentration of the diluted exhaust gas, corrected for its content in the dilution air, calculated on the basis of the dilution factor DF [ppm or % vol.]; | |
| pollutant concentration of the diluted exhaust gas, corrected for its content in the dilution air, calculated on the basis of the dilution ratio DR [ppm or % vol.]; | |
| CCO,CVS | measured concentration of carbon monoxide in the diluted exhaust gas [ppm]; |
| CCO2,CVS | measured concentration of carbon dioxide in the diluted exhaust gas [% vol.]; |
| CCO2,dil | measured concentration of carbon dioxide in the dilution air [% vol.]; |
| CCO2,exh | measured concentration of carbon dioxide in the exhaust gas [% vol.]; |
| CTHC,bag | concentration of total hydrocarbon in the diluted exhaust gas measured in sample bag [ppm]; |
| CTHC,CVS | concentration of total hydrocarbon in the diluted exhaust gas [ppm]; |
| CTHC,dil | concentration of total hydrocarbon in the dilution air measured in dilution bag [ppm]; |
| CTHC,cor | concentration of total hydrocarbon in the diluted exhaust gas, corrected for its content in the dilution air, calculated on the basis of the Equation (8) [ppm]; |
| CCVS | concentration of the pollutant measured in the diluted exhaust gas collected in the dilution bag [ppm or % vol.]; |
| CCVS,corr | concentration of the pollutant in the diluted exhaust gas corrected for its content in the dilution air [ppm or % vol.]; |
| Cdil | concentration of the pollutant measured in the dilution air collected in the dilution bag [ppm or % vol.]; |
| CFR | Code of Federal Regulations; |
| CI | compression ignition; |
| CVS | Constant Volume Sampling; |
| DAR-CVS | Dilution air Refinement Constant Volume Sampling; |
| ΔDF | relative percentage difference of the DF dilution factor to the DR dilution ratio; |
| DF | dilution factor [-]; |
| DOC | Diesel Oxidation Catalyst; |
| DPF | diesel particle filter; |
| DR | dilution ratio [-]; |
| GDI | gasoline direct injection; |
| GI | gasoline injection; |
| λ | the ratio of the actual air/fuel ratio to stoichiometric [-]; |
| MTI | Motor Transport Institute; |
| NEDC | New European Driving Cycle; |
| HCV | number of hydrogen atoms to number of carbon atoms in a fuel molecule CxHyOz [-]; |
| OCV | number of oxygen atoms to number of carbon atoms in a fuel molecule CxHyOz [-]; |
| PAS-CVS | Proportional Ambient Sampling Constant Volume Sampling; |
| PEMS | Portable Emission Measurement System; |
| SI | spark ignition; |
| TWC | Three Way Catalyst; |
| VCVS | diluted exhaust volume [m3]; |
| Vdil | dilution air volume [m3]; |
| Vexh | exhaust volume [m3]; |
| WLTC | World harmonized Light-duty Test Cycle; |
| WLTP | World harmonized Light-duty Test Procedure; |
| X | number of carbon atoms in the fuel molecule CxHyOz [-]; |
| Y | number of hydrogen atoms in the fuel molecule CxHyOz [-]; |
| Z | number of oxygen atoms in the fuel molecule CxHyOz [-]. |
Appendix A
Relative percentage difference in determining the concentration of the pollutant in the diluted exhaust gas corrected for its content in the dilution air CCVS,corr as calculated from dilution ratio DR (19) and dilution factor DF (3).
Table A1.
The CCVS,corr calculated based on Equations (5) and (21) for Euro 5 vehicle with CI engine, CO2 pollutant [%].
Table A1.
The CCVS,corr calculated based on Equations (5) and (21) for Euro 5 vehicle with CI engine, CO2 pollutant [%].
| Cycle | CCVS | Cdil | DR | DF | ΔCCVS | ||
|---|---|---|---|---|---|---|---|
| Urban NEDC | 0.695 | 0.047 | 10.94 | 0.652 | 19.42 | 0.650 | 0.29% |
| Extra-urban NEDC | 1.034 | 0.053 | 8.17 | 0.987 | 13.05 | 0.985 | 0.25% |
| WLTC, Low | 0.632 | 0.051 | 12.18 | 0.585 | 21.27 | 0.583 | 0.31% |
| WLTC, Medium | 1.323 | 0.062 | 7.94 | 1.269 | 10.19 | 1.267 | 0.14% |
| WLTC, High | 0.964 | 0.087 | 9.26 | 0.886 | 13.99 | 0.883 | 0.36% |
| WLTC Extra High | 1.244 | 0.105 | 6.82 | 1.154 | 10.84 | 1.149 | 0.50% |
| ARTEMIS URBAN | 0.544 | 0.061 | 9.28 | 0.490 | 24.79 | 0.485 | 0.85% |
| ARTEMIS ROAD | 0.949 | 0.058 | 8.70 | 0.898 | 14.22 | 0.895 | 0.29% |
| ARTEMIS MOTORWAY | 1.911 | 0.075 | 5.12 | 1.851 | 7.06 | 1.847 | 0.22% |
Table A2.
The CCVS,corr calculated based on Equations (5) and (21) for Euro 5 vehicle with CI engine, CO concentration [ppm].
Table A2.
The CCVS,corr calculated based on Equations (5) and (21) for Euro 5 vehicle with CI engine, CO concentration [ppm].
| Cycle | CCVS | Cdil | DR | DF | ΔCCVS | ||
|---|---|---|---|---|---|---|---|
| Urban NEDC | 0.104 | 0.243 | 10.94 | −0.117 | 19.42 | −0.126 | −7.67% |
| Extra-urban NEDC | 0.053 | 0.271 | 8.17 | −0.185 | 13.05 | −0.197 | −6.29% |
| WLTC, Low | 17.638 | 0.625 | 12.18 | 17.064 | 21.27 | 17.042 | 0.13% |
| WLTC, Medium | 3.511 | 0.672 | 7.94 | 2.924 | 10.19 | 2.905 | 0.64% |
| WLTC, High | 0.423 | 0.640 | 9.26 | −0.148 | 13.99 | −0.171 | −13.65% |
| WLTC Extra High | 0.309 | 0.529 | 6.82 | −0.142 | 10.84 | −0.171 | −16.80% |
| ARTEMIS URBAN | 0.234 | 0.172 | 9.28 | 0.081 | 24.79 | 0.069 | 16.82% |
| ARTEMIS ROAD | 1.150 | −0.402 | 8.70 | 1.506 | 14.22 | 1.524 | −1.18% |
| ARTEMIS MOTORWAY | −0.528 | −0.172 | 5.12 | −0.390 | 7.06 | −0.380 | 2.43% |
Table A3.
The CCVS,corr calculated based on Equations (5) and (21) for Euro 5 vehicle with CI engine, NOx concentration [ppm].
Table A3.
The CCVS,corr calculated based on Equations (5) and (21) for Euro 5 vehicle with CI engine, NOx concentration [ppm].
| Cycle | CCVS | Cdil | DR | DF | ΔCCVS | ||
|---|---|---|---|---|---|---|---|
| Urban NEDC | 6.265 | 0.082 | 10.94 | 6.190 | 19.42 | 6.187 | 0.05% |
| Extra-urban NEDC | 16.476 | 0.182 | 8.17 | 16.316 | 13.05 | 16.308 | 0.05% |
| WLTC, Low | 6.678 | 0.097 | 12.18 | 6.589 | 21.27 | 6.586 | 0.05% |
| WLTC, Medium | 20.761 | 0.237 | 7.94 | 20.554 | 10.19 | 20.547 | 0.03% |
| WLTC, High | 17.042 | 0.615 | 9.26 | 16.493 | 13.99 | 16.471 | 0.14% |
| WLTC Extra High | 37.803 | 1.000 | 6.82 | 36.950 | 10.84 | 36.895 | 0.15% |
| ARTEMIS URBAN | 22.470 | 0.554 | 9.28 | 21.976 | 24.79 | 21.938 | 0.17% |
| ARTEMIS ROAD | 34.035 | 0.511 | 8.70 | 33.583 | 14.22 | 33.560 | 0.07% |
| ARTEMIS MOTORWAY | 87.032 | 1.021 | 5.12 | 86.210 | 7.06 | 86.156 | 0.06% |
Table A4.
The CCVS,corr calculated based on Equations (5) and (21) for Euro 5 vehicle with CI engine, THC concentration [ppm].
Table A4.
The CCVS,corr calculated based on Equations (5) and (21) for Euro 5 vehicle with CI engine, THC concentration [ppm].
| Cycle | CCVS | Cdil | DR | DF | ΔCCVS | ||
|---|---|---|---|---|---|---|---|
| Urban NEDC | 3.689 | 3.078 | 10.94 | 0.892 | 19.42 | 0.769 | 15.97% |
| Extra-urban NEDC | 3.082 | 3.063 | 8.17 | 0.394 | 13.05 | 0.254 | 55.26% |
| WLTC, Low | 10.603 | 2.951 | 12.18 | 7.894 | 21.27 | 7.791 | 1.33% |
| WLTC, Medium | 12.784 | 3.079 | 7.94 | 10.093 | 10.19 | 10.007 | 0.86% |
| WLTC, High | 8.638 | 3.243 | 9.26 | 5.745 | 13.99 | 5.627 | 2.10% |
| WLTC Extra High | 5.005 | 3.282 | 6.82 | 2.204 | 10.84 | 2.026 | 8.81% |
| ARTEMIS URBAN | 3.649 | 3.064 | 9.28 | 0.915 | 24.79 | 0.709 | 29.15% |
| ARTEMIS ROAD | 3.351 | 3.433 | 8.70 | 0.313 | 14.22 | 0.159 | 96.08% |
| ARTEMIS MOTORWAY | 3.564 | 3.477 | 5.12 | 0.766 | 7.06 | 0.579 | 32.20% |
Table A5.
The CCVS,corr calculated based on Equations (5) and (21) for Euro 5 vehicle with CI engine, CH4 concentration [ppm].
Table A5.
The CCVS,corr calculated based on Equations (5) and (21) for Euro 5 vehicle with CI engine, CH4 concentration [ppm].
| Cycle | CCVS | Cdil | DR | DF | ΔCCVS | ||
|---|---|---|---|---|---|---|---|
| Urban NEDC | 2.459 | 2.064 | 10.94 | 0.584 | 19.42 | 0.501 | 16.43% |
| Extra-urban NEDC | 2.178 | 2.062 | 8.17 | 0.368 | 13.05 | 0.274 | 34.44% |
| WLTC, Low | 4.825 | 1.901 | 12.18 | 3.080 | 21.27 | 3.013 | 2.21% |
| WLTC, Medium | 8.463 | 1.980 | 7.94 | 6.732 | 10.19 | 6.677 | 0.82% |
| WLTC, High | 4.544 | 2.089 | 9.26 | 2.681 | 13.99 | 2.604 | 2.93% |
| WLTC Extra High | 1.920 | 2.087 | 6.82 | 0.139 | 10.84 | 0.026 | 444.55% |
| ARTEMIS URBAN | 2.019 | 1.968 | 9.28 | 0.263 | 24.79 | 0.130 | 101.76% |
| ARTEMIS ROAD | 2.258 | 2.267 | 8.70 | 0.252 | 14.22 | 0.150 | 67.24% |
| ARTEMIS MOTORWAY | 1.797 | 2.239 | 5.12 | −0.005 | 7.06 | −0.125 | −96.24% |
Table A6.
The CCVS,corr calculated based on Equations (5) and (21) for Euro 6 NEDC vehicle with SI engine, CO2 concentration [%].
Table A6.
The CCVS,corr calculated based on Equations (5) and (21) for Euro 6 NEDC vehicle with SI engine, CO2 concentration [%].
| Cycle | CCVS | Cdil | DR | DF | ΔCCVS | ||
|---|---|---|---|---|---|---|---|
| Urban NEDC | 0.621 | 0.048 | 15.37 | 0.576 | 18.89 | 0.576 | 0.10% |
| Extra-urban NEDC | 0.931 | 0.060 | 17.45 | 0.874 | 12.69 | 0.876 | −0.15% |
| WLTC, Low | 0.586 | 0.052 | 18.70 | 0.537 | 22.54 | 0.536 | 0.09% |
| WLTC, Medium | 0.936 | 0.059 | 13.22 | 0.881 | 13.93 | 0.881 | 0.03% |
| WLTC, High | 0.955 | 0.072 | 12.71 | 0.889 | 13.74 | 0.888 | 0.05% |
| WLTC Extra High | 1.494 | 0.084 | 7.89 | 1.421 | 8.44 | 1.420 | 0.05% |
| ARTEMIS URBAN | 0.556 | 0.075 | 22.23 | 0.484 | 23.85 | 0.484 | 0.05% |
| ARTEMIS ROAD | 1.009 | 0.066 | 11.34 | 0.949 | 12.90 | 0.948 | 0.07% |
| ARTEMIS MOTORWAY | 2.812 | 0.093 | 4.71 | 2.739 | 4.50 | 2.740 | −0.03% |
Table A7.
The CCVS,corr calculated based on Equations (5) and (21) for Euro 6 NEDC vehicle with SI engine, CO concentration [ppm].
Table A7.
The CCVS,corr calculated based on Equations (5) and (21) for Euro 6 NEDC vehicle with SI engine, CO concentration [ppm].
| Cycle | CCVS | Cdil | DR | DF | ΔCCVS | ||
|---|---|---|---|---|---|---|---|
| Urban NEDC | 63.335 | 0.828 | 15.37 | 62.561 | 18.89 | 62.551 | 0.02% |
| Extra-urban NEDC | 63.689 | 1.526 | 17.45 | 62.250 | 12.69 | 62.283 | −0.05% |
| WLTC, Low | 63.109 | 3.232 | 18.70 | 60.050 | 22.54 | 60.020 | 0.05% |
| WLTC, Medium | 250.981 | 4.015 | 13.22 | 247.270 | 13.93 | 247.254 | 0.01% |
| WLTC, High | 193.729 | 7.381 | 12.71 | 186.929 | 13.74 | 186.885 | 0.02% |
| WLTC Extra High | 913.930 | 14.400 | 7.89 | 901.355 | 8.44 | 901.236 | 0.01% |
| ARTEMIS URBAN | 56.401 | 2.885 | 22.23 | 53.646 | 23.85 | 53.637 | 0.02% |
| ARTEMIS ROAD | 280.355 | 3.496 | 11.34 | 277.167 | 12.90 | 277.130 | 0.01% |
| ARTEMIS MOTORWAY | 1598.574 | 20.821 | 4.71 | 1582.174 | 4.50 | 1582.380 | −0.01% |
Table A8.
The CCVS,corr calculated based on Equations (5) and (21) for Euro 6 NEDC vehicle with SI engine, NOx concentration [ppm].
Table A8.
The CCVS,corr calculated based on Equations (5) and (21) for Euro 6 NEDC vehicle with SI engine, NOx concentration [ppm].
| Cycle | CCVS | Cdil | DR | DF | ΔCCVS | ||
|---|---|---|---|---|---|---|---|
| Urban NEDC | 3.044 | 0.033 | 15.37 | 3.013 | 18.89 | 3.013 | 0.01% |
| Extra-urban NEDC | 10.098 | 0.091 | 17.45 | 10.012 | 12.69 | 10.014 | −0.02% |
| WLTC, Low | 10.849 | 0.165 | 18.70 | 10.693 | 22.54 | 10.691 | 0.01% |
| WLTC, Medium | 8.631 | 0.292 | 13.22 | 8.361 | 13.93 | 8.360 | 0.01% |
| WLTC, High | 8.423 | 0.419 | 12.71 | 8.037 | 13.74 | 8.034 | 0.03% |
| WLTC Extra High | 20.470 | 0.537 | 7.89 | 20.001 | 8.44 | 19.997 | 0.02% |
| ARTEMIS URBAN | 5.819 | 0.335 | 22.23 | 5.499 | 23.85 | 5.498 | 0.02% |
| ARTEMIS ROAD | 11.652 | 0.347 | 11.34 | 11.336 | 12.90 | 11.332 | 0.03% |
| ARTEMIS MOTORWAY | 42.473 | 0.864 | 4.71 | 41.792 | 4.50 | 41.801 | −0.02% |
Table A9.
The CCVS,corr calculated based on Equations (5) and (21) for Euro 6 NEDC vehicle with SI engine, THC concentration [ppm].
Table A9.
The CCVS,corr calculated based on Equations (5) and (21) for Euro 6 NEDC vehicle with SI engine, THC concentration [ppm].
| Cycle | CCVS | Cdil | DR | DF | ΔCCVS | ||
|---|---|---|---|---|---|---|---|
| Urban NEDC | 24.202 | 3.404 | 15.37 | 21.019 | 18.89 | 20.978 | 0.20% |
| Extra-urban NEDC | 7.074 | 3.558 | 17.45 | 3.720 | 12.69 | 3.796 | −2.01% |
| WLTC, Low | 21.286 | 3.534 | 18.70 | 17.941 | 22.54 | 17.909 | 0.18% |
| WLTC, Medium | 9.213 | 3.593 | 13.22 | 5.892 | 13.93 | 5.878 | 0.24% |
| WLTC, High | 7.345 | 3.632 | 12.71 | 3.999 | 13.74 | 3.977 | 0.54% |
| WLTC Extra High | 22.567 | 3.796 | 7.89 | 19.252 | 8.44 | 19.221 | 0.16% |
| ARTEMIS URBAN | 5.187 | 3.502 | 22.23 | 1.843 | 23.85 | 1.832 | 0.58% |
| ARTEMIS ROAD | 11.680 | 3.574 | 11.34 | 8.421 | 12.90 | 8.383 | 0.45% |
| ARTEMIS MOTORWAY | 36.964 | 4.276 | 4.71 | 33.596 | 4.50 | 33.638 | −0.13% |
Table A10.
The CCVS,corr calculated based on Equations (5) and (21) for Euro 6 NEDC vehicle with SI engine, CH4 concentration [ppm].
Table A10.
The CCVS,corr calculated based on Equations (5) and (21) for Euro 6 NEDC vehicle with SI engine, CH4 concentration [ppm].
| Cycle | CCVS | Cdil | DR | DF | ΔCCVS | ||
|---|---|---|---|---|---|---|---|
| Urban NEDC | 3.356 | 2.015 | 15.37 | 1.472 | 18.89 | 1.448 | 1.69% |
| Extra-urban NEDC | 2.695 | 2.046 | 17.45 | 0.766 | 12.69 | 0.810 | −5.43% |
| WLTC, Low | 2.934 | 1.965 | 18.70 | 1.074 | 22.54 | 1.056 | 1.69% |
| WLTC, Medium | 2.876 | 1.986 | 13.22 | 1.040 | 13.93 | 1.033 | 0.74% |
| WLTC, High | 2.666 | 1.998 | 12.71 | 0.825 | 13.74 | 0.813 | 1.45% |
| WLTC Extra High | 4.719 | 2.016 | 7.89 | 2.959 | 8.44 | 2.942 | 0.57% |
| ARTEMIS URBAN | 2.393 | 2.017 | 22.23 | 0.467 | 23.85 | 0.461 | 1.34% |
| ARTEMIS ROAD | 2.977 | 1.985 | 11.34 | 1.167 | 12.90 | 1.146 | 1.85% |
| ARTEMIS MOTORWAY | 6.579 | 2.027 | 4.71 | 4.982 | 4.50 | 5.002 | −0.40% |
Table A11.
The CCVS,corr calculated based on Equations (5) and (21) for Euro 6 WLTP vehicle with SI engine, CO2 concentration [%].
Table A11.
The CCVS,corr calculated based on Equations (5) and (21) for Euro 6 WLTP vehicle with SI engine, CO2 concentration [%].
| Cycle | CCVS | Cdil | DR | DF | ΔCCVS | ||
|---|---|---|---|---|---|---|---|
| Urban NEDC | 0.563 | 0.046 | 34.43 | 0.518 | 23.68 | 0.519 | −0.12% |
| Extra-urban NEDC | 0.696 | 0.078 | 30.00 | 0.621 | 19.14 | 0.622 | −0.24% |
| WLTC, Low | 0.409 | 0.064 | 34.20 | 0.347 | 32.07 | 0.347 | −0.04% |
| WLTC, Medium | 0.656 | 0.063 | 22.59 | 0.596 | 20.32 | 0.596 | −0.05% |
| WLTC, High | 0.720 | 0.057 | 20.37 | 0.666 | 18.51 | 0.666 | −0.04% |
| WLTC Extra High | 0.973 | 0.064 | 14.17 | 0.914 | 13.55 | 0.914 | −0.02% |
| ARTEMIS URBAN | 0.458 | 0.046 | 31.17 | 0.413 | 29.10 | 0.414 | −0.03% |
| ARTEMIS ROAD | 0.721 | 0.063 | 24.01 | 0.661 | 18.50 | 0.661 | −0.12% |
| ARTEMIS MOTORWAY | 1.889 | 0.098 | 8.32 | 1.803 | 7.04 | 1.805 | −0.12% |
Table A12.
The CCVS,corr calculated based on Equations (5) and (21) for Euro 6 WLTP vehicle with SI engine, CO concentration [ppm].
Table A12.
The CCVS,corr calculated based on Equations (5) and (21) for Euro 6 WLTP vehicle with SI engine, CO concentration [ppm].
| Cycle | CCVS | Cdil | DR | DF | ΔCCVS | ||
|---|---|---|---|---|---|---|---|
| Urban NEDC | 15.788 | 0.405 | 34.43 | 15.395 | 23.68 | 15.400 | −0.03% |
| Extra-urban NEDC | 32.920 | 1.461 | 30.00 | 31.508 | 19.14 | 31.535 | −0.09% |
| WLTC, Low | 29.053 | 1.829 | 34.20 | 27.277 | 32.07 | 27.281 | −0.01% |
| WLTC, Medium | 0.158 | 1.101 | 22.59 | −0.894 | 20.32 | −0.889 | 0.61% |
| WLTC, High | 3.564 | 0.999 | 20.37 | 2.614 | 18.51 | 2.619 | −0.19% |
| WLTC Extra High | 122.537 | 1.950 | 14.17 | 120.725 | 13.55 | 120.731 | −0.01% |
| ARTEMIS URBAN | −0.007 | 0.130 | 31.17 | −0.133 | 29.10 | −0.133 | 0.22% |
| ARTEMIS ROAD | 25.671 | 1.610 | 24.01 | 24.128 | 18.50 | 24.148 | −0.08% |
| ARTEMIS MOTORWAY | 123.259 | 2.444 | 8.32 | 121.109 | 7.04 | 121.162 | −0.04% |
Table A13.
The CCVS,corr calculated based on Equations (5) and (21) for Euro 6 WLTP vehicle with SI engine, NOx concentration [ppm].
Table A13.
The CCVS,corr calculated based on Equations (5) and (21) for Euro 6 WLTP vehicle with SI engine, NOx concentration [ppm].
| Cycle | CCVS | Cdil | DR | DF | ΔCCVS | ||
|---|---|---|---|---|---|---|---|
| Urban NEDC | 4.908 | 0.061 | 34.43 | 4.849 | 23.68 | 4.850 | −0.02% |
| Extra-urban NEDC | 0.178 | 0.250 | 30.00 | −0.064 | 19.14 | −0.059 | 8.02% |
| WLTC, Low | 8.190 | 0.414 | 34.20 | 7.788 | 32.07 | 7.789 | −0.01% |
| WLTC, Medium | 15.543 | 0.937 | 22.59 | 14.647 | 20.32 | 14.652 | −0.03% |
| WLTC, High | 8.382 | 0.315 | 20.37 | 8.082 | 18.51 | 8.084 | −0.02% |
| WLTC Extra High | 13.197 | 0.684 | 14.17 | 12.561 | 13.55 | 12.563 | −0.02% |
| ARTEMIS URBAN | 18.949 | 0.126 | 31.17 | 18.827 | 29.10 | 18.827 | 0.00% |
| ARTEMIS ROAD | 16.950 | 1.710 | 24.01 | 15.311 | 18.50 | 15.332 | −0.14% |
| ARTEMIS MOTORWAY | 14.014 | 2.043 | 8.32 | 12.217 | 7.04 | 12.261 | −0.36% |
Table A14.
The CCVS,corr calculated based on Equations (5) and (21) for Euro 6 WLTP vehicle with SI engine, THC concentration [ppm].
Table A14.
The CCVS,corr calculated based on Equations (5) and (21) for Euro 6 WLTP vehicle with SI engine, THC concentration [ppm].
| Cycle | CCVS | Cdil | DR | DF | ΔCCVS | ||
|---|---|---|---|---|---|---|---|
| Urban NEDC | 15.070 | 5.726 | 34.43 | 9.510 | 23.68 | 9.586 | −0.79% |
| Extra-urban NEDC | 7.863 | 5.214 | 30.00 | 2.823 | 19.14 | 2.921 | −3.38% |
| WLTC, Low | 55.822 | 5.868 | 34.20 | 50.126 | 32.07 | 50.137 | −0.02% |
| WLTC, Medium | 39.387 | 5.725 | 22.59 | 33.915 | 20.32 | 33.944 | −0.08% |
| WLTC, High | 37.683 | 5.912 | 20.37 | 32.061 | 18.51 | 32.090 | −0.09% |
| WLTC Extra High | 40.256 | 5.879 | 14.17 | 34.792 | 13.55 | 34.811 | −0.05% |
| ARTEMIS URBAN | 6.803 | 5.746 | 31.17 | 1.241 | 29.10 | 1.254 | −1.05% |
| ARTEMIS ROAD | 12.838 | 5.757 | 24.01 | 7.321 | 18.50 | 7.392 | −0.97% |
| ARTEMIS MOTORWAY | 9.893 | 5.782 | 8.32 | 4.806 | 7.04 | 4.932 | −2.56% |
Table A15.
The CCVS,corr calculated based on Equations (5) and (21) for Euro 6 WLTP vehicle with SI engine, CH4 concentration [ppm].
Table A15.
The CCVS,corr calculated based on Equations (5) and (21) for Euro 6 WLTP vehicle with SI engine, CH4 concentration [ppm].
| Cycle | CCVS | Cdil | DR | DF | ΔCCVS | ||
|---|---|---|---|---|---|---|---|
| Urban NEDC | 3.250 | 2.052 | 34.43 | 1.258 | 23.68 | 1.285 | −2.11% |
| Extra-urban NEDC | 2.278 | 1.997 | 30.00 | 0.348 | 19.14 | 0.385 | −9.80% |
| WLTC, Low | 2.997 | 1.070 | 34.20 | 1.958 | 32.07 | 1.960 | −0.11% |
| WLTC, Medium | 2.739 | 1.030 | 22.59 | 1.755 | 20.32 | 1.760 | −0.29% |
| WLTC, High | 2.349 | 1.077 | 20.37 | 1.325 | 18.51 | 1.330 | −0.40% |
| WLTC Extra High | 3.494 | 1.067 | 14.17 | 2.502 | 13.55 | 2.506 | −0.14% |
| ARTEMIS URBAN | 2.417 | 1.995 | 31.17 | 0.486 | 29.10 | 0.491 | −0.93% |
| ARTEMIS ROAD | 2.812 | 1.056 | 24.01 | 1.800 | 18.50 | 1.813 | −0.72% |
| ARTEMIS MOTORWAY | 2.722 | 1.068 | 8.32 | 1.782 | 7.04 | 1.806 | −1.29% |
References
- Code of Federal Regulations. Protection of Environment; Part 86; Code of Federal Regulations: Washington, DC, USA, 1996; p. 144. [Google Scholar]
- UN Regulation No. 83. Uniform Provisions Concerning the Approval of Vehicles with Regard to the Emission of Pollutants According to Engine Fuel Requirements. Revision 5, 07 Series of Amendments to the Regulation. Available online: https://unece.org/transport/vehicle-regulations-wp29/standards/addenda-1958-agreement-regulations-81-100 (accessed on 22 January 2015).
- Radzimirski, S.; Majerczyk, A. Analysis of Measurement Errors of CVS Method Used for Tests of Pollutant Emissions from Light-Duty Vehicles. J. KONES 2013, 20, 253–259. [Google Scholar]
- Whitby, R. NY I/M Program Calculation of Tailpipe Exhaust Concentrations from CVS Dilution Tunnel Dilute Exhaust Concentrations and Development of the NY Dilution Factor for Mass Emission Measurements; New York State Department of Environmental Conservation, Bureau of Mobile Sources, Automotive Emissions Laboratory: Albany, NY, USA, 1997. [Google Scholar]
- Austin, T.C. Vehicle Exhaust Dilution Correction Procedure, Radian Corporation Report submitted to California Bureau of Automotive Repair; SAE International: Warrendale, PA, USA, 1994. [Google Scholar]
- Inoue, K.; Ishihara, M.; Akashi, K.; Adachi, M.; Ishida, K. Numerical Analysis of Mass Emission Measurement Systems for Low Emission Vehicles; SAE Technical Paper 1999-01-0150; SAE International: Warrendale, PA, USA, 1999. [Google Scholar] [CrossRef]
- Fu, J.; Wang, W.; Lyons, D. Development of Continuous Dilution Factor for CVS Emissions Sampling and Calculation; SAE Technical Paper 2001-01-2815; SAE International: Warrendale, PA, USA, 2001. [Google Scholar] [CrossRef]
- Austin, T.; Caretto, L. Improving the Calculation of Exhaust Gas Dilution During Constant Volume Sampling; SAE Technical Paper 980678; SAE International: Warrendale, PA, USA, 1998. [Google Scholar] [CrossRef]
- Tayama, A.; Kanetoshi, K.; Tsuchida, H.; Morita, H. A Study of a Gasoline-Fueled Near-Zero-Emission Vehicle Using an Improved Emission Measurement System; SAE Technical Paper 982555; SAE International: Warrendale, PA, USA, 1998. [Google Scholar] [CrossRef]
- Ohtsuki, S.; Inoue, K.; Yamagishi, Y.; Namiyama, K. Studies on Emission Measurement Techniques for Super-Ultra Low Emissions Vehicles; SAE Technical Paper 2002-01-2709; SAE International: Warrendale, PA, USA, 2002. [Google Scholar] [CrossRef]
- Szczotka, A.; Puchałka, B.; Bielaczyc, P.; Adamiak, B. Influence of the dilution factor on the uncertainty of the exhaust gas emission results obtained during testing on the chassis dynamometer”. AUTOBUSY Technika Eksploatacja Systemy Transportowe 2018, 19, 737–742. [Google Scholar] [CrossRef]
- Szczotka, A. Analiza Dokładności Metody Pomiarów Składników Spalin w Testach na Hamowni Podwoziowej (Analysis of the Accuracy of the Method of Measuring Exhaust Gas Components in Tests on a Chassis Dynamometer). Ph.D. Thesis, Politechnika Poznańska, Poznań, Poland, 2004. [Google Scholar]
- Sherman, M.T.; Lennon, K.; Chase, R.E. Error Analysis of Various Sampling Systems; SAE Technical Paper 2001-01-0209; SAE International: Warrendale, PA, USA, 2001. [Google Scholar] [CrossRef]
- Behrendt, H.; Moersch, O.; Seiferth, C.T.; Seifert, G.E.; Wiebrecht, J.W. Studies on Enhanced CVS Technology to Achieve SULEV Certification; SAE Technical Paper 2002-01-0048; SAE International: Warrendale, PA, USA, 2002. [Google Scholar] [CrossRef]
- Silvis, W.; Williamson, J.; Kreft, N.; Alajbegovic, A. DVE—Direct Vehicle Exhaust Flow Measurement Using Head-Type Flowmeters. SAE Trans. 2003, 112, 461–473. [Google Scholar]
- Ward, W.W.; Scheffler, E.C. Carbon Dioxide (CO₂) Tracer Technique for Modal Mass Exhaust Emission Measurement. SAE Trans. 1972, 81, 441–455. [Google Scholar]
- Hawley, J.G.; Bannister, C.D.; Brace, C.J.; Cox, A.; Ketcher, D.; Stark, R. Vehicle modal emissions measurement—Techniques and issues. Proc. Inst. Mech. Eng. Part D J. Automob. Eng. 2004, 218, 859–873. [Google Scholar] [CrossRef]
- Hawley, J.; Brace, C.; Cox, A.; Ketcher, D.; Stark, R. Influence of Time-Alignment on the Calculation of Mass Emissions on a Chassis Rolls Dynamometer; SAE Technical Paper 2003-01-0395; SAE International: Warrendale, PA, USA, 2003. [Google Scholar] [CrossRef]
- Silvis, W.M.; Chase, R.E. Proportional Ambient Sampling: A CVS Improvement for ULEV and Lean Engine Operation; SAE Technical Paper 1999-01-0154; SAE International: Warrendale, PA, USA, 1999. [Google Scholar] [CrossRef]
- André, M.; Rapone, M.; Joumard, R. Analysis of the Cars Pollutant Emissions as Regards Driving Cycles and Kinematic Parameters; Report INRETS-LTE 0607; INRETS: Paris, France, 2006. [Google Scholar]
- André, M. Real-World Driving Cycles for Measuring Cars Pollutant Emissions—Part A: The ARTEMIS European Driving Cycles; Report INRETS-LTE 0411; INRETS: Paris, France, 2004. [Google Scholar]
- European Union. Commission Regulation (EU) 2017/1151 of 1 June 2017 supplementing Regulation (EC) No. 715/2007 of the European Parliament and of the Council on Type-Approval of Motor Vehicles with Respect to Emissions from Light Passenger and Commercial Vehicles (Euro 5 and Euro 6) and on Access to Vehicle Repair and Maintenance Information, Amending Directive 2007/46/EC of the European Parliament and of the Council, Commission Regulation (EC) No 692/2008 and Commission Regulation (EU) No. 1230/2012 and Repealing Commission Regulation (EC) No. 692/2008 (Text with EEA Relevance); European Union: Brussels, Belgium, 2017; Volume 175, p. 1. [Google Scholar]
- Zeman, F. Metropolitan Sustainability: Understanding and Improving the Urban Environment; Woodhead Pub: Cambridge, UK, 2012. [Google Scholar]
- Koltsakis, G.C.; Kandylas, I.P.; Stamatelos, A.M. Three-way Catalytic Converter Modeling and Applications. Chem. Eng. Commun. 1998, 164, 153–189. [Google Scholar] [CrossRef]
- The Three-Way Catalytic Converter; The Open University: München, Germany, 2019.


Publisher’s Note: MDPI stays neutral with regard to jurisdictional claims in published maps and institutional affiliations. |
© 2021 by the authors. Licensee MDPI, Basel, Switzerland. This article is an open access article distributed under the terms and conditions of the Creative Commons Attribution (CC BY) license (https://creativecommons.org/licenses/by/4.0/).