Abstract
The transient analysis model of grounding systems is an important tool to analyze the lightning characteristics of grounding devices. When lightning enters the soil through the grounding device, there is a centralized discharge channel. The spatial structure of the discharge channel in the soil has a great effect on the accuracy of the transient analysis model of the soil impulse discharge. In this paper, based on the gray information analysis method, the volume of successive impulse discharge channels in the ground under various currents and soil conditions is calculated, and the changing law with time interval is analyzed. According to the experimental results, an analysis method of the model considering the discharge channel structure is proposed, and an example is analyzed. The results show that the time interval has an effect on the volume of the discharge channel. In a certain range, the volume of the channel increases with the time interval of successive impulse discharges. Taking the critical breakdown electric field strength as the judgment condition and the residual resistivity as the variable, the development process of the discharge channel can be simulated. The calculated results of the model are close to the experimental results.
1. Introduction
Soil is the most important medium in the grounding system [1,2,3,4,5]. Its discharge characteristics directly affect the lightning strike performance of grounding devices [6,7,8]. Strong ionization occurs when lightning injects the soil [9,10,11], and a centralized discharge channel is generated near the grounding electrode instead of uniform dispersion in all directions [6,7]. The development of the soil discharge directly determines the ground potential rise and the influence on the pipelines in the ground. The morphology and structure of the discharge channel is one of the most important factors to characterize the discharge, and it is also one of the most important factors that affect the accuracy of the grounding device transient analysis model. It is very important to obtain the actual structure of the soil discharge channel for building the lightning transient model of grounding systems and accurately calculate discharge characteristic parameters.
Due to the isolation of light and heat by soil, it is always a difficult point to observe the discharge in the ground accurately and comprehensively. In early research, many scholars proposed observation methods for soil discharge, which can be divided into three general methods. The first method is to embed observation media, such as conductive paper, film or X-ray film, in the soil around the grounding electrode [12,13,14,15]. The area where the discharge takes place is observed by means of ablation or exposure. The second method is to use a high-speed camera to capture the surface discharge process, or to use transparent glass sand instead of soil for the photography [16,17]. The third method is to excavate the area of lightning into the ground to observe the morphology of the discharge channel [18,19].
In order to solve the problems of traditional methods in changing the discharge environment as well as incomplete observation and high cost, the literature [1] proposes the use of X-ray transmission imaging technology to carry out non-intrusive imaging observation on the single impulse discharge channel in soil and obtain a gray-scale image that can reflect the structural outline of the discharge channel. The discharge channel is imaged from three perspectives (front view, side view and top view), and its 3D spatial structure is synthesized by using the boundary in the three views. The characteristic parameters of soil discharge are calculated based on the physical structure.
A lightning discharge process contains several subsequent strokes. Under the successive impulse currents, a more complex multi-branch discharge channel is formed in the soil [20,21]. This results in coverage and intersection among multiple channels. It is difficult to achieve the same accuracy as for the case of a single channel be relying only on the boundary of three views for 3D reconstruction. It is necessary to add constraints in the process of 3D reconstruction for correction, so as to ensure the model accuracy. Moreover, it is difficult to get three views at the same time, when taking instantaneous pictures of the discharge between two impulses. We propose an analysis method based on a single view image.
One of the purposes of obtaining the discharge channel structural parameters is to establish a more accurate transient analysis model for the grounding system. A variety of soil discharge models have been proposed, such as the hemispherical structure model [22], cylindrical structure model [23,24], segmented cylinder model [25] and multi-zone model [26]. The characteristic parameters of lightning discharge in soil are calculated based on the discharge channel structure in literature [1,2,7], and the transient analysis model of the grounding system is established. However, the existing models are generally based on the assumption of discharge current being uniform in each direction, without considering the underground discharge channel, which is inconsistent with the observation results of soil discharge with a centralized discharge channel.
It is very difficult to accurately observe the discharge channel structure in the soil and to consider it in the calculation of characteristic parameters. To solve these challenging problems, X-ray transmission imaging technology is used to obtain multi-view images of the discharge channel structure. The gray information analysis method is used to extract the structural parameters of the discharge channel and analyze its changing law with the time interval of successive impulses. At the same time, according to the image results, the structural characteristics of the discharge channel and the characterization methods of the successive impulse discharge process in the parameter calculation process are analyzed to make up for the deficiency of ignoring the discharge channel structure in the existing models. A simple modeling method of soil successive impulse discharge considering discharge channel structure is proposed. Hopefully, it can provide the basis and ideas for follow-up research. This paper is an extended version of our paper published in ICHVE 2020 [7]. Compared with the conference papers, the new research content of this paper is the analysis method and modeling method of the soil successive impulse discharge process considering the structural characteristics of discharge channels.
2. Experimental Platform and Analysis Method
2.1. Experimental Platform
A successive impulse current with several thousand amperes was applied to the soil by using the successive impulse discharge experimental platform, and the time interval was continuously adjustable from 0 to 500 ms. The sand was taken as the test sample and placed in a cube box with a side length of 20 cm. A vertical electrode with a length of 10 cm was placed in the center of the sandbox to discharge evenly on all sides. Previous literature [20,21] gives a detailed description of the structure and parameters of the experimental platform.
A standard gray sandbox (SGS) was placed next to the discharge sandbox (DS), with a size of 20 × 20 × 5 cm, and an oblique baffle was arranged inside, as shown in Figure 1. Its function was to provide a standard correspondence between the soil thickness and the gray value.
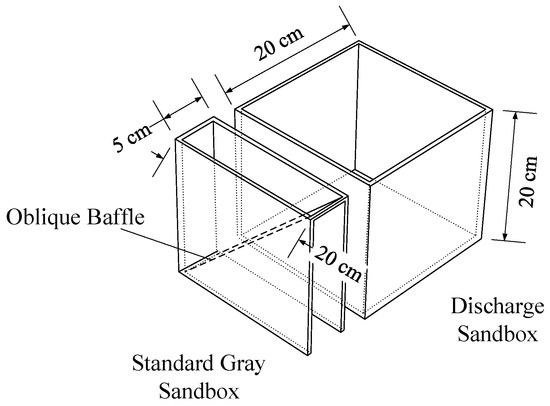
Figure 1.
Schematic diagram of main discharge sandbox (DS) and standard gray sandbox (SGS). The SGS was placed next to DS and imaged at the same time. The oblique baffle set in the SGS could produce a soil layer with gradual thickness, which was used to analyze the corresponding relationship between soil thickness and image gray value.
2.2. Extraction Method of Discharge Channel Volume
The gray images of DS and SGS are obtained by an X-ray imaging system. The error caused by X-ray intensity and distance can be reduced by imaging them synchronously. The gray value matrix of the SGS image was extracted and the average value gi of each row of matrix was calculated. The results show that the gray value of the image increased linearly with the soil thickness under the experimental conditions [27]. The slope of the linear function could be obtained by fitting and is the estimated growth rate of gray difference (GRGD), which means that the gray value of the image increases a for every 1 cm increase in the thickness of soil penetrated by X-ray.
The prism, shown in Figure 2, was buried in the soil and then slowly taken out. A standard channel, with known structural information and exactly consistent with the model, could be formed inside the soil to simulate the discharge channel. The gray images with and without discharge channel were cut off with the same size, and then the gray value matrices with the same order were extracted from the gray images to obtain Gn (no discharge channel) and Gd (with discharge channel). By calculating the difference value of gray matrix and correcting the background error, we could obtain the change of gray value caused only by the discharge channel, that is, the gray difference matrix Gc [27].
where Gn, Gd, Gc, Gc′ and G0 are all matrices of the same size. Gn is the matrix of gray image before the discharge channel is generated; Gd is the matrix of gray image after the discharge channel is generated. Because the thicker the soil is, the larger the gray value is, the gray value of the discharge channel position is smaller than that of the image before discharge. Therefore, Gc′ represents the change of gray value caused only by the discharge channel and includes the background error caused by the dispersion of X-ray metrology.
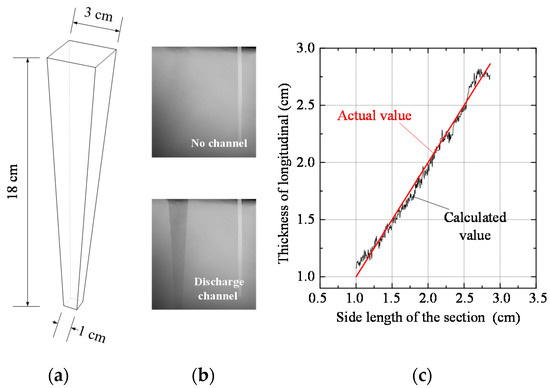
Figure 2.
Actual thickness of discharge channel and calculated thickness. (a) Structural parameters of standard prism; (b) gray images with and without discharge channel; (c) the relationship between the calculated value of discharge channel thickness and its actual value.
In order to eliminate the background error, the background error constant was calculated. The average gray value of the non-discharge channel position in the Gc′ matrix was taken as constant g0, which is the background error constant caused by irradiation dose. The constant matrix G0 is composed of g0. Therefore, after subtracting G0 from Gc′, the resulting Gc is the gray difference matrix caused by the discharge channel, and the gray value of each pixel is gc(ij).
According to the GRGD, the calculation between gray difference and discharge channel thickness is as follows:
The average value of each row of thickness matrix was calculated and compared with the actual value, as shown in Figure 2. It can be seen that the calculated values were basically the same as the actual values. hc(ij) represents the thickness of any point in the discharge channel. For the area without discharge, hc(ij) is zero after error correction. So the discharge channel volume is
Here, a is the growth rate of gray difference which means that the gray value of the image increases a for every 1 cm increase in the thickness of soil penetrated by X-ray. hc(ij) is the thickness of the discharge channel corresponding to each pixel; sc(ij) is the area of each pixel; Vc is the volume of the discharge channel, which is the sum of the product of the area and thickness of each pixel.
The calculated average volume of the prism is 77.02 cm3, the actual value is 78 cm3. It shows that the method is feasible. The implementation and verification of this method are described in detail in [27]. The main content of this paper is to obtain the volume and changing law of successive impulse discharge channel based on this method, which provides data basis and theoretical support for modeling.
3. The Structure Changing Rule of Successive Impulse Discharge Channel
3.1. Influence of Current
It is important to obtain the structural parameters and changing laws of the discharge channel for the accurate establishment of the transient analysis model of the grounding system. Based on the experiment, the images of the discharge channel in the soil under different time intervals can be obtained, and its 3D structural parameters can be calculated. From the point of view of structural parameters, the change rule of successive impulse discharge channel in time domains is verified.
Figure 3 shows the images of the discharge channel structure changing over time under different current peaks. Figure 4 shows the corresponding discharge channel volume, where the red arrow indicates an increasing trend on the whole. Literature [20] indicates that, the larger the time interval is, the greater the probability of a branch discharge channel. It can be found that the experimental results under different current peaks conform to this rule; the probability of a branch discharge channel increases with the time interval. Moreover, within the experimental conditions, the total volume of the successive impulse discharge channel in the soil increases with the time interval.
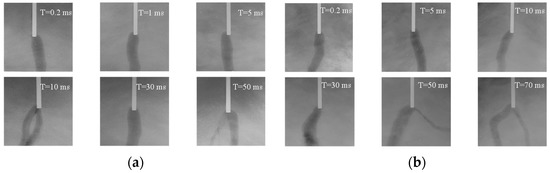
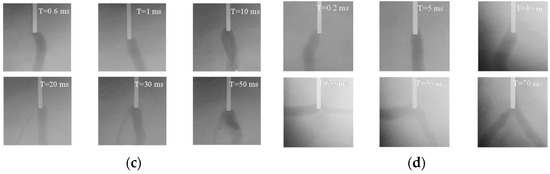
Figure 3.
Discharge channels of soil under successive impulse currents with various current peaks. (a) Current peak of 1.5 kA; (b) current peak of 1.8 kA; (c) current peak of 2.0 kA; (d) current peak of 2.2 kA.
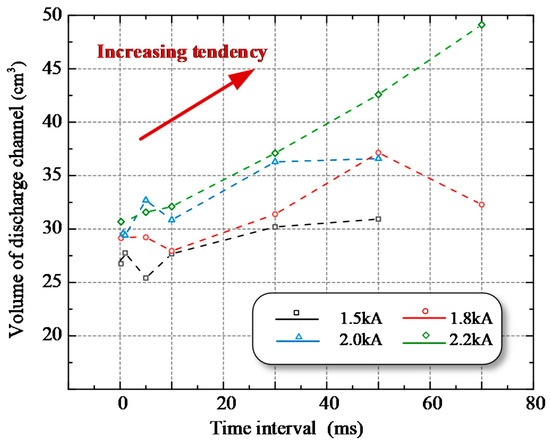
Figure 4.
Volume of soil discharge channels under successive impulse currents with various peaks.
At the same time, the larger the current peak value, the larger the discharge channel volume. Therefore, it can be concluded that under the successive impulse current, the discharge region in the soil will increase with the energy injected into the ground and the time interval between the two impulses.
3.2. Influence of Soil Properties
Soil parameters are also important factors affecting the volume of the discharge channel. The images of discharge channels under different soil conditions were obtained and the 3D structure parameters were calculated. Figure 5 shows the images of the discharge channel structure changing with time intervals under different salt content; for the discharge channel structure of soil with various water content, refer to previous literature [20]. Figure 6 shows the volume change of the successive impulse discharge channel under different soil water content and salt content. With the increase of soil water content, soil resistivity decreased and the discharge channel volume increased. When the soil water content was constant, the volume of the discharge channel increased with the time interval. The effect of soil salt content on the volume of the discharge channel was basically the same as found for varying water content. The larger the soil salt content was, the smaller the soil resistivity and the larger the discharge channel. When the salt content was constant, the volume of the discharge channel increased with the time interval. It can be concluded that the volume of the successive impulse discharge channel increased with the soil conductivity and time interval.
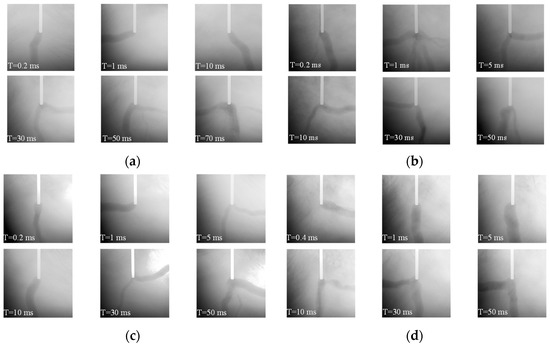
Figure 5.
Discharge channels of soil under successive impulse currents with various salt content. (a) Salt content of 0%; (b) salt content of 0.1%; (c) salt content of 0.2%; (d) salt content of 0.5%.
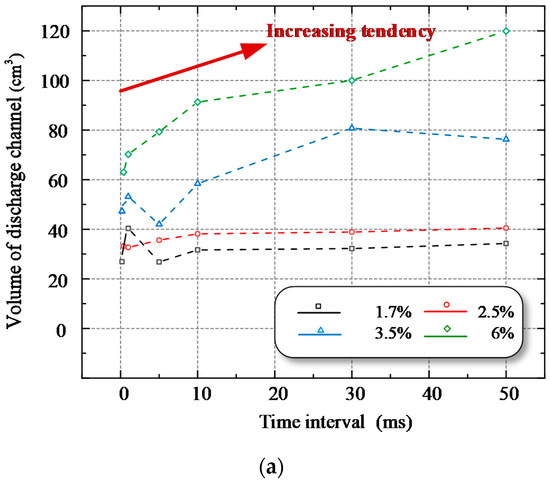
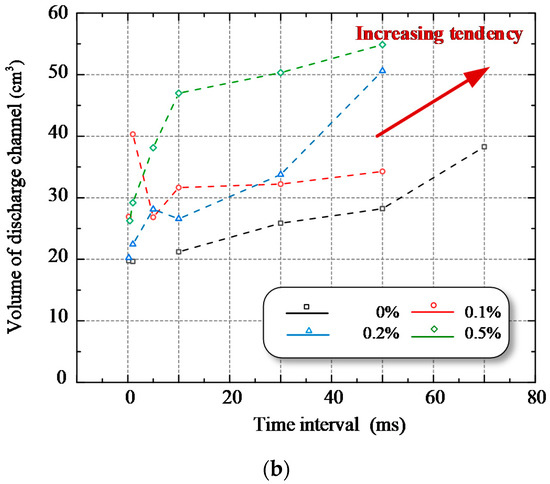
Figure 6.
Volume of soil discharge channels under successive impulse currents. (a) Influence of soil water content; (b) influence of soil salt content.
In addition, compared with the water content, the influence of soil salt content on the volume of the successive impulse discharge channel was smaller, which may be due to the smaller influence of salt content on the recovery characteristics [21].
Based on the above experimental results, it can be found that although there was randomness in the structure of the discharge channel, from the perspective of overall probability, the volume of the discharge channel increased with the time interval. According to the recovery mechanism of soil discharge [20], when the time interval is small, the discharge channel generated by the first impulse is in a highly ionized state, and the conductivity is large, so it is easy to discharge the subsequent shock current. Therefore, a new discharge area is not likely to occur.
With an increase in the time interval, the highly ionized state of the first impulse discharge channel disappears and the resistivity increases. Therefore, the probability of subsequent impulse currents ionizing the soil around the channel or breaking through other areas to produce new discharge channels increases, and the discharge zone also increases.
The above experimental results also verify the discharge recovery mechanism proposed in literature [20] from the perspective of the discharge channel volume and provide the theoretical basis for the establishment of a calculation method.
4. Analysis Method Considering Discharge Channel Structure
4.1. Basic of Model
The accuracy of the lightning transient model of grounding device can be improved by constructing a soil impulse discharge model considering the structure of the discharge channel, which is more suitable for the actual situation. The analysis of the influence range of the soil discharge area can improve the assessment of the impact of lightning on the pipeline near the grounding device. Therefore, this section explores the modeling method for the soil discharge model considering the structure of the discharge channel.
Literature [20] shows that the process of soil discharge under successive impulse currents generally includes three stages: first impulse discharge, recovery process and subsequent impulse discharge. The physical process and initial conditions of each stage are different. The recovery process of soil electrical performance and subsequent impulse discharge should not be ignored, nor can they be regarded as the simple superposition of the single impulse discharge process in the time domain. The subsequent impulse discharge process is greatly affected by the first impulse and recovery process.
The main physical model of the soil successive impulse discharge process is the soil discharge recovery model. When the successive lightning impulse current is injected into the soil through the grounding device, the first impulse forms a centralized discharge channel in the soil [20,21]. Because of the large instantaneous energy of the impact current and the uneven distribution of soil particles in all directions, the impulse current preferentially breaks through the soil at the location where discharge occurs most easily when the electric field intensity near the electrodes reaches the breakdown field strength of the soil, forming a partial discharge channel. Then, the current continues to be injected into the arc channel, breaking through the soil where discharge occurs most easily near the end of the arc channel. The discharge channel continues to grow until the energy injected decreases to such an extent that it cannot break through the soil. When the first impulse current drops to zero, the discharge channel remains highly ionized for some time and recovers gradually.
If the subsequent impulse current is injected before the highly ionized state disappears, there is a great probability that the impulse current will be directly and rapidly discharged along the existing discharge channel with high conductivity. Moreover, when energy reaches the end of the channel, it continues to break through the soil at the most prone location of discharge and continues to grow until it cannot break through the soil.
Experimental images show that there is a centralized discharge channel near the grounding electrode after lightning enters the ground. In the case of a single discharge channel, the residual resistivity of subsequent impulses is a function of the residual resistivity of the first impulse and the recovery coefficient [20].
Therefore, based on the existing soil discharge theory, an improved four-zone structural model of soil impulse discharge is proposed, as shown in Figure 7. The ionization region in the soil can be simply divided into arc channel, ionization area, non-linear conductivity area and constant conductivity area. The characteristics of different regions are as follows:

Figure 7.
Improved four-zone model of soil under impulse current, including arc channel, ionization area, non-linear conductivity area and constant conductivity area.
- The resistivity of soil in the arc discharge channel is the product of initial soil resistivity and the attenuation coefficient.
- When the electric field strength is greater than the critical breakdown electric field strength (E > EC), the resistivity of the soil is much lower than the initial resistivity, but the reduction degree is much lower than that of the soil inside the arc channel.
- When the electric field strength is less than the critical breakdown electric field strength (E ˂ EC), the soil resistivity changes nonlinearly, and decreases exponentially with the increase of electric field intensity, and the attenuation degree is smaller than that of the ionization zone.
- When the electric field intensity is small and can be ignored, the soil resistivity is the initial value.
In this paper, the values of soil discharge parameters in each region can be determined according to the experimental results:
- The soil resistivity in the arc discharge channel can be determined according to the experimental results in literature [2,20]. The residual resistivity can be obtained by iterative calculation when it is first broken down by impulse current [2]. When the second breakdown occurs, the residual resistivity is the product of the calculated value of the first breakdown and the recovery coefficient [20].
- The soil residual resistivity in the ionization zone has been studied in the literature [28,29,30], and the results show that the residual resistivity is distributed between 1.7% and 50% of the initial resistivity. For example, when the initial soil resistivity is about 50 Ωm, the residual resistivity of the ionization zone is about 10–20% of the initial value [28,29,30]. However, because the arc channel and ionization zone are not distinguished in the above test analysis, the larger value in the range is selected in this paper.
- The experimental results for the relationship between soil resistivity and electric field in the nonlinear zone are given in literature [31]. Although the results of different organizations are varied, their change trend and value range are basically consistent. Before reaching the critical breakdown field strength, the soil resistivity decreases exponentially with the increase of electric field strength, and the value range of the reduction coefficient is basically decreased from 1 to about 0.5 [31].
- The soil resistivity in the constant conductivity zone can be considered to maintain the initial value unchanged. In this paper, the space coordinate transformation method is used to represent the infinite earth environment.
4.2. Numerical Analysis Method
At the initial time of the effective action of impulse current (0 + Δt, where Δt is the progressive step of time element in calculation), based on the electric field intensity generated by the instantaneous current value in the soil, the direction where the maximum electric field intensity was located near the grounding device was selected as the initial development direction of the discharge channel, which could simulate the randomness in the actual development process.
The position of the critical breakdown electric field strength value EC in the development direction of the discharge channel was taken as the growth limit of discharge channel in the time step, Δt. According to the experimental images and the research results in literature [1,2,18,20,21], we analyzed the structural characteristics of the discharge channel. Generally, the diameter of lightning discharge channel in the soil is several centimeters. Under the normal size of a single columnar grounding electrode structure, most extend from the end of the electrode, and the section radius is slightly larger than the equivalent radius of the electrode. At the same time, the section radius of each position of the discharge channel is basically the same, that is, the growth of the discharge channel is basically along the depth direction, and the channel radius can be regarded as constant during the growth process.
We set the growth rule of the discharge channel in the time step Δt according to the above rules. The growth results of the discharge channel structure at the last moment were taken as the initial state of the physical structure in the next time step (0 + 2Δt), and the distribution results of the electric field intensity in the ground caused by the instantaneous current were recalculated. The dynamic growth of the discharge channel and the analysis of the electric field intensity were realized by repeated iterative calculation. The modeling process of the above analysis model is shown in Figure 8.
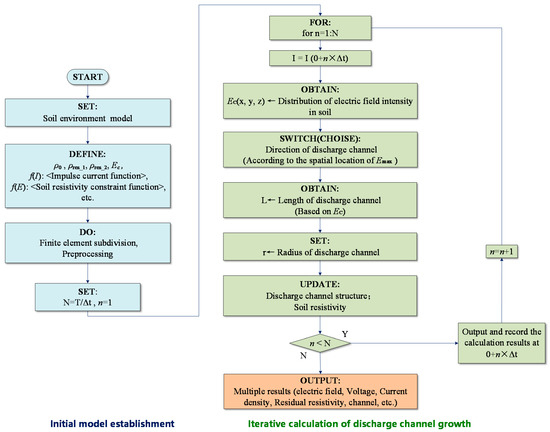
Figure 8.
Finite element flowchart of the modeling process of the dynamic growth model of soil impulse discharge channels.
4.3. Basic Case Analysis
In order to verify the rationality of the proposed model and its parameter range, a finite element analysis model was established based on the actual grounding device impulse discharge experiment, and the calculation results were compared with the experimental results.
The equivalent model was established based on the actual impulse discharge experimental parameters in literature [32]. The grounding device was a vertical electrode with a length of 1 m and a section radius of 0.025 m, and the top of the electrode was flat with the ground surface, as shown in Figure 9. The distribution of the initial resistivity of soil was uniform, and its value was between 40.5 Ωm and 43.5 Ωm. In the analysis model, the initial resistivity of soil was set as 43.5 Ωm.
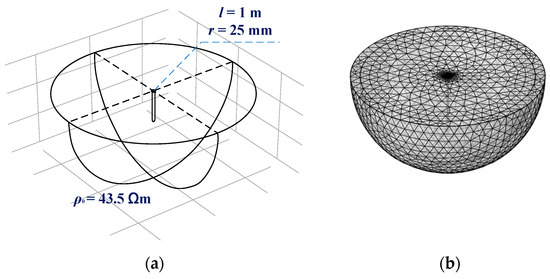
Figure 9.
Model diagram of structure of grounding device in impulse discharge test. (a) Structural diagram; (b) diagram of subdivision model.
Since the single impulse current is used as the source in literature [28], and factors such as soil water content and compactness are not discussed, according to the calculation method and results of discharge parameters proposed in the latest research of literature [1,2], the critical breakdown field strength of soil under this condition was set as 210 kV/m, and the residual resistivity in the discharge channel at the first breakdown was ρres_1 = 0.05% × ρ0. Because the discharge area in the ground was not observed in the actual experiment [32], in order to reduce the influence of the randomness of the discharge channel growth direction on the calculation results and to facilitate the demonstration of the case results, the direction of the discharge channel growth direction was conducted in the same direction and the vertical downward growth was set.
In this paper, the analysis model was constructed in the finite element environment. The hemispherical module was used to represent the earth. The infinite element equivalent module was set around the hemispherical module, and the space coordinate transformation method was used to realize the infinite earth equivalent. The enclosure potential of the infinite equivalent module was set to 0, i.e., φ = 0.
Discharging of the impulse current through the electrode into the soil can be described by the quasi-static Maxwell equation [20]:
where D is the electric flux density, E is the electric field intensity, φ is the potential, and J is the total current density, which comprises Jc as the conduction current density and Jd as the displacement current density.
The impulse current experiment results with a peak current of 30.8 kA were selected as the modeling object. The model calculation results of 1 μs, 2 μs, 5 μs and 8 μs were extracted from the starting time of the impulse current to the peak time of the current. Figure 10 shows the evolution process of the spatial structure of the discharge channel, spatial distribution of current density in the ground, spatial distribution of ground potential and surface potential in the time dimension.
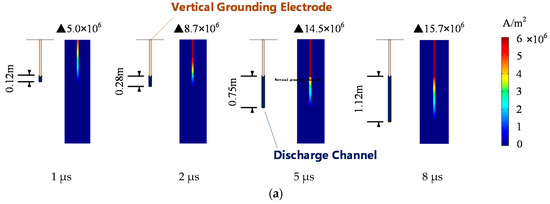
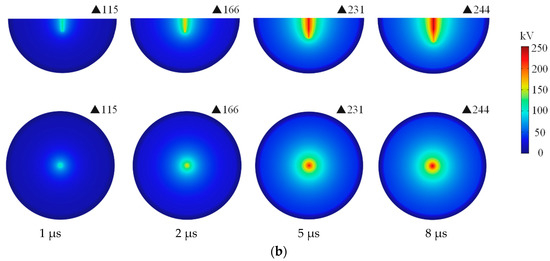
Figure 10.
The spatial-temporal evolution of the dynamic growth model of discharge channels. (a) Evolution of discharge channel structure and current density. (b) Evolution process of ground potential and surface potential.
The results show that in the rising stage of the impulse current, the length of the discharge channel increased gradually with the current value. The discharge channel grew to 1.12 m at the time of the current peak, and it continued to increase until the current was zero. According to the spatial distribution of current density in the ground shown in Figure 10, most of the energy of the impulse current was discharged along the discharge channel longitudinally, and only a small part of the current was discharged from the soil around the discharge channel. The simulation results were consistent with the discharge channel images and theoretical analysis.
At the same time, it was found that the growth of discharge channels also had a significant impact on the potential distribution in the ground. The variation of potential in the soil near the discharge channel was stronger than that in the area far away from the discharge channel, and the main voltage distortion direction was consistent with the growth direction of the discharge channel.
The calculated impulse grounding resistance and maximum grounding potential rise (GPR) were compared with the test results. The voltage at the top of the grounding electrode (current injection point) was selected as the value of GPR. When the impulse current peak value was 30.8 kA, the maximum ground potential rise at the peak time was 244 kV. The calculated impulse grounding resistance of the grounding device was 7.9 Ω, which is similar to the experimental results in the literature, as shown in Table 1.

Table 1.
The impulse grounding resistance and ground potential rise of the grounding device calculated by the model compared with the experimental results in literature [32].
The existence of a centralized discharge channel has significant influence on the calculation results of grounding potential distribution. Figure 11 shows the calculation results based on the above model with the same parameters, but ignoring the existence of the discharge channel and its growth process. The GPR of the model without considering the discharge channel was 305 kV, which increased by 61 kV compared with 244 kV calculated by the model considering the discharge channel, showing significant differences.
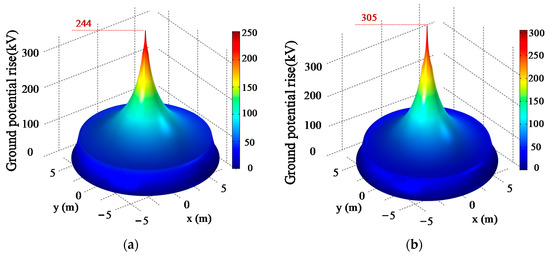
Figure 11.
Spatial distribution of surface potential at peak time, (a) considering the structure of the discharge channel and its growth process, or (b) ignoring the structure of the discharge channel and its growth process.
4.4. Discharge Channel Structure
The structure and growth range of the discharge channel directly affected the safe distance of the pipeline in the ground near the grounding electrode and the insulation distance between the independent grounding electrode and the main grid. Figure 12 shows the growth process and current density distribution of the discharge channel in the above case. At the end of the first impulse current, the discharge length of the channel reached 1.5 m. Considering the electrode length, the distance between the end of the discharge channel and the surface was 2.5 m. Moreover, the soil structure at this time was taken as the initial structure under the subsequent impulse current.
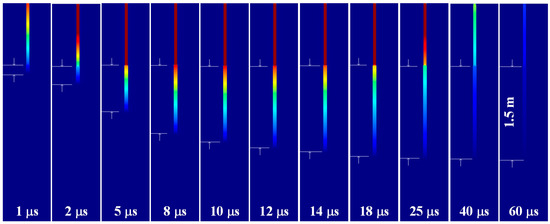
Figure 12.
Growth process of the first impulse discharge channel.
In order to avoid the influence of waveform parameters on the growth distance of the discharge channel and the recovery characteristics of soil resistivity, the peak value of the subsequent impulse current was consistent with that of the first impulse current, both of which were 30.8 kA.
The time interval between the two impulse currents directly affected the recovery degree of soil resistivity. The literature [20,21] shows that the smaller the time interval, the smaller the recovery degree of the ionized state of the first impulse discharge channel and the lower the resistivity, which results in a more favorable environment for subsequent impulse current discharges. At this time, a single discharge channel is more likely to occur; that is, the subsequent discharge channel overlaps with the first discharge channel and continues to develop on this basis, so as to further expand the length of the discharge channel. Therefore, we chose this case as the modeling object. Based on the results of the literature [20,21], we chose the time interval to be 0.2 ms, the residual resistivity of soil secondary breakdown was ρres_2 =0.2 × ρres_1, and the subsequent discharge channel completely covered the first discharge channel and developed in the same direction on the basis of it.
Figure 13 shows the growth process of the discharge channel under the subsequent impulse current; the discharge channel developed to 2.6 m, and the distance from the ground surface was 3.6 m. This was in the same order of magnitude as the discharge channel length by lightning penetration in the literature [17,18]. The difference was mainly caused by lightning current amplitude, the number of return impulses and soil parameters.
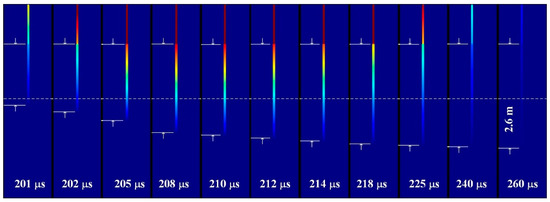
Figure 13.
Growth process of second impulse discharge channel.
There were also differences in the growth degree of the discharge channel between the second impulse and the first impulse. The subsequent discharge channel was increased by 1.1 m, which was shorter than the first one. This was because more current could discharge along the vertical direction of the discharge channel, as the length of the discharge channel increased. The energy at the end of the channel decreased and the electric field intensity decreased as well.
Based on the simulation test results, the soil discharge characteristic parameters were obtained, and the analysis model was established. Finally, the model calculation results were compared with the experimental results in the literature for verification. However, most of the existing true-type tests were single impulse discharge tests, mainly due to the lack of successive impulse discharge test platforms that can be used in the field. In future research, we can develop a set of large successive impulse current test platforms that can be used for field tests, carry out successive impulse discharge true-type tests, and further calibrate the models. Our team is carrying out this work.
5. Conclusions
In this paper, the structural characteristics of soil discharge channels under successive impulse currents were studied by experiment and simulation. The differences between the discharge channel of successive impulses and that of the single impulse as well as its variation with time intervals were analyzed.
An X-ray transmission imaging system was used to obtain the images of the discharge channel in soil; the volume of discharge channel was extracted based on the gray analysis method, and its changing law with time intervals was analyzed. The results show that a smaller time interval results in a higher likelihood of a subsequent impulse current discharged by the first impulse discharge channel with a highly ionized state. The lower the energy used to generate a new discharge channel, the smaller the volume of the discharge channel in the soil. On the contrary, the larger the time interval, the higher the probability of multiple discharge channels and the larger the total volume of discharge channels.
A higher number of discharge channels causes the discharge area to be concentrated mainly near the grounding electrode. However, when there is only one discharge channel, the subsequent impulse current continues to discharge further on the basis of the first impulse discharge channel. Although the total volume of the discharge channel is smaller than that of a multi-channel system, the length of the discharge channel, i.e., the maximum influence distance, is larger than that of multiple channels. This increases the impact on underground pipelines.
According to the structural characteristics and development theory of discharge channels, a lightning analysis method of grounding devices considering the structure of discharge channels in soil is proposed, and the development length of discharge channels is analyzed. In the case of this paper, the length of the arc channel can reach several meters, and the maximum length increases with the increase of the number of subsequent impulses and the amplitude of lightning.
Author Contributions
Investigation, D.L., Y.Z., S.X. and C.Z.; methodology, Y.C.; project administration, S.C. All authors have read and agreed to the published version of the manuscript.
Funding
This work is supported by the Science and Technology Project of State Grid Corporation of China (“Study on the Transient Characteristics of Grounding System and the Test and Evaluation Method of Current Dispersion Performance under the Successive Impulse Current”, 5500-202026088A-0-0-00).
Institutional Review Board Statement
Not applicable.
Informed Consent Statement
Not applicable.
Data Availability Statement
The study did not report any data.
Acknowledgments
Thank Zhou Mu and Jialun Li for their advice and help in the process of paper compilation.
Conflicts of Interest
The authors declare no conflict of interest.
Nomenclature
| Symbol/Abbreviation | Definition | Unit |
| SGS | standard gray sandbox | / |
| DS | discharge sandbox | / |
| GRGD | growth rate of gray difference | / |
| GPR | Ground potential rise | / |
| Gn | the matrix of gray image before the discharge channel is generated | / |
| Gd | the matrix of gray image after the discharge channel is generated | / |
| Gc′ | Grayscale difference matrix caused by discharge channel and background error | / |
| Gc | Grayscale difference matrix caused by discharge channel | / |
| G0 | Background error constant matrix | / |
| hc(ij) | Thickness of discharge channel at each pixel | cm |
| a | GRGD (growth rate of gray difference) | / |
| sc(ij) | The area corresponding to each pixel | cm2 |
| Vc | Discharge channel volume | cm3 |
| Ec | Critical breakdown field strength | kV/m |
| ρ0 | Initial soil resistivity | Ωm |
| ρres_1 | Residual resistivity of soil after first breakdown | Ωm |
| ρres_2 | Residual resistivity of soil after second breakdown | Ωm |
| φ | Potential | V |
| E | Electric field intensity | kV/m |
| D | Electric flux density | C/m2 |
| J | Total current density | A/m2 |
| Jc | Conduction current density | A/m2 |
| Jd | Displacement current density. | A/m2 |
References
- Sima, W.X.; Liu, S.W.; Yuan, T.; Luo, D.H.; Wu, P.; Zhu, B. Experimental study of the discharge area of soil breakdown under surge current using X-ray imaging technology. IEEE Trans. Ind. Appl. 2015, 51, 5343–5351. [Google Scholar] [CrossRef]
- Liu, S.W.; Sima, W.X.; Yuan, T.; Luo, D.H.; Bai, Y.; Yang, M. Study on X-ray imaging of soil discharge and calculation method of the ionization parameters. IEEE Trans. Power Deliv. 2017, 32, 2013–2021. [Google Scholar] [CrossRef]
- Androvitsaneas, V.P.; Damianaki, K.D.; Christodoulou, C.A.; Gonos, I.F. Effect of soil resistivity measurement on the safe design of grounding systems. Energies 2020, 13, 3170. [Google Scholar] [CrossRef]
- Ala, G.; Favuzza, S.; Francomano, E.; Giglia, G.; Zizzo, G. On the distribution of lightning current among interconnected grounding systems in medium voltage grids. Energies 2018, 11, 771. [Google Scholar] [CrossRef]
- Steinsland, V.; Sivertsen, L.H.; Cimpan, E.; Zhang, S.J. A new approach to include complex grounding system in lightning transient studies and EMI evaluations. Energies 2019, 12, 3142. [Google Scholar] [CrossRef]
- Zhang, B.; Li, Z.Z.; Wang, S. Onset electric field of soil ionisation around grounding electrode under lightning. High Volt. 2020, 5, 614–619. [Google Scholar] [CrossRef]
- Luo, D.H.; Cao, Y.X.; Sima, W.X.; Yuan, T.; Xie, S.J.; Zhang, Y. Study on changing law of 3D structure of successive impulse discharge channel in the ground. In Proceedings of the 2020 IEEE International Conference on High-Voltage Engineering (ICHVE 2020), Beijing, China, 6–10 September 2020. [Google Scholar]
- Reffin, M.S.; Nor, N.M.; Ahmad, N.N.; Abdullah, S. Performance of practical grounding systems under high impulse conditions. Energies 2018, 11, 3187. [Google Scholar] [CrossRef]
- Fakhraei, M.; Mahmoudian, M.; Rodrigues, E.M.G. Grounding system modeling and evaluation using integrated circuit based fast relaxed vector fitting approach considering soil ionization. Appl. Sci. 2020, 10, 5632. [Google Scholar] [CrossRef]
- Moreno, J.; Simon, P.; Faleiro, E.; Asensio, G.; Fernandez, J.A. Estimation of an upper bound to the value of the step potentials in two-layered soils from grounding resistance measurements. Materials 2020, 13, 290. [Google Scholar] [CrossRef] [PubMed]
- Ali, A.W.A.; Ahmad, N.N.; Nor, N.M.; Reffifin, M.S.; Abdullah, S.A.S. Investigations on the performance of a new grounding device with spike rods under high magnitude current conditions. Energies 2019, 12, 1138. [Google Scholar]
- Zhang, B.P.; He, J.L.; Zeng, R. Spatially discontinuous ionization phenomenon in inhomogeneous soil. Sci. China Technol. Sci. 2010, 53, 918–921. [Google Scholar] [CrossRef]
- Wen, X.S.; Feng, Z.Q.; Lu, H.L.; Tong, X.F.; Lan, L.; Chen, W.G.; Tan, B. Sparkover observation and analysis of the soil under the impulse current. IET Sci. Meas. Technol. 2016, 10, 228–233. [Google Scholar] [CrossRef]
- Cabrera, V.M.; Cooray, V. On the mechanism of space charge generation and neutralization in a coaxial cylindrical configuration in air. J. Electrost. 1992, 28, 187–196. [Google Scholar] [CrossRef]
- Victor, M.; Cabrera, M.; Lundquist, S.; Cooray, V. On the physical properties of discharges in sand under lightning impulses. J. Electrost. 1993, 30, 17–28. [Google Scholar] [CrossRef]
- Wang, J.; Liew, A.C.; Darveniza, M. Extension of dynamic model of impulse behavior of concentrated grounds at high currents. IEEE Trans. Power Deliv. 2005, 20, 2160–2165. [Google Scholar] [CrossRef]
- Elzowawi, A.; Haddad, A.; Griffiths, H. Visualization of electric discharge in porous materials. In Proceedings of the International Conference on High Voltage Engineering and Application (ICHVE), Poznan, Poland, 8–11 September 2014. [Google Scholar]
- Rakov, V.A. Triggered Lightning; Springer: Berlin, Germany, 2009. [Google Scholar]
- Rakov, V.A.; Uman, M.A. Lightning: Physics and Effects; Cambridge University Press: New York, NY, USA, 2003. [Google Scholar]
- Luo, D.H.; Sima, W.X.; Yuan, T.; Sun, P.T.; Chen, W.; Wang, J. Influence-factor analysis and parameter calculation of soil discharge and recovery characteristics under successive impulse currents. IEEE Trans. Power Deliv. 2019, 34, 514–523. [Google Scholar] [CrossRef]
- Sima, W.X.; Luo, D.H.; Yuan, T.; Liu, S.W.; Sun, P.T.; Li, T.X. Study on the image observation method and characteristics of soil discharge process under multiple impulse currents. IEEE Trans. Power Deliv. 2018, 33, 2125–2134. [Google Scholar] [CrossRef]
- Petropoulos, G.M. The high-voltage characteristics of earth resistances. J. Inst. Electr. Eng. Part II Power Eng. 1948, 95, 59–70. [Google Scholar]
- Bellaschi, P.L.; Armington, R.E. Impulse and 60-cycle characteristics of driven grounds—III effect of lead in ground installation. Electr. Eng. 1943, 62, 334–345. [Google Scholar] [CrossRef]
- Bellaschi, P.L. Impulse and 60-cycle characteristics of driven grounds. Electr. Eng. 1941, 60, 123–128. [Google Scholar] [CrossRef]
- Velazquez, R.; Mukhedkar, D. Analytical modelling of grounding electrodes transient behavior. IEEE Trans. Power Appar. Syst. 1984, 103, 1314–1322. [Google Scholar] [CrossRef]
- Li, J.L.; Yuan, T.; Yang, Q.; Sima, W.X.; Sun, C.X.; Zahn, M. Numerical and experimental investigation of grounding electrode impulse-current dispersal regularity considering the transient ionization phenomenon. IEEE Trans. Power Deliv. 2011, 26, 2647–2658. [Google Scholar] [CrossRef]
- Luo, D.H.; Yuan, T.; Sima, W.X.; Cao, Y.X.; Ye, S.Y.; Yao, X.Y. Study on the process of soil recovery and method of volume parameter extraction of branch discharge channel under successive impulse currents. High Volt. Tech. 2020, 46, 1791–1799. [Google Scholar]
- Liu, Y.Q.; Theethayi, N.; Gonzalez, R.M.; Thottappillil, R. The residual resistivity in soil ionization region around grounding system for different experimental results. In Proceedings of the IEEE Symposium on Electromagnetic Compatibility, Boston, MA, USA, 18–22 August 2003. [Google Scholar]
- Bellaschi, P.L.; Arminggton, R.E.; Snowden, A.E. Impulse and 60-cycle characteristics of driven grounds II. AIEE Trans. 1942, 61, 349–363. [Google Scholar]
- Liew, A.C.; Darveniza, M. Dynamic model of impulse characteristics of concentrated carths. Proc. IEEE 1974, 121, 123–135. [Google Scholar]
- Zhu, B. Study on the Variation Characteristics of Soil Electrical Parameters and the Influence on Grounding Device’s Performance. Ph.D. Thesis, Chongqing University, Chongqing, China, 2015. [Google Scholar]
- Geri, A. Behaviour of grounding systems excited by high impulse currents: The model and its validation. IEEE Trans. Power Deliv. 1999, 14, 1008–1017. [Google Scholar] [CrossRef]
Publisher’s Note: MDPI stays neutral with regard to jurisdictional claims in published maps and institutional affiliations. |
© 2021 by the authors. Licensee MDPI, Basel, Switzerland. This article is an open access article distributed under the terms and conditions of the Creative Commons Attribution (CC BY) license (http://creativecommons.org/licenses/by/4.0/).