Abstract
Natural gas hydrate is a new clean energy source in the 21st century, which has become a research point of the exploration and development technology. Acoustic well logs are one of the most important assets in gas hydrate studies. In this paper, an improved Carcione–Leclaire model is proposed by introducing the expressions of frame bulk modulus, shear modulus and friction coefficient between solid phases. On this basis, the sensitivities of the velocities and attenuations of the first kind of compressional (P1) and shear (S1) waves to relevant physical parameters are explored. In particular, we perform numerical modeling to investigate the effects of frequency, gas hydrate saturation and clay on the phase velocities and attenuations of the above five waves. The analyses demonstrate that, the velocities and attenuations of P1 and S1 are more sensitive to gas hydrate saturation than other parameters. The larger the gas hydrate saturation, the more reliable P1 velocity. Besides, the attenuations of P1 and S1 are more sensitive than velocity to gas hydrate saturation. Further, P1 and S1 are almost nondispersive while their phase velocities increase with the increase of gas hydrate saturation. The second compressional (P2) and shear (S2) waves and the third kind of compressional wave (P3) are dispersive in the seismic band, and the attenuations of them are significant. Moreover, in the case of clay in the solid grain frame, gas hydrate-bearing sediments exhibit lower P1 and S1 velocities. Clay decreases the attenuation of P1, and the attenuations of S1, P2, S2 and P3 exhibit little effect on clay content. We compared the velocity of P1 predicted by the model with the well log data from the Ocean Drilling Program (ODP) Leg 164 Site 995B to verify the applicability of the model. The results of the model agree well with the well log data. Finally, we estimate the hydrate layer at ODP Leg 204 Site 1247B is about 100–130 m below the seafloor, the saturation is between 0–27%, and the average saturation is 7.2%.
1. Introduction
Natural gas hydrates are recognized as a kind of potential energy source [1,2,3,4]. However, gas hydrate resources are highly dispersed, but some individual gas hydrate accumulations may hold important and concentrated resources that may be economically exploited in the future [5,6]. Gas hydrates are extremely unstable and easy to decompose during the exploitation process. As a result, the marine sediment structure can be destroyed, leading to geological disasters such as blowouts and collapses, which pollute the marine ecological environment [7,8,9,10]. In addition, methane produced by hydrate decomposition can cause a serious greenhouse effect [11,12,13,14]. Consequently, the exploration and development technology of natural gas hydrate is a research focus and hotspot [15,16,17,18,19]. During the exploitation of this unconventional and clean energy, it is significant to identify the position of the gas hydrate layer and to estimate the hydrate saturation in the near future, which requires the development of appropriate detection technology [20]. Drilling, coring, well logging are three commonly used tools in exploration for natural gas hydrates. However, drilling and coring are things of great difficulty due to the mentioned severe conditions. Hence, well logging is considered to be the priority method for effective exploration and quantitative description of gas hydrate-bearing sediments [21].
As one of the most effective gas hydrate detection methods, the acoustic well log has been studied by many researchers [22,23,24,25,26,27,28,29,30]. It can provide estimates of gas hydrate saturation in a continuous depth profile by using predictive models that relate the hydrate saturation to various parameters such as P- and S-wave velocities or attenuations.
Many models have been proposed for calculating the wave velocities in gas hydrate-bearing sediments such as Lee’s weight equation [31], K-T equation [32], cementation model [33], effective medium theory [34], Biot-Gassmann model [35] and Lee’s three-phase Biot equation [36]. Much work has been done to study the characteristics of gas hydrate-bearing sediments by using various models mentioned above. Priest et al. [37] used acoustic waves to test the distribution and content of hydrate in gas hydrate-bearing sediments, and analyzed the effect of hydrate saturation on velocity and attenuation amplitude. Zhang [38] and Zhang [39], etc., equalized the three-phase porous medium as a Biot two-phase medium, and studied the relationship between three-wave velocities and attenuations with frequency.
The above models to estimate hydrate saturation have their strengths and limitations. Though these models can estimate hydrate saturation to a certain extent, all of them simplify hydrate reservoirs that don’t agree with the real situation. To precisely predict the distribution of the hydrate and estimate the hydrate saturation, it’s necessary to establish a predictive petrophysical model of describing the acoustic characteristics of the gas hydrate. In fact, gas hydrate sediment is a typical three-phase porous medium, which is composed of a solid grain frame with a fluid (usually is water) and a solid coexist in pores. Leclaire [40] proposed the percolation theory based on Biot’s theory [41,42] and analyzed the wave propagation in frozen porous media (frozen soil or permafrost). However, Leclaire assumed that there was no direct contact between solid grains and ice. Carcione [43] proposed the Carcione–Leclaire model, considering the contact between two solids, and used the K-T theory to calculate the frame modulus of the ice. Both Carcione and Leclaire pointed out when waves propagate in porous media with two solid and one liquid, three compressional waves (one fast P wave and two slow P waves) and two shear waves (one fast S wave and one slow S wave) can be excited. Carcione–Leclaire model derives the phase velocities and attenuations of five waves in three-phase porous media, which explains the wave propagation better than other models. In practice, slow waves are difficult to be observed, but they slack off a part of the energy, which should not be ignored. Carcione neglects friction between two solids, which limits its practical application. Geurin et al. [44] defined the friction coefficient between two solids based on the drag coefficient calculated by Berryman and Wang [45]. Besides, Lee et al. [46] proposed a more straightforward and more effective method to calculate skeleton modulus by using two free parameters. The completeness of Carcione–Leclaire model was perfected by adding the expressions of these parameters into the model.
Herein, we propose an improved Carcione–Leclaire model aiming to analyze the wave characteristics in gas hydrate-bearing sediments and provide saturation estimation. We first discuss the sensitivities of velocities and attenuations of P1 and S1 to various parameters especially gas hydrate saturation. Further, the variation of phase velocities and attenuations of waves with frequency and gas hydrate saturation is emphatically studied. Then the effects of clay on wave propagation characteristics are analyzed in detail. Moreover, we test and verify the model using well log data from ODP Leg 164 Site 995B. We then estimate the hydrate saturation of ODP Leg 204 Site 1247B using the model. Finally, we compare different P-wave velocities of three models (effective medium model, three-phase Biot equation and the improved Carcione–Leclaire model), which is displayed in Appendix A and Appendix B.
2. Fundamental Theory
2.1. Improved Carcione–Leclaire Model
Based on Biot’s theory [41], the motion equation of three-phase porous media can be derived by using the Lagrange equation, which can be expressed in a matrix form:
where , , and are the matrices of mass densities, friction coefficients, rigidity and shear moduli, respectively, which are given by:
where denotes the displacement matrix. The superscripts s, w and h refer to solid grain, pore water and gas hydrate, respectively. The subscripts () in matrices refer to coupling or interaction between phases and . are the generalized mass densities. , and represent friction coefficients, 1, 2 and 3 refer to solid grain, pore water and gas hydrate, respectively:
where is the water viscosity, denotes the volume fraction of the water, and are the effective permeabilities of the solid grain frame and hydrate frame:
where is the porosity, is the volume fraction of the gas hydrate,
According to Berryman and Wang [45], the coefficient between solid grains and gas hydrate is defined as [44]:
where the value of the coefficient is determined, which was suggested by Guerin [44].
The matrices of rigidity and shear moduli can be expressed as:
where and ( = 1, 2, 3) are the bulk modulus and shear modulus of each phase, which are given by:
where , , and are the bulk modulus and shear modulus of the solid grain frame and hydrate frame, respectively, and are average moduli defined by:
where , , and are the consolidation coefficients of solid grains and gas hydrate defined according to the Biot theory:
In order to complete the three-phase model, it’s necessary to express the elastic moduli of the solid grain frame and gas hydrate frame. Lee et al. [22] express them as:
where and denote the apparent porosities, , , with . and refer to the free parameters. accounts for the support of hydrate to the frame. If is taken as 0, it implies the hydrate is completely in the form of solid skeleton, and if 1 is taken, it indicates the hydrate is completely suspended in the pores. has little influence on the calculation results and we take = 0.12, which was suggested by previous studies [46,47]. The consolidation coefficient indicates the cementation of the whole skeleton, which is a sediment-dependent parameter varying based on the properties of the gas hydrate reservoir, and has a certain effect on the theoretical calculation velocity [48]. can be calculated using the formula presented by Zhang [49]:
where is the frame shear modulus, is the density of the sediment, is the S-wave velocity, is the gas hydrate saturation.
2.2. Dispersion Equations
Applying the divergence and rotational operators to the motion equation (Equation (1)), the governing equations of compressional and shear waves can be obtained:
The displacement potential functions of compressional and shear waves are:
By substituting them into Equation (12), the governing equations of compressional and shear waves are:
Therefore, we can obtain the characteristic equation of the compressional waves:
where , , and are given by:
where:
Similarly, the dispersion equation of shear waves can be obtained:
where:
The velocities can be expressed as:
The attenuation factors can be written as:
We use the inverse quality factor to evaluate the attenuations of the waves, which can be written as:
where = P1, P2, P3, S1 and S2.
3. Model Parameters
According to the dispersion equations, there are three compressional and two shear waves propagating in gas hydrate-bearing sediments which can be labeled as P1, P2, P3, S1 and S2, respectively [50]. In this section, we discuss the influence of different parameters on P1 and S1 velocities and attenuations at different frequencies by calculating the sensitivity. The physical parameters of the gas hydrate-bearing sediment constituents are presented in Table 1.

Table 1.
Physical parameters of the model.
According to the description of the consolidation coefficient in Section 2.1, is related to the S-wave velocity, which is unknown in the process of the simulation. Hence, we consider a fixed when calculating the sensitivity and studying the wave propagation characteristics. The phase velocity of P1 as a function of gas hydrate saturation with different is shown in Figure 1. Two frequencies 100 Hz and 10 kHz are considered. It indicates that the consolidation coefficient has almost no effect on the trend of P1-velocity variation. Moreover, except for the case is 20, the P1 velocities obtained under the other three consolidation coefficients are in consistent. Thus, the consolidation coefficient is set to be 30 in the following numerical simulations [36,37].
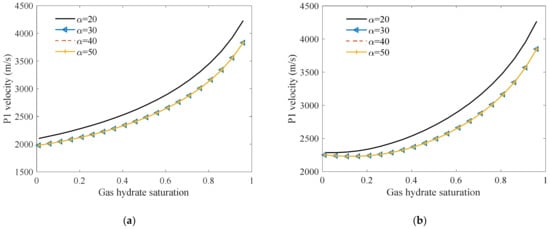
Figure 1.
The phase velocity of P1 as a function of gas hydrate saturation with different . Where the frequency is: (a) 100 Hz; (b) 10 kHz.
4. Sensitivity Analysis
The reservoir parameters have remarkable effects on the characteristics of the sediment. Sensitivity can be used to describe the influence of parameters on the phase velocity or attenuation at different frequencies. In this section, we discuss the sensitivities of phase velocities and attenuations of P1 and S1. The sensitivity can be expressed as [51]:
where represents the velocity, denotes the sensitivity, refers to the medium parameter. The sensitivity is greater or less than zero means that the velocity and attenuation increase or decrease as the variable increases.
Figure 2 shows the sensitivities of phase velocities and attenuations of P1 and S1 to hydrate saturation, porosity and three friction coefficients. Porosities of 40–80% fundamentally cover the scope observed in hydrate-bearing sediments [3]. Thus, consider the case that the basic values of the hydrate saturation and the porosity are both chosen to be 0.5. For P1 velocity, Figure 2a indicates that the sensitivity of P1 velocity to porosity and hydrate saturation is higher than that of the three friction coefficients. In particular, the increase of hydrate saturation increases the P1 velocity whereas the increase of porosity decreases the P1 velocity. Moreover, the friction coefficients have almost no effect on the P1 velocity. For P1 attenuation, the attenuation of P1 is the most sensitive to hydrate saturation, whereas less sensitive to friction coefficients especially the friction coefficient between solid grains and hydrate (Figure 2b). As can be observed in Figure 2c,d, the sensitivity of the velocity and attenuation of S1 to various parameters has the same trend as that of P1. It is worth noting that the sensitivities of phase velocities of P1 and S1 are independent of frequency to all parameters we considered in Figure 2a,c. Obviously, the attenuation of S1 to gas hydrate saturation is less sensitive than that of P1 (Figure 2b,d).
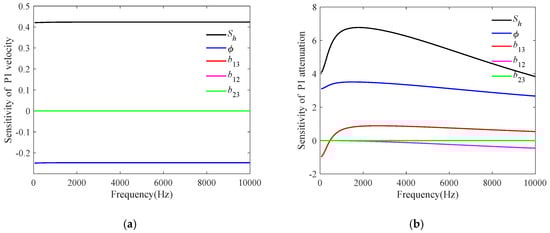
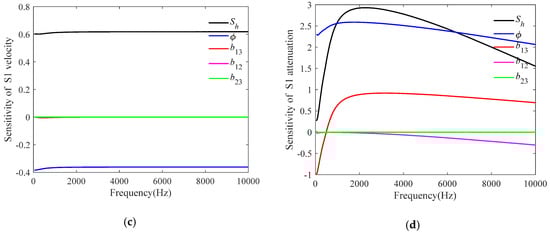
Figure 2.
The sensitivities of velocities and attenuations of P1 and S1 to various parameters. Different parameters are involved: gas hydrate saturation, porosity and three friction coefficients between different phases. is the friction coefficient between solid grains and gas hydrate; is the friction coefficient between solid grains and pore water; is the friction coefficient between pore water and gas hydrate: (a) P1 velocity; (b) P1 attenuation; (c) S1 velocity; (d) S1 attenuation.
These findings suggest that gas hydrate saturation is the main factor affecting the P1 and S1 velocities in gas hydrate-bearing sediments. Thus, we further investigated the sensitivities of velocities and attenuations of P1 and S1 to gas hydrate saturation as shown in Figure 3 with the porosity = 0.5. From Figure 3a,c, it can be seen that with the increase of gas hydrate saturation, the sensitivities of velocities of P1 and S1 to gas hydrate saturation increase, which are independent of frequency. As a consequence, the inversion by velocity is more reliable with higher gas hydrate saturation. As indicated in Figure 3b,d, the sensitivities of attenuations of P1 and S1 exhibit steep slopes. As the basic value of gas hydrate saturation increases, the sensitivities of attenuations of P1 and S1 decrease in the seismic band, but increase in the ultrasonic band at a fixed frequency. Besides, at a fixed saturation, the sensitivities of attenuations of P1 and S1 initially increase rapidly then decrease as frequency increases. Thus, the inversion by attenuation is more reliable in the seismic band especially for lower saturation, while more reliable in the acoustic logging band for higher saturation.
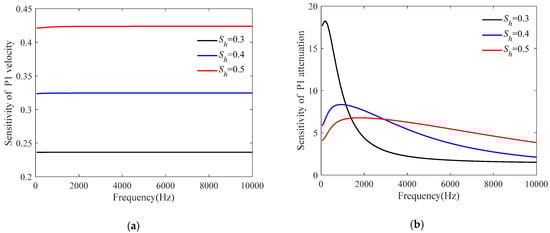
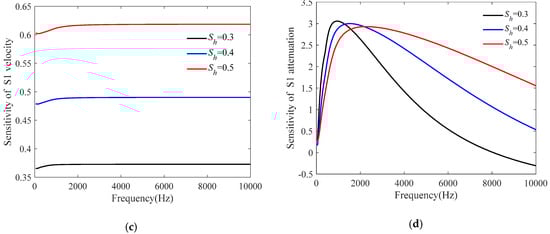
Figure 3.
The sensitivities of velocities and attenuations of P1 and S1 to hydrate saturation. Gas hydrate saturation of 0.3, 0.4 and 0.5 and porosity of 0.5 are considered: (a) P1 velocity; (b) P1 attenuation; (c) S1 velocity; (d) S1 attenuation.
5. Numerical Simulation Analysis
Based on the previous discussion, it is obvious that the phase velocities and attenuations of the P1 and S1 are the most sensitive to gas hydrate saturation. In this section, we discuss the phase velocities and attenuations of the five-wave modes versus frequency (especially in the seismic and acoustic logging band) and gas hydrate saturation in detail.
5.1. Influence of Frequency and Gas Hydrate Saturation
The calculated velocities of the five modes in gas hydrate-bearing sediments as functions of frequency and gas hydrate saturation are displayed in Figure 4. The sediment porosity in the model is chosen to be 50%. Other parameters are the same as those in the previous section. As indicated in Figure 4a,b, P1 and S1 propagate pretty fast, equivalent to the P and S waves in a single-phase elastic medium. Moreover, there is almost no dispersion of P1 and S1 in the seismic exploration (10–100 Hz) and acoustic logging (1–20 kHz) frequency range, the velocities of these two waves increase almost linearly with the increase of gas hydrate saturation. From Figure 4c–e, it can be seen that P2, P3, and S2 propagate slowly especially in the seismic band. This is because in the low-frequency range, the viscosity of pore fluid plays a major role in velocity, while the inertial force has more effect in the high-frequency range. Moreover, the three slow waves are dispersive in the low-frequency range including the seismic band, while there is almost no dispersion in the high-frequency range. At high frequency, the phase velocity of P2 initially decreases and then increases (Figure 4c) as the increase of hydrate saturation, while the phase velocity of S2 increases (Figure 4d), and the phase velocity of P3 increases at first and then decreases (Figure 4e). It is noteworthy that with the increase of hydrate saturation, the transition zones between low frequency and high frequency of P2, S2 and P3 move towards high frequency.
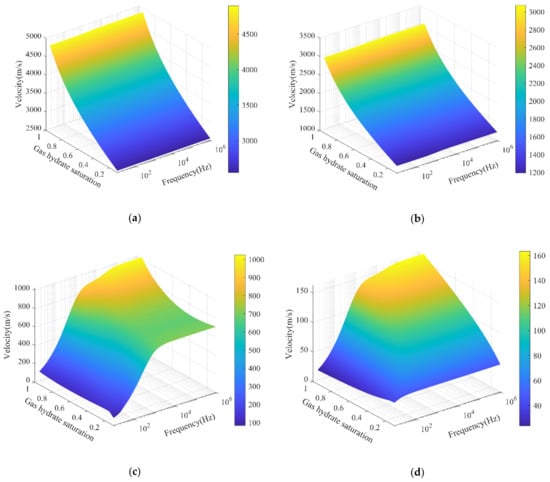
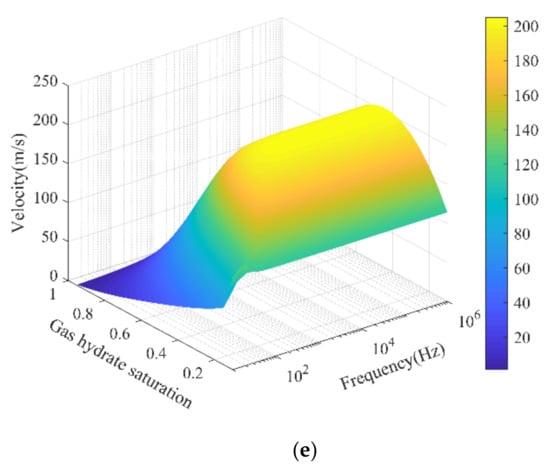
Figure 4.
Effects of frequency and hydrate saturation on the phase velocities of five waves: (a) P1; (b) S1; (c) P2; (d) S2; (e) P3.
As demonstrated in the previous sections, the attenuation characteristics of acoustic waves can be used to estimate the hydrate saturation. Figure 5 shows the computed attenuations of five body waves versus frequency and gas hydrate saturation at 50% porosity using the present model. For the cases of P1 and S1, as can be observed in Figure 5a,b, the attenuations of these two waves are minimal, both of them have attenuation peaks, and the attenuations of them initially increases, then decreases as frequency increases. Moreover, with the increase of hydrate saturation, the attenuation of P1 increases (Figure 5a), whereas that of S1 decreases at first but then increases (Figure 5b), which is consistent with the conclusion from the actual data [46]. For the cases of P2, S2 and P3, the three slow-wave attenuations are several orders of magnitude higher than attenuations of P1 and S1 (Figure 5c–e). Due to their slow propagation velocities and large attenuations in the seismic band, the three slow waves are difficult to be observed, which is similar to the slow-wave in Biot two-phase media. However, the three slow waves also carry part of the energy and decay quickly. Therefore, the effect of slow waves on attenuation should be considered when processing actual seismic data. With observations in Figure 4 and Figure 5, we can expect that gas hydrate saturation can be estimated using our improved model.
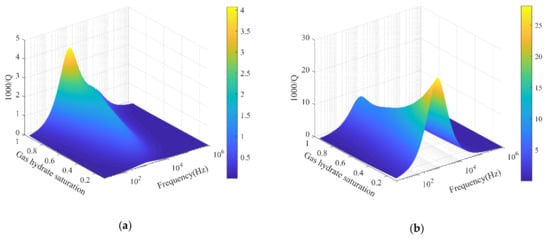
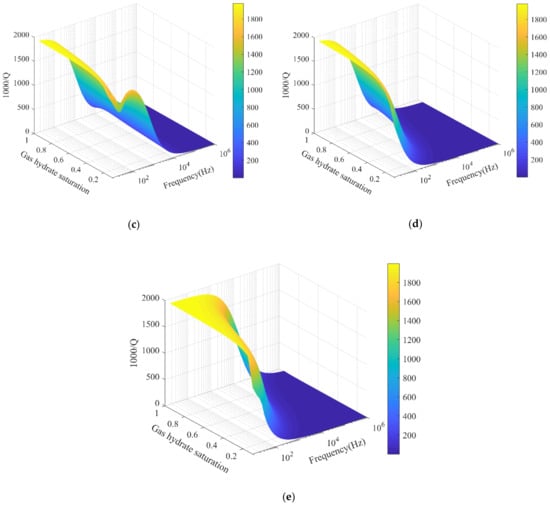
Figure 5.
Effects of frequency and hydrate saturation on the attenuations of five waves: (a) P1; (b) S1; (c) P2; (d) S2; (e) P3.
5.2. Influence of Clay
The solid grain frame in porous media is usually composed of more than one substance, tiny amounts of clay have certain effects on wave propagation [52]. Clay usually exists in hydrate-bearing sediments, the deposition of gas hydrate comes under the influence of lithology greatly [52,53]. When clay exists in the solid grain frame, the bulk modulus and shear modulus can be expressed according to the Voigt-Reuss-Hill (VRH) average [54]:
where and define bulk modulus and shear modulus of clay, represents the clay content in the solid grain frame. Generally, the clay content of a sand-rich reservoir with natural gas hydrate is small [34]. In this paper, a relationship between clay content and gas hydrate content is proposed, in which clay content is controlled within 20%:
Figure 6 shows the velocities and attenuations calculated for a hydrate formation with the porosity = 0.5. For velocity, since the presence of clay makes the shear modulus of the frame decrease, the phase velocities of P1 and S1 are lower due to the occurrence of clay (Figure 6a,b). This phenomenon can be validated in the experiments by Han [55]. The velocity of P2 is not sensitive to clay content in the seismic band but sensitive in the acoustic logging band (Figure 6c), whereas the velocities of S2 and P3 are almost unchanged (Figure 6e,f). For attenuation, the absence of clay decreases the attenuation of P1 (Figure 6a), but doesn’t change the attenuations of the other four waves (Figure 6b–e). Therefore, there is usually a certain amount of clay in the real hydrate reservoir, which has an impact on the phase velocity and attenuation that we should not neglect. The lack of clay will increase the saturation of inversion.
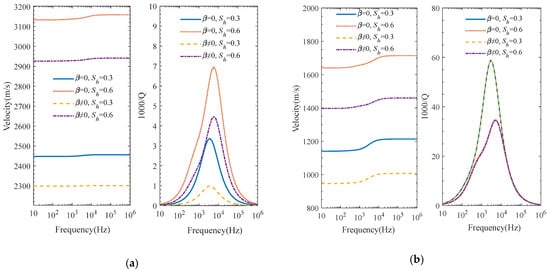
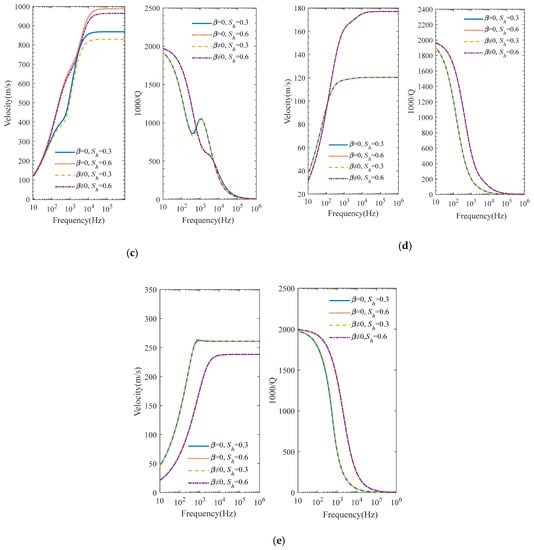
Figure 6.
Effects of clay on the velocities and attenuations of five waves. Gas hydrate saturation (Sh) of 0.3 and 0.6 are considered. Different saturations and clay contents are marked in the figures: (a) P1; (b) S1; (c) P2; (d) S2; (e) P3.
6. Application to Well Log Data
6.1. Model Validation
In this section, the effectiveness of the model can be verified by comparing the P1 velocity calculated by the improved Carcione–Leclaire model with the measured P-wave velocity of the Ocean Drilling Program (ODP) Leg 164 Site 955B. The leg found obvious BSR (Bottom Simulating Reflector) characteristic in the Black Ridge on the North American continental slope, and got hydrate samples. Note that, is a function of sediment density, shear modulus, S-wave velocity, porosity, hydrate saturation and free parameter . has little influence on the calculation results and we take = 0.12, which was suggested by previous studies [46,47]. The S-wave velocity and porosity can be got from well log, while the hydrate saturation information can be obtained by pore water chlorinity measurement and methane content from pressure cores. Thus, the consolidation coefficient of each location can be calculated using Equation (11).
The comparison between P1 velocity predicted by the theory in this paper and the actual acoustic well log data measured at the ODP Leg 164 Site 955B is shown in Figure 7. The red dots represent the velocities calculated using the proposed model and the blue curve is the actual well log curve. The frequency is 20 kHz. The parameters used to calculate the consolidation coefficient are listed in Table 2. Figure 7 and Table 2 indicate that velocities calculated using the improved Carcione–Leclaire model fit well with the observed velocities. In particular, the maximum error between P1 velocities calculated by the model and P-wave velocities obtained by actual logging is 3.5%, and the average error of them is 1.6%. It indicates the theoretical model proposed in this paper has been proven to be effective. The difference could be partly due to the inaccurate sediment constituents used here. With observations in Figure 7, we can expect that P-wave velocity can be predicted according to this model for where it is missing. Conversely, the model can also be used to evaluate the logging data and estimate gas hydrate saturation. However, the densities and modulus used in our calculation are from the previous study [44], which will produce a certain error in the result. If we can get the composition of sediment and the content of each component accurately, the result will be more accurate and convincing.
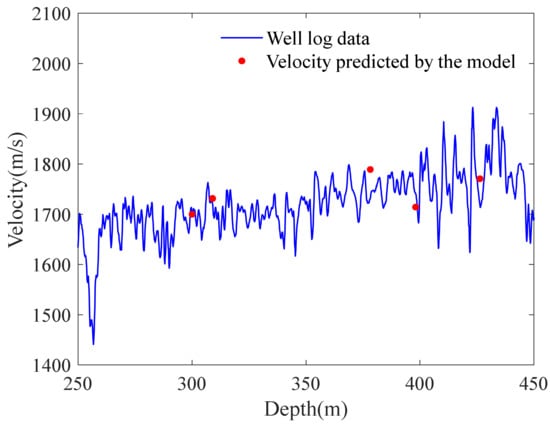
Figure 7.
Comparison between the acoustic well log velocities and theoretically predicted velocities at ODP Leg 164 Site 995B.
Table 2.
Measured data and P-wave predicted by the model.
6.2. Inversion of Hydrate Saturation
According to the analysis of ODP Leg 164 Site 955B, our proposed model can be used to quantitatively estimate the hydrate saturation of gas hydrate-bearing sediments using actual log data including the measured P-wave velocity and porosity information of ODP Leg 204 Site 1247B. The site is located on the west coast of Oregon in the Western Pacific Ocean of the United States, where there is a famous “Hydrate Ridge”, which contains plenty of methane hydrate. Figure 8 shows the hydrate distribution calculated based on the improved Carcione–Leclaire model and acoustic logging data. The physical parameters used in the theoretical calculation are shown in Table 1, and the frequency selected in our calculation is 20 kHz. The most direct method is to deduce the calculation formula of hydrate saturation first, and then calculate the hydrate saturation by combining the measured velocity and porosity data. However, there is a certain degree of difficulty to solve the analytical solution of the gas hydrate saturation. Thus, the numerical solution is used to calculate the hydrate saturation in this section. First, we computed consolidation coefficients with various hydrate saturations from Equation (11), which used the measured S-wave velocities and porosities. Then the P-wave velocities are obtained by numerical calculation using our proposed model. When the calculated P-wave velocity is the same as the measured data, the hydrate saturation value used is the estimated saturation of the position. Figure 8 indicates that about 100–130m below the seafloor of Site 1247B is a hydrate-bearing layer, which is consistent with the analysis by Kuang [53]. The hydrate saturation of this layer is estimated as 0–27%, the upper limit is slightly higher than that estimated by Kuang. Further, the average saturation is calculated as 7.2%.
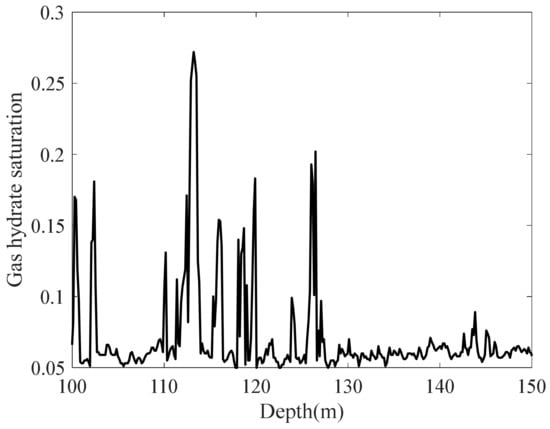
Figure 8.
Gas hydrate saturation estimated by the improved Carcione–Leclaire model.
7. Conclusions
In this paper, an improved Carcione–Leclaire model is proposed to study wave propagation characteristics in gas hydrate-bearing sediments. The sensitivities of velocities and attenuations of P1 and S1 to various parameters especially gas hydrate saturation are discussed in detail. Further, the variation of phase velocities and attenuations of waves with frequency and gas hydrate saturation is emphatically studied. Moreover, the effects of clay on wave propagation characteristics are analyzed. Furthermore, we compared the velocity of P1 predicted by the model with the well log data from the Ocean Drilling Program (ODP) Leg 164 Site 995B to verify the applicability of the model. The findings are listed below:
- (1)
- Both velocities and attenuations of P1 and S1 are sensitive to gas hydrate saturation, especially attenuation. Furthermore, P1 and S1-velocity sensitivity to gas hydrate saturation increase when the basic value of gas hydrate saturation increases, and it is frequency independent. In the seismic band, P1 and S1-attenuation sensitivity decrease as the basic value of gas hydrate saturation increases while increases with the increase of frequency; In the ultrasonic band, P1 and S1-attenuation sensitivity increases with the increase of the basic value of gas hydrate saturation and decreases with the increase of frequency. Therefore, the smaller the gas hydrate saturation at low frequencies as well as the larger the gas hydrate saturation at high frequencies, the more reliable the inversion.
- (2)
- The numerical results show comprehensive relations of the velocity and attenuation with gas hydrate saturation and frequency. P1 and S1 are equivalent to P- and S-waves in single-phase elastic media which have almost no dispersion in the seismic band, while the velocities of them increase almost linearly as gas hydrate saturation increases. In the seismic band, P2, S2, and P3 are dispersive, and the attenuations are significant. In the ultrasonic band, however, P2, S2, and P3 are nondispersive and the attenuations are low. Besides, with the increase of gas hydrate saturation, the velocity of P2 initially decreases and then increases, the velocity of S2 increases, and the velocity of P3 initially increases and then decreases. Moreover, clay reduces the velocities of P1 and S1 significantly but has almost no effect on phase velocities of S2 and P3. The phase velocity of P2 is not sensitive to clay content in the seismic band, but sensitive in the ultrasonic band. The attenuations of the waves are not sensitive to clay except for P1.
- (3)
- The velocities calculated by the improved Carcione–Leclaire model agrees well with the measured velocities at the ODP 164 voyage Site 955B. This indicates that the gas hydrate saturation can be predicted by P1 velocity, which provides a theoretical basis for the quantitative estimation of gas hydrate. We also used the model to identify the hydrate layer and estimate the hydrate saturation at ODP Leg 204 Site 1247B.
The numerical simulations and field data analysis in this paper show that the wave velocity and attenuation characteristics are closely related to gas hydrate saturation, which can be used to estimate gas hydrate content. It also provides a potential for further applications in the evaluation of gas hydrate content via wave attenuation.
Author Contributions
The original idea was contributed by L.L. The manuscript preparation and simulation parts were finished by L.L. The follow-up guidance was given by X.Z. The supervisors of L.L. are X.W. and X.Z. The manuscript was improved and perfected by X.Z. and X.W. All authors have approved the publication of the paper. All authors have read and agreed to the published version of the manuscript.
Funding
This research was funded by the National Natural Science Foundation of China (Grant Nos. 11974018, 11734017) and the Strategic Pilot and Technology Special of Chinese Academy of Sciences, China (Grant No. XDA14020303) and the Research Instrument and Equipment Development Project of Chinese Academy of Sciences-Key Technology Team Project (Grant No. GJJSTD20210008).
Institutional Review Board Statement
Not applicable.
Informed Consent Statement
Not applicable.
Data Availability Statement
Not applicable.
Acknowledgments
This paper is based on the well logging data published by Ocean Drilling Program Legs 164 and 204. We are grateful to all staff of the ODP Legs 164 and 204.
Conflicts of Interest
The authors declare no conflict of interest.
Abbreviations
List of Symbols
| friction coefficient between the solid grain frame and pore water | |
| friction coefficient between the solid grain frame and gas hydrate | |
| friction coefficient between the pore water and gas hydrate | |
| volume fraction of solid grain | |
| volume fraction of pore water | |
| volume fraction of gas hydrate | |
| solid grain density | |
| water density | |
| gas hydrate density | |
| water viscosity | |
| permeability of solid-grain frame | |
| permeability of gas–hydrate frame | |
| solid grain bulk modulus | |
| water bulk modulus | |
| gas hydrate bulk modulus | |
| bulk modulus of the gas hydrate frame | |
| bulk modulus of the solid grain frame | |
| solid grain shear modulus | |
| gas hydrate shear modulus | |
| shear modulus of the gas hydrate frame | |
| shear modulus of the solid grain frame | |
| solid grain consolidation | |
| solid grain consolidation | |
| gas hydrate consolidation | |
| gas hydrate consolidation | |
| tortuosity for water flowing through the solid grain frame | |
| tortuosity for water flowing through the gas hydrate | |
| tortuosity for solid grain flowing through the gas hydrate | |
| tortuosity for gas hydrate flowing through the solid grain |
Appendix A
The effective bulk and shear moduli of the dry frame [32] can be expressed as:
where denotes the critical porosity, = 0.36. The case is considered In our study due to the hydrate-bearing sediments. n is the average number of contacts per grain in the critical porosity state and n = 8.5 [32]. and represent the bulk and shear moduli of the sphere in the case of critical porosity. refers to the effective pressure, and are the densities of the sediment and water, respectively. g denotes the gravity acceleration, D represents the depth below the seafloor. v is the Poisson’s ratio, which is related to bulk and shear moduli of the solid phase, . The bulk and shear moduli of the solid phase can be written as
where m represents the number of constituents and denotes the volume fraction of component i. The bulk and shear moduli of sediment are calculated according to Gassmann equation [56]:
The P-wave velocity can be expressed as:
For non-contacting effective medium theory (EMT), gas hydrate floats in pores, it only changes the elastic properties of pore fluid but does not affect the frame properties. The effective bulk modulus of pore fluid is given by:
For cementing EMT, hydrate is part of the frame, which reduces the original porosity, the porosity becomes , The modified bulk and shear moduli of effective minerals are given by:
Besides, the natural gas hydrate is a component of minerals, the volume fraction of which can be expressed as:
The three-phase Biot equation by Lee (TPBEL) is suitable for the calculation of velocity at low frequency, the P-wave velocity is given by [36]:
where and are explained in Section 2.1.
Appendix B
EMT and TPBEL (see Appendix A) have been widely used to analyze the relationship between phase velocities and various parameters such as gas hydrate saturation [3,25,39,47]. In EMT, three microscopic modes of gas hydrate exist in hydrate-bearing sediments: hydrate is a pore fluid, which is called non-contacting EMT; gas hydrate cements sediment grains, which is named cementing EMT; hydrate contacts with sediment grains. A study has shown that non-contacting EMT and cementing EMT are major patterns of hydrate formation and decomposition [57]. Thus, we explore the variation of P-wave velocities (P1 in the improved Carcione–Leclaire model) with gas hydrate saturation in different models. As indicated in Figure A1, P-wave velocities calculated in TPBEL and improved Carcione–Leclaire model are obviously higher than two EMT patterns. Moreover, there is reasonable concordance between the P-wave velocities of TPBEL and the improved Carcione–Leclaire model at low frequency. However, at high frequency, when the hydrate saturation lower than 0.26 or higher than 0.71, the velocities predicted by the improved Carcione–Leclaire model are higher than those calculated by TPBEL. Figure A2 shows the variation of P-wave velocities with gas hydrate saturation in TPBEL and the improved Carcione–Leclaire model. The frequency has no effect on the velocities of TPBEL and EMT, but influence a little on the velocity of the improved Carcione–Leclaire model when the hydrate saturation lower than 0.26 or higher than 0.71. Thus, due to the TPBEL and EMT simplified the gas hydrate-bearing sediments, there is some error in the velocities of these models.

Figure A1.
Variation of P-wave velocities with gas hydrate saturation in different models: (a) 100 Hz; (b) 20 kHz.

Figure A2.
Variation of P-wave velocities with gas hydrate saturation in TPBEL and improved Carcione–Leclaire model (ICLM) with four frequencies: (a) gas hydrate saturation ranges from 0 to 1; (b) gas hydrate saturation ranges from 0.7 to 1.
References
- Ruppel, C. Tapping methane hydrates for unconventional natural gas. Elements 2007, 3, 193–199. [Google Scholar] [CrossRef]
- Liu, T.; Liu, X.; Zhu, T. Joint analysis of P-wave velocity and resistivity for morphology identification and quantification of gas hydrate. Mar. Pet. Geol. 2019, 112, 104036–104048. [Google Scholar] [CrossRef]
- Boswell, R. Is gas hydrate energy within reach? Science 2009, 325, 957–958. [Google Scholar] [CrossRef] [PubMed]
- Chong, Z.R.; Yang, S.H.B.; Babu, P.; Linga, P.; Li, X.S. Review of natural gas hydrates as an energy resource. prospects and challenges. Appl. Energy 2016, 162, 1633–1652. [Google Scholar] [CrossRef]
- Milkov, A.V. Global estimates of hydrate-bound gas in marine sediments: How much is really out there? Earth Sci. Rev. 2004, 66, 183–197. [Google Scholar] [CrossRef]
- Milkov, A.V.; Sassen, R. Economic geology of offshore gas hydrate accumulations and provinces. Mar. Pet. Geol. 2002, 19, 1–11. [Google Scholar] [CrossRef]
- Sultan, N.; Cochonat, P.; Foucher, J.P.; Mienert, J.; Sejrup, H.P. Effect of gas hydrates melting on seafloor slope instability. Mar. Geol. 2004, 213, 379–401. [Google Scholar] [CrossRef]
- Archer, D.; Buffett, B. Time-dependent response of the global ocean clathrate reservoir to climatic and anthropogenic forcing. Geochem. Geophys. Geosyst. 2005, 6, 187–200. [Google Scholar] [CrossRef]
- Brown, H.E.; Holbrook, W.S.; Hornbach, M.J.; Nealon, J. Slide structure and role of gas hydrate at the northern boundary of the Storegga Slide, offshore Norway. Mar. Geol. 2006, 229, 179–186. [Google Scholar] [CrossRef]
- Boswell, R.; Collett, T.S. Current perspectives on gas hydrate resources. Energy Environ. Sci. 2011, 4, 1206–1215. [Google Scholar] [CrossRef]
- Archer, D. Methane hydrate stability and anthropogenic climate change. Biogeoscience 2007, 4, 521–544. [Google Scholar] [CrossRef]
- Nixon, M.F.; Grozic, J.L. Submarine slope failure due to gas hydrate dissociation: A preliminary quantification. Can. Geotech. J. 2007, 44, 314–325. [Google Scholar] [CrossRef]
- Gu, G.; Dickens, G.R.; Bhatnagar, G.; Colwell, F.S.; Hirasaki, G.J.; Chapman, W.G. Abundant early Palaeogene marine gas hydrates despite warm deep-ocean temperatures. Nat. Geosci. 2011, 4, 848–851. [Google Scholar] [CrossRef]
- Ruppel, C.D. Methane hydrates and contemporary climate change. Nat. Educ. Knowl. 2011, 3, 29. [Google Scholar]
- Sadeq, D.; Alef, K.; Iglauer, S.; Lebedev, M.; Barifcani, A. Compressional wave velocity of hydrate-bearing bentheimer sediments with varying pore fillings. Int. J. Hydrog. Energy 2018, 43, 23193–23200. [Google Scholar] [CrossRef]
- Yan, C.L.; Cheng, Y.F.; Li, M.L. Mechanical experiments and constitutive model of natural gas hydrate reservoirs. Int. J. Hydrog. Energy 2017, 42, 19810–19818. [Google Scholar] [CrossRef]
- Yan, C.L.; Ren, X.; Cheng, Y.F.; Song, B.J.; Li, Y.; Tian, W. Geomechanical issues in the exploitation of natural gas hydrate. Gondwana Res. 2020, 81, 403–422. [Google Scholar] [CrossRef]
- Wang, X.J.; Wu, S.G.; Liu, X.W. Factors affecting the estimation of gas hydrate and free gas saturation. Chin. J. Geophys. 2006, 49, 504–511. [Google Scholar] [CrossRef]
- Wang, X.J.; Wu, S.G.; Liu, X.W. Estimation of gas hydrate saturation based on resistivity logging and analysis of estimation error. Geoscience 2010, 24, 993–999. [Google Scholar]
- Wang, X.H.; Xu, Q.; He, Y.N.; Wang, Y.F.; Sun, Y.F.; Sun, C.Y.; Chen, G.J. The acoustic properties of Sandy and Clayey hydrate-bearing sediments. Energies 2019, 12, 1825–1836. [Google Scholar] [CrossRef]
- Ding, J.P.; Cheng, Y.F.; Deng, F.C.; Yan, C.L.; Sun, H.; Li, Q.C.; Song, B.J. Experimental study on dynamic acoustic characteristics of natural gas hydrate sediments at different depths. Int. J. Hydrog. Energy 2020, 45, 26877–26889. [Google Scholar] [CrossRef]
- Lee, M.W.; Waite, W.F. Estimating pore-space gas hydrate saturations from well log acoustic data. Geochem. Geophys. Geosyst. 2008, 9, Q07008. [Google Scholar] [CrossRef]
- Malinverno, A.; Kastner, M.; Torres, M.E.; Wortmann, U.G. Gas hydrate occurrence from pore water chlorinity and downhole logs in a transect across the northern Cascadia margin (Integrated Ocean Drilling Program Expedition 311). J. Geophys. Res. Solid Earth 2008, 113, B08103. [Google Scholar] [CrossRef]
- Wang, X.J.; Wu, S.G.; Lee, M.; Guo, Y.Q.; Yang, S.X.; Liang, J.Q. Gas hydrate saturation from acoustic impedance and resistivity logs in the Shenhu area, south China sea. Mar. Pet. Geol. 2011, 28, 1625–1633. [Google Scholar] [CrossRef]
- Liang, J.; Wang, M.J.; Lu, J.A.; Wang, H.B.; Liang, J.Q.; Su, P.B. Logging response characteristics of gas hydrate formation in Shenhu area of the South China Sea. Geoscience 2010, 24, 506–514. [Google Scholar]
- Cacione, J.M.; Gei, D. Gas-hydrate concentration estimated from P- and S-wave velocities at the Mallik 2L-38 research well, Mackenzie Delta. J. Appl. Geophys. 2014, 56, 73–78. [Google Scholar] [CrossRef]
- Fang, Y.L.; Liu, C.L.; Zhao, S.J.; Hu, G.W. Acoustictesting technique for gas hydrate. Pet. Instrum. 2014, 28, 68–71. [Google Scholar]
- Zhang, J. Experimental Study on the Relationship between Gas Hydrate Saturation and Acoustic Velocities in Porous Media. Master’s Thesis, Ocean University of China, Qingdao, China, 2008. [Google Scholar]
- Liu, L.; Jiang, G.S.; Ning, F.L.; Yu, Y.B.; Zhang, L.; Tu, Y.Z. Well logging in gas hydrate-bearing sediment: A review. Adv. Mater. Res. 2012, 524–527, 1660–1670. [Google Scholar] [CrossRef]
- Zhao, S.J.; Xu, M.; Li, S.S. Gas hydrate physical property analysis and test technology. Pet. Instrum. 2013, 27, 1–5. [Google Scholar]
- Lee, M.W.; Hutchinson, D.R.; Collett, T.S.; Dillon, W.P. Seismic velocities for hydrate-bearing sediments using weighted equation. J. Geophys. Res. 1996, 101, 20347–20358. [Google Scholar] [CrossRef]
- Zimmerman, R.W.; King, M.S. The effect of the extent of freezing on seismic velocities in unconsolidated permafrost. Geophysics 1986, 51, 1285–1290. [Google Scholar] [CrossRef]
- Ecker, C.; Dvorkin, J.; Nur, A. Sediments with gas hydrates: Internal structure from seismic AVO. Geophysics 1998, 63, 1659–1669. [Google Scholar] [CrossRef]
- Helgerud, M.B.; Dvorkin, J.; Nur, A.; Sakai, A.; Collett, T. Elastic-wave velocity in marine sediments with gas hydrates: Effective medium modeling. Geophys. Res. Lett. 1999, 26, 2021–2024. [Google Scholar] [CrossRef]
- Lee, M.W. Modified Biot-Gassmann theory for calculating elastic velocities for unconsolidated and consolidated sediments. Geophysics 2002, 23, 403–412. [Google Scholar] [CrossRef]
- Lee, M.W. Models for Gas Hydrate-Bearing Sediments Inferred from Hydraulic Permeability And Elastic Velocities; Scientific Investigations Report 2008-5219; U.S. Geological Survey: Reston, VA, USA, 2008. [Google Scholar]
- Priest, J.A.; Clayton, C.R.I. Seismic Properties of Methane Gas Hydrate-Bearing Sand. In Proceedings of the 5th International Conference on Gas Hydrate, Miami, FL, USA, 13–16 June 2005; pp. 440–447. [Google Scholar]
- Zhang, Y.W.; Liu, X.W.; Jin, Y.J. Study of velocity and attenuation for gas-bearing hydrate formation. Oil Geophys. Prospect. 2004, 39, 205–214. [Google Scholar]
- Zhang, R.W.; Li, H.Q.; Wen, P.F.; Zhang, B.J. The velocity dispersion and attenuation of marine hydrate-bearing sediments. Chin. J. Geophys. 2016, 59, 3417–3427. [Google Scholar]
- Leclaire, P.; Cohen-Tenooudji, F.; Puente, J. Extension of Biot’s theory of wave propagation to frozen porous media. J. Acoust. Soc. Am. 1994, 96, 3753–3768. [Google Scholar] [CrossRef]
- Biot, M.A. Mechanics of deformation and acoustic propagation in porous media. J. Apply. Phys. 1962, 33, 1482–1498. [Google Scholar] [CrossRef]
- Biot, M.A. Generalized theory of acoustic propagation in porous dissipative media. J. Acoust. Soc. Am. 1962, 34, 1254–1264. [Google Scholar] [CrossRef]
- Carcione, J.M.; Seriani, G. Wave simulation in frozen porous media. J. Comput. Phys. 2001, 170, 676–695. [Google Scholar] [CrossRef]
- Guerin, G.; Goldberg, D. Modeling of acoustic wave dissipation in gas hydrate-bearing sediments. Geochem. Geophys. Geosyst. 2005, 6, 1–16. [Google Scholar] [CrossRef]
- Berryman, J.G.; Wang, H.F. Elastic wave propagation and attenuation in a double-porosity dual-permeability medium. Int. J. Rock Mech. Min. Sci. 2000, 37, 63–78. [Google Scholar] [CrossRef]
- Lee, M.W. Velocities and Attenuations of Gas Hydrate-Bearing Sediments; Scientific Investigations Report 2007-5264; U.S. Geological Survey: Reston, VA, USA, 2007. [Google Scholar]
- Lin, L.; Liang, J.; Guo, Y.Q.; Lu, J.A.; Liang, J.Q. Estimating saturation of gas hydrates within marine sediments using sonic log data. Well Logging Technol. 2014, 38, 234–238. [Google Scholar]
- Pride, S.R.; Berryman, J.G.; Harris, J.M. Seismic attenuation due to wave-induced flow. J. Geophys. Res. Solid Earth 2004, 109, 1–19. [Google Scholar] [CrossRef]
- Zhang, L. Research on the Geophysical Well-Logging Evaluation of the Gas Hydrate Bearing Sediment Using the Modified Three-Phase Biot Equation. Ph.D. Thesis, China University of Geosciences (Beijing), Beijing, China, 2015. [Google Scholar]
- Liu, L.; Zhang, X.M.; Wang, X.M. Theoretical analysis and numerical simulation of acoustic waves in gas hydrate-bearing sediments. Chin. Phys. B 2021, 20, 1–11. [Google Scholar]
- Cheng, C.H.; Toksöz, M.N.; Willis, M.E. Determination of in situ attenuation from full waveform acoustic logs. J. Geophys. Res. 1982, 87, 5477–5484. [Google Scholar] [CrossRef]
- Dvorkin, J.; Uden, R. Seismic wave attenuation in a methane hydrate reservoir. Lead. Edge 2004, 23, 730–732. [Google Scholar] [CrossRef]
- Kuang, D.H.; He, B.; Wang, D.K. Logging evaluation of gas hydrate at leg 204 of ODP in hydrate ridge. Sci. Technol. Inf. 2013, 17, 1–3. [Google Scholar]
- Hill, R. The elastic behavior of a crystalline aggregate. Proc. Phys. Soc. 1952, A65, 34–354. [Google Scholar]
- Han, D.H.; Nur, A.; Morgan, D. Effects of porosity and clay content on wave velocities in sandstones. Geophysics 1986, 51, 2093–2107. [Google Scholar] [CrossRef]
- Gassmann, F. Elasticity of porous media. Vierteljahrsschriift Der Naturaforschenden Gesselschaft 1951, 96, 1–23. [Google Scholar]
- Hu, G.W.; Li, C.F.; Ye, Y.G.; Liu, C.L.; Zhang, J.; Diao, S.B. Observation of gas hydrate distribution in sediment pore space. Chin. J. Geophys. 2014, 57, 1675–1682. [Google Scholar]
Publisher’s Note: MDPI stays neutral with regard to jurisdictional claims in published maps and institutional affiliations. |
© 2021 by the authors. Licensee MDPI, Basel, Switzerland. This article is an open access article distributed under the terms and conditions of the Creative Commons Attribution (CC BY) license (http://creativecommons.org/licenses/by/4.0/).