Abstract
Balancing energy demand and supply will become an even greater challenge considering the ongoing transition from traditional fuel to electric vehicles (EV). The management of this task will heavily depend on the pace of the adoption of light-duty EVs. Electric vehicles have seen their market share increase worldwide; the same is happening in Portugal, partly because the government has kept incentives for consumers to purchase EVs, despite the COVID-19 pandemic. The consequent shift to EVs entails various challenges for the distribution network, including coping with the expected growing demand for power. This article addresses this concern by presenting a case study of an area comprising 20 municipalities in Northern Portugal, for which battery electric vehicles (BEV) sales and their impact on distribution networks are estimated within the 2030 horizon. The power required from the grid is estimated under three BEV sales growth deterministic scenarios based on a daily consumption rate resulting from the combination of long- and short-distance routes. A Monte Carlo computational simulation is run to account for uncertainty under severe EV sales growth. The analysis is carried out considering three popular BEV models in Portugal, namely the Nissan Leaf, Tesla Model 3, and Renault Zoe. Their impacts on the available power of the distribution network are calculated for peak and off-peak hours. The results suggest that the current power grid capacity will not cope with demand increases as early as 2026. The modeling approach could be replicated in other regions with adjusted parameters.
1. Introduction
EU legislation targets are to cut CO2 emissions from cars by 37.5% by 2030 [1]. Currently, the transport sector is a significant contributor to greenhouse gas emissions. An increase in the uptake of electric vehicles could contribute to the EU’s policy objective of reducing greenhouse gas emissions from transports. Globally, low-carbon and sustainable energy actions are already underway, including electric mobility (e-mobility) initiatives, aiming to boost the transition to low (and zero)-emission vehicles. Electric vehicles represent a promising solution that meets the environmental goals for global sustainable development in terms of reducing local air pollution and addressing climate change.
Stricter emission regulations, lower battery costs, widely available charging stations, and increasing consumer acceptance will create new and strong momentum for market penetration of electrified vehicles in the coming years. Without exception, the present technical and economic studies predict a progressive replacement of internal combustion engine vehicles with EVs in the years to come.
Today the market offers several types of EVs that may be classified according to their propulsion systems and energy sources, including battery electric vehicles (BEVs), hybrid electric vehicles (PHEVs), plug-in hybrid electric vehicles, and extended-range electric vehicles [2,3]. In the future, other solutions may be available, including adding a fuel cell range extender to electric vehicles [4]; among other impacts, this approach might reduce the so-called range anxiety and affect vehicles owners’ behavior. EVs rely on plug-in electricity, requiring a home charging point. They take electricity from the distribution grid and store it in rechargeable batteries that power the electric motor. Therefore, an affordable charge infrastructure is essential for the widespread adoption of EVs [5].
Several scientific works have been published, disseminating strategies and methodologies for analyzing and assessing the batteries’ behaviors [6,7]. The studies’ focus ranges from the maximization of the battery operation itself to the minimization of environmental impacts. They present significant results to minimize load peaks, flatten the load profile, and maximize the integration of renewables [8,9].
Several researchers have explored EV charging activities and their impacts on residential and distribution networks [10,11]. In addition, the impact of EV charging was validated in downtown Manhattan by assessing the effect on the distribution grid [12].
At the regional level, the charging of EVs can significantly increase electricity loads, causing possible negative impacts on distribution networks (e.g., cables and distribution transformers), especially for high-power charging [13]. The charging of residential EVs results in a significant increase in household electricity consumption that may exceed the maximum power supported by the distribution system itself. The situation can be worsened during times of high electricity utilization, such as peak hours or extreme days.
The distribution grid will have to carry out interventions and upgrades to manage the new and progressively increasing heavy energy load. To solve the technical constraints and understand how the network will withstand the increasing penetration of EVs, Mancini [14] developed urban and rural grid models to highlight the differences between the impacts on high- and low-density networks.
Although the transition to EVs is inevitable, their massive penetration will undoubtedly impact energy system management. Forecasting energy consumption helps to prepare for appropriate supply. In the literature, one can find forecasting models [15] that use five-year energy consumption data from a specific region and use the grey fractional model to analyze the next six years. Other forecasting methods have been studied, showing different requirements for raw data [16,17].
From technical and cybersecurity concerns to economic and social impacts, many issues have been addressed by several researchers, such as Ceballos Delgado [18], Das [19], and Jiang [20]. Other studies have already considered the consequences of a high EV penetration into the electricity market [21,22] in terms of the additional electrical load and surges in demand during peak hours. Anastasiadis [23] addressed the security of the distribution grids, while Khalid [24] analyzed problems related to power quality and reliability. Some authors have presented methodologies to limit the maximum power extracted from the grid to recharge EVs [25,26]. However, in the future, the integration of vehicle-to-grid (V2G) technology and smart grid charging may help address grid congestion and maintain the reliability and security of the power supply [27,28].
EV sales growth is a reality all over the world [29], driven by macroeconomic factors on which the development of battery technology and charging accessibility depend. At present, the purchase of an EV is not yet within everyone’s financial reach, due to factors such as the high initial cost, battery degradation, and inadequate charge infrastructure [30]. Therefore, the evolution of EVs will largely depend on social and macroeconomic factors (including the rise of the global consumer middle class) and new mobility services such as car-sharing and e-hailing [31]. Currently, public financial incentives, such as reduced road and vehicle acquisition taxes, still directly impact BEV sales [32]. Norway is an example of the use of incentives aiming at massive electric vehicle adoption; the country has exempted BEVs from registration taxes since 1991 and from value-added tax since 2001; has waived tolls and ferry and parking fees for BEV owners since the late 1990s; and BEV drivers are allowed to use bus lanes and pay reduced company car taxes [33]. In 2020, BEVs accounted for 51.6% and PHEVs for 22.9% of Norway’s passenger car sales [34]. Despite incentives, Norway had excellent conditions to adopt electric vehicles—a wealthy population, cheap hydroelectric energy, and high home charging availability, which are prerequisites that are unlikely present in most countries [33]. Today, Norway is dealing with more investment in public charging capacity, namely in regions with low EV density (raising charger placement issues).
Nevertheless, price reductions in further electric vehicles and business models such as car leases may enable people with no available capital to purchase electric vehicles. Additionally, the smart charging concept is worth mentioning, which refers to all intelligent technologies enabling a car to be charged at the best possible moment, thereby reducing the local grid congestion. In addition, residential smart charging could also smooth the integration of BEVs in the grid and could provide financial benefits to drivers, thereby reducing ownership costs [32].
E-mobility has reached a point of no return. As more models become available and prices decrease, EV purchases will increase, reaching a broader range of the vehicle-owning population, which should encompass more than 10% of sales by 2025 and 20–30% of sales by 2030 [35]. The current production forecast [36] reveals that car producers are expected to manufacture more EVs in the EU than necessary to comply with the minimum requirements of the EU CO2 emission reduction standards. The share of EVs in car production in 2025 will be around 22% if carmakers follow the current vehicle production forecast, which is higher than the average 15% EV sales share needed.
The EV market in Portugal is also evolving at a fast pace. In 2020, the total number of BEV passenger cars circulating was 36,882, while PHEVs reached 27,710 units; combined, PEV and BEV cars represented a little over 1% of the national car fleet [37,38,39], which was over 5.5 million cars in 2020 (Table 1). Figure 1 displays the total number of BEV and PHEV passenger cars registered between 2015 and 2020 and their respective percentages relative to the total national fleet (including all types of cars).

Table 1.
Portugal’s total passenger car sales and fleet between 2015 and 2020 [37].
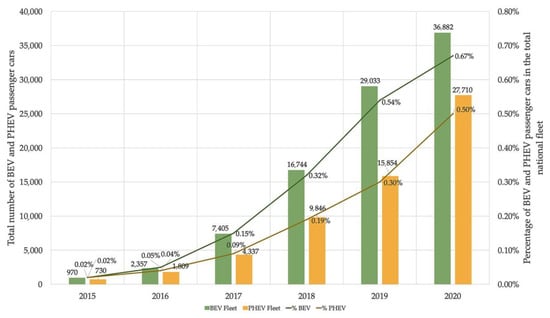
Figure 1.
BEV and PHEV passenger car fleet and percentage of the total fleet, 2015–2020. Adapted from [37].
Despite the short-term impacts of the COVID-19 pandemic, resulting in a severe decline in national total passenger car sales because of economic uncertainty and changing consumer priorities, BEV and PHEV sales kept increasing, reaching a combined 13.5% of total passenger sales in 2020 [37], as seen in Figure 2. Moreover, continued growth is expected to be sustained throughout the 2020s [40].
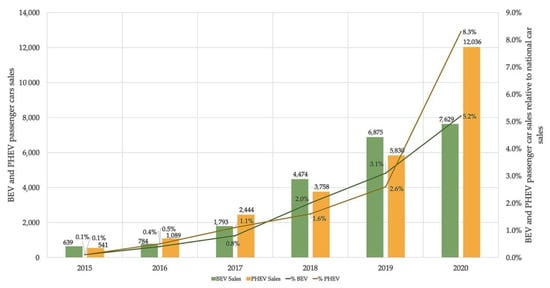
Figure 2.
BEV and PHEV passenger car sales and percentage of the total national sales, 2015–2020 [37].
There must be a huge investment in charging infrastructure, without which the de-carbonization of transportation via electrification will be at stake. Additionally, distribution grids must be strengthened to cope with the expected energy demands from EV owners, especially considering the ambitious goal of achieving 20% e-mobility in 2030 established by the Portuguese government [41].
As mentioned by Awadallah and colleagues [42], every grid is a special case requiring an autonomous study to explore the issues and limits of EV charging loads. This paper aims to forecast the BEV segment development toward the 2030 horizon and its effect on the distribution power grid for an area comprising 20 municipalities in Northern Portugal. The case describes three scenarios that consider different goals and energy consumption levels, relying on three popular EV models in the country, namely the Nissan Leaf, Tesla Model 3, and Renault Zoe. The impacts of the growing EV fleet on the distribution network are assessed, namely the extent to which the available grid power for charging copes with the load demand increases during peak and off-peak hours. The distribution network in this case study is analyzed according to its technical characteristics, constitution, and substation building type. The results are discussed to identify possible measures to address the impacts mentioned above and conclude if and when the local power grid operator should invest in the coming years to be prepared for such impacts.
2. Case Study
2.1. Demographics
The study focuses on 20 municipalities in the regions of Ave, Tâmega, and Sousa, occupying an area of 3439.64 km2 in Northern Portugal (Figure 3). As of July 2021, there were 911,878 residents in that area [43].
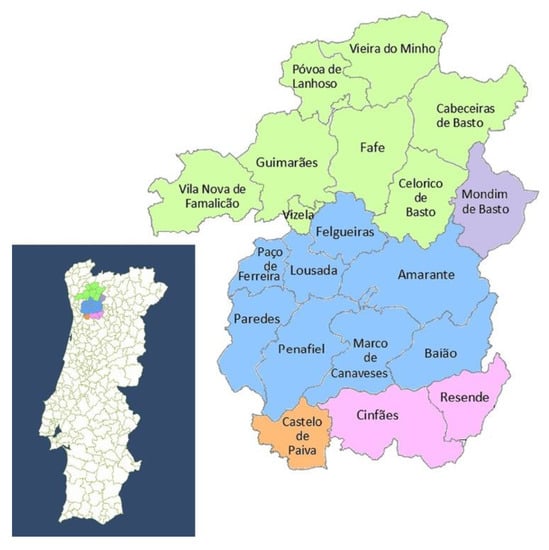
Figure 3.
The 20 municipalities in Northern Portugal under study.
The population slightly decreased in the 2001–2019 period (−3.7%) [44]. The population per municipality was estimated for the period of 2021 to 2030, assuming it will follow the respective growth rate from the previous time span. In 2030, the projected population for the region totals 859,002 residents, or 8.9% of the national projected total, according to [43]. The residents per municipality, given as the percentage of the national total until 2030, will be used in this study as the basis for estimating the numbers of BEVs from national total sales and fleet.
2.2. BEV Consumption
The energy demanded from the grid to power BEVs depends on the vehicle owner’s travel habits and automobile features. According to Sanguesa [45], the vehicle’s mass is crucial for energy consumption in urban areas, while other coefficients play a critical role in highway environments. An energy consumption minimization framework for the routing optimization of BEVs is proposed in [46], yielding lower energy requirements to reaching destinations than Google’s map original routes. Another study [47] proposes a real-time multi-objective prediction energy management strategy to optimize the fuel, electric, and battery degradation costs simultaneously for the energy management of a plug-in range-extended electric vehicle.
To determine the expected BEVs’ energy consumption, this study considers two pattern routes: a long-distance route (intercity) and a short one (city route). In addition, the calculations involve three popular BEV models in Portugal [48], namely the Nissan Leaf, Tesla Model 3, and Renault Zoe.
2.2.1. Long-Distance Route
The route between Amarante (AM) and Águas Santas (AS), which is just outside the region’s southwest borderline, was chosen to characterize the long-distance pathway. This is a 48 km long intercity highway with significant daily movement of passenger light-duty vehicles and with altitudes varying between 120 and 370 m. Considering the different slopes across the entire route, the power required for a one-way trip is different from that required on the way back.
The amount of mechanical energy output generated by the BEV motor impacts the car’s acceleration and traction capacity; that is, the weight that it can move. The mechanical energy power output refers to the product of rotation speed and torque. The energy consumption of a BEV depends on the model, its technical characteristics, and its driving speed. The consumption calculation assumes an average speed of 100 km/h (kilometers per hour). In addition, when estimating EV consumption, other factors matter, such as the battery capacity and torque (the motor’s pulling power in Nm).
Table 2 calculates the energy required for each BEV model to travel the mentioned long-distance route.
Table 2.
Energy consumption for the long-distance route.
As shown in Table 1, the energy required for each BEV model is below the battery capacity, at 37% for the Nissan Leaf, 22% for the Tesla, and 34% for the Renault Zoe. In order to extend a battery’s life span, it should not discharge below 20% or charge above 80%; therefore, a BEV should be completely charged only for long-distance trips [49]. Herein, the battery net capacity will be considered as 60% of the total capacity. According to the actual daily route and the BEV’s features, some vehicles may or may not need a charge once a day.
2.2.2. Short-Distance Route
Many electric vehicle drivers travel relatively short distances within the municipalities, moving from home to office throughout urban areas. A random route of 15 km was chosen to characterize a short-distance route, considering an average speed of 50 km/h. The ground slope of this route was not considered.
The power required to bring a BEV to the speed of 50 km/h is obtained by the sum of the resistive forces to the movement times the target speed. The resultant of these forces, the total drag force, can be estimated through the vehicle’s mass, frontal surface area, and the rolling and drag coefficients. The power output requirement is determined from the drag force times the speed.
According to the specific characteristics of each BEV model, Table 3 presents the power output for the short-distance route and the daily energy consumption for the round trip (30 km), which is carried out in 36 min (0.6 h). As seen in Table 3, the energy required from the three BEVs for a short journey represents only about 6% of the battery capacity for the Nissan Leaf, 6.5% for the Tesla, and 5.7% for the Renault Zoe.
Table 3.
Energy consumption for the short-distance route.
This study considers the representative energy consumption as the average consumption for the short- and long-distance routes, weighted by each BEV’s relative market share, coming to a total of 8776 Wh required energy per day (Table 4).
Table 4.
Daily average energy consumption.
Once the BEV’s weighted energy value is known, it is possible to estimate the time needed for charging and the necessary power supply. As such, a single-phase station will be considered here, namely the Wallbox 7.4 kW (32 A), a semi-fast charging system that can withstand the power needs for this case. This equipment requires a home contracted (installed) power of 10.35 kVA (45 A), which is the standard rating to meet the required current for the battery.
2.3. Installed Power and Available Energy during Peak and Off-Peak Hours
The consumer substations installed in the municipalities involved in the study are of different types based on locality and design, such as pole-mounted substations (PMSs), high cabin station (HCSs), and low cabin station (LCSs), totaling 121, 77, and 83, respectively. Altogether, the power installed in the municipalities equals 1,443,943 kVA, as shown in Table A1 (Appendix A). This table also exhibits the power consumed in each municipality and calculates the available power during peak and off-peak hours. The aggregate available power is 13% higher than consumption during peak hours and 104% higher during off-peak hours. Naturally, the growth of BEVs over the years should boost the demand for power. To a certain extent, the distribution grid may cope with demand if consumer behavior changes and drivers are encouraged to recharge their BEVs during off-peak hours.
2.4. BEV Development from 2021 to 2030: Three Scenarios
Looking at the current state of the EV market worldwide, there is no doubt that it will increase over the next decade. However, the significant growth of EVs leading up to 2030 will present significant challenges for the distribution grid, notably in the available power supply from utilities [50,51]. As can be noted in Figure 2, in 2020 PHEV sales peaked, overcoming BEV sales. The preference for PHEV may be related to high prices for BEVs and the lack of sufficient charging stations in Portugal, totaling 2471 in 2020, of which 494 were fast charge (>22 kW) and 1976 were normal charge (<22 kW) points, whereas the number of EVs per public recharging point was 26, which is far above the European Union (EU) average of 9 [37]. As recharging stations evolve and BEV prices fall, BEV sales should increase substantially in relation to PHEVs.
The following sections describe three scenarios for the BEV market in Portugal and how they will impact the power grid of this case study’s locations until the end of the decade. In all scenarios, the number of BEVs considered is determined as the proportion of the case study location’s population to the national population times the national fleet. The energy required by projected BEVs is obtained by multiplying the number of vehicles by the installed recharging capacity of 10.35 kVA and is then compared to the available energy during peak and off-peak hours, thereby determining the impact of the BEV fleet on the distribution grid.
2.4.1. Scenario 1
The first scenario assumes that BEV passenger car sales will increase to one-third of the total national sales in 2030, a milestone conveyed by the Portuguese minister for the environment and climate action [52]. The BEV sales in the first nine months of 2021 reached 7984 cars; this figure was extended to 10,645 car sales in 2021. The projection starts with this total, evolving at a constant yearly pace to reach one-third of the total BEV sales in 2030. The total national passenger car sales in 2021, 2022, and 2023 are estimated to grow at 11%, 20%, and 15%, respectively, reflecting the expected short-term higher growth following the COVID-19 pandemic; from 2024 to 2030, grow is estimated at 8.69%/year, assuming national sales will stabilize at the pre-pandemic growth rate (as determined in Table 1). The BEV sales volume for the 20 municipalities of the case study is calculated as a percentage of total national sales; that percentage increases by the year to reach one-third of the total national sales in 2030. Accordingly, in that year the BEV fleet will reach 654,451 cars (Table 5).
Table 5.
Calculation of the BEV fleet for scenario 1.
2.4.2. Scenario 2
In the second scenario, the authors assume constant BEV passenger car sales growth that equals the rate registered from 2020 to 2021, or 39.5%, starting with 10,645 car sales in 2021, as in the previous scenario. Thus, in 2030, the BEV fleet will equal 763,424 cars across the 20 municipalities (Table 6).
Table 6.
Impacts of the BEV fleet on the grid during peak hours under scenario 1 (values in kVA).
2.4.3. Scenario 3
The third scenario forecasts the BEV fleet, aiming to meet the ‘National Energy and Climate Plan’ document [41], i.e., reaching 20 percent electric mobility. In the case study, this means that the BEV fleet will also reach that percentage of the circulating passenger fleet in 20 municipalities. Table 7 shows the forecasted national fleet, where the percentage of BEVs is set to 0.67% in 2020 and 2021 to align the fleet number with known estimates for those years. The BEV fleet is then determined as a percentage of the total national fleet, ensuring a steady pace and reaching 20% in 2030 (Table 7).
Table 7.
Calculation of the BEV fleet in scenario 1.
2.4.4. Scenario Comparison
All scenarios forecast a notable growth in the BEV fleet for the entire country and consequently for the 20 municipalities at stake until 2030 (obtained as a proportion of the population against the total national); the required energy increase follows the same rate (obtained from multiplying the number of BEVs by 10.35 kVA), as seen in Figure 4.
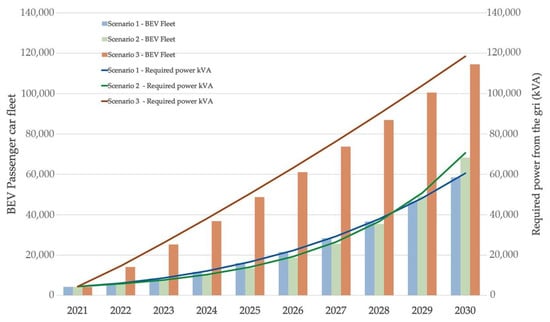
Figure 4.
BEV passenger car fleets under the three scenarios, 2021–2030.
Scenarios 2 and 3 generate very close curves, achieving total national fleets in 2030 of comparable magnitude (58,477 and 68,214, respectively), whereas scenario 3 takes off very quickly, reaching a total of 114,463 units within the same year. In 2030, the required power from the grid for recharging the BEV fleet is 605,240 kVA in scenario 1,706,018 kVA in scenario 2, and 1,184,696 kVA in scenario 3. The available power during peak and off-peak hours, calculated in Table A1 (Appendix A), must be enough to satisfy this demand in each municipality. Table A2 (Appendix B), Table A4 (Appendix C), and Table A6 (Appendix D) show the impacts of BEV recharging during peak hours for scenarios 1, 2, and 3, respectively, calculated as the differences between available power during peak hours and the required power. Similarly, Table A3 (Appendix B), Table A5 (Appendix C), and Table A7 (Appendix D) show the impacts of BEV recharging during off-peak hours for scenarios 1, 2, and 3, respectively, calculated as the differences between available power during off-peak hours and the required power.
The local grid can satisfy demand in scenarios 1 and 2, except for very few critical situations that occur only in 2030 during peak hours in a limited number of municipalities (three in scenario 1 and nine in scenario 2, enhanced in bold in Table A2, Appendix B, and Table A4, Appendix C). In the 20 municipalities, the aggregate impact is positive; that is, the region is globally able to cope with power requirements for BEV recharging. During off-peak hours, there is no criticality in scenarios 1 and 2 (Figure 5).
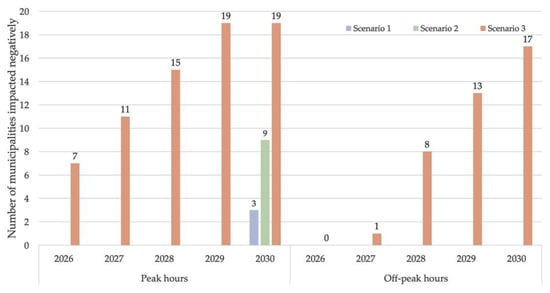
Figure 5.
Number of municipalities impacted negatively during peak and off-peak hours, 2026–2030.
In contrast, scenario 3 is quite critical (Figure 6). Several municipalities cannot cope with the power required by BEVs during peak hours, starting at 7 in 2026 and ending at 19 out of 20 in 2030 (enhanced in bold in Table A6, Appendix D). The situation is also critical for off-peak hours from 2027 to 2030; in 2030, 17 out of 20 municipalities do not satisfy demand (enhanced in bold in Table A7, Appendix D). In aggregate terms, however, the impacts are negative during peak and off-peak hours in 2028 and 2029, respectively.
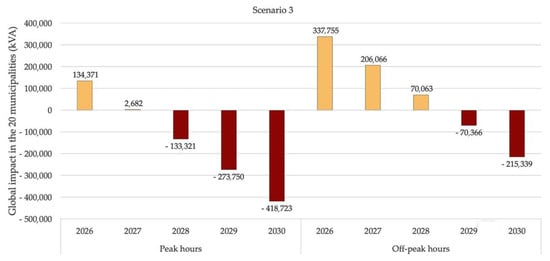
Figure 6.
Global impacts for the municipalities during peak and off-peak hours, 2026–2030.
3. Monte Carlo Computational Simulation
At this point, one could question the likelihood of the occurrence of the three scenarios. The national goals set for the 2030 horizon in [41], which led to scenario 3, result from the government commitment towards achieving carbon neutrality in 2050, in line with EU targets. Therefore, one could expect the government to create measures to encourage grid operators to invest in increasing the power infrastructure capacity and consumers to shift their preferences to EVs. As such, EV sales will probably rise, and as more recharging stations become available, BEVs sales will be boosted. Accordingly, scenario 3 may be the most likely; it would be prudent to take it seriously because it points to dramatic impacts. Moreover, power demands due to EV sales could increase even further. As mentioned previously [36], carmakers are already planning for sales beyond the EU’s regulatory CO2 compliance for 2025 and 2030, as they foresee a real market-driven demand for electric cars. As such, the national electric vehicle fleet should experience growth beyond the forecast in scenario 3 if the Portuguese market follows that trend. In the absence of known estimates concerning more severe scenarios, one can only acknowledge the likely acceleration in EV adoption compared to scenario 3 and consider the BEV sales as a probabilistic variable; then, one can use Monte Carlo computational numerical methods to forecast the impact of BEVs on the power grid, incorporating stochastic variability in the deterministic base case in scenario 3.
As mentioned in [36], EV production may reach 22% of total passenger car production in 2025, higher than the 15% of sales needed to comply with the EU targets, which means sales could be around 46% higher than expected. We will start from a three estimated points approach, defining the sales under scenario 3 as the most likely, the sales under scenario 2 as optimistic, and a new sequence of yearly sales 46% higher than in scenario 3 sales as pessimistic. To perform the Monte Carlo simulation analysis, the BEV sales from 2022 to 2030 will be modeled as a beta-Pert distribution, using the pessimistic, most likely, and pessimistic sales as parameters (sales in 2021 will remain the same as before). A 10,000 trial simulation shows that the aggregate impact means for the peak and off-peak hours are not very different from the base case scenario 3. However, it now reveals the probability of that impact being negative, which is valuable information (Table 8, in bold).
Table 8.
Monte Carlo simulation, showing impacts during peak and off-peak hours (2022–2030) and the probability of negative impacts.
As an example, Figure 7 depicts the simulation for 2027 during peak hours; the red area of the curve translates into a 34.7% probability of negative impact.
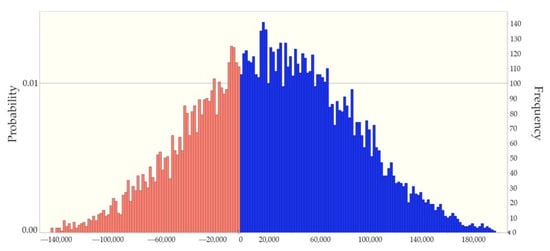
Figure 7.
Monte Carlo simulation: probability/frequency chart of impact during peak hours in 2027.
In the simulation base case (scenario 3), the aggregate impacts during peak hours are negative only from 2028 to 2030; now, the simulation reveals that there is a 0.3% and 34.7% likelihood that those impacts will occur by 2026 and 2027, respectively. Similarly, the aggregate impacts during off-peak hours are negative only in 2029 and 2030; now, there is a probability that they will also happen in 2028. The simulation confirms scenario 3′s expectations and shows that there is a risk of failing to cope with demand earlier than expected.
4. Discussion and Conclusions
This case study addressed the growing BEV passenger car fleet in 20 municipalities of Northern Portugal and how the required power for recharging batteries will impact the local power distribution grid. The case was first analyzed under three scenarios. Firstly, assumptions were established concerning demographics, representative entities for a BEV, its power consumption, and daily distance covered (weighted average of long and short routes), and public information was gathered to describe the installed power grid capacity within the considered municipalities and the national EV sales and fleet. Then, each scenario was specified with further assumptions. In brief, scenario 1 assumed the goal of achieving BEV sales equaling one-third of the total national sales in 2030. In scenario 2, the goal is maintaining the recently registered sales growth from 2019 to 2020 during the 2021–2030 period. In scenario 3, the goal is for the national BEV passenger car fleet to reach 20% of the national total. The number of BEVs in the region was estimated as a percentage of the national fleet (calculated as the proportion of residents to the national population), while the required power by each BEV was 10.35 kVA. Finally, the impact of the BEV fleet on the power distribution grid was estimated as the difference between available power and the required energy for both peak and off-peak hours. In all scenarios, some municipalities were unable to cope with the demand for recharging batteries. The aggregated demand in scenarios 1 and 2 was satisfied by the installed capacity; however, in scenario 3, the grid could not satisfy the demand from 2028 to 2030 during peak hours and from 2029 to 2030 during off-peak hours. Another forecast was carried out, acknowledging the possible acceleration of EV sales at a rate 46% higher than expected (keeping in mind EU targets). In that case, the authors decided to perform a Monte Carlo computational simulation to predict the power demands, incorporating uncertainty in the deterministic base case in scenario 3, which impacted the aggregate demand, which although not far from the base case showed a significant probability of being negative earlier than expected. This information is valuable for the grid operators because it provides a measure of the risk of not meeting BEV demand and underpins the need to consider timely expansion investments of the power grid.
The study’s deterministic and stochastic modeling of BEV fleet impacts on the power grid shows that the network runs out of its feeding capacity if BEV production increases until the end of the decade. This approach could be easily replicated in other regions, provided the parameters are calibrated to reflect differences in the considered variables. However, one should note several aspects of the case study assumptions that could significantly alter the model and its outputs. Firstly, the representative BEV was characterized based on three models only. The availability of new affordable BEVs will soon change the current scenario. Additionally, one can anticipate that carmakers will invest in improving all EV characteristics, including weight and efficiency. Therefore, the representative model should be adjusted accordingly. Secondly, the required power for recharging a BEV was estimated based on the daily distance covered by a vehicle and the characteristics of the routes. In this case, a representative route was defined based on long- and short-distance paths. Other routes could be considered, which might create alternative energy requirements. Thirdly, our approach estimated the BEV fleet as a proportion of the local population to the national population. This assumption could be refined, as the expected population growth for the region may be somehow evolve differently from the country’s population growth. Additionally, the local residents’ average purchasing power may not coincide with that of the national residents. Another important remark is that the forecasts described in the case study estimated the ability of the local power grid to attend to the BEV fleet demands as a whole; that is, the model analyzed whether the grid could cope with all demands during peak and off-peak hours. Eventually, the grid could feed all BEVs if the consumers comply with controlled recharging, splitting demand between both periods. Although operators may encourage charging during off-peak hours, it is not guaranteed that consumers will cooperate; as such, we opted for the worst-case scenario. However, should there be any reason to believe that splitting could be enforced, a new study should analyze the impacts of controlled consumer behavior. Finally, other BEV sales and fleet forecasting assumptions do not take into consideration the idea that possibly alternative technologies may make an impact soon (e.g., hydrogen cars), while PHEVs could still have opportunity for growth if carmakers decide to improve their technology and weight, which would change assumptions about sales and market shares.
The replication of the case study approach in other regional networks may highlight congestion issues. To tackle such situations, distribution operators must strengthen their infrastructure. In addition, there are various additional technical interventions to consider: the current conductors’ replacement with a larger cross-section to withstand the thermal limits; the insertion of more conductors in parallel to decongest the overloaded cables; and the transformer power reinforcement, which is the most crucial upstream action. Additionally, the distribution grid considered in this study comprises consumer substations of different building types (PMS, HCS, and LCS). The BEV fleet growth will cause impacts in terms of voltage drops; some are better prepared to meet increased demand than others. In this regard, major physical interventions may be necessary, as is the case with building restructuring. Another approach is to explore the dynamic line rating (DLR) approach, whereby the power system has thermally sensitive assets such as lines and transformers, and there is a growing trend to use the capacity of those assets dynamically under varying operating conditions [53]. A good solution to lighten the consequences of BEV demand increases is micro-production. The self-production of photovoltaic electricity is becoming crucial. Charging a BEV with electricity generated by photovoltaic systems should become a worthwhile option. The energy from a building’s own roof is cost-effective and has net-zero emissions. Providing easy home and workplace charging should be a priority. Although not within the scope of this study, one should mention the negative impact that the integration on the grid of other electric vehicles may cause, namely trucks and bus fleets [28]. This perspective calls for the adoption of smart charging to address the expected grid congestion and maintain the reliability and security of the power supply. Finally, storage systems based on the second use of discarded electric vehicle batteries have been identified as cost-efficient and sustainable alternatives to first-use battery storage systems [54]. In addition, EV second-life battery storage systems may prove responsive, efficient, and scalable [55]; they could contribute to additional buffer capacity for the electrical grids.
There is little doubt that EVs are here to stay. Consumers are increasingly more inclined to consider EVs. As prices decrease and governments offer financial incentives such as tax reductions and exemptions for electric vehicles, the shift towards electric mobility will increase. Power grid operators must be aware of this process, anticipate infrastructure investments, and manage BEV recharging to cope with this growing demand. Charging infrastructure needs to be effectively deployed in line with the growing EV uptake at all levels. This study intended to provide an original and feasible approach to analyze the impacts of BEV passenger fleet growth on the power grid until 2030. It could be adjusted to reflect improved assumptions and contextual changes and could helpful in studying other grids beyond the one considered in the case study.
Author Contributions
Conceptualization, T.N., J.M. and E.S.; methodology, T.N., J.M. and E.S.; formal analysis, T.N., J.M. and G.R.A.; writing—original draft preparation, T.N. and J.M.; writing—review and editing, T.N., J.M., E.S. and G.R.A.; funding acquisition, G.R.A. All authors have read and agreed to the published version of the manuscript.
Funding
This research was funded by Fundação para a Ciência e Tecnologia (FCT), grant number UIDB/04730/2020.
Institutional Review Board Statement
Not applicable.
Informed Consent Statement
Not applicable.
Conflicts of Interest
The authors declare no conflict of interest.
Appendix A
Table A1.
Installed power and available energy during peak and off-peak hours by municipality [56].
Table A1.
Installed power and available energy during peak and off-peak hours by municipality [56].
| Municipality | Power Installed (kVA) | Power: Peak Hours (kVA) | Power: Off-Peak Hours (kVA) | ||
|---|---|---|---|---|---|
| Required | Available | Required | Available | ||
| Castelo de Paiva | 24,100 | 10,055 | 14,045 | 7038 | 17,062 |
| Cabeceiras de Basto | 26,103 | 10,968 | 15,135 | 7679 | 18,424 |
| Celorico de Basto | 29,975 | 12,605 | 17,370 | 8825 | 21,150 |
| Fafe | 88,711 | 40,022 | 48,689 | 28,015 | 60,696 |
| Guimarães | 280,295 | 115,396 | 164,899 | 80,778 | 199,517 |
| Póvoa de Lanhoso | 35,118 | 16,296 | 18,822 | 11,407 | 23,711 |
| Vieira do Minho | 23,243 | 9138 | 14,105 | 6397 | 16,846 |
| Vila Nova de Famalicão | 199,080 | 88,544 | 110,536 | 61,980 | 137,100 |
| Vizela | 33,435 | 18,031 | 15,404 | 12,621 | 20,814 |
| Amarante | 73,798 | 40,828 | 32,970 | 28,580 | 45,218 |
| Baião | 25,640 | 12,720 | 12,920 | 8904 | 16,736 |
| Felgueiras | 88,050 | 49,395 | 38,655 | 34,577 | 53,473 |
| Lousada | 72,835 | 35,516 | 37,319 | 24,862 | 47,973 |
| Marco de Canaveses | 83,600 | 40,657 | 42,943 | 28,461 | 55,139 |
| Paços de Ferreira | 101,375 | 46,845 | 54,530 | 32,792 | 68,583 |
| Paredes | 110,210 | 53,739 | 56,471 | 37,617 | 72,593 |
| Penafiel | 99,600 | 51,915 | 47,685 | 36,341 | 63,259 |
| Mondim de Basto | 12,485 | 5662 | 6823 | 3964 | 8521 |
| Cinfães | 23,980 | 12,717 | 11,263 | 8902 | 15,078 |
| Resende | 12,310 | 6921 | 5389 | 4846 | 7464 |
| Total | 1,443,943 | 677,970 | 765,973 | 474,586 | 969,357 |
Appendix B
Table A2.
Scenario 1: Impacts (available power–required power) of the BEV fleet on the grid during peak hours (values in kVA).
Table A2.
Scenario 1: Impacts (available power–required power) of the BEV fleet on the grid during peak hours (values in kVA).
| Municipality. | 2020 | 2021 | 2022 | 2023 | 2024 | 2025 | 2026 | 2027 | 2028 | 2029 | 2030 |
|---|---|---|---|---|---|---|---|---|---|---|---|
| Castelo de Paiva | 13,474 | 13,312 | 13,029 | 12,605 | 12,036 | 11,303 | 10,381 | 9246 | 7868 | 6214 | 4250 |
| Cabeceiras de Basto | 14,558 | 14,394 | 14,110 | 13,683 | 13,111 | 12,374 | 11,449 | 10,311 | 8930 | 7275 | 5311 |
| Celorico de Basto | 16,665 | 16,463 | 16,111 | 15,580 | 14,869 | 13,949 | 12,790 | 11,358 | 9615 | 7519 | 5021 |
| Fafe | 46,908 | 46,394 | 45,501 | 44,154 | 42,345 | 40,003 | 37,049 | 33,395 | 28,943 | 23,581 | 17,186 |
| Guimarães | 159,252 | 157,623 | 154,786 | 150,512 | 144,765 | 137,323 | 127,935 | 116,318 | 102,158 | 85,098 | 64,743 |
| Póvoa de Lanhoso | 18,025 | 17,796 | 17,396 | 16,794 | 15,985 | 14,938 | 13,618 | 11,985 | 9996 | 7600 | 4743 |
| Vieira do Minho | 13,669 | 13,548 | 13,337 | 13,021 | 12,601 | 12,061 | 11,387 | 10,561 | 9564 | 8375 | 6970 |
| Vila Nova de Famalicão | 105,635 | 104,195 | 101,687 | 97,897 | 92,777 | 86,115 | 77,669 | 67,166 | 54,298 | 38,720 | 20,039 |
| Vizela | 14,513 | 14,250 | 13,791 | 13,097 | 12,158 | 10,934 | 9380 | 7443 | 5066 | 2184 | −1278 |
| Amarante | 31,004 | 30,445 | 29,473 | 28,011 | 26,053 | 23,527 | 20,353 | 16,442 | 11,694 | 5997 | −772 |
| Baião | 12,229 | 12,035 | 11,698 | 11,191 | 10,516 | 9647 | 8559 | 7223 | 5606 | 3674 | 1386 |
| Felgueiras | 36,560 | 35,952 | 34,894 | 33,297 | 31,148 | 28,359 | 24,836 | 20,469 | 15,137 | 8704 | 1015 |
| Lousada | 35,577 | 35,064 | 34,171 | 32,818 | 30,991 | 28,611 | 25,591 | 21,833 | 17,224 | 11,640 | 4938 |
| Marco de Canaveses | 41,031 | 40,476 | 39,509 | 38,051 | 36,087 | 33,539 | 30,319 | 26,327 | 21,453 | 15,570 | 8539 |
| Paços de Ferreira | 52,414 | 51,787 | 50,694 | 49,040 | 46,800 | 43,878 | 40,164 | 35,535 | 29,848 | 22,946 | 14,648 |
| Paredes | 53,358 | 52,455 | 50,883 | 48,512 | 45,319 | 41,178 | 35,947 | 29,464 | 21,549 | 12,000 | 588 |
| Penafiel | 45,096 | 44,346 | 43,039 | 41,070 | 38,419 | 34,981 | 30,640 | 25,263 | 18,700 | 10,784 | 1328 |
| Mondim de Basto | 6567 | 6496 | 6372 | 6187 | 5939 | 5622 | 5225 | 4739 | 4152 | 3452 | 2625 |
| Cinfães | 10,592 | 10,404 | 10,079 | 9591 | 8940 | 8105 | 7062 | 5782 | 4238 | 2394 | 215 |
| Resende | 5016 | 4912 | 4731 | 4459 | 4097 | 3633 | 3052 | 2340 | 1480 | 453 | −761 |
| Total | 732,145 | 722,347 | 705,292 | 679,569 | 644,954 | 600,080 | 543,405 | 473,200 | 387,519 | 284,179 | 160,733 |
Table A3.
Scenario 1: Impacts (available power–required power) of the BEV fleet on the grid during off-peak hours (values in kVA).
Table A3.
Scenario 1: Impacts (available power–required power) of the BEV fleet on the grid during off-peak hours (values in kVA).
| Municipality | 2020 | 2021 | 2022 | 2023 | 2024 | 2025 | 2026 | 2027 | 2028 | 2029 | 2030 |
|---|---|---|---|---|---|---|---|---|---|---|---|
| Castelo de Paiva | 16,491 | 16,329 | 16,046 | 15,622 | 15,053 | 14,320 | 13,398 | 12,263 | 10,885 | 16,491 | 16,329 |
| Cabeceiras de Basto | 17,847 | 17,683 | 17,399 | 16,972 | 16,400 | 15,663 | 14,738 | 13,600 | 12,219 | 17,847 | 17,683 |
| Celorico de Basto | 20,445 | 20,243 | 19,891 | 19,360 | 18,649 | 17,729 | 16,570 | 15,138 | 13,395 | 20,445 | 20,243 |
| Fafe | 58,915 | 58,401 | 57,508 | 56,161 | 54,352 | 52,010 | 49,056 | 45,402 | 40,950 | 58,915 | 58,401 |
| Guimarães | 193,870 | 192,241 | 189,404 | 185,130 | 179,383 | 171,941 | 162,553 | 150,936 | 136,776 | 193,870 | 192,241 |
| Póvoa de Lanhoso | 22,914 | 22,685 | 22,285 | 21,683 | 20,874 | 19,827 | 18,507 | 16,874 | 14,885 | 22,914 | 22,685 |
| Vieira do Minho | 16,410 | 16,289 | 16,078 | 15,762 | 15,342 | 14,802 | 14,128 | 13,302 | 12,305 | 16,410 | 16,289 |
| Vila Nova de Famalicão | 132,199 | 130,759 | 128,251 | 124,461 | 119,341 | 112,679 | 104,233 | 93,730 | 80,862 | 132,199 | 130,759 |
| Vizela | 19,923 | 19,660 | 19,201 | 18,507 | 17,568 | 16,344 | 14,790 | 12,853 | 10,476 | 19,923 | 19,660 |
| Amarante | 43,252 | 42,693 | 41,721 | 40,259 | 38,301 | 35,775 | 32,601 | 28,690 | 23,942 | 43,252 | 42,693 |
| Baião | 16,045 | 15,851 | 15,514 | 15,007 | 14,332 | 13,463 | 12,375 | 11,039 | 9422 | 16,045 | 15,851 |
| Felgueiras | 51,378 | 50,770 | 49,712 | 48,115 | 45,966 | 43,177 | 39,654 | 35,287 | 29,955 | 51,378 | 50,770 |
| Lousada | 46,231 | 45,718 | 44,825 | 43,472 | 41,645 | 39,265 | 36,245 | 32,487 | 27,878 | 46,231 | 45,718 |
| Marco de Canaveses | 53,227 | 52,672 | 51,705 | 50,247 | 48,283 | 45,735 | 42,515 | 38,523 | 33,649 | 53,227 | 52,672 |
| Paços de Ferreira | 66,467 | 65,840 | 64,747 | 63,093 | 60,853 | 57,931 | 54,217 | 49,588 | 43,901 | 66,467 | 65,840 |
| Paredes | 69,480 | 68,577 | 67,005 | 64,634 | 61,441 | 57,300 | 52,069 | 45,586 | 37,671 | 69,480 | 68,577 |
| Penafiel | 60,670 | 59,920 | 58,613 | 56,644 | 53,993 | 50,555 | 46,214 | 40,837 | 34,274 | 60,670 | 59,920 |
| Mondim de Basto | 8265 | 8194 | 8070 | 7885 | 7637 | 7320 | 6923 | 6437 | 5850 | 8265 | 8194 |
| Cinfães | 14,407 | 14,219 | 13,894 | 13,406 | 12,755 | 11,920 | 10,877 | 9597 | 8053 | 14,407 | 14,219 |
| Resende | 7091 | 6987 | 6806 | 6534 | 6172 | 5708 | 5127 | 4415 | 3555 | 7091 | 6987 |
| Total | 935,529 | 925,731 | 908,676 | 882,953 | 848,338 | 803,464 | 746,789 | 676,584 | 590,903 | 935,529 | 925,731 |
Appendix C
Table A4.
Scenario 2: Impacts (available power–required power) of the BEV fleet on the grid during peak hours (values in kVA).
Table A4.
Scenario 2: Impacts (available power–required power) of the BEV fleet on the grid during peak hours (values in kVA).
| Municipality | 2020 | 2021 | 2022 | 2023 | 2024 | 2025 | 2026 | 2027 | 2028 | 2029 | 2030 |
|---|---|---|---|---|---|---|---|---|---|---|---|
| Castelo de Paiva | 13,474 | 13,312 | 13,086 | 12,771 | 12,334 | 11,725 | 10,879 | 9701 | 8064 | 5786 | 2619 |
| Cabeceiras de Basto | 14,558 | 14,394 | 14,167 | 13,851 | 13,411 | 12,800 | 11,950 | 10,769 | 9127 | 6846 | 3675 |
| Celorico de Basto | 16,665 | 16,463 | 16,181 | 15,788 | 15,240 | 14,476 | 13,412 | 11,928 | 9861 | 6980 | 2965 |
| Fafe | 46,908 | 46,394 | 45,678 | 44,679 | 43,285 | 41,341 | 38,629 | 34,846 | 29,569 | 22,208 | 11,940 |
| Guimarães | 159,252 | 157,623 | 155,349 | 152,176 | 147,750 | 141,573 | 132,954 | 120,928 | 104,149 | 80,735 | 48,066 |
| Póvoa de Lanhoso | 18,025 | 17,796 | 17,476 | 17,029 | 16,406 | 15,537 | 14,325 | 12,634 | 10,276 | 6987 | 2399 |
| Vieira do Minho | 13,669 | 13,548 | 13,380 | 13,147 | 12,824 | 12,376 | 11,756 | 10,897 | 9708 | 8061 | 5782 |
| Vila Nova de Famalicão | 105,635 | 104,195 | 102,180 | 99,359 | 95,409 | 89,878 | 82,132 | 71,281 | 56,083 | 34,793 | 4970 |
| Vizela | 14,513 | 14,250 | 13,881 | 13,364 | 12,639 | 11,623 | 10,198 | 8198 | 5395 | 1461 | −4056 |
| Amarante | 31,004 | 30,445 | 29,667 | 28,584 | 27,078 | 24,982 | 22,066 | 18,010 | 12,369 | 4522 | −6391 |
| Baião | 12,229 | 12,035 | 11,766 | 11,391 | 10,872 | 10,151 | 9151 | 7763 | 5838 | 3168 | −535 |
| Felgueiras | 36,560 | 35,952 | 35,103 | 33,917 | 32,260 | 29,946 | 26,712 | 22,195 | 15,884 | 7066 | −5252 |
| Lousada | 35,577 | 35,064 | 34,346 | 33,339 | 31,929 | 29,953 | 27,184 | 23,302 | 17,862 | 10,236 | −454 |
| Marco de Canaveses | 41,031 | 40,476 | 39,700 | 38,617 | 37,103 | 34,988 | 32,033 | 27,904 | 22,135 | 14,074 | 2810 |
| Paços de Ferreira | 52,414 | 51,787 | 50,908 | 49,675 | 47,946 | 45,520 | 42,115 | 37,337 | 30,632 | 21,219 | 8008 |
| Paredes | 53,358 | 52,455 | 51,194 | 49,433 | 46,972 | 43,535 | 38,734 | 32,027 | 22,657 | 9568 | −8717 |
| Penafiel | 45,096 | 44,346 | 43,298 | 41,835 | 39,792 | 36,939 | 32,955 | 27,391 | 19,620 | 8767 | −6391 |
| Mondim de Basto | 6567 | 6496 | 6397 | 6260 | 6070 | 5807 | 5442 | 4937 | 4237 | 3268 | 1925 |
| Cinfães | 10,592 | 10,404 | 10,144 | 9784 | 9284 | 8592 | 7632 | 6302 | 4460 | 1909 | −1625 |
| Resende | 5016 | 4912 | 4767 | 4567 | 4289 | 3903 | 3369 | 2629 | 1604 | 183 | −1785 |
| Total | 732,145 | 722,347 | 708,668 | 689,566 | 662,892 | 625,644 | 573,626 | 500,982 | 399,529 | 257,840 | 59,955 |
Table A5.
Scenario 2: Impacts (available power–required power) of the BEV fleet on the grid during off-peak hours (values in kVA).
Table A5.
Scenario 2: Impacts (available power–required power) of the BEV fleet on the grid during off-peak hours (values in kVA).
| Municipality | 2020 | 2021 | 2022 | 2023 | 2024 | 2025 | 2026 | 2027 | 2028 | 2029 | 2030 |
|---|---|---|---|---|---|---|---|---|---|---|---|
| Castelo de Paiva | 16,491 | 16,329 | 16,103 | 15,788 | 15,351 | 14,742 | 13,896 | 12,718 | 11,081 | 8803 | 5636 |
| Cabeceiras de Basto | 17,847 | 17,683 | 17,456 | 17,140 | 16,700 | 16,089 | 15,239 | 14,058 | 12,416 | 10,135 | 6964 |
| Celorico de Basto | 20,445 | 20,243 | 19,961 | 19,568 | 19,020 | 18,256 | 17,192 | 15,708 | 13,641 | 10,760 | 6745 |
| Fafe | 58,915 | 58,401 | 57,685 | 56,686 | 55,292 | 53,348 | 50,636 | 46,853 | 41,576 | 34,215 | 23,947 |
| Guimarães | 193,870 | 192,241 | 189,967 | 186,794 | 182,368 | 176,191 | 167,572 | 155,546 | 138,767 | 115,353 | 82,684 |
| Póvoa de Lanhoso | 22,914 | 22,685 | 22,365 | 21,918 | 21,295 | 20,426 | 19,214 | 17,523 | 15,165 | 11,876 | 7288 |
| Vieira do Minho | 16,410 | 16,289 | 16,121 | 15,888 | 15,565 | 15,117 | 14,497 | 13,638 | 12,449 | 10,802 | 8523 |
| Vila Nova de Famalicão | 132,199 | 130,759 | 128,744 | 125,923 | 121,973 | 116,442 | 108,696 | 97,845 | 82,647 | 61,357 | 31,534 |
| Vizela | 19,923 | 19,660 | 19,291 | 18,774 | 18,049 | 17,033 | 15,608 | 13,608 | 10,805 | 6871 | 1354 |
| Amarante | 43,252 | 42,693 | 41,915 | 40,832 | 39,326 | 37,230 | 34,314 | 30,258 | 24,617 | 16,770 | 5857 |
| Baião | 16,045 | 15,851 | 15,582 | 15,207 | 14,688 | 13,967 | 12,967 | 11,579 | 9654 | 6984 | 3281 |
| Felgueiras | 51,378 | 50,770 | 49,921 | 48,735 | 47,078 | 44,764 | 41,530 | 37,013 | 30,702 | 21,884 | 9566 |
| Lousada | 46,231 | 45,718 | 45,000 | 43,993 | 42,583 | 40,607 | 37,838 | 33,956 | 28,516 | 20,890 | 10,200 |
| Marco de Canaveses | 53,227 | 52,672 | 51,896 | 50,813 | 49,299 | 47,184 | 44,229 | 40,100 | 34,331 | 26,270 | 15,006 |
| Paços de Ferreira | 66,467 | 65,840 | 64,961 | 63,728 | 61,999 | 59,573 | 56,168 | 51,390 | 44,685 | 35,272 | 22,061 |
| Paredes | 69,480 | 68,577 | 67,316 | 65,555 | 63,094 | 59,657 | 54,856 | 48,149 | 38,779 | 25,690 | 7405 |
| Penafiel | 60,670 | 59,920 | 58,872 | 57,409 | 55,366 | 52,513 | 48,529 | 42,965 | 35,194 | 24,341 | 9183 |
| Mondim de Basto | 8265 | 8194 | 8095 | 7958 | 7768 | 7505 | 7140 | 6635 | 5935 | 4966 | 3623 |
| Cinfães | 14,407 | 14,219 | 13,959 | 13,599 | 13,099 | 12,407 | 11,447 | 10,117 | 8275 | 5724 | 2190 |
| Resende | 7091 | 6987 | 6842 | 6642 | 6364 | 5978 | 5444 | 4704 | 3679 | 2258 | 290 |
| Total | 935,529 | 925,731 | 908,676 | 882,953 | 848,338 | 803,464 | 746,789 | 676,584 | 590,903 | 935,529 | 925,731 |
Appendix D
Table A6.
Scenario 3: Impacts (available power–required power) of the BEV fleet on the grid during peak hours (values in kVA).
Table A6.
Scenario 3: Impacts (available power–required power) of the BEV fleet on the grid during peak hours (values in kVA).
| Municipality | 2020 | 2021 | 2022 | 2023 | 2024 | 2025 | 2026 | 2027 | 2028 | 2029 | 2030 |
|---|---|---|---|---|---|---|---|---|---|---|---|
| Castelo de Paiva | 13,474 | 13,312 | 11,604 | 9689 | 7725 | 5712 | 3648 | 1533 | −633 | −2854 | −5128 |
| Cabeceiras de Basto | 14,558 | 14,394 | 12,672 | 10,743 | 8767 | 6746 | 4676 | 2558 | 391 | −1826 | −4094 |
| Celorico de Basto | 16,665 | 16,463 | 14,344 | 11,958 | 9501 | 6973 | 4372 | 1695 | −1058 | −3890 | −6801 |
| Fafe | 46,908 | 46,394 | 41,028 | 34,974 | 28,731 | 22,293 | 15,657 | 8816 | 1767 | −5495 | −12,975 |
| Guimarães | 159,252 | 157,623 | 140,599 | 121,385 | 101,558 | 81,102 | 60,003 | 38,244 | 15,811 | −7314 | −31,146 |
| Póvoa de Lanhoso | 18,025 | 17,796 | 15,396 | 12,689 | 9898 | 7021 | 4055 | 998 | −2151 | −5395 | −8735 |
| Vieira do Minho | 13,669 | 13,548 | 12,260 | 10,828 | 9372 | 7893 | 6391 | 4864 | 3314 | 1738 | 139 |
| Vila Nova de Famalicão | 105,635 | 104,195 | 89,273 | 72,308 | 54,665 | 36,325 | 17,265 | −2535 | −23,098 | −44,446 | −66,603 |
| Vizela | 14,513 | 14,250 | 11,529 | 8427 | 5192 | 1821 | −1692 | −5351 | −9160 | −13,125 | −17,250 |
| Amarante | 31,004 | 30,445 | 24,566 | 17,971 | 11,207 | 4273 | −2835 | −10,121 | −17,587 | −25,239 | −33,077 |
| Baião | 12,229 | 12,035 | 9983 | 7692 | 5356 | 2973 | 544 | −1933 | −4459 | −7033 | −9657 |
| Felgueiras | 36,560 | 35,952 | 29,618 | 22,451 | 15,037 | 7368 | −561 | −8757 | −17,228 | −25,980 | −35,021 |
| Lousada | 35,577 | 35,064 | 29,753 | 23,707 | 17,411 | 10,858 | 4038 | −3055 | −10,430 | −18,097 | −26,064 |
| Marco de Canaveses | 41,031 | 40,476 | 34,691 | 28,146 | 21,372 | 14,365 | 7118 | −376 | −8122 | −16,128 | −24,400 |
| Paços de Ferreira | 52,414 | 51,787 | 45,313 | 37,924 | 30,211 | 22,161 | 13,764 | 5007 | −4119 | −13,629 | −23,534 |
| Paredes | 53,358 | 52,455 | 43,044 | 32,398 | 21,386 | 9999 | −1773 | −13,940 | −26,512 | −39,500 | −52,914 |
| Penafiel | 45,096 | 44,346 | 36,522 | 27,677 | 18,532 | 9082 | −684 | −10,772 | −21,191 | −31,948 | −43,054 |
| Mondim de Basto | 6567 | 6496 | 5740 | 4898 | 4043 | 3173 | 2289 | 1390 | 477 | −452 | −1395 |
| Cinfães | 10,592 | 10,404 | 8417 | 6205 | 3955 | 1667 | −660 | −3026 | −5431 | −7877 | −10,363 |
| Resende | 5016 | 4912 | 3807 | 2577 | 1325 | 52 | −1243 | −2561 | −3901 | −5263 | −6649 |
| Total | 732,145 | 722,347 | 620,156 | 504,645 | 385,246 | 261,856 | 134,371 | 2682 | −133,321 | −273,750 | −418,723 |
Table A7.
Scenario 3: Impact (available power–required power) of the BEV fleet on the grid during off-peak hours (values in kVA).
Table A7.
Scenario 3: Impact (available power–required power) of the BEV fleet on the grid during off-peak hours (values in kVA).
| Municipality | 2020 | 2021 | 2022 | 2023 | 2024 | 2025 | 2026 | 2027 | 2028 | 2029 | 2030 |
|---|---|---|---|---|---|---|---|---|---|---|---|
| Castelo de Paiva | 16,491 | 16,329 | 14,621 | 12,706 | 10,742 | 8729 | 6665 | 4550 | 2384 | 163 | −2111 |
| Cabeceiras de Basto | 17,847 | 17,683 | 15,961 | 14,032 | 12,056 | 10,035 | 7965 | 5847 | 3680 | 1463 | −805 |
| Celorico de Basto | 20,445 | 20,243 | 18,124 | 15,738 | 13,281 | 10,753 | 8152 | 5475 | 2722 | −110 | −3021 |
| Fafe | 58,915 | 58,401 | 53,035 | 46,981 | 40,738 | 34,300 | 27,664 | 20,823 | 13,774 | 6512 | −968 |
| Guimarães | 193,870 | 192,241 | 175,217 | 156,003 | 136,176 | 115,720 | 94,621 | 72,862 | 50,429 | 27,304 | 3472 |
| Póvoa de Lanhoso | 22,914 | 22,685 | 20,285 | 17,578 | 14,787 | 11,910 | 8944 | 5887 | 2738 | −506 | −3846 |
| Vieira do Minho | 16,410 | 16,289 | 15,001 | 13,569 | 12,113 | 10,634 | 9132 | 7605 | 6055 | 4479 | 2880 |
| Vila Nova de Famalicão | 132,199 | 130,759 | 115,837 | 98,872 | 81,229 | 62,889 | 43,829 | 24,029 | 3466 | −17,882 | −40,039 |
| Vizela | 19,923 | 19,660 | 16,939 | 13,837 | 10,602 | 7231 | 3718 | 59 | −3750 | −7715 | −11,840 |
| Amarante | 43,252 | 42,693 | 36,814 | 30,219 | 23,455 | 16,521 | 9413 | 2127 | −5339 | −12,991 | −20,829 |
| Baião | 16,045 | 15,851 | 13,799 | 11,508 | 9172 | 6789 | 4360 | 1883 | −643 | −3217 | −5841 |
| Felgueiras | 51,378 | 50,770 | 44,436 | 37,269 | 29,855 | 22,186 | 14,257 | 6061 | −2410 | −11,162 | −20,203 |
| Lousada | 46,231 | 45,718 | 40,407 | 34,361 | 28,065 | 21,512 | 14,692 | 7599 | 224 | −7443 | −15,410 |
| Marco de Canaveses | 53,227 | 52,672 | 46,887 | 40,342 | 33,568 | 26,561 | 19,314 | 11,820 | 4074 | −3932 | −12,204 |
| Paços de Ferreira | 66,467 | 65,840 | 59,366 | 51,977 | 44,264 | 36,214 | 27,817 | 19,060 | 9934 | 424 | −9481 |
| Paredes | 69,480 | 68,577 | 59,166 | 48,520 | 37,508 | 26,121 | 14,349 | 2182 | −10,390 | −23,378 | −36,792 |
| Penafiel | 60,670 | 59,920 | 52,096 | 43,251 | 34,106 | 24,656 | 14890 | 4802 | −5617 | −16,374 | −27,480 |
| Mondim de Basto | 8265 | 8194 | 7438 | 6596 | 5741 | 4871 | 3987 | 3088 | 2175 | 1246 | 303 |
| Cinfães | 14,407 | 14,219 | 12,232 | 10,020 | 7770 | 5482 | 3155 | 789 | −1616 | −4062 | −6548 |
| Resende | 7091 | 6987 | 5882 | 4652 | 3400 | 2127 | 832 | −486 | −1826 | −3188 | −4574 |
| Total | 935,529 | 925,731 | 823,540 | 708,029 | 588,630 | 465,240 | 337,755 | 206,066 | 70,063 | −70,366 | −215,339 |
References
- European Environment Agency (EEA). New Registrations of Electric Vehicles in Europe. Available online: https://www.eea.europa.eu/data-and-maps/indicators/proportion-of-vehicle-fleet-meeting-5/assessment (accessed on 5 October 2021).
- Croce, A.I.; Musolino, G.; Rindone, C.; Vitetta, A. Energy consumption of electric vehicles: Models’ estimation using big data (FCD). Transp. Res. Procedia 2020, 47, 211–218. [Google Scholar] [CrossRef]
- Shaukat, N.; Khan, B.; Ali, S.M.; Mehmood, C.A.; Khan, J.; Farid, U.; Majid, M.; Anwar, S.M.; Jawad, M.; Ullah, Z. A survey on electric vehicle transportation within smart grid system. Renew. Sustain. Energy Rev. 2018, 81, 1329–1349. [Google Scholar] [CrossRef]
- TEVVA Tevva Unveils First British Electric Truck Designed for Mass Production in the UK. Available online: https://tevva.com/tevva-unveils-first-british-electric-truck-designed-for-mass-production-in-the-uk/ (accessed on 22 November 2021).
- Qu, Z.; Zhang, S. References to literature from the business sector in patent documents: A case study of charging technologies for electric vehicles. Scientometrics 2020, 124, 867–886. [Google Scholar] [CrossRef]
- Infante, W.; Ma, J. Coordinated Management and Ratio Assessment of Electric Vehicle Charging Facilities. IEEE Trans. Ind. Appl. 2020, 56, 5955–5962. [Google Scholar] [CrossRef]
- Liu, X.; Zhao, T.; Yao, S.; Soh, C.B.; Wang, P. Distributed Operation Management of Battery Swapping-Charging Systems. IEEE Trans. Smart Grid 2019, 10, 5320–5333. [Google Scholar] [CrossRef]
- Delgado, J.; Faria, R.; Moura, P.; de Almeida, A.T. Impacts of plug-in electric vehicles in the portuguese electrical grid. Transp. Res. Part D Transp. Environ. 2018, 62, 372–385. [Google Scholar] [CrossRef]
- Faria, R.; Moura, P.; Delgado, J.; de Almeida, A.T. Managing the Charging of Electrical Vehicles: Impacts on the Electrical Grid and on the Environment. IEEE Intell. Transp. Syst. Mag. 2014, 6, 54–65. [Google Scholar] [CrossRef]
- Bastida-Molina, P.; Hurtado-Pérez, E.; Pérez-Navarro, Á.; Alfonso-Solar, D. Light electric vehicle charging strategy for low impact on the grid. Environ. Sci. Pollut. Res. 2021, 28, 18790–18806. [Google Scholar] [CrossRef]
- Deilami, S.; Muyeen, S.M. An Insight into Practical Solutions for Electric Vehicle Charging in Smart Grid. Energies 2020, 13, 1545. [Google Scholar] [CrossRef] [Green Version]
- Oladimeji, O.; Gonzalez-Castellanos, A.; Pozo, D.; Dvorkin, Y.; Acharya, S. Impact of Electric Vehicle Routing with Stochastic Demand on Grid Operation. In Proceedings of the 2021 IEEE Madrid PowerTech, Madrid, Spain, 28 June–2 July 2021; pp. 1–6. [Google Scholar]
- Muratori, M.; Alexander, M.; Arent, D.; Bazilian, M.; Cazzola, P.; Dede, E.M.; Farrell, J.; Gearhart, C.; Greene, D.; Jenn, A.; et al. The rise of electric vehicles—2020 status and future expectations. Prog. Energy 2021, 3, 022002. [Google Scholar] [CrossRef]
- Mancini, E.; Longo, M.; Yaici, W.; Zaninelli, D. Assessment of the Impact of Electric Vehicles on the Design and Effectiveness of Electric Distribution Grid with Distributed Generation. Appl. Sci. 2020, 10, 5125. [Google Scholar] [CrossRef]
- Chen, H.; Tong, Y.; Wu, L. Forecast of Energy Consumption Based on FGM(1, 1) Model. Math. Probl. Eng. 2021, 2021, 6617200. [Google Scholar] [CrossRef]
- Morlock, F.; Rolle, B.; Bauer, M.; Sawodny, O. Forecasts of Electric Vehicle Energy Consumption Based on Characteristic Speed Profiles and Real-Time Traffic Data. IEEE Trans. Veh. Technol. 2020, 69, 1404–1418. [Google Scholar] [CrossRef]
- Hu, K.; Wu, J.; Schwanen, T. Differences in Energy Consumption in Electric Vehicles: An Exploratory Real-World Study in Beijing. J. Adv. Transp. 2017, 2017, 4695975. [Google Scholar] [CrossRef] [Green Version]
- Delgado, J.E.C.; Bravo, E.F.C.; Arango, S.O. Una Propuesta Metodológica para Dimensionar el Impacto de los Vehículos Eléctricos sobre la Red Eléctrica. Ingeniería 2016, 21, 154–175. [Google Scholar] [CrossRef]
- Das, H.S.; Rahman, M.M.; Li, S.; Tan, C.W. Electric vehicles standards, charging infrastructure, and impact on grid integration: A technological review. Renew. Sustain. Energy Rev. 2020, 120, 109618. [Google Scholar] [CrossRef]
- Jiang, Z.; Tian, H.; Beshir, M.J.; Vohra, S.; Mazloomzadeh, A. Analysis of electric vehicle charging impact on the electric power grid: Based on smart grid regional demonstration project—Los Angeles. In Proceedings of the 2016 IEEE PES Transmission & Distribution Conference and Exposition-Latin America (PES T&D-LA), Morelia, Mexico, 20–24 September 2016; pp. 1–5. [Google Scholar]
- Coban, M.; Tezcan, S.S. Analysis of Impact of Electric Vehicles on Distribution Grid Using Survey Data. In Proceedings of the 2019 3rd International Symposium on Multidisciplinary Studies and Innovative Technologies (ISMSIT), Ankara, Turkey, 11–13 October 2019; pp. 1–4. [Google Scholar]
- Khan, O.G.M.; El-Saadany, E.; Youssef, A.; Shaaban, M. Impact of Electric Vehicles Botnets on the Power Grid. In Proceedings of the 2019 IEEE Electrical Power and Energy Conference (EPEC), Montreal, QC, Canada, 16–18 October 2019; pp. 1–5. [Google Scholar]
- Anastasiadis, A.G.; Kondylis, G.P.; Polyzakis, A.; Vokas, G. Effects of Increased Electric Vehicles into a Distribution Network. Energy Procedia 2019, 157, 586–593. [Google Scholar] [CrossRef]
- Khalid, M.R.; Alam, M.S.; Sarwar, A.; Asghar, M.S.J. A Comprehensive review on electric vehicles charging infrastructures and their impacts on power-quality of the utility grid. eTransportation 2019, 1, 100006. [Google Scholar] [CrossRef]
- Dixit, M. Impact of optimal integration of renewable energy sources and electric vehicles in practical distribution feeder with uncertain load demand. Int. Trans. Electr. Energy Syst. 2020, 30, e12668. [Google Scholar] [CrossRef]
- Ma, Z.; Callaway, D.S.; Hiskens, I.A. Decentralized Charging Control of Large Populations of Plug-in Electric Vehicles. IEEE Trans. Control Syst. Technol. 2013, 21, 67–78. [Google Scholar] [CrossRef]
- Sovacool, B.K.; Kester, J.; Noel, L.; Zarazua de Rubens, G. Actors, business models, and innovation activity systems for vehicle-to-grid (V2G) technology: A comprehensive review. Renew. Sustain. Energy Rev. 2020, 131, 109963. [Google Scholar] [CrossRef]
- Al-Saadi, M.; Patkowski, B.; Zaremba, M.; Karwat, A.; Pol, M.; Chełchowski, Ł.; Van Mierlo, J.; Berecibar, M. Slow and Fast Charging Solutions for Li-Ion Batteries of Electric Heavy-Duty Vehicles with Fleet Management Strategies. Sustainability 2021, 13, 10639. [Google Scholar] [CrossRef]
- Kühnbach, M.; Stute, J.; Gnann, T.; Wietschel, M.; Marwitz, S.; Klobasa, M. Impact of electric vehicles: Will German households pay less for electricity? Energy Strateg. Rev. 2020, 32, 100568. [Google Scholar] [CrossRef]
- Mohammad, A.; Zamora, R.; Lie, T.T. Integration of Electric Vehicles in the Distribution Network: A Review of PV Based Electric Vehicle Modelling. Energies 2020, 13, 4541. [Google Scholar] [CrossRef]
- Gao, P.; Kaas, H.W.; Mohr, D.; Wee, D. McKinsey Automotive Revolution & Perspective Towards 2030, How the convergence of disruptive technology-driven trends could transform the auto industry. Adv. Ind. 2016, 5, 20–25. [Google Scholar]
- Assef, Y.; van Berkel, T.; van Heesbeen, J. Smart Charging–an efficient instrument to optimise the Total Cost of Ownership of EVs. In Proceedings of the EVS30 International Battery, Hybrid and Fuel Cell Electric Vehicle Symposium, Stuttgart, Germany, 9–11 October 2017. [Google Scholar]
- Schulz, F.; Rode, J. Public charging infrastructure and electric vehicles in Norway. Energy Policy 2022, 160, 112660. [Google Scholar] [CrossRef]
- European Alternative Fuels Observatory. AF Market Share New Registrations Share New Registrations M1. 2020. Available online: https://www.eafo.eu/countries/norway/1747/vehicles-and-fleet (accessed on 22 November 2021).
- Hoover, Z.; Nagele, F.; Polymeneas, E.; Sahdev, S. How charging in buildings can power up the electric-vehicle industry. McKinsey 2021, 9, 1–8. [Google Scholar]
- Transport & Environment. Electric Surge: Carmakers’ Electric Car Plans across Europe 2019–2025. Available online: https://www.transportenvironment.org/wp-content/uploads/2021/07/2019_07_TE_electric_cars_report_final.pdf (accessed on 5 October 2021).
- European Alternative Fuels Observatory. Vehicles and Fleet. Available online: https://www.eafo.eu/countries/portugal/1749/vehicles-and-fleet (accessed on 5 October 2021).
- ACAP ACAP|Estatisticas. Available online: https://acap.pt/pt/estatisticas (accessed on 2 May 2021).
- UVE Vendas Arquivos-UVE. Available online: https://www.uve.pt/page/category/veiculo-eletrico/vendas/ (accessed on 2 May 2021).
- Walton, B.; Hamilton, J.; Alberts, G.; Fullerton-Smith, S.; Day, E.; Ringrow, J. Electric vehicles Setting a course for 2030. Deloitte Insights 2020, 15, 1–30. [Google Scholar]
- Ministério do Ambiente e Ação Climática. PNEC 2030-Plano Nacional Energia e Clima 2021–2030. 2019. Available online: https://www.portugalenergia.pt/setor-energetico/bloco-3/ (accessed on 2 May 2021).
- Awadallah, M.A.; Singh, B.N.; Venkatesh, B. Impact of EV Charger Load on Distribution Network Capacity: A Case Study in Toronto. Can. J. Electr. Comput. Eng. 2016, 39, 268–273. [Google Scholar] [CrossRef]
- Instituto Nacional de Estatística INE. Available online: www.ine.pt (accessed on 2 October 2021).
- PORDATA População Residente. Available online: https://www.pordata.pt/Municipios (accessed on 2 May 2021).
- Sanguesa, J.A.; Garrido, P.; Martinez, F.J.; Marquez-Barja, J.M. Analyzing the Impact of Roadmap and Vehicle Features on Electric Vehicles Energy Consumption. IEEE Access 2021, 9, 61475–61488. [Google Scholar] [CrossRef]
- Aljohani, T.M.; Ebrahim, A.; Mohammed, O. Real-Time metadata-driven routing optimization for electric vehicle energy consumption minimization using deep reinforcement learning and Markov chain model. Electr. Power Syst. Res. 2021, 192, 106962. [Google Scholar] [CrossRef]
- Li, J.; Wu, X.; Xu, M.; Liu, Y. A real-time optimization energy management of range extended electric vehicles for battery lifetime and energy consumption. J. Power Sources 2021, 498, 229939. [Google Scholar] [CrossRef]
- Bacelar, R. Os 10 Carros Elétricos Mais Vendidos em Portugal em 2019-4gnews. Available online: https://4gnews.pt/carros-eletricos-mais-vendidos-portugal/ (accessed on 2 May 2021).
- Argue, C. Electric Vehicles. Available online: https://www.geotab.com/blog/ev-battery-health/ (accessed on 5 May 2021).
- IMT Instituto da Mobilidade e dos Transportes. Available online: http://www.imt-ip.pt/sites/IMTT/Portugues/BibliotecaeArquivo/Paginas/BibliotecaeArquivo.aspx (accessed on 2 May 2021).
- ARAN Associação Nacional do Ramo Automóvel. Available online: https://aran.pt/pt/publicacoes/estatisticas (accessed on 2 May 2021).
- Público. Ministro do Ambiente diz Que a Mobilidade é “Grande Aposta” Ambiental do Governo até 2030. 2020. Available online: https://www.publico.pt/2020/09/11/politica/noticia/ministro-ambiente-mobilidade-aposta-ambiental-governo-ate-2030-1931285 (accessed on 3 May 2021).
- Erdinç, F.G.; Erdinç, O.; Yumurtacı, R.; Catalão, J.P.S. A Comprehensive Overview of Dynamic Line Rating Combined with Other Flexibility Options from an Operational Point of View. Energies 2020, 13, 6563. [Google Scholar] [CrossRef]
- Faessler, B. Stationary, Second Use Battery Energy Storage Systems and Their Applications: A Research Review. Energies 2021, 14, 2335. [Google Scholar] [CrossRef]
- Haram, M.H.S.M.; Lee, J.W.; Ramasamy, G.; Ngu, E.E.; Thiagarajah, S.P.; Lee, Y.H. Feasibility of utilising second life EV batteries: Applications, lifespan, economics, environmental impact, assessment, and challenges. Alexandria Eng. J. 2021, 60, 4517–4536. [Google Scholar] [CrossRef]
- Sousa, E. Impacto dos Veículos Eléctricos Na Rede de Distribuição; Polytechnic of Porto: 2020. Available online: https://recipp.ipp.pt/bitstream/10400.22/16776/1/DM_EzequielSousa_2020_MEESE.pdf (accessed on 28 April 2021).
Publisher’s Note: MDPI stays neutral with regard to jurisdictional claims in published maps and institutional affiliations. |
© 2021 by the authors. Licensee MDPI, Basel, Switzerland. This article is an open access article distributed under the terms and conditions of the Creative Commons Attribution (CC BY) license (https://creativecommons.org/licenses/by/4.0/).