Abstract
This article presents the methodology, description, and results of experimental studies aimed at determining the impact of the copper concentration in a carbon–metal composite contact strip on the maximum temperature of the copper contact wire during a contact event when used for operation in the railway industry in Europe. Based on these tests, we determined the minimum percentage of copper that is required for the composite to meet the normative requirements for current loads. In addition to experimental research, a 3D FEM numerical model was also developed in which the contact strip and contact wire geometry were mapped, along with imposed loads resulting from the test for current loads mentioned above. Fifteen simulation variants were carried out for the established model, where the value of the thermal conductivity coefficient and the specific heat coefficient were varied. On this basis, we analyzed the sensitivity of thermal coefficients to the contact wire temperature and determined the minimum conductivity coefficient value, which allowed the maximum copper contact wire temperature of 120 °C to be obtained during the verification tests.
1. Introduction
The cooperation between the pantograph of a railway vehicle and the overhead contact line boils down to the contact between the contact plates of the pantograph and the contact wire. This essentially results in contact between two different materials—the carbon composite of strips with the copper of the railroad wire. Many phenomena associated with friction and current flow occur in this region during contact. Therefore, many research centers around the world are trying to explore and describe the phenomena occurring at the interface of these materials. For example, problems resulting from additional adverse phenomena associated with difficult operating conditions during operation are considered, such as rain, snow or ice and heat and the occurrence of an electric arc, thermal shock, abrasive, and catastrophic wear, etc. [1,2,3,4,5]. These difficult working conditions and the presence of high currents at the point of contact cause material degradation, which affects the quality of cooperation of this friction pair [5,6,7,8]. An issue considered often in the literature on this topic is heating at the contact point, which depends on such factors as electric arc [2,3], friction [9,10,11], long train stoppage, and the use of high currents [12] and other phenomena [7,13,14]. In Poland, contact strips made of carbon rather than copper have been used since 2011 in an attempt to adapt to the requirements of the TSI [15]. Therefore, to be able to select appropriate materials conforming to national conditions, it was necessary to carry out verification tests in accordance with normative requirements [16,17,18,19]. In our laboratory, we have also carried out numerous certification [20] and operational [21] tests to assess the quality of cooperation between carbon contact strips and copper contact wire on rolling stock operated in Poland. In these studies, special attention was paid to thermal issues. Our unit has experience in experimental and simulation works related to heat flow modeling in transport [20]. However, this was a continuation of experimental research as well as the modeling and results of FEM simulation studies regarding heating at the point of contact between contact strips and contact wire and its dependence on the materials used in the contact strips. The subject of experimental research was to determine the impact of copper percentage and numerical tests on thermal coefficient values on the maximum temperature of the contact wire.
The development of new composite materials has enabled the implementation of new construction and maintenance solutions in many industries. In the railway industry, one of the most visible changes in the use of new materials is the replacement of copper inlays from the start of the rail comprising carbon composite inserts with the addition of copper. This resulted from the need to reduce wear of the contact wire as well as to eliminate graphite grease, which has an adverse effect on the environment. Replacing copper in the mechanical and electrical system requires adaptation of the new material in terms of physicochemical properties to such an extent that it does not reduce the quality and functionality of the elements made of these new materials. In the case of carbon strips, it is necessary to introduce the optimum amount of copper into the composite that, on the one hand, will allow the current to flow properly yet not result in the contact wire heating up (due to the possibility of its recrystallization above 200 °C) and, on the other hand, will not exceed the maximum value established in the TSI requirements, which is 40%. Determining the value of the optimum concentration of copper in carbon composite is critical to ensure operational suitability and the economic efficiency of the production and use of a new type of contact strip. Therefore, the purpose of the work being carried out is considered valid and substantively and economically justified.
The use of carbon composite in contact strips has led to a number of tangible benefits, such as reduced wear on the strips and the contact wire. However, problems also, unfortunately, arose, due to the specificity of the power supply system used in Poland, i.e., 3000 V direct current, as well as climatic and operational conditions. Due to the relatively low voltage in the electrical network, assuming a constant value of the power demand of the traction vehicle, e.g., 5 kW as for the Dragon locomotive, it can be seen in the simplification that this level of power can be obtained with a supply voltage of over 1600 A. An obvious problem of using a relatively low voltage power source is the generation of a very large amount of flowing current which, in turn, necessitates the use of cables with very low resistance.
This especially applies to contact strips. In addition, the generation of large amounts of heat in the event of such high currents is a significant threat to the integrity of the contact wire.
In the literature, there are numerous publications devoted to the problem of heating at the point of contact between the strip and the wire [3,5,7,9,10,12,13]. We have also conducted numerous different studies aimed at determining the parameters affecting the heat generation at the contact strip–contact wire interface during contact [19,20]. As stated based on previous studies, the basic feature that affects the possibility of using a given contact strip is its electrical conductivity, which is directly determined by the amount of copper content in the carbon composite. Therefore, we earlier tested the concentration of metals used in contact wire and its effect on the resulting thermal resistance [21] as a basis for the current study.
2. Methodology of Experimental Studies
Based on the normative requirements, it was determined that the maximum temperature of the contact wire should not exceed 120 °C. Measurements were made for the contact strip with contact wire loaded with 200 A current for 30 min.
The test stand (Figure 1) represents a power supply system with one profiled contact wire—Cu-ETP (type according to EN 50149:2012, 100 mm2), made of copper of Cu-ETP grade together with carbon strips. In the electrical circuit of power supply–contact wire, contact strip–power supply, 200 A current flowed. The value for the current was measured using a Lutron CM-9930 clamp meter.
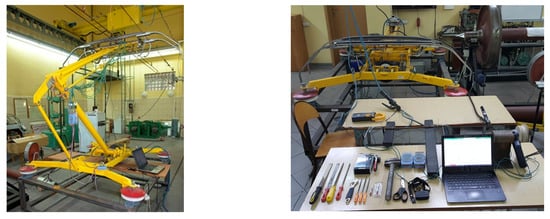
Figure 1.
Pantograph equipment is used for research and contact strip material testing [21].
The contact strips pressed the contact wire with a force of 102 N. Thermocouples were placed on the contact wire above the contact strips, as shown in Figure 2.
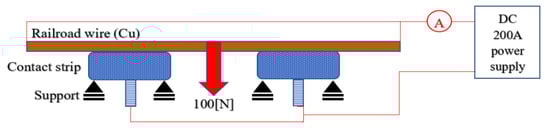
Figure 2.
Diagram of the measuring system.
In addition, the temperature was monitored using a thermal imaging camera. From the image acquired by this thermal imaging camera, information about the temperature distribution in the entire system can be obtained and helps determine the location of thermocouple mounting.
Contact strips made of materials with different percentages of copper were tested. The materials were marked with letters in the order of the increasing copper concentration in the carbon composite (Table 1).

Table 1.
Copper percentage in the carbon–copper composite strips [21].
3. Results of Experimental Studies
During the first few minutes of temperature measurements, it could already be preliminarily determined whether a given material would meet the needed condition of not exceeding 120 °C. The tests were conducted for a period of half an hour required as the norm, which allowed subsequent correlation of the results with those from the FEM numerical model. The obtained results are presented in Table 2.
Table 2.
Temperatures of contact wire for various copper concentrations in the material of contact strips [21].
Based on the results in Table 2, it can be concluded that material A, i.e., a material with very low copper content (the material used in the 15 kV contact system), did not meet the assumed limit and exceeded the allowable temperature. Additionally, as shown by the research, the presented contact strip could recrystallize the contact wire copper (exceeding 200 °C) after approx. 9 min of cooperation at a standstill under the service conditions.
The obtained results that permit the designation of the minimum copper concentration above which the standards for contact wire heating will be met are presented in Figure 3.
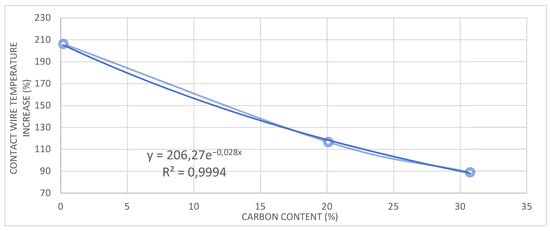
Figure 3.
Relation between contact wire temperature and carbon content in a contact strip made of various materials.
Based on Equation (1), it can be concluded that the contact wire will reach the permissible temperature of 120 °C with a minimum copper content of 26%:
where: ΔTCu °C—increase in the contact wire temperature; C %—the concentration of copper in the composite material.
ΔTCu = 206.27 × C × e −0.028 C
For all tested materials, the binder content did not exceed 5%. Additionally, according to Formula (1), we can find that by making a 100% copper contact strip, the contact wire temperature will rise by 12 °C, which has been confirmed by performing these measurements for previously used copper strips.
Of course, the demonstrated impact of the copper concentration in the carbon strip is of the greatest importance for the contact system with a supply voltage of 3 kV. The research on the influence of the copper concentration in the contact strip of the rail pantograph on the maximum contact wire temperature demonstrates that the increase in copper concentration significantly reduces the contact wire temperature.
The presented experimental research allowed verification of the FEM model. Reference material marked as “C” was chosen from the experimental research. The average Cu-ETP temperature of 111.6 °C and maximum temperature of 121.8 °C were obtained for this contact strip material.
4. Aim and Methodology of Research Using FEM Analysis
The numerical analysis is meant to demonstrate the effect of the thermal properties of materials used in the slide pantographs of rail pantographs on the achieved contact wire temperature values. The basic thermal properties of materials include:
- -
- Thermal conductivity k (a measure of the material’s ability to conduct heat in the body), W × m−1 × K−1;
- -
- Specific heat from c (the heat capacity of a sample of the substance divided by the mass of the sample), J × K−1 × kg−1;
- -
- Convection coefficient h (a measure of the material’s ability to conduct heat in a liquid), W/(m2 × K);
- -
- Thermal expansion coefficient α (the tendency of matter to change its shape in response to a change in temperature) K−1;
- -
- Emissivity coefficient ε (the effectiveness of the surface of a material to emit energy as thermal radiation).
Our research shows that the convection coefficient depends mainly on the speed of the air stream and, to a much lesser extent, on body temperature. On this basis, a constant value was selected for this coefficient—h = 5 W/(m2 × K) for the carbon strip surface and h = 8 W/(m2 × K) for the copper contact wire. The emissivity coefficient is important for temperatures of tested materials that are higher than the values obtained during experimental tests.
The thermal expansion coefficient, however, is important in terms of structural strength, stress distribution, and deformation. The analysis is of the coupled field thermal–mechanical type; however, only thermal issues are considered in this article.
Therefore, further verification of the effect of thermal conductivity and specific heat is important. In the literature, there are large differences in the accepted values. Depending on the voltage used in the overhead contact line, it is possible to use composite materials based on carbon with different copper content. To transfer the required power in the case of a network supplied with 3 kV, the use of strips with a small amount of copper does not work in practice and does not pass the current-carrying capacity tests.
Therefore, it is important to be able to assign the critical value of the weight proportion of copper and the thermal properties of the strip material through engineering design such that the finished product meets the expected requirements.
In order to determine the minimum value of thermal conductivity and specific heat of the sliding strip material and their combination, 15 simulations were performed, i.e., using 5 different thermal conductivity values and 3 specific heat values. This test also allowed us to analyze the sensitivity of these coefficients to contact wire heating based on changes in their values.
5. FEM Mode—Boundary and Initial Conditions
The goal of FEM analysis is to present the impact of two basic thermal properties of the material, i.e., specific heat, c J/(kg × K), and thermal conductivity, λ W / (m × K), on the temperature distribution of the contact strip and the maximum value of the contact temperature. This indirectly allows designing or verifying the composition of the contact strip material to determine whether it will meet operational expectations and, in particular, whether a positive test result will be obtained for the current capacity.
The amount of heat introduced into the system can also be determined from the heating power. The current flowing in the system, according to the requirements of point 15 of the standard [PN 91001], is I = 200 A. However, it is necessary to measure the voltage drop across the contact–strip–contact wire. The measured voltage drop allows the reliable determination of the power P = U × I W, bypassing the loss of electrical power in the power supply system and supplying energy to the system (heating the power cables). Determined in this way, it is converted to heat flow at the contact point (contact resistance):
For FEM calculations, the heat flux density q W/m2 is required. Taking the nominal contact width, L = 1.6 mm, and the width of the contact strip s = 61 mm from experimental research and literature data [7], the contact surface area A = 0.0000976 m2 is obtained. Hence, the heat flux density q is:
This gives the amount of heat, Q, introduced into the system in time t = 30 min = 1800 s, which is equal to
It should be noted that in the system required by the standard, the total current value is divided into two contact strips. The amount of heat given off at the contact point can also be determined by knowing the contact point resistance. The dependence of Joule heating is then used.
In the case under consideration, the value of 0.03 Ω was adopted.
where:
Q = R·I2·t J
- Q heat generated in the contact zone (Joule heating), J;
- R contact resistance, Ω;
- I current flowing in the circuit, A;
- t time, s.
It should also be noted that the tests indicated in the standard [17] require the use of two contact strips and, therefore, the load will be 0.5 × Q in the FEM model.
Input parameters of the carbon composite event for the FEM model:
Constants:
- q Heat flux density: q = 378,000 W/m2;
- F1 Pressure force on one contact strip (nominal for 2 is 90–120): F1 = 60 N;
- α Coefficient of thermal expansion: α = 4.43 × 10−06 K−1;
- E Young’s modulus: E = 1.68·1011 Pa;
- ν Poisson’s ratio: ν = 0.3;
- h Convection coefficient: h = 8 W/(m2 × K), as for free convection;
- ρ Density: ρ = 2400 kg/m³;
Variables:
- k Thermal conductivity—range from k = 5 to k = 60: W × m−1 × K−1;
- c Specific heat from c = 350 to c = 900: J × K−1 × kg−1;
For the tested reference sample “C”:
- k Thermal conductivity—range from k = 24.5 W/(m × K);
- c Specific heat from c = 350 J/(K × kg).
Input parameters of aluminum alloy adopted for the FEM model:
- α Coefficient of thermal expansion: α = 23.1 × 10−06 K−1;
- E Young’s modulus: E = 0.69 × 10¹¹ Pa;
- ν Poisson’s ratio: ν = 0.33;
- h Convection coefficient: h = 8 W/(m2 × K), as for free convection;
- ρ Density: ρ = 2720 kg/m³;
- k Thermal conductivity: k = 200 W/(m × K);
- c Specific heat: c = 900 J/(K × kg);
Input parameters for copper adopted for the FEM model:
- α Coefficient of thermal expansion: α = 17 × 10−06 K−1;
- E Young’s modulus: E = 1.1 × 10¹¹ Pa;
- ν Poisson’s ratio ν = 0.33;
- h Convection coefficient: h = 8 W/(m2 × K), as for free convection;
- ρ Density: ρ = 8920 kg/m³;
- k Thermal conductivity: k = 401 W × m−1 × K−1;
- c Specific heat: c = 380 J × K−1 × kg−1.
6. FEM Model—Building Model Geometry
The FEM model is used to map the “current carrying capacity” test according to PN-K91001 (p. 2.14) and the test according to IET-4 (§12 p. 4). This test consists of a current load of two carbon strips and a single contact wire with a cross-section of 100 mm2 with a current of 200 A for 30 min. The allowable value of the contact wire temperature increase is 80 °C, with the initial value being set to 40 °C. This means that the maximum temperature of the contact wire cannot exceed 120 °C; see Figure 4.
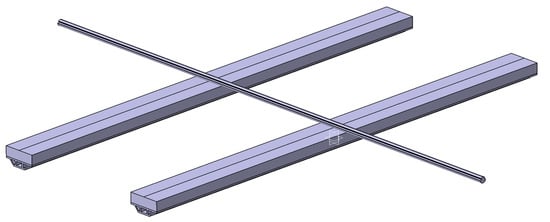
Figure 4.
Arrangement of strips and contact wire for testing.
The contact strip axles are 295 mm apart. The contact wire has a length of 1000 mm. The FEM model reproduces half of the system shown in Figure 5, i.e., one contact strip with an active length of 875 mm and a contact wire with a total length of 500 mm (division: 147.5 mm/352.5 mm). The contact surface of the contact wire with the contact strip has a width of 1.6 mm and is A = 1.6 × 61 = 97.6 mm2. Due to the need to perform numerous calculations and the purpose of the study, the FEM model did not model the full contact of the wire with the strip, but the contact surface was shared and this surface was thermally loaded. The CAD model was exported to the FEM program, but only the geometry of the contact strip cross-section and the contact wire Cu-ETP (with a cross-sectional area of 100 mm2) with geometry according to Iet-4 were used in this program. This allows for the reduction of possible modeling and importing errors in CAD/FEM programs; see Figure 6.
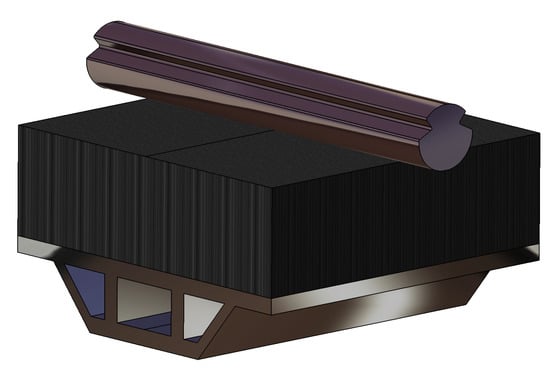
Figure 5.
Fragment of contact–contact wire and contact strip–CAD model.
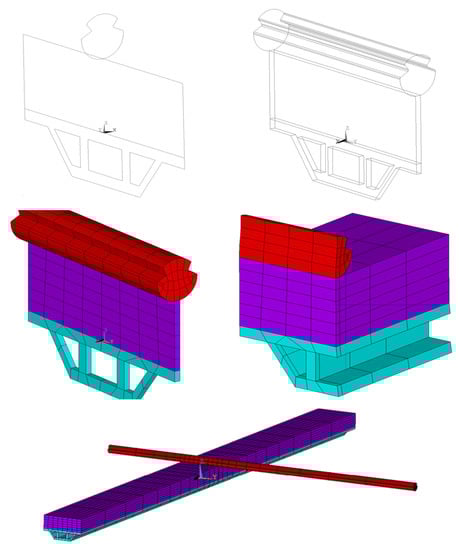
Figure 6.
Fragment of contact–contact wire and contact strip–CAD model.
A nonlinear elements type hexahedral with 20 nodes was used for the FEM model. This type of finite element allows for a coupled field with mechanical–thermal–electrical domain calculations. After repeated grid optimization, the model geometry was mapped using 2348 finite elements; see Figure 6.
The model receives six degrees of freedom, which is adequate for the method of attachment in the pantograph, i.e., the ends of the strip are supported in the z-axis (vertical) direction. At the ends of the strips, a degree of freedom in the y-direction (transverse to the strip) was also received. In the middle of the strip, the longitudinal direction (x-axis) has also been removed, which at the same time will ensure symmetry of deformation in accordance with real conditions.
7. Analysis of the Obtained Numerical Simulation Results
The FEM model contains elements with a nonlinear shape function with the possibility of carrying out coupled field (thermal–mechanical–electrical) calculations, but only the results of temperature distribution and total relative displacements were used in this study. The figure below (Figure 7) presents examples of temperature distributions of the sliding strip–contact wire system, and Figure 8, Figure 9, Figure 10, Figure 11 and Figure 12 shows the temperature distribution in cross section of this system, for variant BIII (designation according to Table 3).
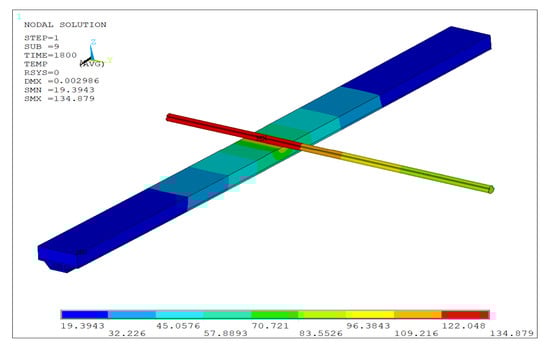
Figure 7.
Temperature distribution in the system: sliding strip–contact wire for a BIII strip material with a value of k = 15 W/(m × K) and c = 900 W/(kg × K).
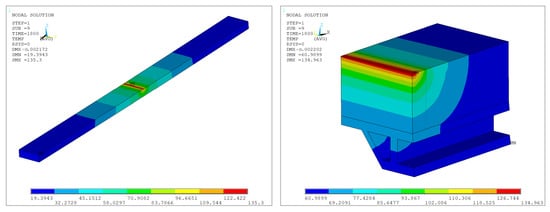
Figure 8.
Temperature field in the cross-section of the composite contact strip and the aluminum reinforcing bar.
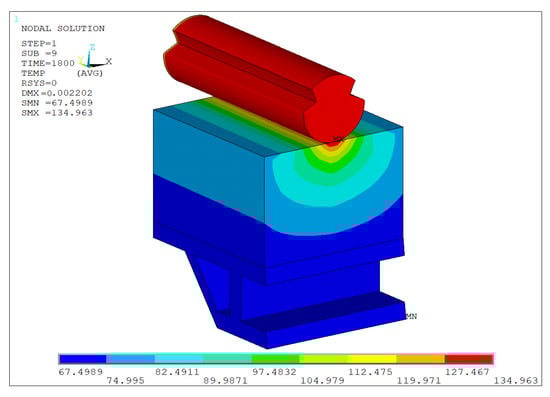
Figure 9.
Temperature field in the cross-section of the contact wire and composite contact strip with the aluminum reinforcing bar.
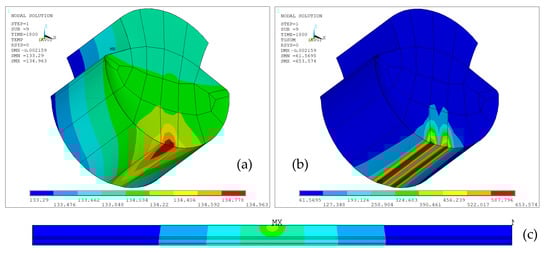
Figure 10.
Temperature (a), (c) and gradient temperature (b) in the cross-section of the copper headline.
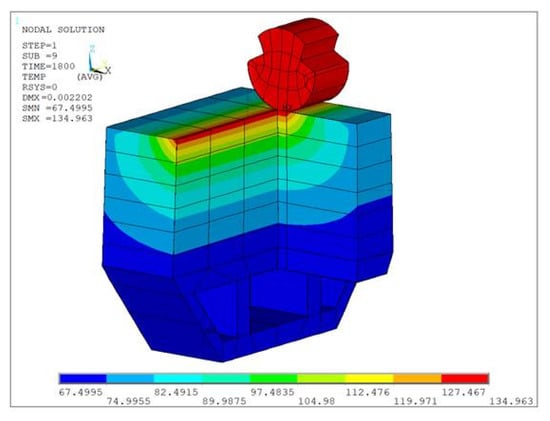
Figure 11.
Temperature field in the 3D model cross-section.
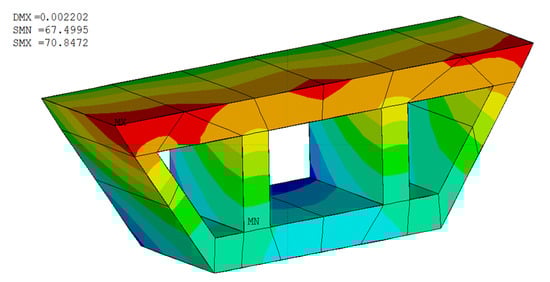
Figure 12.
Temperature field in the 3D model cross-section.
Table 3.
Combinations of simulated values of coefficients reflecting thermal properties.
Table 4 presents the input data for the analysis, while Figure 13 presents a summary of the impact of thermal conductivity and specific heat on the maximum contact wire temperature.
Table 4.
Input data for analysis of impact of thermal conductivity and specific heat on the maximum contact wire temperature.
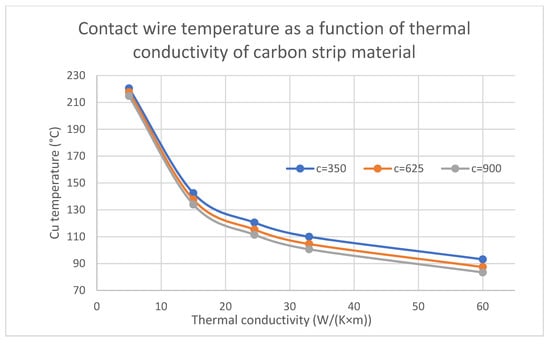
Figure 13.
Contact wire temperature (Cu temperature °C) as a function of the thermal conductivity (W/Km) of the carbon strip material.
The correlation between the value of the thermal conductivity k (W/(m × K)) of the contact strip and the contact wire heating temperature was calculated from the relationship:
Cr (k, TCu) = (∑ ((k − k) × (TCu − TCu))))/√(∑ ((k − k)2) × ∑ ((TCu − TCu))2))
The obtained value of Pearson’s correlation coefficient Cr is high and amounts to Cr = −0.830. This means that the contact wire temperature is strongly negatively affected by the thermal conductivity of the contact strip.
A high value of Cr (c, TCu) = −0.997 was also obtained for the correlation between the specific heat and contact wire temperature; however, the influence of the coefficient c on TCu and the coefficient k on TCu differs. By averaging the values for different specific heats, a graph of the relationship between thermal conductivity and the maximum contact wire temperature can be obtained – Figure 14.
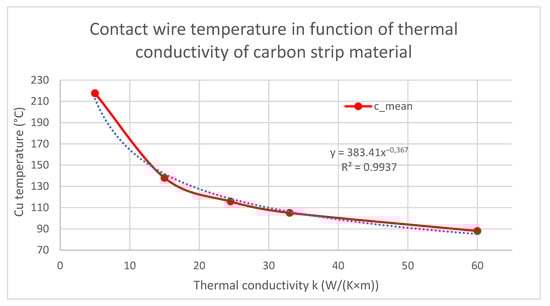
Figure 14.
Contact wire temperature-Cu temperature (°C) as a function of thermal conductivity of carbon strip material.
By approximating the results of the power function simulation with the R2 = 0.994 factor, one can determine the critical value of the thermal conductivity of the carbon strip material.
TCu = 383.41 × k−0.367
It is therefore possible to determine the value of k for which TCu will be 120 °C. The minimum value of thermal conductivity of the contact strip material determined on the basis of many FEM simulations is k = 23.7 W/(m × K). From the graph below (Figure 15), it can be seen that the dependence of TCU on the c-specific heat of the coefficient of contact strip is linear—R2 ≈ 1.
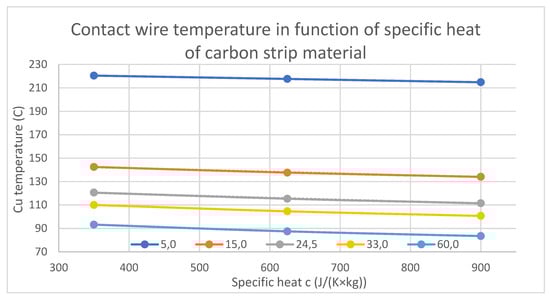
Figure 15.
Contact wire temperature as a function of thermal conductivity of the carbon strip material for specific heat.
Based on the simulation, it can be determined that at TCu = 120 °C, a unit change in the value of the coefficient k (thermal conductivity) causes a change in TCu (k + 1) of 1.8062 °C, and of the coefficient of specific heat by TCu (c + 1) = 0.0165 °C. On this basis, it can be said that the influence of the k coefficient on TCu is over 100 times greater than that of the c coefficient on TCu. Table 5 shows the influence of thermal conductivity and specific heat on carbon contact strip temperature, while Table 6 shows the influence of the above-mentioned factors on the maximum temperature of the aluminum profile.
Table 5.
Summary of the impact of thermal conductivity and specific heat on the maximum temperature of the carbon contact strip.
Table 6.
Summary of the influence of the thermal conductivity and specific heat factor on the maximum temperature of the aluminum profile.
The course of changes of contact strip temperature depending on thermal conductivity is shown in Figure 16.
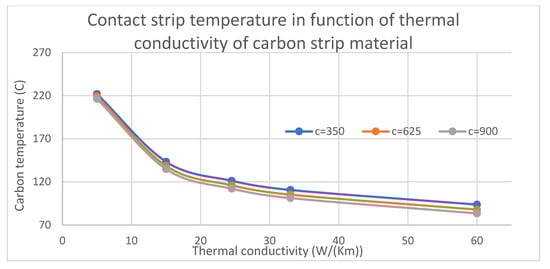
Figure 16.
Contact wire temperature as a function of thermal conductivity of carbon strip material.
Of interest is the dependence of the effect of thermal conductivity on the aluminum profile temperature. The highest temperatures of aluminum profiles were obtained for values in the range of k (15;25) W/(m × K), whereas the higher the value of c (specific heat coefficient), the higher the temperature of the aluminum profile–Figure 17.
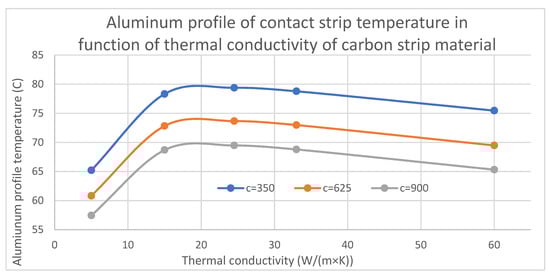
Figure 17.
Contact wire temperature as a function of thermal conductivity of carbon strip material.
The increase in temperatures in the tested system also affects the relative deformations of contact strip. The comparison of the obtained relative deformations is included in Table 7 and illustrated in Figure 18.
Table 7.
Summary of the influence of the thermal conductivity and specific heat coefficient on the maximum values of relative deformations of the contact strip.
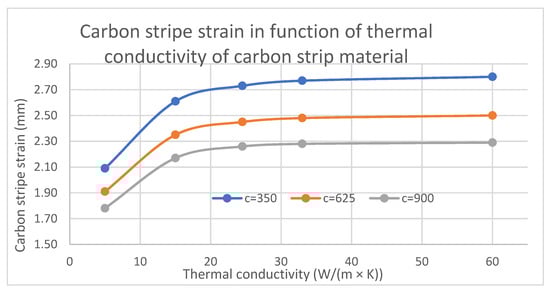
Figure 18.
Contact wire temperature as a function of thermal conductivity of carbon strip material.
Figure 18 shows that after exceeding the value of the coefficient k > 20 W/(Km), the relative deformations caused by the thermal stress of the contact strip are at a constant level, i.e., about 2.3–2.8 mm, depending on the specific heat value of the contact strip material.
8. Conclusions and Directions for Further Work
The experimental tests carried out on the effect of copper concentration in the contact strip material on the maximum contact wire temperature and the FEM numerical tests that were performed allowed us to determine the following conclusions:
- Based on the conducted experimental and numerical tests, it was found that the metal content and, thus, the thermal properties of the carbon composite contact strip have a substantial impact on the heating of the contact strip itself and the contact wire. The percentage of copper in the contact strip and the thermal conductivity coefficient have a significant impact, while the specific heat coefficient is not significant for the maximum temperatures of the strip and contact wire that were obtained.
- The established relationship (1) allowed us to determine the contact wire temperature on the basis of the copper concentration in the composite material of the contact strip.
- For the tested material of the contact strip (operatively marked as “C”), as a result of experimental tests, the average temperature of Cu-ETP was 111.6 °C and the maximum temperature was 121.8 °C, whereas the maximum temperature Cu-ETP resulting from the FEM model was 120.6 °C. This indicates a good correlation of the FEM model with the results of the experimental research.
- The FEM model included contact strips and contact wire in accordance with the testing requirements. Due to the symmetry, one contact strip with the corresponding contact wire was modeled. The FEM model was made as 3D, taking into account nonlinear finite elements of the hexahedral coupled field type (thermal-mechanical–electrical).
- The minimum value of the thermal conductivity coefficient of the contact strip material k ≥ 23.7 W/(m × K) was determined based on experimental research and subsequent numerical simulations. This value of the coefficient of thermal conductivity allows a positive result of the contact strip for heating. For comparison, the material tested experimentally (designated as “C”), which reaches the contact wire temperature close to the limit value of TCu = 120 °C, was characterized by the coefficient of thermal conductivity k = 24.5 W/(m × K). The determined value may form the basis for designing the composition of the material for the contact strip of the railway pantograph.
- Analysis of the sensitivity of factors k and c showed a strong negative correlation between the k-thermal conductivity coefficient and the maximum values of contact wire temperature and contact strip. It has been shown that the thermal conductivity of composite carbon–metal contact strips, in addition to the correlation with TCu, is characterized by a much greater (over 100-fold) effect on TCu values than the specific heat factor c. Comparing the unit increase in the coefficients k and c, the following effect on TCu was obtained, i.e., TCu (k + 1) = 1.8062 °C, while TCu (c + 1) = 0.0165 °C.
- Based on experimental research, it has been shown that the minimum value of the percentage of copper for the composite contact strip event is 26% Cu to comply with the contact wire temperature criterion of 120 °C (increase by 100 °C with respect to the ambient temperature of 20 °C and 34% Cu, on the assumption that the temperature increase will not be greater than 80 °C, the standard requirement [2,3]).
The above suggests a basic principle for contact strip designers: a minimum percentage of 26% copper in the strip should be ensured, or its thermal conductive coefficient k should not be lower than k = 23.7 W/(m × K).
The direction of further work will be to determine the correlation between the percentage of copper in the carbon composite strip of the sliding cover, which will also allow for further optimization of the structure of the contact strip–contact wire system. Therefore, it is important to develop a dynamic model with simultaneous FEM analysis in the near future to make it possible to visualize electrical and dynamic phenomena in the tested system.
Author Contributions
Conceptualization, A.M. and A.H.; methodology, A.M. and J.Ć.; validation, A.M., A.H. and J.Ć.; formal analysis, A.M.; investigation, A.M. and A.H.; resources, J.Ć.; data curation, A.M.; writing—original draft preparation, A.M., J.Ć. and A.H.; writing—review and editing, A.M., J.Ć. and A.H.; visualization, A.M.; funding acquisition, J.Ć. All authors have read and agreed to the published version of the manuscript.
Funding
This research was funded by the Faculty of Transport and Aviation Engineering of the Silesian University of Technology as part of the own research of the Department of Rail Transport.
Institutional Review Board Statement
Not applicable.
Informed Consent Statement
Not applicable.
Data Availability Statement
Upon request from the authors.
Conflicts of Interest
The authors declare no conflict of interest.
References
- Wei, W.; Song, Y.; Yang, Z.; Gao, G.; Xu, P.; Lu, M.; Tu, C.; Chen, M.; Wu, G. Investigation of the Impacts of Thermal Shock on Carbon Composite Materials. Materials 2019, 12, 435. [Google Scholar] [CrossRef] [PubMed] [Green Version]
- Hitoshi, H.; Tsuyoshi, M.; Hitoshi, N.; Ichiro, I. Influence of the Arc between the Contact Wire and the Pantograph on the Material of the Contact Strip. IEEJ Trans. Power Energy 2007, 127, 718–724. [Google Scholar]
- Ocoleanu, C.F.; Manolea, G.; Cividjian, G.; Bulucea, C.A. Numerical Study of Thermal Field of Pantograph Contact Strip-Contact Line Wire Assembly. In Proceedings of the 4th WSEAS International Conference on Automatic. Control Modeling and Simulation, Sousse, Kantaoui Tunisia, 3–6 May 2010; WSEAS Press: Craiova, Romania, 2008; pp. 139–143. [Google Scholar]
- Ding, T.; Chen, G.X.; Bu, J.; Zhang, W.H. Effect of temperature and arc discharge on friction and wear behaviours of carbon strip/copper contact wire in pantograph–catenary systems. Wear 2011, 271, 1629–1636. [Google Scholar] [CrossRef]
- Yaman, O.; Aydin, I.; Karaköse, M.; Akin, E. Contact point analysis of catenar-pantograph system by using normal and thermal images. In Uluslar Arası Raylı Sistemler Mühendisliği Sempozyumu (ISERSE’13); ISERSE: Karabük, Türkiye, 2013; pp. 1–8. [Google Scholar]
- Bucca, G.; Collina, A. A procedure for the wear prediction of collector strip and con-tact wire in pantograph—Catenary system. Wear 2009, 266, 46–59. [Google Scholar] [CrossRef]
- Ocoleanu, C.F.; Popa, I.; Manolea, G.; Dolan, A.I. Temperature measurement in contact pantograph—AC contact line. In Proceedings of the 11th WSEAS International Conference on Automatic Control Modeling and Simulation, Istanbul, Turkey, 30 May–1 June 2009; pp. 184–188. [Google Scholar]
- Plesca, A. Thermal analysis of sliding electrical contacts with mechanical friction in steady conditions. Int. J. Therm. Sci. 2014, 84, 125–133. [Google Scholar] [CrossRef]
- Delcey, N.; Baucour, P.; Chamagne, D.; Wimmer, G.; Auditeau, G.; Bausseron, T.; Bouger, O.; Blanvillain, G. Thermal Modelling and Experimental Comparison for a Moving Pantograph Strip. World Academy of Science. Eng. Technol. Int. J. Civ. Environ. Eng. 2017, 11, 9. [Google Scholar]
- Jie, R.; Zhi-en, L.; Fu-wu, Y.; Hong-mei, L. Research on the Heat Transfer of High-speed Railway Pantographs. Appl. Mech. Mater. 2014, 490, 936–941. [Google Scholar]
- Bausseron, T. Etude De L’échauffement De La Caténaire Lors Du Captage à L’arrêt: Développement D’un Outil Informatique. Ph.D. Thesis, Université de Franche-Comté, Besançon, Franche-Comté, France, 2014. NNT: 2014BESA2062. [Google Scholar]
- Ocoleanu, C.F.; Manolea, G.; Popa, I. Experimental validation of numerical results coresponding to catenary contact wire temperature. Electr. Eng. Ser. 2011, 35, 152–157. [Google Scholar]
- Nituca, C. Thermal analysis of electrical contacts from pantograph-catenary system for power suply of electric vehicles. Electr. Power Syst. Res. 2013, 96, 211–217. [Google Scholar] [CrossRef]
- Commission Regulation (EU) No 1301/2014 of 18 November 2014 on the Technical Specifications for Interoperability Relating to the ‘Energy’ Subsystem of the Rail System in the Union Text with EEA Relevance; European Commission, European Union: Luxembourg, 2014; pp. 179–227.
- EN 50405: 2006 Railway Applications—Current Collection Systems—Pantographs. Testing Methods for Carbon Contact Strips. Available online: https://standards.iteh.ai/catalog/standards/clc/0ee47273-f78a-4546-8cdc-7f99d5bb18ad/en-50405-2006 (accessed on 16 July 2021).
- EN 50367:2006 Railway Applications—Current Collection Systems—Technical Criteria for the Interaction between Pantograph and Overhead Line. Available online: https://standards.iteh.ai/catalog/standards/sist/250af1d5-5b16-4dde-a53a-70d1e8acaaba/sist-en-50367-2006 (accessed on 16 July 2021).
- EN 50206-1:2010 Railway Applications—Rolling Stocks—Pantographs: Characteristics and Tests—Part 1: Pantographs for Main Line Vehicles. Available online: https://standards.iteh.ai/catalog/standards/clc/a2726892-abb2-4326-a8a0-2614a1201deb/en-50206-1-2010 (accessed on 16 July 2021).
- Hełka, A.; Sitarz, M. Certification researches of carbon contact strips. Sci. J. Sil. Univ. Technol. Ser. Transp. 2013, 81, 45–50. [Google Scholar]
- Sitarz, M.; Hełka, A.; Mańka, A.; Adamiec, A. Testing of railway pantograph. Arch. Transp. 2013, 25, 85–95. [Google Scholar]
- Mańka, A.; Sitarz, M. Effects of a thermal load on the wheel/brake-block sub-system: The thermal conicity of railway wheels. Proc. Inst. Mech. Eng. Part F J. Rail Rapid Transit 2016, 230, 193–205. [Google Scholar] [CrossRef]
- Mańka, A.; Hełka, A.; Ćwiek, J. Influence of copper content on pantograph contact strip material on maximum temperature of railroad wire—Minimum cooper content. Sci. J. Sil. Univ. Technol. Ser. Transp. 2020, 106, 97–105. [Google Scholar] [CrossRef]
Publisher’s Note: MDPI stays neutral with regard to jurisdictional claims in published maps and institutional affiliations. |
© 2021 by the authors. Licensee MDPI, Basel, Switzerland. This article is an open access article distributed under the terms and conditions of the Creative Commons Attribution (CC BY) license (https://creativecommons.org/licenses/by/4.0/).