Abstract
To help mitigate the effects of global warming and fossil fuel depletion caused by human use of fossil fuels, solid fuel pellets were developed from a mixture of spent coffee grounds (SCG) and pine sawdust (PS). The feasibility of SCG-PS pellets as biofuel was also verified by evaluating its fuel quality. An increase in the proportion of SCG in the pellet led to an increase in its calorific value, owing to the high C, H, and oil contents, and increases in the ash and S contents, owing to the high S content in SCG. Analysis of the feedstock particle size distribution revealed that SCG particles are smaller than PS particles; thus, the durability of the pellet decreases as the proportion of SCG increases. Accordingly, the samples with higher SCG proportions (70 and 90 wt.%) did not meet the moisture content standards for biomass solid refuse fuel (bio-SRF) set by the Korea Ministry of Environment, whereas the samples with lower SCG proportions did. In particular, CP10 (10 wt.% SCG + 90 wt.% PS) satisfied the quality standards of Grade 1 wood pellets, demonstrating the feasibility of using SCG as a raw material for biofuel pellet production.
1. Introduction
The careless use of fossil fuels is responsible for issues such as global warming and energy resource depletion. Greenhouse gas (GHG) emissions from fossil fuel use have significantly increased, resulting in a seven-fold increase in the annual CO2 emissions, from 4 to 28 million tons, over the past 60 years [1,2]. Coal is a major global primary energy source, accounting for 27.8% of all primary energy sources, as of 2017. The exhaust emissions, such as CO2 and particulate matter (PM), generated by the use of coal have adverse effects, such as respiratory diseases, climate change, and reduced atmospheric visibility [3]. According to the Korea Institute for Energy Economics, coal is the most used energy source after petroleum, accounting for 28.5% of all energy sources in Korea, and its use increases annually [4]. To address these problems, there is growing interest in new and renewable energy sources that can replace fossil fuels. In particular, biomass and agro-industrial waste, which are renewable energy resources with environmental and economic benefits, are emerging as practical alternative energy resources [5].
Among new and renewable energy sources, bio-solid fuel is attracting research attention as an energy source that can replace coal. For example, the production of wood pellets increased by a factor of 22 in 10 years, from 8527 tons in 2009 to 187,745 tons in 2018 [6]. Driven by the surge in the demand for wood pellets, the imported volume of wood pellets is increasing annually. Approximately three million tons of wood pellets were imported in 2018, comprising approximately 94% of the total supply of wood pellets consumed in Korea [6]. The price of imported wood pellets increased by 52%, from USD 100 per metric ton in 2016 to USD 152 per metric ton in 2018, and the production cost of domestic wood pellets increased by 12% to KRW 370,000 per metric ton in 2019, compared with the previous year (KRW 330,000 per metric ton) [6,7]. To alleviate the increasing production cost of wood pellets and the difficulty of securing raw materials, extensive research is underway to develop agro-pellets using agricultural by-products and residual waste that can replace wood [8,9,10]. Among them, spent coffee grounds (SCG) are a potential raw material for pellets. As of 2017, the global coffee consumption amounted to 97 million metric tons, and coffee is the most traded commodity after petroleum [11,12]. Given the huge quantity of SCG residue from coffee production (2 kg of SCG per 1 kg of coffee), leading coffee suppliers such as Nestlé have sought to use SCG as compost, solid fuel, and biodiesel [13,14]. SCG is the main residue of the coffee industry, with 6 million tons generated worldwide annually [15]. In 2012, 3.12 million tons of coffee beans were imported into the EU to be processed and manufactured, and in the same year, 355,777 tons of instant coffee was produced in the EU and 400,000 tons of coffee grounds were generated in Japan [15,16]. The Korean National Assembly Research Service reported that the annual generation of spent coffee grounds (dry based) in Korea increased from 93,398 tons in 2012 to 149,038 tons in 2019. They reported that if all ~150,000 tons of coffee grounds were recycled as bioenergy raw materials, the cost of the energy supply produced through wood pellets in 2017 (including waste disposal and energy supply costs) could be reduced by USD 16 million and the supply could be reduced by about 8% (852,778 Gcal) [17]. In addition, Bio-bean, an SCG recycling company in the UK, reported that 80% of CO2 emissions could be reduced by reusing coffee grounds rather than disposing of them in landfills [18]. In Italy, according to Bottani et al., the mixture pellet price, which was analyzed based on various factors such as collection, transportation, and production, is 0.1 €/kg for SCG 50% pellets (50% pine sawdust (PS) blended) and 0.05 €/kg for 98% SCG pellets (2% starch blended) [19]. These results show that the price of SCG pellets is very low compared to the Italian wood pellet price of 0.27 €/kg in 2011 [20]. Generally, the price of SCG pellets is estimated to be about 40% of the price of wood pellets [21].
SCG is composed of a variety of organic compounds, including lignin, cellulose, lipids, polysaccharides, fats, and minerals, enabling SCG to be used in various fields [8]. SCG contains 15%–20% oil; thus, it has a high calorific value (19–26.9 MJ/kg). After it is converted into solid fuel, it can replace currently-used wood pellets [8,22]. However, raw materials with a high oil content tend to impair the densification of pellets, and they need to be mixed with other biomass or waste products [23]. In addition, a previous study revealed a significant decrease in burning efficiency and substantial increase in particle emissions (PM 2.5) for SCG pellets [5]. To overcome these deficiencies, some researchers have proposed mixing SCG with wood pellets [24]. Miranda et al., reported that the physical characteristics of pellets prepared using olive waste (pomace) and pyrenean oak residues varied with the blending ratio of the two materials. A higher proportion of olive pomace resulted in a higher calorific value, and a higher proportion of pyrenean oak residues produced higher durability [23]. Lisowski et al., reported that the mean particle size of SCG was 0.6 mm and that the particle size distribution is an important parameter of biomass because it affects durability and strength during the pelletization process [8]. These results suggest that the fuel characteristics of pellets vary with the particle size and feedstock blending ratio.
Previous studies have been conducted on the combustion performance and gaseous and particulate emission of SCG mixed pellets [5], evaluation of quality standards for pellets mixed with coffee and various biomasses [25], and determination of pellet characteristics according to pellet molding conditions [8]. Nosek et al., reported that the calorific value of pellets mixed with coffee grounds and pine sawdust increased with increasing in the proportion of coffee grounds and that the pellets with high proportions of coffee grounds produced increased the exhaust emissions [26]. However, there is a lack of evaluation based on the fuel quality standards to commercialize coffee and pine sawdust mixed pellets as fuel. To enable the utilization of SCG as pellets, a renewable energy resource with environmental and economic benefits, the quality standards of solid fuel must be met. Thus, in this study, we prepared pellet samples comprising a mix of SCG and PS, measured the sample size, and analyzed the effect of the sample particle size on the physical properties. In addition, as the fuel characteristics of the pellets changed according to the SCG mixing ratio, we evaluated their physicochemical fuel characteristics according to the SCG blending ratio to determine the feasibility of using SCG as a raw material for pellets. Finally, we proposed an optimal mixing ratio of SCG and PS to serve as a guideline in the manufacturing of SCG-PS pellets.
2. Materials and Methods
2.1. Feedstocks
SCG and PS, which were used as feedstocks for the experiment, were provided by Starbucks Coffee Korea and Pohang City Forestry Cooperative, respectively. Their pre-desiccation moisture contents were 46.3% and 34.2%, respectively. The feedstocks were dried in an oven at 105 °C for 24 h before pelletization [27]. The equilibrium moisture content of spent coffee grounds was 7%, and the moisture content was set to 15%–17% to facilitate pelletization [25]. Table 1 outlines the elemental and proximate analysis of SCG and PS, demonstrating that SCG has higher contents of C, H, and ash than PS.

Table 1.
Proximate and elementals analysis of feedstock.
2.2. Feedstock Particle Size Distribution
The particle sizes of the SCG and PS samples for pelletization were measured using a vibratory sieve shaker (SSH-310-1, Chunggye Corp., Seoul, Republic of Korea). A 100-g sample was placed on the sieve (mesh sizes: 4 mm, 2 mm, 1 mm, 500 µm, 250 µm, 106 µm, 53 µm, and 26 µm) and shaken for 5 min while being sieved to separate the sizes.
In this study, all measurements were performed in triplicate, and the mean values of the measurements are presented as the results. This applies to all measurements conducted in this study.
2.3. Pelletization Process
Pellets were formed by mixing SCG and PS using the following SCG:PS weight ratios: 0:10, 1:9, 3:7, 5:5, 7:3, 9:1, and 10:0, as listed in Table 2. CO and PS in Table 2 represent 100 wt.% SCG and 100 wt.% PS, respectively. CP10 and CP90 represent the blending ratios of SCG 10 wt.% to PS 90 wt.% and SCG 90 wt.% to PS 10 wt.%, respectively. The SCG and PS samples were dried to a moisture content of 15%–17% and were formed into pellets using a pelletizer (SP-3000, Geumgang ENG, Daegu, Republic of Korea) under the following conditions: preheating to 80 °C, compression ratio of 5, dice rotation speed of 11 rpm, and pelletizer torque of 22 kW. Table 3 presents the pelletizer specifications.

Table 2.
Names and spent coffee grounds (SCG) contents of the samples used in the experiment.

Table 3.
Pelletizer specifications.
2.4. Fuel Characteristics
2.4.1. Bulk Density
Bulk density is a useful index for estimating space requirements for transport and storage. It is expressed as the weight of the pellets that fill the volume of a specific container. The bulk density of the samples was calculated using the following Equation (1) as per ISO 17828:2015:
where BDar is the pellet bulk density on a wet basis (kg/m3), mpc is the weight of the container with the pellets (kg), mc is the weight of the empty container (kg), and V is the volume of the empty container (m3).
2.4.2. Durability
Durability is a measure of resistance to impact or abrasion during handling and transportation, and this fuel characteristic is strongly affected by the storage conditions [9,28]. A durability test was performed in accordance with the ISO17831-1:2015 standard for fuel pellet durability, and the durability was calculated using the pellet weights before and after tumbling in the following Equation (2):
where DU is the durability (%), mat is the pellet weight after tumbling (g), and mbt is the pellet weight before tumbling (g).
2.4.3. Moisture Content
The moisture content of the pellets was measured using a moisture analyzer (FD-720, KETT, Tokyo, Japan) in accordance with the method specified in ISO18134-1:2015. we determined the moisture content using the following Equation (3):
where MC is the moisture content (%), Mwt is the mass of the container and wet pellets (g), Mdt is the mass of the container and dry pellets (g), and Mc is the mass of the empty container (g).
2.4.4. Pellet Quality Standard
Analyses of ash (ISO 18122), the calorific value (ISO 18125), Cl and S (ISO 16994), and heavy metals (ISO 16968) were conducted by Daedeok Analytical Research Institute, Daejeon City, Republic of Korea. Table 4 outlines the quality standards for wooden pellets (KS M 3938:2017) and biomass solid refuse fuel (bio-SRF) of the Korea Ministry of Environment (Ministry of Environment Notification No. 2014-135). The quality of the pellets formed in this study was evaluated by comparing it with the quality standards for solid fuel presented in Table 4.

Table 4.
Quality standards for wood pellet and bio-solid refuse fuel.
2.5. Statistical Analyses
The differentials between the physicochemical properties of pellets with different SCG mixing ratios were compared using a one-way analysis of variance. Post hoc Tukey’s honest significant difference (HSD) test (p < 0.05) was conducted when significant differences were found. In addition, linear regression was used to determine to what extent the variation of the blending ratio of SCG would affect the response variables (physicochemical properties), and the signs and coefficients from the linear models were used to determine the trend (increasing/decreasing). The statistical analyses were performed using SPSS 20.0 (IBM Corp., Armonk, NY, USA).
3. Results and Discussion
3.1. Particle Size Distribution
Figure 1 illustrates the particle size distributions of SCG, PS, and a mixture of SCG and PS. SCG particles smaller than or equal to and larger than 500 µm accounted for 87.2% and 12.8%, respectively. The comparable values for PS were 95.3% and 4.7%; that is, SCG has a higher proportion of fine particles than PS. Accordingly, the higher the proportion of SCG in the SCG-PS mixture, the higher the proportion of particles smaller than 500 µm, which increased from 13.8% (CP10) to 76.8% (CP90). Moreover, the proportion of larger particles (≥500 µm) increased from 23.2% (CP90) to 86.2% (CP10) as the proportion of SCG decreases. SCG particles are assumed to be very fine as a result of grinding coffee beans with a grinder. In the pelletization process, the feedstock particle size distribution is the main factor affecting pellet quality parameters, such as bulk density and durability. It has been reported that a particle size of 1–2 mm is optimal for the formation of pellets with excellent physical properties [29,30]. The proportion of PS particles with a diameter of 1–2 mm is 10 times that of SCG particles (37.7% vs. 0.34%). Although pulverization of feedstocks is typically required for pelletization, SCG can be supplied in powder form, making pulverization superfluous, which has a cost-saving effect considering commercialization [31].
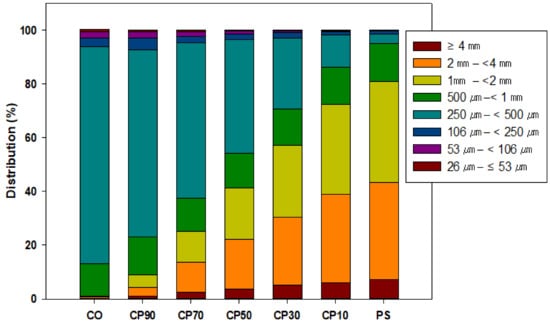
Figure 1.
Particle size distribution of feedstocks.
3.2. Evaluation of Fuel Characteristics
3.2.1. Pellet Size
Figure 2 compares the sizes of pellets produced using SCG, PS, and SCG-PS mixtures with five different blending ratios. It shows that the pellet size varies depending on the proportion of SCG. The pellet diameter increased as the SCG content increased until the blending ratio of SCG and PS reached 5:5, and it remained approximately constant at lower proportions of SCG. The pellet length increased as the proportion of SCG decreased, and it decreased when the proportion of SCG was less than 30%. This behavior indicates that the particle size of SCG affects the pellet size during pelletization and that for an SCG proportion lower than 10%, no difference is induced by the PS pelletization conditions. CO and CP90 have a mean diameter of 5 mm, falling short of the size standard (6–25 mm diameter). However, CP70, CP30, CP10, and PS satisfy the Grade 1 quality standard for wood pellets. CP50 had a mean diameter of 8 mm and corresponds to the Grade 4 standard for wood pellets. In terms of pellet length, all samples satisfy the quality standard of 32 mm or less. Figure 3 shows photographs of all the samples.
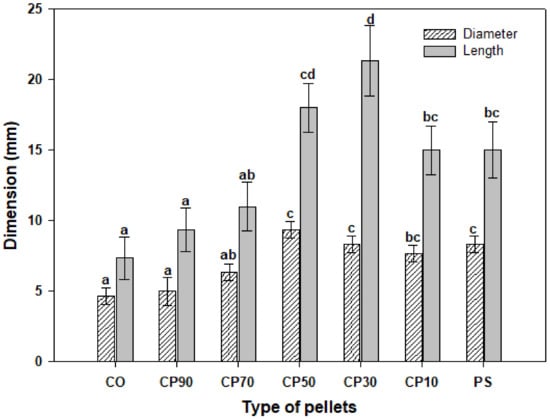
Figure 2.
Pellet size according to SCG blending ratio. Each point is the mean of three repeated measurements and is the mean ± standard deviation. The means with different letters (a–d) above the bars indicate significant differences based on Tukey’s honest significant difference (HSD) test (p < 0.05).
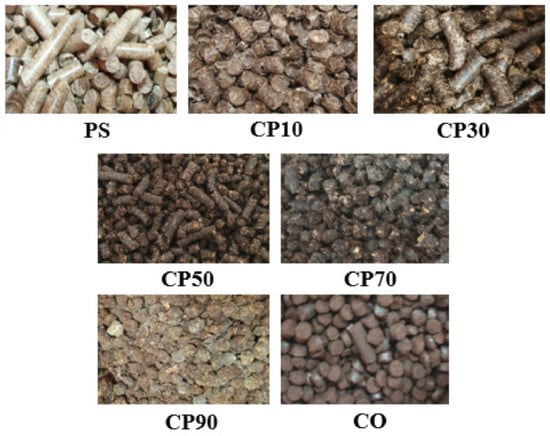
Figure 3.
Pellets produced using various blending ratios of SCG and pine sawdust (PS).
3.2.2. Bulk Density
As shown in Figure 4, the bulk density, which is dependent on the proportion of SCG, was the highest in the CO and PS single-feedstock samples and the lowest (510 kg/m3) in CO50 (SCG:PS = 50:50). The bulk density of CP50, which was pelletized with SCG and PS at a ratio of 5:5, was the smallest among all the samples, and it met the Grade 4 quality standard for wood pellets. The bulk density generally increased when pelletizing feedstocks with small particle sizes because smaller particles provide a larger surface area during densification [32]. However, when feedstocks of different particle sizes are mixed, smaller particles are excessively dried during the densification process, which impairs the interparticle bonding force, lowering the bulk density [33]. The lowest bulk density, observed in CP50, is assumed to be attributed to the irregular particle size distribution, which triggers separation between fine and coarse particles [34].
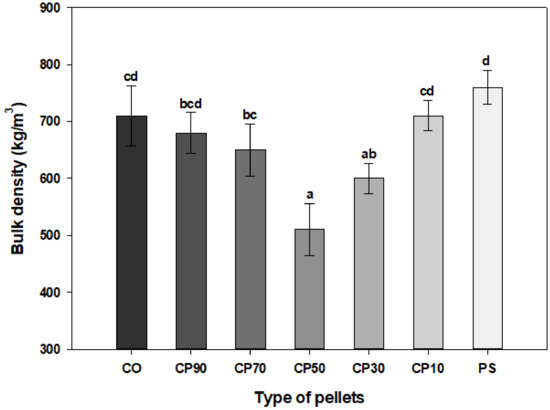
Figure 4.
Bulk density of pellets according to SCG blending ratio. Each point is the mean of three repeated measurements and is the mean ± standard deviation. The means with different letters (a–d) above the bars indicate significant differences based on Tukey’s HSD test (p < 0.05).
3.2.3. Moisture Content
The moisture content of each pellet sample was generally lower than that of the feedstocks (15%–17%) under the influence of frictional heat and the preheating temperature generated during the pelletization process [35]. As shown in Figure 5, the moisture contents of CP90 and CP70 were 15.5% and 12.1%, respectively, which failed to satisfy the moisture content standard of 10% or less for Grades 1 and 2 wood pellets. The moisture contents of all other samples were in the range of 7%–9.6%, satisfying the moisture content standard for Grades 1 and 2 wood pellets.
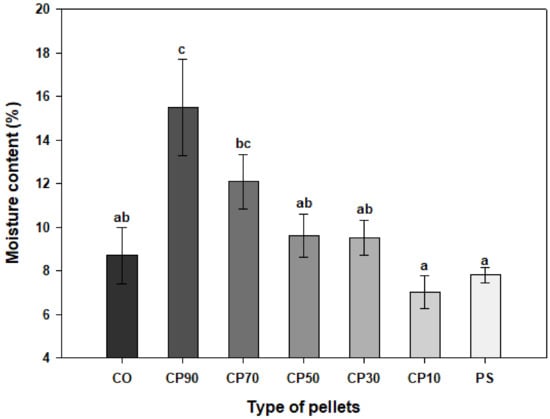
Figure 5.
Pellet moisture content according to SCG blending ratio. Each point is the mean of three repeated measurements and is the mean ± standard deviation. The means with different letters (a–c) above the bars indicate significant differences based on Tukey’s HSD test (p < 0.05).
3.2.4. Durability
Pellet durability is a measure of pellet strength. Currently, a durability of at least 95% is required according to domestic industrial wood pellet quality standards. Figure 6 shows the durability of the pellet samples for different proportions of SCG. CP30 and CP10 exhibited durability levels of 96.5% and 98.8%, respectively, satisfying the durability requirements for Grade 3 and Grade 1 wood pellets, respectively. However, the durability of the samples containing 50 wt.% SCG or more ranges from 67.9% to 87.1%, and thus did not satisfy the durability standard for wood pellets (≥95%).
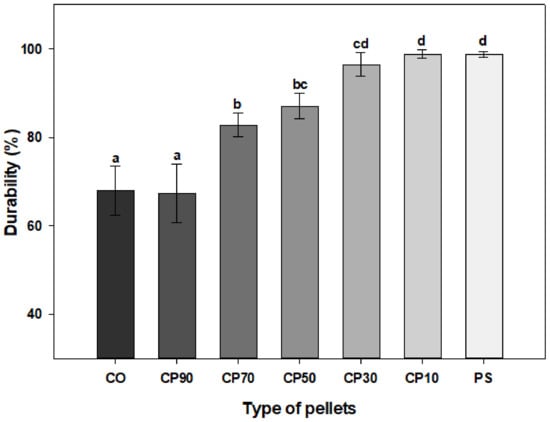
Figure 6.
Pellet durability according to SCG blending ratio. Each point is the mean of three repeated measurements and is the mean ± standard deviation. The means with different letters (a–d) above the bars indicate significant differences based on Tukey’s HSD test (p < 0.05).
According to previous studies, a feedstock with a high oil content (>6.5%) adversely affects the interparticle bonding force during pelletization, resulting in reduced durability [36]. Given the high oil content of SCG (15%–20%) [22], the durability decreased as the SCG proportion increased. This effect is due to interference with interparticle bonding, which results from a decrease in pelletization pressure [36]. This durability problem can be solved by adding a binder, such as lignin or starch, or by controlling the pelletization conditions (e.g., moisture content, temperature, and pelletization pressure) [36,37].
3.2.5. Calorific Value
Figure 7 compares the calorific values of the pellet samples. All samples, including both CO and PS single-feedstock samples and SCG-PS mixed pellet samples, met the quality standards for wood pellets and bio-SRF standards. The high heating value (HHV) and low heating value (LHV) of CO were the highest, at 23.8 and 20.1 MJ/kg, respectively. Those of PS were 20.7 and 17.6 MJ/kg, respectively; thus, the HHV and LHV values of the CO pellets were higher than those of the PS pellet sample by 15% and 14%, respectively. Miranda et al., reported that the calorific value increases as the C content of pellets increases [38], which may be attributed to the exothermic reaction that occurs when C and H react with O2 during combustion. Thus, the calorific value increased as the SCG proportion increased, owing to the effect of higher C and H contents compared with PS [39]. The oil component of SCG is also considered to have a positive effect on the calorific value [40]. In addition, energy consumption occurs when the moisture contained in the pellets evaporates during combustion, decreasing the calorific value. This characteristic explains why the calorific value was lower in CP90 than in CP70, despite the higher moisture content of the former [41].
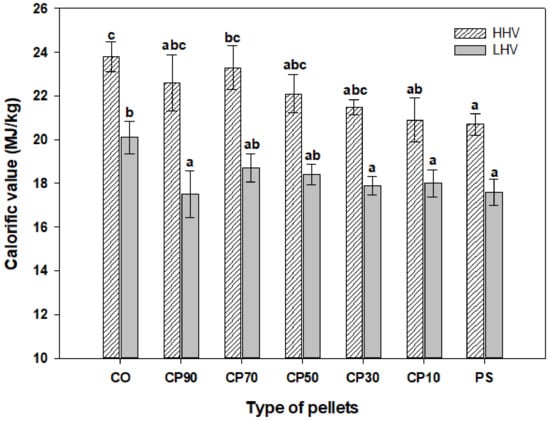
Figure 7.
Pellet heating value according to SCG blending ratio. Each point is the mean of three repeated measurements and is the mean ± standard deviation. The means with different letters (a–c) above the bars indicate significant differences based on Tukey’s HSD test (p < 0.05).
3.2.6. Ash
Ash refers to the inorganic residue remaining after the pellets are completely burned, which is expressed using a percentage according to dry weight. As shown in Figure 8, the ash content of the pellets was positively correlated with the SCG proportion and inversely correlated with the PS proportion. The ash content of pure SCG pellets was 2.5%, and that of pure PS pellets was 0.5%, which may be owing to the abundance of incomplete combustion elements contained in SCG compared with PS. The PS samples contained less than 0.1% N and 0.01% S; however, the corresponding values for the SCG samples were 2.91% and 0.37%. Additionally, Cl was more abundant in SCG than in PS (113 vs. 40 ppm). These differences in the contents of the components were verified to determine the ash content. The ash content of wood pellets should not exceed 1.0% and 6.0% to be classified into Grades 1 and 4, respectively, and the ash content satisfying the bio-SRF quality standard is less than 15.0%. The large difference in the quality standard between wood pellets and bio-SRF is in agreement with the difference between the ash content standard and wood pellet standard because bio-SRF contains more incomplete combustion factors than wood pellets. The ash contents of CO, CP90, and CP70 were calculated to be 2.5%, 2.4%, and 2.0%, respectively, meeting the Grade 3 (≤3.0%) standard for wood pellets. The ash contents of CP50 and CP30 satisfied the Grade 2 (≤1.5%) standard at 1.5% and 1.3%, respectively, and CP10 and PS satisfied the Grade 1 (≤0.7%) standard at 0.7% and 0.5%, respectively. Duca et al., reported that the level of ash content can serve as a parameter for the quick evaluation of pellet quality. If the quality standard of a grade with a high ash content is satisfied, other quality factors typically exhibit the same grade level as the grade for the ash content [42]. In this study, CP10 and PS, which satisfied the Grade 1 for the quality standard for ash content, satisfied the Grade 1 quality standard for all other factors as well.
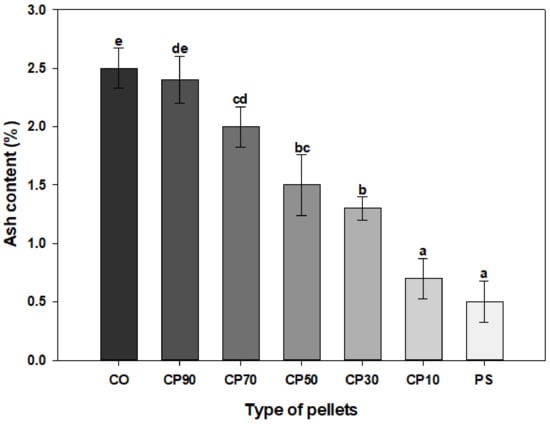
Figure 8.
Ash content of pellets according to SCG blending ratio. Each point is the mean of three repeated measurements and is the mean ± standard deviation. The means with different letters (a–e) above the bars indicate significant differences based on Tukey’s HSD test (p < 0.05).
3.2.7. Chlorine and Sulphur
Figure 9 shows the Cl and S concentrations in pellets with different blending ratios. Cl was present in negligible amounts (<0.01%) in all samples, satisfying the quality standard (<0.05%). Limousy et al., reported that the Cl concentrations in SCG and PS were negligible at 0.011% and 0.004%, respectively [5]. The S concentrations in PS, CP10, and CP30 were 0.01%, 0.02%, and 0.04%, respectively, satisfying the Grade 1 (<0.05%) standard for S concentration in wood pellets. The S concentrations in SCG and PS were 0.37% and less than 0.01%, respectively, and the S concentration increased as the SCG proportion increases, owing to the high S content in SCG. S and Cl constitute the major defects of pellets that mix agricultural by-products and wood residues because they corrode equipment and are responsible for GHG and PM emissions. Alkali metals present in biomass can cause problems related to slagging and fouling due to the low melting temperatures of many compounds formed in the combustion process, and alkali chlorides condensing in heat exchangers may lead to severe corrosion [43]. However, the S in biomass plays an important role by being able to sulfate alkali chlorides. These alkali chlorides may become alkali sulfate due to the S in the biomass, leading to ash with significantly lower corrosion potential [44]. In addition, biomass generally contains relatively high contents of alkali and alkaline earth metals, especially Ca, K, and Na. They effectively recover the SO2 and SO3 formed by producing sulfates, so the final concentration of free H2SO4 in the flue gas is usually less than 1 ppmv [45]. Fuels with high K and Cl contents may lead to problems with fouling and corrosion; however, these problems may be solved by co-firing fuels with high S content [46]. Therefore, to ensure the sustainable use and commercialization of mixed biomass pellets, the determination of an appropriate blending ratio is crucial [47].
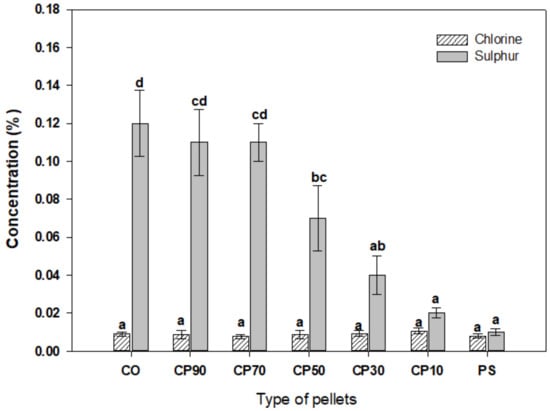
Figure 9.
S and Cl concentrations of pellets according to SCG blending ratio. Each point is the mean of three repeated measurements and is the mean ± standard deviation. The means with different letters (a–d) above the bars indicate significant differences based on Tukey’s HSD test (p < 0.05).
3.2.8. Heavy Metals
Table 5 presents the results of the analysis of the following heavy metals contained in the pellets: As, Cd, Cr, Cu, Pb, and Ni. The Cu content was correlated positively with the proportion of SCG. Moreover, the Cu contents of the samples with higher proportions of SCG (CO, CP90, and CP70) surpassed the maximum quality standard for Cu content (10 mg/kg); therefore, those samples did not meet the quality standard for wood pellets. However, they satisfied the bio-SRF quality standard because Cu is not an assessment criterion in the bio-SRF quality standard. The Cd and Pb contents tended to increase as the proportion of PS increased; however, they did not exceed their respective quality standards. The contents of the remaining heavy metals (As, Cr, and Ni) satisfied their respective quality standards in all samples. Considering that heavy metals affect pellet treatment and that ash is used as fertilizer, all the pellet samples were subjected to heavy metal analysis to test their eligibility for fertilizer as combustion residues. All samples satisfied the heavy metal contents specified in the Korean fertilizer standards [48]. Considering the environmental impact, and that heavy metal contents affect PM emissions during combustion, pellets with low heavy metal contents may have less PM emissions during combustion [49]. Zang et al., reported that Cl promotes the formation of volatile metal chlorides. In particular, the refractory heavy metal component Cu is formed as a gaseous volatile metal oxide in a reaction with Cl; thus, an increase in Cu content can increase PM emission [50]. However, given the negligible Cl content (<0.01%) in all pellet samples in this study, an increase in the Cu content owing to an increase in the SCG proportion is unlikely to increase PM emissions. Moreover, because the Pb content decreased as the SCG proportion increased, PbCl2, which is primarily divided into the particulate phase, is expected to decrease [51]. However, considering the possible increase in metal sulfate, owing to an increase in the S content at a higher SCG blending ratio, it is necessary to analyze the exhaust emissions during the combustion of SCG-mixed pellets [52].

Table 5.
Fuel properties of various pellets.
Table 5 outlines the analysis results of the fuel characteristics of the SCG-PS mixed pellets. CO and CP90 did not meet the wood pellet quality standards for pellet size, durability, and heavy metal (Cu). CP70 did not meet the wood pellet quality standards for durability and moisture content, and CP50 did not meet the standards for diameter and durability. CP30 satisfied the Grade 3 wood pellet quality standards, and it may be classified as Grade 1 if its durability is enhanced. CP10 exhibited a higher calorific value and durability than PS, and it satisfied the Grade 1 wood pellet quality standards. All pellet samples except for CP90 and CP70 satisfied the bio-SRF quality standard. By analyzing the physicochemical fuel characteristics of the SCG-mixed pellet samples, we verified the feasibility of using SCG mixed pellets as fuel.
3.2.9. Regression Analysis
Table 6 presents the results of linear regression analysis conducted to determine the effects of the blending ratio of SCG on the pellet properties. The blending ratio of SCG affects most of the pellet properties except for bulk density. The pellet diameter, length, and durability decreased as the SCG mixing ratio increased. On the other hand, the calorific value, ash content, and S content tended to increase as the SCG mixing ratio increased. The durability (R2 = 88.3%) displays a strong negative correlation with the blending ratio of SCG. An increase in the SCG blending ratio considerably degrades the pellet durability due to the oil content in SCG. In addition, the diameter (R2 = 56.9%) and length (R2 = 45.5%) showed a negative linear correlation with the SCG mixing ratio.

Table 6.
Linear regression analysis of pellet properties depending on SCG blending ratio.
On the other hand, the HHV (R2 = 62.8%) and S content (R2 = 62.9%) displayed positive correlations with the SCG blending ratio. The positive correlation between the SCG blending ratio and ash content showed a very high coefficient of determination (R2 = 95.2%). Due to the high ash content of SCG, the ash content of the pellets increased with increasing SCG blending ratio. The bulk density and moisture had no linear correlation with the SCG blending ratio.
Thus, the SCG mixing ratio had linear correlations with the physicochemical properties of the pellets except for the bulk density and moisture content. In particular, as the calorific value, S content, and ash content had positive correlations and the durability, diameter, and length had negative correlations, it is considered that a suitable mixing ratio of SCG is important to improve the fuel characteristics of SCG-PS pellets.
4. Conclusions
The fuel characteristics of pellet samples with different blending ratios of SCG and PS were evaluated. CP10 (SCG:PS = 10:90) satisfied the Grade 1 quality standard for wood pellets. CO (pure SCG) did not meet the wood pellet quality standards but satisfied the bio-SRF quality standard. Thus, this study verified the feasibility of using SCG-mixed pellets as an alternative fuel source to replace wood pellets. SCG provides the advantage of not requiring pulverization before pelletization because it is supplied as a powder. However, the proportion of fine particles (<500 µm) accounted for 87.2%, and pellets with higher SCG proportions exhibited lower durability. This limitation can be mitigated by the high energy efficiency of SCG, which is attributed to its high calorific value. In addition, the calorific value, ash content, and S content had positive linear correlations with the SCG mixing ratio, and the diameter, length, and durability had negative linear correlations with the SCG mixing ratio. Therefore, suitable mixing of SCG is important for the manufacturing of SCG-PS pellets. The significance of this study is that it verified the feasibility of using SCG as a solid fuel source as a sustainable alternative to carbon-heavy coal. The results of this study are expected to serve as a useful basis for commercializing SCG-mixed pellets to realize the environmental and economic effects of reusing SCG and turning waste into a resource. In future research, studies that evaluate the combustion performance of SCG-PS pellets as solid fuels by comparing the combustion efficiency and exhaust emissions with those of the conventional wood pellets or coal should be conducted.
Author Contributions
D.-G.W. as first author planned the experiments and wrote the manuscript. S.H.K. conducted the experiments, and collected and analyzed the data. T.H.K. led the overall research as a corresponding author and helped revised the manuscript. All authors have read and agreed to the published version of the manuscript.
Funding
This work was supported by the Korea Institute of Planning and Evaluation for Technology (IPET) in Food, Agriculture, Forestry, and Fisheries through the Agriculture, Food and Rural Affairs Research Center Support Program, funded by the Ministry of Agriculture, Food, and Rural Affairs (MAFRA) (716001-7).
Institutional Review Board Statement
Not applicable.
Informed Consent Statement
Not applicable.
Data Availability Statement
The data presented in this study are available on request from the corresponding author. The data are not publicly available due to privacy reasons.
Conflicts of Interest
The authors declare no conflict of interest.
Abbreviations
The following abbreviations are used in this manuscript:
| Bio-SRF | Biomass solid refuse fuel |
| CO | Spent coffee grounds pellet |
| CP10 | Mixed pellet of 90% pine sawdust and 10% spent coffee grounds |
| CP30 | Mixed pellet of 70% pine sawdust and 30% spent coffee grounds |
| CP50 | Mixed pellet of 50% pine sawdust and 50% spent coffee grounds |
| CP70 | Mixed pellet of 30% pine sawdust and 70% spent coffee grounds |
| CP90 | Mixed pellet of 10% pine sawdust and 90% spent coffee grounds |
| FC | Fixed carbon |
| GHG | Greenhouse gas |
| HHV | High heating value |
| LHV | Low heating value |
| PI | Pine sawdust pellet |
| PS | Pine sawdust |
| SCG | Spent coffee grounds |
| VM | Volatile matter |
References
- McKendry, P. Energy production from biomass (part 1): Overview of biomass. Bioresour. Technol. 2002, 83, 37–46. [Google Scholar] [CrossRef]
- Yılmaz, S.; Selim, H. A review on the methods for biomass to energy conversion systems design. Renew. Sustain. Energy Rev. 2013, 25, 420–430. [Google Scholar] [CrossRef]
- Wang, G.; Ma, Z.; Deng, J.; Li, Z.; Duan, L.; Zhang, Q.; Hao, J.; Jiang, J. Characteristics of particulate matter from four coal-fired power plants with low-low temperature electrostatic precipitator in China. Sci. Total Environ. 2019, 662, 455–461. [Google Scholar] [CrossRef] [PubMed]
- Korea Energy Economics Institute. 2018 Energy Info. Korea. Available online: http://www.keei.re.kr/keei/download/EnergyInfo2018.pdf (accessed on 1 August 2018).
- Limousy, L.; Jeguirim, M.; Dutournie, P.; Kraiem, N.; Lajili, M.; Said, R. Gaseous products and particulate matter emissions of biomass residential boiler fired with spent coffee grounds pellets. Fuel 2013, 107, 323–329. [Google Scholar] [CrossRef]
- Korea Forest Service. Wood Pellet Statistics. 2018. Available online: https://www.forest.go.kr/kfsweb/cop/bbs/selectBoardArticle.do?nttId=3132691&bbsId=BBSMSTR_1069&pageUnit=10&pageIndex=19&searchtitle=title&searchcont=&searchkey=&searchwriter=&searchWrd=&ctgryLrcls=&ctgryMdcls=&ctgrySmcls=&ntcStartDt=&ntcEndDt=&mn=NKFS_06_09_01&orgId= (accessed on 6 September 2018).
- Korea Forest Service. Pellet Economics. Available online: https://www.forest.go.kr/kfsweb/kfi/kfs/cms/cmsView.do?mn=NKFS_02_01_11_04_01&cmsId=FC_001019 (accessed on 10 September 2019).
- Lisowski, A.; Olendzki, D.; Swietochowski, A.; Dabrowska, M.; Mieszkalski, L.; Ostrowska-Ligeza, E.; Stasiak, M.; Klonowski, J.; Piatek, M. Spent coffee grounds compaction process: Its effects on the strength properties of biofuel pellets. Renew. Energy 2019, 142, 173–183. [Google Scholar] [CrossRef]
- Serrano, C.; Monedero, E.; Lapuerta, M.; Portero, H. Effect of moisture content, particle size and pine addition on quality parameters of straw barley straw pellets. Fuel Process. Technol. 2011, 92, 699–706. [Google Scholar] [CrossRef]
- Sultana, A.; Kumar, A.; Harfield, D. Development of agri-pellet production cost and optimum size. Bioresour. Technol. 2010, 101, 5609–5621. [Google Scholar] [CrossRef]
- International Coffee Organization. Coffee Market Report—November 2018. Available online: http://www.ico.org/Market-Report-18-19-e.asp (accessed on 22 November 2018).
- Murthy, P.S.; Naidu, M.M. Sustainable management of coffee industry by-products and value addition—A review. Resour. Conserv. Recycl. 2012, 66, 45–58. [Google Scholar] [CrossRef]
- Martinez-Saez, N.; García, A.T.; Pérez, I.D.; Rebollo-Hernanz, M.; Mesias, M.; Morales, F.J.; Martin-Cabrejas, M.A.; del Castillo, M.D. Use of spent coffee. Grounds as food ingredient in bakery products. Food Chem. 2017, 216, 114–122. [Google Scholar] [CrossRef]
- Campos-Vega, R.; Loarca-Piña, G.; Vergara-Castañeda, H.A.; Oomah, B.D. Spent coffee grounds: A review on current research and future prospects. Trends Food Sci. Technol. 2015, 45, 24–36. [Google Scholar] [CrossRef]
- Obruca, S.; Benesova, P.; Kucera, D.; Petrik, S.; Marova, I. Biotechnological conversion of spent coffee grounds into polyhydroxyalkanoates and carotenoids. N. Biotechnol. 2015, 32, 569–574. [Google Scholar] [CrossRef] [PubMed]
- Tokimoto, T.; Kawasaki, N.; Nakamura, T.; Akutagawa, J.; Tanada, S. Removal of lead ions in drinking water by coffee grounds as vegetable biomass. J. Colloid Interface Sci. 2005, 281, 56–61. [Google Scholar] [CrossRef] [PubMed]
- National Assembly Research Service of Korea. Bioenergy Production by Establishing a System for Collecting Spent Coffee Grounds (Korean). 2020. Available online: https://www.nars.go.kr/eng/report/view.do?cmsCode=CM0146&brdSeq=31561 (accessed on 23 December 2020).
- Bio-Bean Ltd. Coffee Recycling. Available online: https://www.bio-bean.com/renewals/coffee-recycling/ (accessed on 23 December 2020).
- Bottani, E.; Tebaldi, L.; Volpi, A. The role of ICT in supporting spent coffee grounds collection and valorization: A quantitative assessment. Sustainability 2019, 11, 6572. [Google Scholar] [CrossRef]
- Goh, C.S.; Cocchi, M.; Junginger, M.; Marchal, D.; Daniela, T.; Hennig, C.; Heinimö, J.; Nikolaisen, L.; Schouwenberg, P.-P.; Bradley, D.; et al. Wood pellet market and trade: A global perspective. Biofuels Bioprod. Biorefin. 2013, 7, 24–42. [Google Scholar] [CrossRef]
- Kamil, M.; Ramadan, K.M.; Olabi, A.G.; Shanableh, A.; Ghenai, C.; Al Naqbi, A.K.; Awad, O.I.; Ma, X. Comprehensive evaluation of the life cycle of liquid and solid fuels derived from recycled coffee waste. Resour. Conserv. Recycl. 2019, 150, 104446. [Google Scholar] [CrossRef]
- Kim, Y.S.; Woo, D.G.; Kim, T.H. Characteristics of direct transesterification using ultrasound on oil extracted from spent coffee grounds. Environ. Eng. Res. 2020, 25, 470–478. [Google Scholar] [CrossRef]
- Miranda, T.; Arranz, J.I.; Montero, I.; Román, S.; Rojas, C.V.; Nogales, S. Characterization and combustion of olive pomace and forest residue pellets. Fuel Process. Technol. 2012, 103, 91–96. [Google Scholar] [CrossRef]
- Ciesielczuk, T.; Karwaczyńska, U.; Sporek, M. The possibility of disposing of spent coffee ground with energy recycling. J. Ecol. Eng. 2015, 16, 133–138. [Google Scholar] [CrossRef]
- Park, S.; Kim, S.J.; Oh, K.C.; Cho, L.; Kim, M.J.; Jeong, I.S.; Lee, C.G.; Kim, D.H. Investigation of agro-byproduct pellet properties and improvement in pellet quality through mixing. Energy 2020, 190, 116380. [Google Scholar] [CrossRef]
- Nosek, R.; Tun, M.M.; Juchelkova, D. Energy utilization of spent coffee grounds in the form of pellets. Energies 2020, 13, 1235. [Google Scholar] [CrossRef]
- Gomez-de la Cruz, F.J.; Cruz-Peragón, F.; Casanova-Peláez, P.J.; Palomar-Carnicero, J.M. A vital stage in the large-scale production of biofuels from spent coffee grounds: The drying kinetics. Fuel Process. Technol. 2015, 130, 188–196. [Google Scholar] [CrossRef]
- Zabava, B.S.; Voicu, G.; Dinca, M.N.; Ungureanu, N.; Ferdes, M. Durability of pellets obtained from energy plants: Review. In Proceedings of the Engineering for Rural Development, Jelgava, Latvia, 23–25 May 2018; Volume 17, pp. 1838–1843. [Google Scholar]
- Relova, I.; Vignote, S.; León, M.A.; Ambrosio, Y. Optimisation of the manufacturing variables of sawdust pellets from the bark of Pinus caribaea Morelet: Particle size, moisture and pressure. Biomass Bioenergy 2009, 33, 1351–1357. [Google Scholar] [CrossRef]
- Ishii, K.; Furuichi, T. Influence of moisture content, particle size and forming temperature on productivity and quality of rice straw pellets. Waste Manag. 2014, 34, 2621–2626. [Google Scholar] [CrossRef] [PubMed]
- Pradhan, P.; Mahajani, S.M.; Arora, A. Production and utilization of fuel pellets from biomass: A review. Fuel Process. Technol. 2018, 181, 215–232. [Google Scholar] [CrossRef]
- Poddar, S.; Kamruzzaman, M.; Sujan, S.M.A.; Hossain, M.; Jamal, M.S.; Gafur, M.A.; Khanam, M. Effect of compression pressure on lignocellulosic biomass pellet to improve fuel properties: Higher heating value. Fuel 2014, 131, 43–48. [Google Scholar] [CrossRef]
- Bergström, D.; Israelsson, S.; Öhman, M.; Dahlqvist, S.A.; Gref, R.; Boman, C.; Wästerlund, I. Effects of raw material particle size distribution on the characteristics of Scots pine sawdust fuel pellets. Fuel Process. Technol. 2008, 89, 1324–1329. [Google Scholar] [CrossRef]
- Crawford, R.J.; Throne, J.L. (Eds.) Rotational Moulding Technology; William Andrew Publishing: New York, NY, USA, 2002. [Google Scholar]
- Tumuluru, J.S. Effect of process variables on density and durability of pellets made from high moisture corn stover. Biosyst. Eng. 2014, 119, 44–57. [Google Scholar] [CrossRef]
- Kaliyan, N.; Morey, R.V. Factors affecting strength and durability of densified biomass products. Biomass Bioenergy 2009, 33, 337–359. [Google Scholar] [CrossRef]
- Lu, D.; Tabil, L.G.; Wang, D.; Wang, G.; Emami, S. Experimental trials to make wheat straw pellets with wood residue and binders. Biomass Bioenergy 2014, 69, 287–296. [Google Scholar] [CrossRef]
- Miranda, T.; Montero, I.; Sepúlveda, F.J.; Arranz, J.I.; Rojas, C.V.; Nogales, S. A review of pellets from different sources. Materials 2015, 8, 1413–1427. [Google Scholar] [CrossRef]
- Obernberger, I.; Thek, G. Physical characterisation and chemical composition of densified biomass fuels with regard to their combustion behavior. Biomass Bioenergy 2004, 27, 653–669. [Google Scholar] [CrossRef]
- Mussatto, S.I.; Machado, E.M.; Martins, S.; Teixeira, J.A. Production, composition, and application of coffee and its industrial residues. Food Bioprocess Technol. 2011, 4, 661–672. [Google Scholar] [CrossRef]
- Telmo, C.; Lousada, J. Heating values of wood pellets from different species. Biomass Bioenergy 2011, 35, 2634–2639. [Google Scholar] [CrossRef]
- Duca, D.; Riva, G.; Pedretti, E.F.; Toscano, G. Wood pellet quality with respect to EN 14961–2 standard and certifications. Fuel 2014, 135, 9–14. [Google Scholar] [CrossRef]
- Aho, M.; Yrjas, P.; Taipale, R.; Hupa, M.; Silvennoinen, J. Reduction of superheater corrosion by co-firing risky biomass with sewage sludge. Fuel 2010, 89, 2376–2386. [Google Scholar] [CrossRef]
- Theis, M.; Skrifvars, B.-J.; Zevenhoven, M.; Hupa, M.; Tran, H. Fouling tendency of ash resulting from burning mixtures of biofuels. Part 2: Deposit chemistry. Fuel 2006, 85, 1992–2001. [Google Scholar] [CrossRef]
- Vainio, E.; Kinnunen, H.; Laurén, T.; Brink, A.; Yrjas, P.; DeMartini, N.; Hupa, M. Low-temperature corrosion in co-combustion of biomass and solid recovered fuels. Fuel 2016, 184, 957–965. [Google Scholar] [CrossRef]
- Hupa, M.; Karlström, O.; Vainio, E. Biomass combustion technology development–It is all about chemical details. Proc. Combust. Inst. 2017, 36, 113–134. [Google Scholar] [CrossRef]
- Nunes, L.J.R.; Matias, J.C.O.; Catalão, J.P.S. Mixed biomass pellets for thermal energy production: A review of combustion models. Appl. Energy 2014, 127, 135–140. [Google Scholar] [CrossRef]
- Rural Development Administration. Fertilizer Process Specification and Standards. Notification No. 2014-135 of the Rural Development Administration. Available online: https://www.law.go.kr/LSW/admRulInfoP.do?admRulSeq=2200000013684 (accessed on 3 August 2018).
- Biswas, A.K.; Yang, W.; Blasiak, W. Steam pretreatment of Salix to upgrade biomass fuel for wood pellet production. Fuel Process. Technol. 2011, 92, 1711–1717. [Google Scholar] [CrossRef]
- Zhang, W.; Tong, Y.D.; Wang, H.H.; Chen, L.; Ou, L.B.; Wang, X.J.; Liu, G.H.; Zhu, Y. Emission of metals from pelletized and uncompressed biomass fuels combustion in rural household stoves in China. Sci. Rep. 2014, 4, 5611–5616. [Google Scholar] [CrossRef] [PubMed]
- Marcotte, S.; Castilla, C.; Morin, C.; Merlet-Machour, N.; Carrasco-Cabrera, L.; Medaerts, F.; Lavanant, H.; Afonso, C. Particulate inorganic salts and trace element emissions of a domestic boiler fed with five commercial brands of wood pellets. Environ. Sci. Pollut. Res. 2020, 27, 18221–18231. [Google Scholar] [CrossRef] [PubMed]
- Boman, C.; Öhman, M.; Nordin, A. Trace element enrichment and behavior in wood pellet production and combustion processes. Energy Fuels 2006, 20, 993–1000. [Google Scholar] [CrossRef]
Publisher’s Note: MDPI stays neutral with regard to jurisdictional claims in published maps and institutional affiliations. |
© 2021 by the authors. Licensee MDPI, Basel, Switzerland. This article is an open access article distributed under the terms and conditions of the Creative Commons Attribution (CC BY) license (http://creativecommons.org/licenses/by/4.0/).