Abstract
This paper proposes a procedure for the accurate modelling of the ring induction motors (RIMs), based on the Monte Carlo (MC) method and the relations presented in the relevant metrology guidelines. Modelling was carried out based on the measured data for the torque-slip characteristic (TSC) and using the equivalent circuit for the RIM. The parameters included an extended Kloss equation (EKE) and the associated uncertainties were determined using the MC method. The polynomial procedure was applied as a numerical tool to complement the MC method to determine the power losses in the stator iron and the relevant uncertainty. This is in line with international standards for the theory of uncertainty application in the field of engineering. The novelty of this paper refers to the accurate modelling of the RIMs obtained by determining the corresponding uncertainties. The procedure presented in this paper was developed based on the assumption that the parameters of the equivalent circuit are independent of the temperature, influence of core saturation, and the phenomenon of current displacement. Our procedure can be successfully used for both the theoretical calculations related to the modelling of the RIMs, and in practical applications involving detailed measurements and the corresponding uncertainties. The use of the MC method allowed for significant improvement in the modelling results, in terms of both the TSC and EKE.
1. Introduction
The ring induction motors are a group of electrical machines mainly used in electric drives with heavy starting. The electrical power of these machines varies over a wide range, from a fraction of a kilowatt to several megawatts, which allows for an extensive range of applications [1]. They are characterised by a simple structure, which implies low construction costs, easy operation and maintenance, and high levels of operational reliability [2].
One of the most important curves used to describe the RIMs is the torque-slip characteristic, which represents the relationship between the electromagnetic moment and the slip [3,4]. This is determined by the constant value of the stator supply voltage and the variable rotational speed of the motor, which is related to the slip by a simple and well-known formula. It is most often described using a simplified Kloss equation [3], which approximates the corresponding measured points with a high uncertainty value, however, most often in the case of very low-power machines [5]. An extended version of this equation [6,7,8], denoted here as EKE, was therefore developed based on the theory and practice of electric machines, for which much lower values of the approximation uncertainty of the mechanical characteristic of the motor can be obtained. This equation is necessary for the analytical determination of machine acceleration times [9], an analysis of the transient regimes [10], frequency control of inductive electric drives under conditions of overload [11], and for the testing of electric motors, for example in Tesla vehicles [12]. Using a simplified and extended version of the Kloss equation, the value of maximum (critical) motor torque and the corresponding value of maximum (critical) slip can be determined [13]. For when the slip is equal to one, the value of the starting torque of the motor can be determined. Knowledge of the critical and starting torques is extremely important from the point of view of evaluating the mechanical properties of the RIM [14]. The first type of torque allows us to determine the possibility of short-term motor overload [15], while the second one represents the possibility of starting a drive system including both a motor and a generator [16].
All of the procedures for determining the TSC involve the accurate measurements of the corresponding points [17], and then their approximation with a minimum value of uncertainty [18,19,20]. The accurate determination of the maximum torque and slip is only possible by applying this approach to modelling. When the mathematical formula representing the measured points of the TSC is known, the satisfactory approximation results and the associated uncertainties can be obtained by applying the MC method [21,22,23]. This method should involve a pseudorandom number generator with a uniform distribution [24,25]. However, it is only possible to determine the maximum values of the torque and slip by applying the MC method. A third parameter related to the EKE also needs to be determined. This can be obtained by performing indirect calculations based on the equivalent circuit of the RIM [26,27,28] and by using the additional numerical method to obtain values of the power losses in the stator iron. Additionally, it should be emphasized that the MC method has so far been applied to the modelling of the RIMs, by analysis of their thermal behaviour and the detection of corresponding faults, based on the stator current measurements [29,30].
In Section 2 of this paper, we present a detailed discussion of the issues related to the determination of the equivalent circuit parameters corresponding to the RIM, based on measurements of the motor idle and short-circuit states. The use of polynomial approximation [31,32,33] to determine the power losses are also proposed as the additional numerical method. Section 3 describes the use of the MC method to model the RIM by using the TSC, while Section 4 presents an example of the use of MC-based modelling and the verification of the corresponding results.
The solution presented in this paper represents a new approach to modelling the RIM based on the measurement points of the TSC and the EKE. This is obtained by an application of the MC method and the polynomial approximation which allows us to determine the values of the maximum moment and slip with the associated uncertainties. Therefore, it is an example of accurate modelling of the RIM which is worked out according to the guidelines in [18,21] and can be applied in the field of the precise elaboration of measurement results. The lack of uncertainty analysis in the modelling of the RIMs can be considered a weakness of the research so far in the field of electrical motors.
The proposed method can be used for accurate modelling and appropriate control over the mechanical properties of the RIMs in order to ensure the correct operation of both single motors and complex electrical drive systems.
2. Theoretical Basis for the Accurate Modelling of the RIM
The EKE is defined by the following formula:
where , and are the motor torque, maximum torque, slip, and maximum slip, respectively. The coefficient is expressed as follows:
where , and denote the stator resistance, rotor resistance, and voltage ratio, respectively [6,7,8]. The voltage ratio is calculated by the formula:
where is the stator supply volge, which is lower than the rated voltage , while is the maximum voltage produced between any two rotor phases, and is the maximum voltage produced between any two stator phases when the rotor is supplied by the voltage [27]. The coefficient is defined by:
where and denote the magnetisation reactance and the stator phase leakage reactance, respectively, and are calculated using the following formulae:
and
where is the magnetisation current, is the stator current under idle conditions, and is the voltage induced in the rotor [6,7,8]. Figure 1 shows a circuit model of the RIM, which is valid when the measurements are made in the idle state.
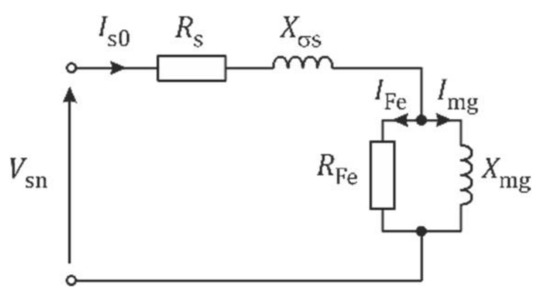
Figure 1.
Circuit model of the RIM in the idle state.
The magnetisation current is
where denotes the current corresponding to the power losses in the stator iron, and is calculated using the simple formula:
Here, denotes the resistance of the iron, and is defined by the following equation:
while denotes the power losses in the stator iron.
The complete equivalent circuit of the RIM is shown in Figure 2, where and denote the rotor phase resistance and the reactance transformed to the stator side.
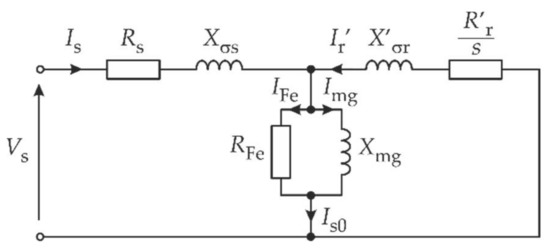
Figure 2.
Complete equivalent circuit of the RIM.
The quantities , and given in Equations (5), (7)–(9) are calculated based on the complete phase equivalent diagram (the left side of Figure 2), omitting the voltages related to the stator resistance and the stator winding leakage reactance.
The values of the parameters and can be determined based on the circuit model of the RIM in the short-circuit state, as shown in Figure 3, where denotes the current in this state.
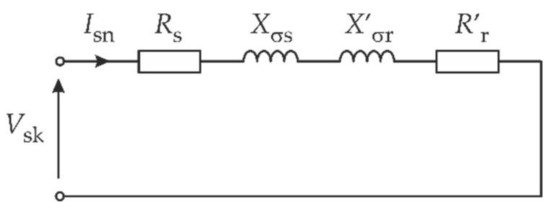
Figure 3.
Circuit model of the RIM in the short-circuit state.
The transverse branch of the circuit model shown in Figure 2 is omitted in Figure 3, due to the significant value of its impedance compared to the impedance of the longitudinal branch. The short-circuit current is also assumed to be equal to the rated stator current [6,7,8].
Based on Ohm’s law, we obtain:
and applying the impedance triangle gives
By transforming Equation (10), we obtain the rotor resistance
We can express the coefficient in terms of the measured values of the parameters of the RIM. We can obtain this relation by substituting Equations (3)–(13) into Equation (2) to give [1,6,7,8]:
where the auxiliary parameters are
The uncertainties associated with the quantities given in Equations (3)–(16) can be calculated using the formula:
where denotes the quantity under consideration, and is the number of indirect quantities necessary to determine the value of The relative uncertainty associated with the quantity is defined by the equation:
For both analogue and digital measuring instruments, the uncertainty is determined by the formula:
where is the absolute error, while the value of the denominator results from the probability density function of a uniform distribution, which is valid for both analogue and digital instruments.
For analogue instruments, the error is determined on the basis of the static accuracy class according to the equation:
where denotes the measurement range for the quantity to be measured. For digital instruments, the following formula is usually applied:
where denotes the value of the quantity to be measured, and and are constant parameters that are typical for the particular instrument and are included in the corresponding datasheet.
The power losses in the stator iron are determined using a graphical method for the rated stator voltage , as shown in Figure 4.
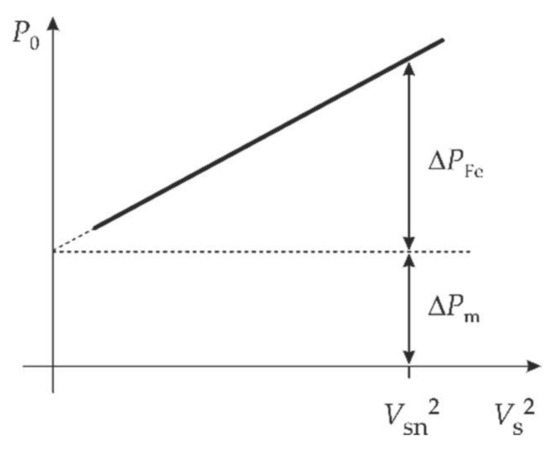
Figure 4.
Graphical method for determining the power losses .
The quantity is the active power consumed by the motor during idling, and is equal to the sum of the losses in the stator iron , and the mechanical power losses
Based on the measured points for the active power it is easy to determine the linear characteristic and the associated uncertainty. This can be done by applying the polynomial method, using the formula:
where and are the polynomial coefficients, and denotes the error of approximation.
Estimates of the polynomial coefficients are obtained using the following matrix equation:
where
and denotes the number of measured points for the characteristic
The uncertainty of approximation is denoted as the error , and is given by the following formula:
The standard uncertainty associated with the coefficients and is
where
and [29,30,31].
The relative uncertainties associated with the coefficients and are calculated as follows:
The values of the power losses in the stator iron and the associated uncertainty are calculated using the expressions:
and
The corresponding relative uncertainty is:
The procedure for determining the values of the parameters included in Equation (1) and the corresponding uncertainties is discussed in detail in the section below.
3. Monte-Carlo-Based Modelling of the RIM
We now present the example of the application of the MC method in the accurate modelling of the RIM, which involves determining the corresponding parameters of the EKE and the associated uncertainties. This procedure is based on an intuitive method of determining the parameters and for the possible ranges of variability of the parameters and , which are included in the EKE [21,22,23,24]. Figure 5 shows the typical TSC which describes the RIM for its motor work and covers the stable range of this characteristic. Figure 5 also shows examples of the variability ranges of the parameters and
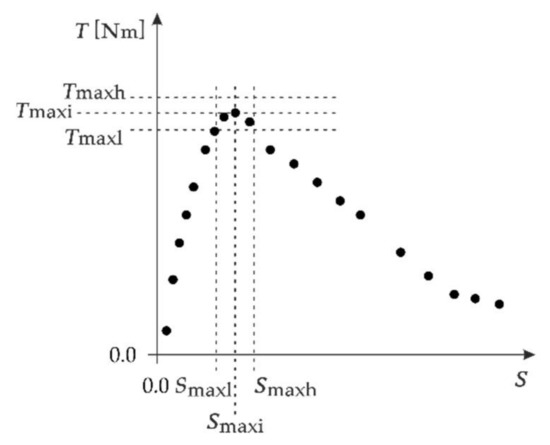
Figure 5.
The typical TSC for the motor work of the RIM.
The index ‘i’ denotes the intuitive values of both parameters, while the indexes ‘h’ and ‘l’ represent the high and low assumed values of these parameters. The high and low values are assumed in advance to ensure that the estimated values of the parameters and are within these selected ranges. A suitable selection of these ranges constitutes the first step in this method.
The parameter and the associated uncertainty are determined based on the procedure discussed in Section 2. The low and high values, and , are determined as follows:
The second step in our MC-based procedure involves the choice of the type of pseudorandom number generator. Taking into account the analogous probability of the occurrence of the optimal value of the estimates , , and for any value from the above intervals, we are justified in choosing the pseudorandom number generator with a uniform distribution. The above estimates should accurately map the parameters , , and , which requires an approximation of the TSC with minimal uncertainty.
In the third step, we determine the number of MC trials. According to the recommendations given in the guide [20], the optimal number of trials should be greater than where denotes the coverage probability.
In the fourth step, the following matrix is determined
based on Equation (1), where and denote the number of measured points for the TSC and the number of MC trials, respectively [22,23,24,25]. The matrix is determined by substituting the values of the parameters , , and into Equation (1), as obtained for a sequence of MC trials . The value of each slip is substituted into Equation (1) for each MC trial , where . In the fifth step, the matrix of approximation errors for the measured points of the TSC is determined as follows:
where . The next rows of the matrix correspond to the approximation uncertainties obtained for each value of the slip
The sixth step in our MC-based modelling process involves the determination of the vector
in which each element is the sum of the squared errors calculated for each column of the matrix [22,23,24,25].
In the next step, the minimum value of the vector and the corresponding number of trials are determined. The parameters , , and corresponding to the value are assumed to represent the optimal solution to the MC-based model. These parameters correspond to the estimates , , and as defined above.
We then determined the uncertainty associated with the MC method using the following formula:
where
The last step in our MC-based procedure involves the determination of the uncertainties associated with the parameters , , and using the formula:
where
The last two formulae are valid for all the parameters in the MC model.
4. Example Application and Verification of Results
Let us present below the experimental results referring to the modelling of the real RIM with the following rated data: (rated power), (rated stator voltage), (rated stator current), (rated frequency), (rated rotational speed), (winging connections), (rated power factor), and (rated efficiency). Single-phase resistances for the stator and rotor are 2.9 and 0.1 , respectively.
Table 1 shows the measured results for the magnetisation characteristic obtained in the idle state. The value of the current , obtained for the rated voltage , was measured with a digital instrument, and is equal to 5.60 A. The uncertainty associated with this current was calculated using Equations (20) and (22), and is equal to 0.22 A.

Table 1.
Measured results for the magnetisation characteristic in the idle state.
Figure 6 shows the results obtained for the power loss in the stator iron using the method shown in Figure 4 and Equations (23)–(30). The value of this power loss is 155.8 W, and the linear equation that approximates the measurement points is
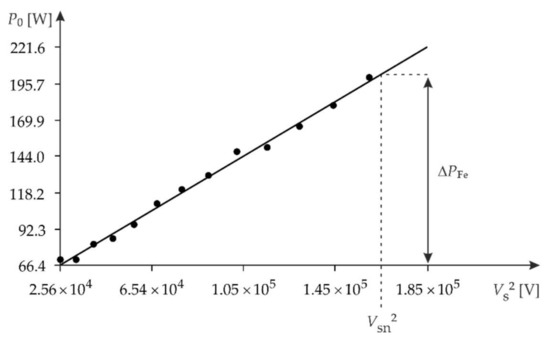
Figure 6.
Results for the power loss in the stator iron .
The uncertainty associated with this approximation is .
The uncertainties associated with the parameters in the linear equation are = 2.17 and , while the corresponding relative uncertainties are and .
The uncertainty and relative uncertainty associated with the power losses, obtained using Equations (31) and (32), respectively, are 2.18 W and . The measured results for the short-circuit state of the RIM are shown in Table 2. These results enabled us to determine the parameters included in the circuit model shown in Figure 3, using Equations (10)–(14).
Table 2.
Measurement results for the short-circuit state.
The values of the voltages , and were determined using analogue voltmeters with an accuracy and measurement range of 0.5% and 400 V, respectively. The values of the quantities , and calculated using Equations (3)–(9), are 4.167 V/V, 3.08 k 0.13 A, 5.59 A, 71.45 2.23 and 0.971, respectively. The corresponding uncertainties , and are 0.001 V/V, 55 0.020 A, 0.22 A, 14.23 , 0.22 and 0.0070, respectively.
Table 2 shows the measured results obtained for the short-circuit state. Based on these measurements, we can calculate the values of the parameters , and using Equations (11), (13) and (14), respectively; we can then determine the corresponding uncertainties using Equations (18)–(22). These measurements were made using a voltmeter and ammeter with accuracy and measurement ranges of 0.50%, 200 V and 0.50%, 10 A, respectively.
The values of the parameters , and and the associated uncertainties and are 36.90 40.92 17.68 1.62 , 2.36 and 1.08 , respectively.
Based on the above parameters, the coefficient and the associated uncertainty were calculated using Equations (16) and (18) as 0.152 and 0.141, respectively. The value of the relative uncertainty is 92.8%. The high value of this uncertainty was due to the significant complexity of Equation (16), which depends on eight indirectly measured quantities.
Table 3 shows the measured results for the torque-slip characteristic of the RIM.
Table 3.
Measured points for the torque-slip characteristic of the RIM.
The values of the parameters and were determined intuitively, as shown in Figure 5, as 7.00 Nm and 0.200, respectively. The values of the parameters , and were assumed in advance around the above parameters. These values define the draw ranges for the parameters and . The draw range for the coefficient is determined based on the associated uncertainty by Equation (33), as follows:
A total of MC trials were carried out using the pseudo-random number generator with a uniform distribution. Equations (34)–(40) were applied to the execution of the relevant numerical calculations using the MathCad 15 program, and the total computation time was 3 h and 24 min. The calculations were performed on a PC with the following parameters: Inter® Core™, Duo CPU E8400, processor , 3.00 GHz, 4.00 GB RAM.
The minimum value for the vector and the corresponding number of trials were 3.581 and 95360, respectively. The values of the parameters , , and corresponding to quantity are 7.3861 Nm, 0.19721, and 0.28927, respectively. The uncertainty associated with the MC method is 0.032. The uncertainties , , and associated with the parameters , , and are , and , respectively.
The relative uncertainty associated with the coefficient is 0.07%. Based on these results, it should be noted that the value of the uncertainty was reduced from 92.8% (obtained from analytical calculations) to 0.07% (obtained using our MC-based procedure).
Figure 7 shows the results from our MC-based model of the RIM for the example of the TSC characteristic and using the EKE.
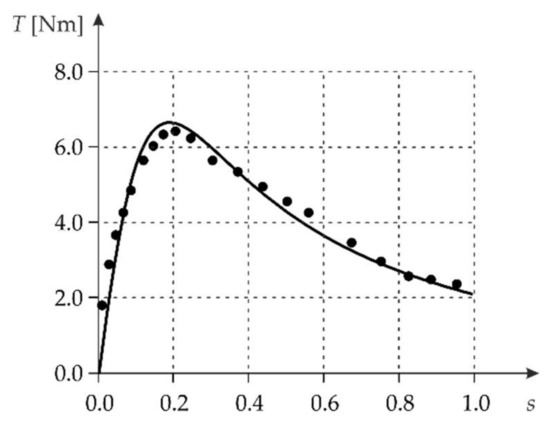
Figure 7.
Results from our MC-based model of the RIM.
Figure 8 shows the distribution of the approximation uncertainty for the particular values of the slip
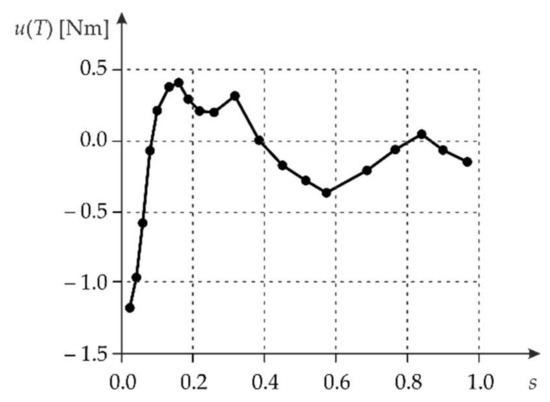
Figure 8.
Distribution of the approximation uncertainty for the TSC characteristic.
The highest value of the approximation uncertainty was obtained for the slip within the maximum slip value , as well as for the slip with a value of about 0.85.
We now verify the implementation of our MC-based procedure by examining the influence of the number of MC trials on the value of the uncertainty u(MC). The results for the values of the parameters included in the EKE are given in Table 4.
Table 4.
Results from our Monte Carlo procedure.
It can be seen from Table 4 that the values for the uncertainty u(MC) decrease as the number of MC trials increases. The values of the EKE parameters obtained for MC trials (the lowest number of MC trials recommended by the corresponding guide), were assumed to represent the optimal solution to the modelling task for this example.
The results obtained in the section above show that the application of the MC method and the polynomial procedure in particular allows for a significant increase in the accuracy of the RIM modelling compared to other methods, which do not include analysis of the modelling uncertainty.
5. Conclusions
This paper presents a procedure that allows us to assess the accuracy of modelling of the RIMs on the example of the RSC and EKE, by applying the MC method. Based on the numerical simulations and calculations performed for an example of the RIM, it has shown that the effect of the uncertainty on the results of measurements is significant. The proposed method is based on the corresponding guidelines for the implementation of accurate measurements, and can significantly reduce the values of the uncertainties associated with the parameters in the ECE. For example, for the coefficient , the application of our MC-based numerical modelling procedure reduced the value of corresponding uncertainty from 92.8% (analytical calculations) to 0.07% (MC-based procedure). It should also be emphasised that a further increase in the modelling uncertainty of both the TSC and the other parameters in the equivalent circuit of the RIM can be obtained by using more accurate measuring instruments, and by applying modern measurement techniques based on specialised computer software such as LabVIEW.
The solutions presented in this paper can be used in other applications in the field of electric machines and electric drives, for example in the precise determination of the characteristics of all types of motors, or for the development of accurate measurement reports.
Author Contributions
Conceptualisation, K.T. and T.M.; data curation, T.M., M.K., K.O. and P.B.; writing—original draft, K.T.; formal analysis, T.M., M.K., K.O. and P.B.; methodology, K.T. and T.M.; writing—review and editing, K.T., T.M., M.K., K.O. and P.B.; software, K.T. and T.M. All authors have read and agreed to the published version of the manuscript.
Funding
This research was conducted at the Faculty of Electrical and Computer Engineering, Krakow University of Technology, and was financially supported by the Ministry of Science and Higher Education, Republic of Poland (grant No. E-3/2021).
Institutional Review Board Statement
Not applicable.
Informed Consent Statement
Not applicable.
Data Availability Statement
MDPI Research Data Policies.
Conflicts of Interest
The authors declare no conflict of interest.
References
- Ćalasan, M.; Alqarni, M.; Rosić, M.; Koljčević, N.; Alamri, B.; Abdel Aleem, S. A novel exact analytical solution based on Kloss equation towards accurate speed-time characteristics modeling of induction machines during no-load direct startups. Appl. Sci. 2021, 11, 5102. [Google Scholar] [CrossRef]
- Ejiofor, O.; Nwosu, C.; Nnadi, D.; Okoro, O.I. Performance study of three-phase induction motor driving a load. Discovery 2019, 55, 279–290. [Google Scholar]
- Aree, P. Analytical determination of speed-torque and speed-current curves of single-cage induction motor under supply voltage and frequency variations. COMPEL 2018, 37, 2279–2298. [Google Scholar] [CrossRef]
- Malagoli, J.A.; Camacho, J.R.; Ferreira da Luz, M.V. Optimal electromagnetic torque of the induction motorgenerated automatically with Gmsh/GetDP software. Int. Trans. Electr. Energy Syst. 2020, 3, 1–20. [Google Scholar]
- Gärtner, J.; Halámka, Z.; Pavelka, J. The speed control of the induction motors by the change of supply voltage. In Proceedings of the Silnoproudá Elektrotechnika a Elektroenergetika, Brno, Czech Republic, 26 April 2001; pp. 41–44. [Google Scholar]
- Cociu, V.R.; Cociu, L. Consideration about current-speed expression of the induction machine. Bul. Inst. Politeh. Iaşi 2020, 66, 39–50. [Google Scholar]
- Gerling, D. Electrical Machines; Springer: Berlin, Germany, 2015; pp. 477–480. ISBN 978-3-642-17584-8. [Google Scholar]
- Rieciciarova, E.; Nanasi, T. Static and dynamic characteristics of asynchronous motor. In Proceedings of the Annals of DAAAM and Proceedings of the International DAAAM Symposium, Vienna, Austria, 23–26 November 2011; Volume 22, pp. 747–748. [Google Scholar]
- Bitar, Z.; Al Jabl, S. Studying the performances of induction motor used in electric car. Energy Procedia 2014, 50, 342–351. [Google Scholar] [CrossRef] [Green Version]
- Abdelati, R.; Mimouni, M.F. Loss minimization of induction machines during torque transients. Proc. Inst. Mech. Eng. Part I J. Syst. Control. Eng. 2019, 234, 314–329. [Google Scholar] [CrossRef]
- Kodkin, V.L.; Anikin, A.S.; Shmarin, Y.A. Effective frequency control for induction electric drives under overloading. Russ. Electr. Engin. 2014, 85, 641–644. [Google Scholar] [CrossRef]
- Un-Noor, F.; Padmanaban, S.; Mihet-Popa, L.; Mollah, M.N.; Hossain, E. A comprehensive study of key electric vehicle (EV) components, technologies, challenges, impacts, and future direction of development. Energies 2017, 10, 1217. [Google Scholar] [CrossRef] [Green Version]
- Abdel-Wahab, R.R.; Abdo, T.M.; Hanafy, H.H. Dynamic investigation of Georges phenomenon related to three-phase wound-rotor induction motor. JESIT 2020, 7, 1–21. [Google Scholar]
- Guo, Z.; Zhang, J.; Zheng, C.; Sun, Z. Dynamic Performance analysis of the induction motor drive fed by current-source based on Ansoft. AMSE J. Ser. Model. A 2016, 89, 118–129. [Google Scholar]
- Elavenil, P.E.; Kalaivani, R. Overload protection and speed monitoring of induction motor using ZigBee wireless sensor networks and GSM technology. Springer Lect. Notes Electr. Eng. 2014, 326, 1007–1016. [Google Scholar]
- Cowder, R. Electric Drives and Electromechanical Systems, 2nd ed.; Elsevier: London, UK, 2019; pp. 1–322. ISBN 9780081028841. [Google Scholar]
- Bodolai, T. Computer-aided measurement method for determination of torque-speed characteristics of electrical motors used in practical education. J. Phys. Conf. Ser. 2010, 238, 1–8. [Google Scholar] [CrossRef] [Green Version]
- Evaluation of measurement data—Supplement 2 to the Guide to the Expression of Uncertainty in Measurement—Extension to any Number of Output Quantities. JCGM 2011, 102, 1–80.
- Wu, S.; Hannig, J.; Lee, T.C.M. Uncertainty quantification for principal component regression. Electron. J. Statist. 2021, 15, 2157–2178. [Google Scholar] [CrossRef]
- Beck, K. Drivers of structural convergence: Accounting for model uncertainty and reverse causality. Entrep. Bus. Econ. Rev. 2021, 9, 189–208. [Google Scholar]
- Evaluation of measurement data—Supplement 1 to the Guide to the Expression of Uncertainty in Measurement—Propagation of Distributions Using a Monte Carlo Method. JCGM 2008, 104, 1–90.
- Kubisa, S.; Warsza, L.Z. Identification of parameters of the capacitor equivalent scheme Using Monte Carlo methods. Springer Adv. Intell. Syst. Comput. 2017, 550, 165–177. [Google Scholar]
- Harris, P.M.; Cox, M.G. On a Monte Carlo Method for measurement uncertainty evaluation and its implementation. Metrologia 2014, 51, 176–182. [Google Scholar] [CrossRef]
- Tomczyk, K. Influence of Monte Carlo generations applied for modelling of measuring instruments on maximum distance error. IEEE Trans. Instrum. Meas. Control. 2019, 41, 74–84. [Google Scholar] [CrossRef]
- Kowalczyk, M.; Tomczyk, K. Procedure for determining the uncertainties in the modeling of surface roughness in the turning of NiTi alloys using the Monte Carlo method. Materials 2020, 13, 4338. [Google Scholar] [CrossRef] [PubMed]
- Rolek, J.; Utrata, G. An identification procedure of electromagnetic parameters for an induction motor equivalent circuit including rotor deep bar effect. Arch. Electr. Eng. 2018, 67, 279–291. [Google Scholar]
- Weinreb, K. Diagnostics of an induction-motor rotor by the spectral analysis of stator currents. Therm. Eng. 2013, 60, 1006–1023. [Google Scholar] [CrossRef]
- Sulowicz, M.; Ludwinek, K.; Tulicki, J.; Depczynski, W.; Nowakowski, L. Practical adaptation of a low-cost voltage transducer with an open feedback loop for precise measurement of distorted voltages. Sensors 2019, 19, 1071. [Google Scholar] [CrossRef] [PubMed] [Green Version]
- Bouheraoua, M.; Atig, M.; Bousbaine, A.; Benamrouche, N. Electro-Thermal Coupled Modeling of Induction Motor Using 2D Finite Element Method. Adv. Electr. Comput. Eng. 2021, 21, 33–40. [Google Scholar] [CrossRef]
- Trachi, Y.; Elbouchikhi, E.; Choqueuse, V.; Benbouzid, M. Induction Machines Fault Detection Based on Subspace Spectral Estimation. IEEE Trans. Ind. Electron. 2016, 63, 1–11. [Google Scholar] [CrossRef] [Green Version]
- Tomczyk, K.; Piekarczyk, M.; Sokal, G. Radial basis functions intended to determine the upper bound of absolute dynamic error at the output of voltage-mode accelerometers. Sensors 2019, 19, 4154. [Google Scholar] [CrossRef] [Green Version]
- Ostertagova, E. Modelling using polynomial regression. Procedia Eng. 2021, 48, 500–506. [Google Scholar] [CrossRef] [Green Version]
- Sun, B.; Liu, H.; Zhou, S.; Li, W. Evaluating the performance of polynomial regression method with different parameters during color characterization. Math. Probl. Eng. 2014, 2014, 1–7. [Google Scholar] [CrossRef] [Green Version]
Publisher’s Note: MDPI stays neutral with regard to jurisdictional claims in published maps and institutional affiliations. |
© 2021 by the authors. Licensee MDPI, Basel, Switzerland. This article is an open access article distributed under the terms and conditions of the Creative Commons Attribution (CC BY) license (https://creativecommons.org/licenses/by/4.0/).