Article

Experimental and Computational Model for a Neonatal Incubator with Thermoelectric Conditioning System

by
Alejandro Rincón Casado
1,*,
Mauricio Larrodé-Díaz
1,
Francisco Fernandez Zacarias
1 and
Ricardo Hernández Molina
2
1
Department of Mechanics and Industrial Design, College of Engineering, University of Cadiz, 11510 Puerto Real, Spain
2
Thermal Engines and Machines Department, College of Engineering, University of Cadiz, 11510 Puerto Real, Spain
*
Author to whom correspondence should be addressed.
Energies 2021, 14(17), 5278; https://doi.org/10.3390/en14175278
Submission received: 25 June 2021 / Revised: 30 July 2021 / Accepted: 18 August 2021 / Published: 25 August 2021

Abstract

:
This work describes the design, construction and testing of a thermo-electric conditioning device installed in a neonatal incubator with the aim of improving the precision in the regulation of the interior air temperature, reducing noise and interior vibration, and improving the life of the neonate. A simplified one-dimensional thermal model has been developed, made up of resistances and thermal capacities that simulate the thermal behaviour of all the elements of the system from end to end. All the equations of the model are obtained in a nodal way, allowing the mathematical relationship between the input and output to be known. This model makes it possible to improve temperature control, avoiding the deviations that occur in the traditional model controlled by sensors at both ends. The computational model allows to predict the variation of temperatures in transient and permanent regime. This model allows the design and sizing of the thermoelectric system for different outdoor environmental conditions and the selection of the number of Peltier modules needed to satisfy the heating demand of other incubators with different geometry and capacity. The results of the computational model show good agreement with the experimental tests, despite being a simplified 1D nodal model. The results obtained show a coefficient of operation (COP) of 1.38, achieving higher performance than the current traditional electrical resistance system (COP = 1). In addition, a CFD study has been carried out to check the air patterns, to see the temperature uniformity and to estimate the number of air changes per hour (HVAC) inside the incubator.

1. Introduction

Before the 19th century, care for premature newborns who presented problems at birth was non-existent, they were left to their spontaneous evolution, and many of them died as a result. The first to make technological discoveries for better care in the field of neonatology were the French, and at the beginning of the 20th century, they began to study thermal models related to the human body in order to know how it behaved in the face of thermal changes and how to treat these phenomena [1]. Mathematical modelling of the human thermoregulatory system dates back to 1930. The pioneers in developing a thermal model were Burton, Aschoff and Wever, who created a simple model of the human body from simple energy balance equations [2,3]. It was not until 1970 that more sophisticated models of the human body were developed (Stolwijk 1971), as opposed to the simpler multi-node models, which simulated a human body in more detail (thermoregulatory system) and more accurately predicted global and local physiological responses. Studies were also done in the field of humidity in neonatal incubators and the relationship with environmental humidity and the place of measurement and estimation of total transepidermal water loss in premature infants [4]. It was in 1970, at a University in Venezuela, where engineers developed a thermodynamic mathematical model of premature newborns placed in an incubator to improve the control algorithm [5]. Neonates have significant physiological and anatomical differences from adult models studied to date, and only a few groups have explored this field, such as [6,7]. In 2001, Reference [8] conducted a study comparing temperature control in neonates less than 29 weeks gestation, using air mode control, in which nurses decided the incubator air temperature. A computer program, “Heat Balance”, was developed to calculate heat production and heat losses and estimate optimal environmental, humidity and temperature settings to maintain thermal equilibrium. In the same year, a US patent was published by Poole et al. [9] showing the configuration of a neonatal incubator provided with a thermoelectric heating system; however, no mathematical calculation model and experimental results were shown. In 2014, Reference [10] presented an article with theoretical models working on the thermal behaviour of the premature. This study aimed to develop a useful model for the prediction and design of the appropriate controller with the objective of reducing evaporative heat loss. A calculation code was developed to simulate the thermal response of a premature infant to the climatic demand within the incubator system. The model allowed for radiological, conductive, convective, convective and evaporative heat transfers within the incubator system. The environmental conditions (temperature and humidity) inside the incubator were controlled with a classical proportional integral differential (PID). In this work, they proposed a generalised predictive controller coupling (DGPC) to achieve optimal thermal conditions (36.5–37.5) for immature newborns (birth weight < 1000 g). In 2015, a group of researchers from the Complutense University of Madrid, in collaboration with other institutions, designed an algorithm that controls and maintains stable temperature inside a neonatal incubator depending on the parameters of the newborn and the device. The model calculates how the temperature of the air inside the incubator should vary [11]. In 2016, a multi-node mathematical model for the thermoregulatory system of newborns was presented [1]. It comprised seven compartments, one spherical and six cylindrical, representing the head, thorax, abdomen, arms and legs, respectively, and aimed to model the heat transfer processes occurring in the tissues and on the body surface. The model was customisable, i.e., it complied with the individual characteristics of the neonate (e.g., gestational age, postnatal age, weight and length). In addition to thermal neutrality, transient thermal conditions can be taken into consideration. This small pilot study showed good agreement between the model and measured data, as well as the ability of the model to simulate dynamic/thermoregulatory responses. In 2018, a low-cost automatic neonatal incubator equipped with a neonatal weight monitor was designed and implemented to remedy the difficulties encountered in incubator maintenance in developing countries [12]. The device was implemented by interconnecting three modules. The first was the acquisition module that senses temperature and humidity, the second was the control module responsible for monitoring and controlling the operation of the system and the third was the human machine interface through which a user can configure the operating parameters of the system. Mathematical modelling of the proportional-integral-derivative (PID) controller and heat transfer allowed the minimisation of heat loss through the enclosure wall. The results of the numerical simulation performed with the same test condition showed a good agreement between simulation and experimental results. In recent years, cooling and heating technology is increasingly being used in applications where vapour compression systems cannot be used due to their size and noise. For example, the model developed by [13], where a peltier cell cooling system is developed for inclusion in a mattress to cool or heat the user while they sleep. Developing a nodal thermal model and validating the system experimentally. Furthermore, noteworthy is the one developed by [14], where a complex detailed model of the n-p semiconductor pairs inside the Peltier cells coupled to a small cooler is developed and an experimental validation is carried out.
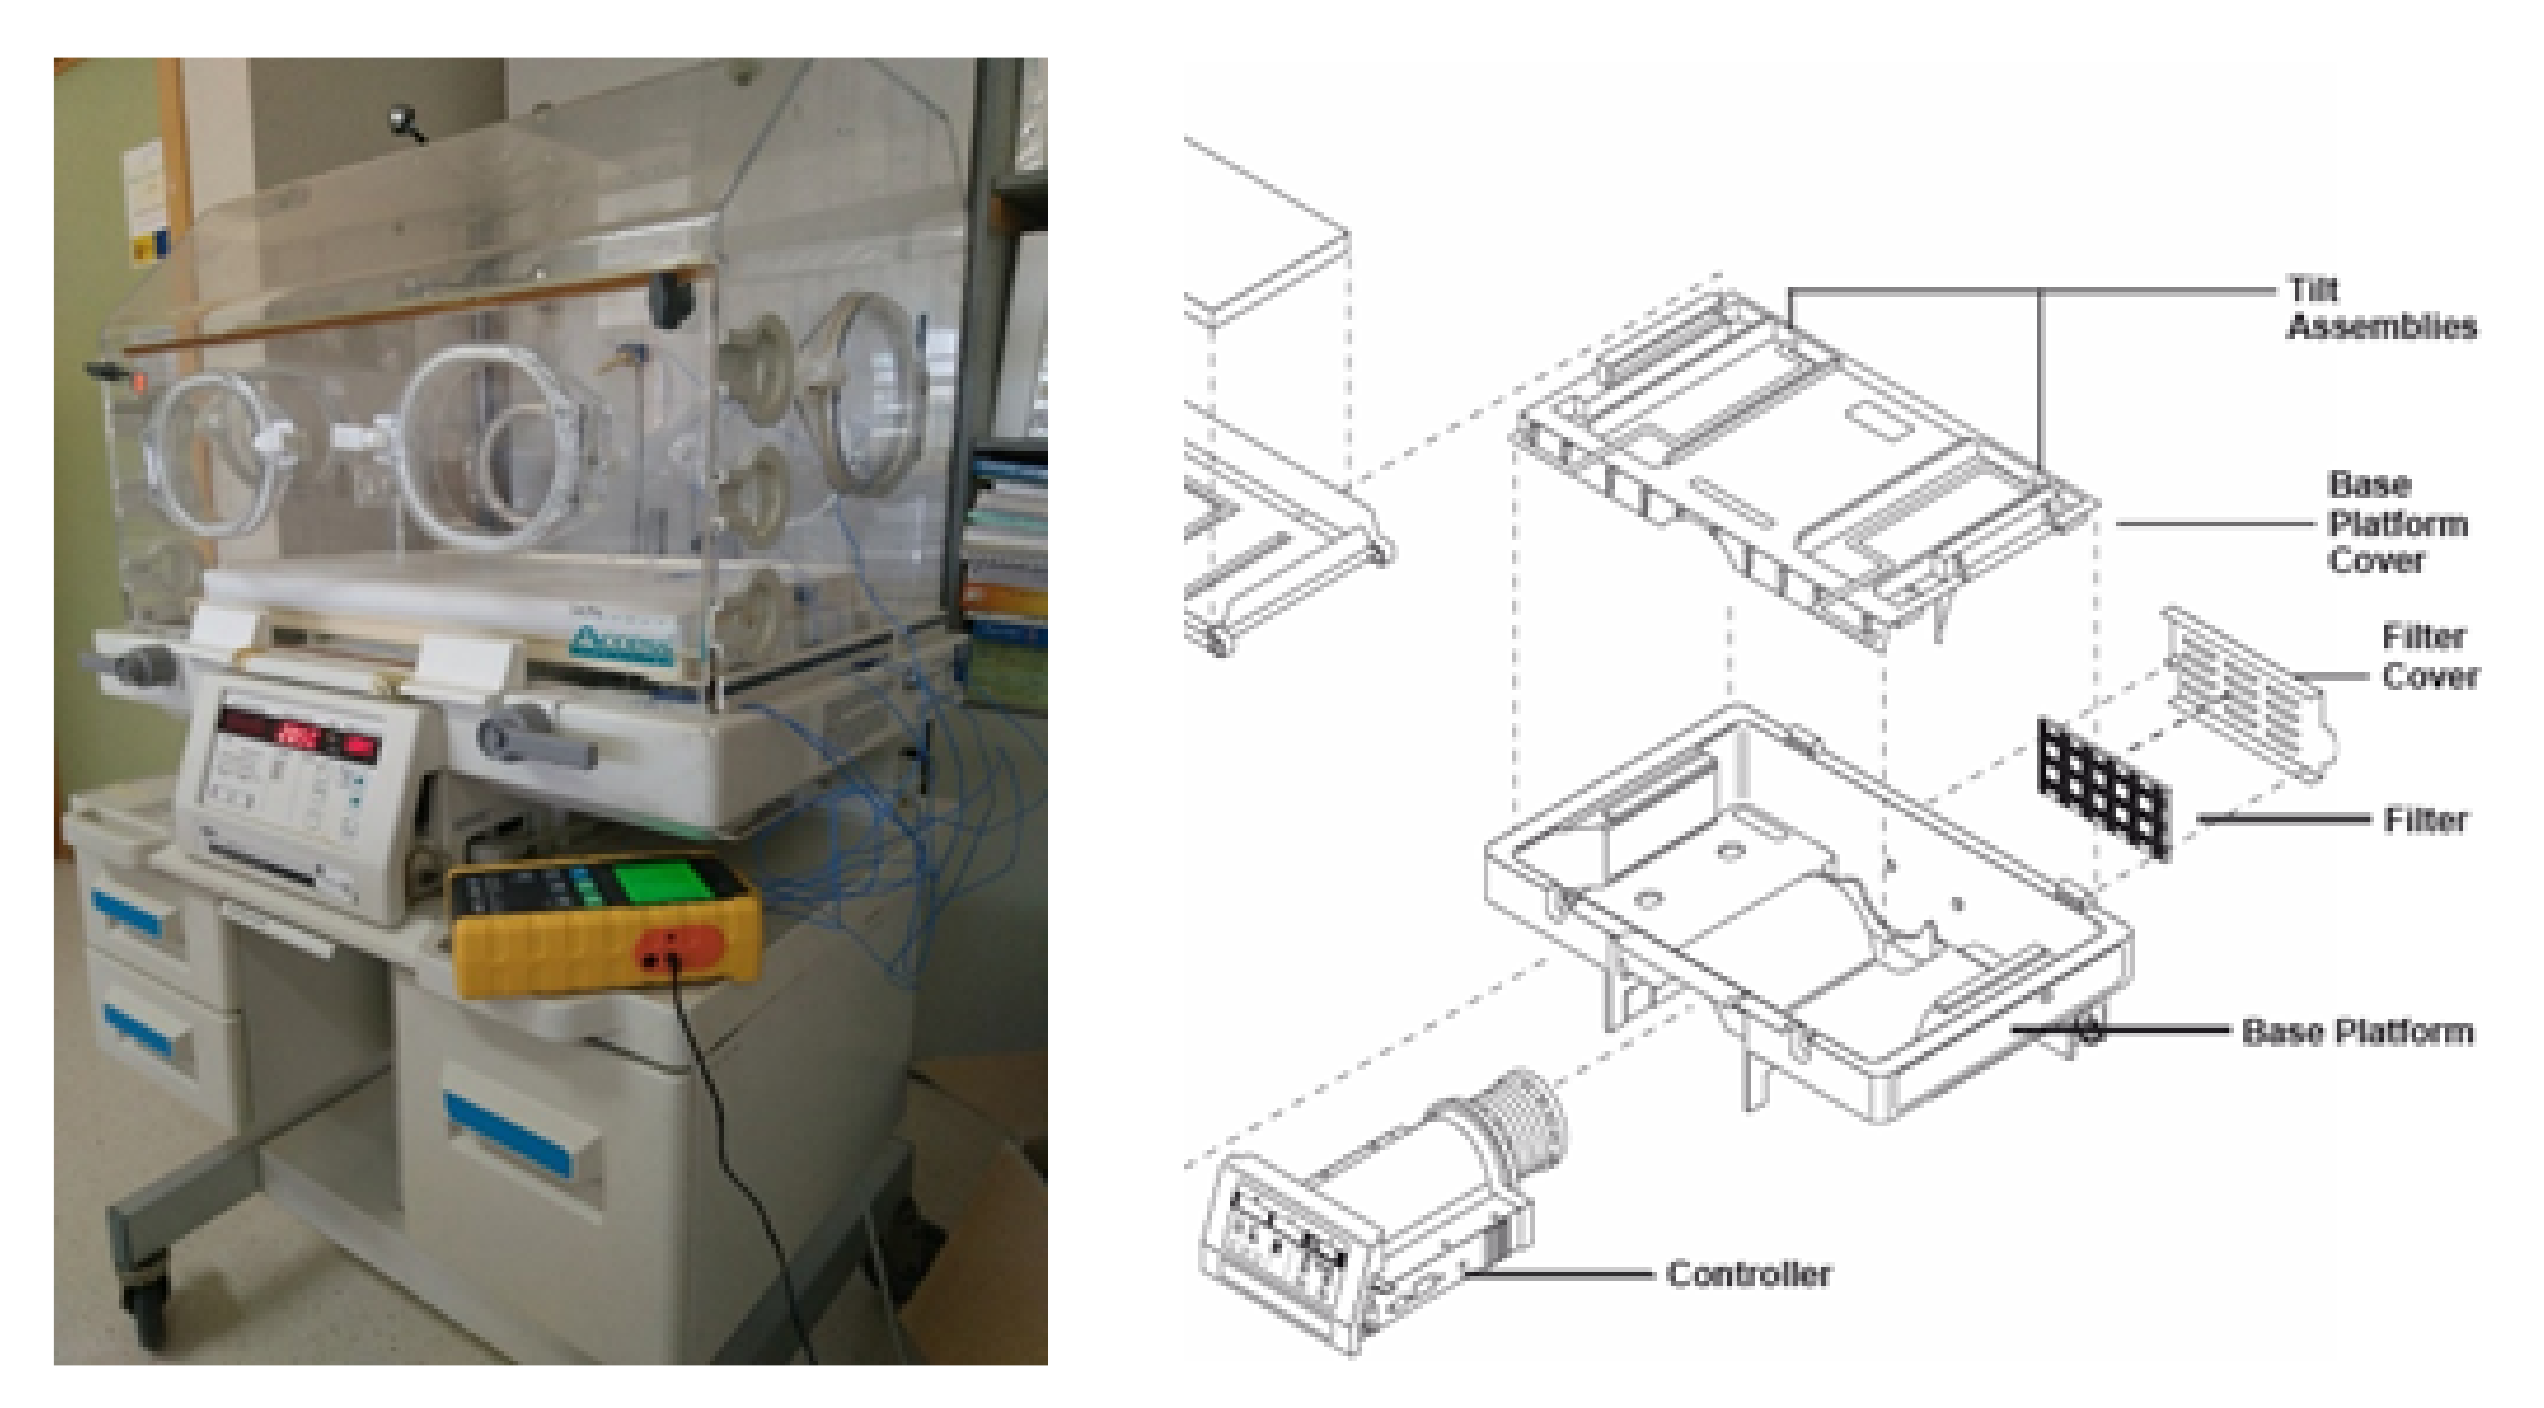
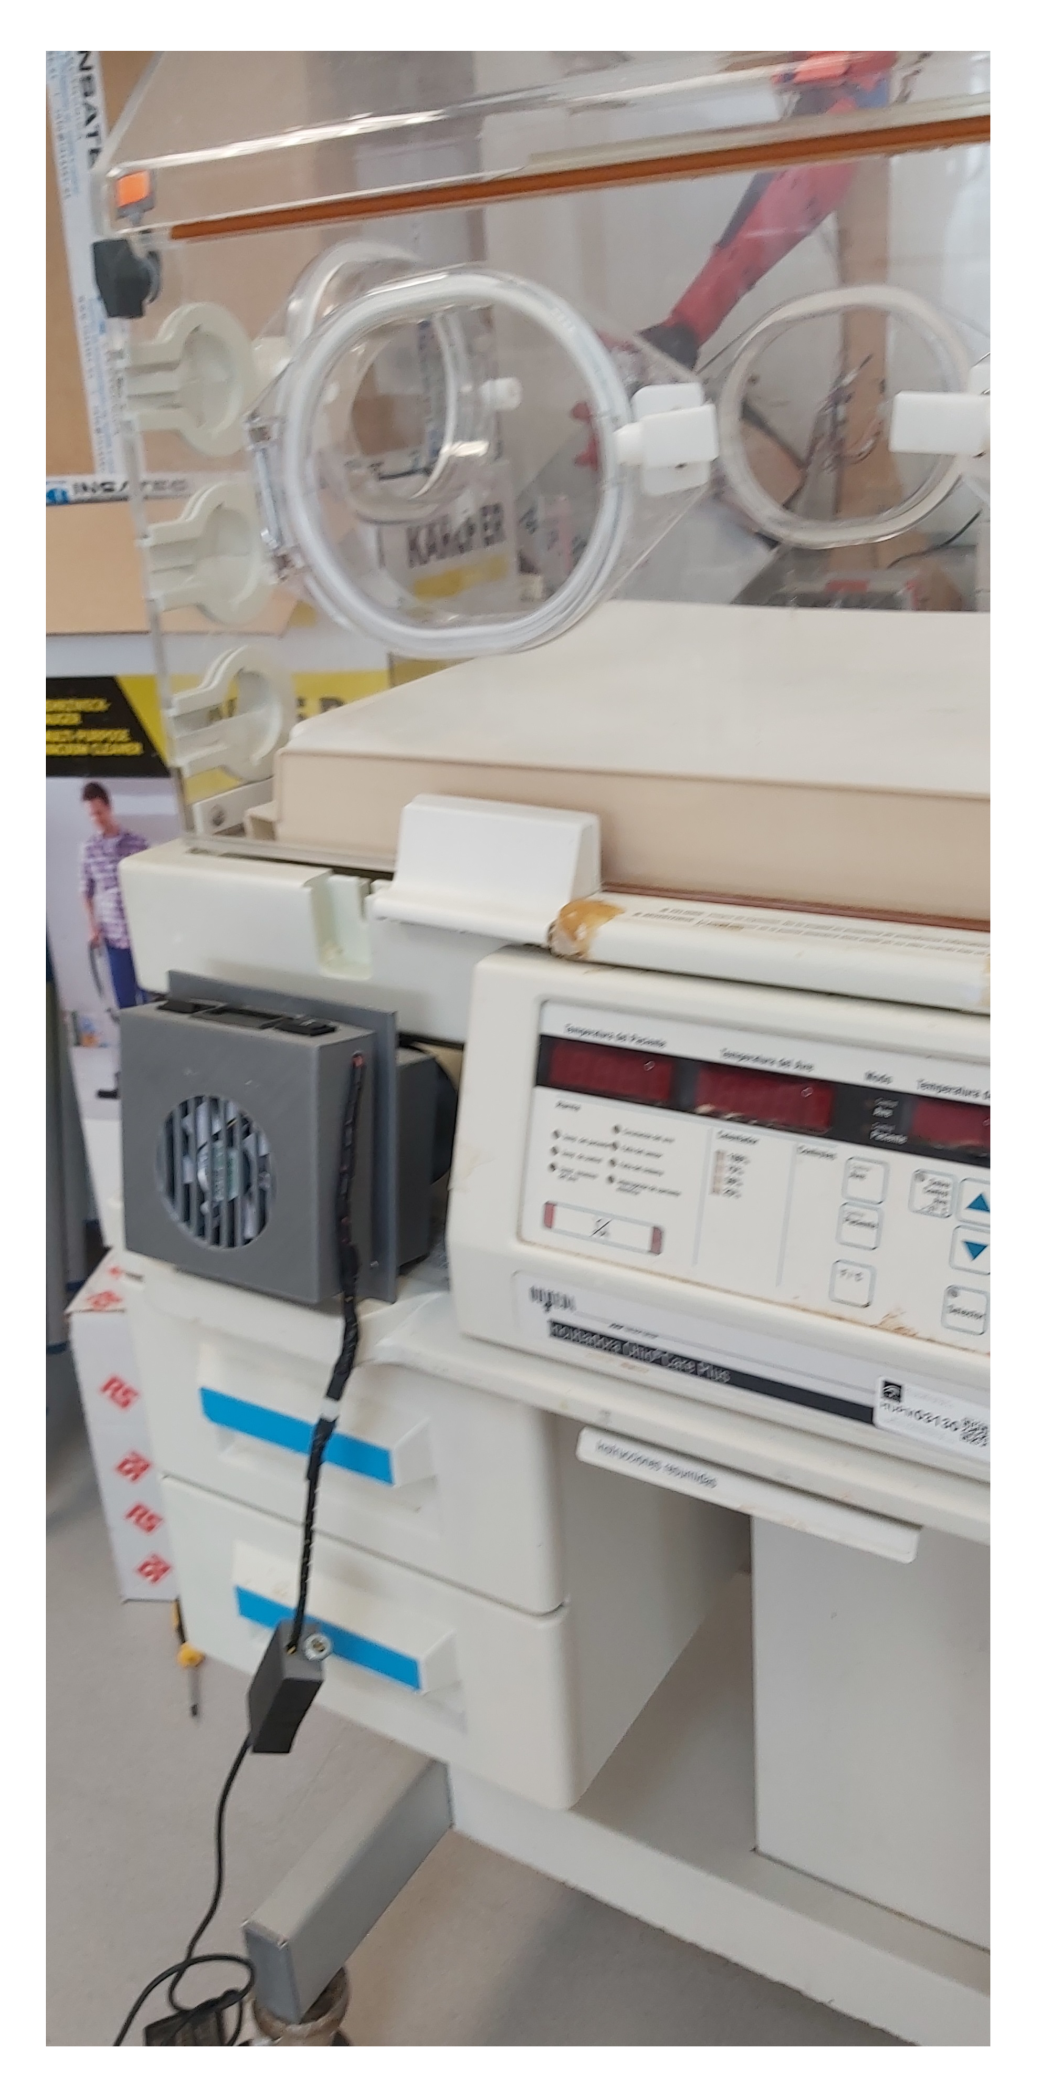
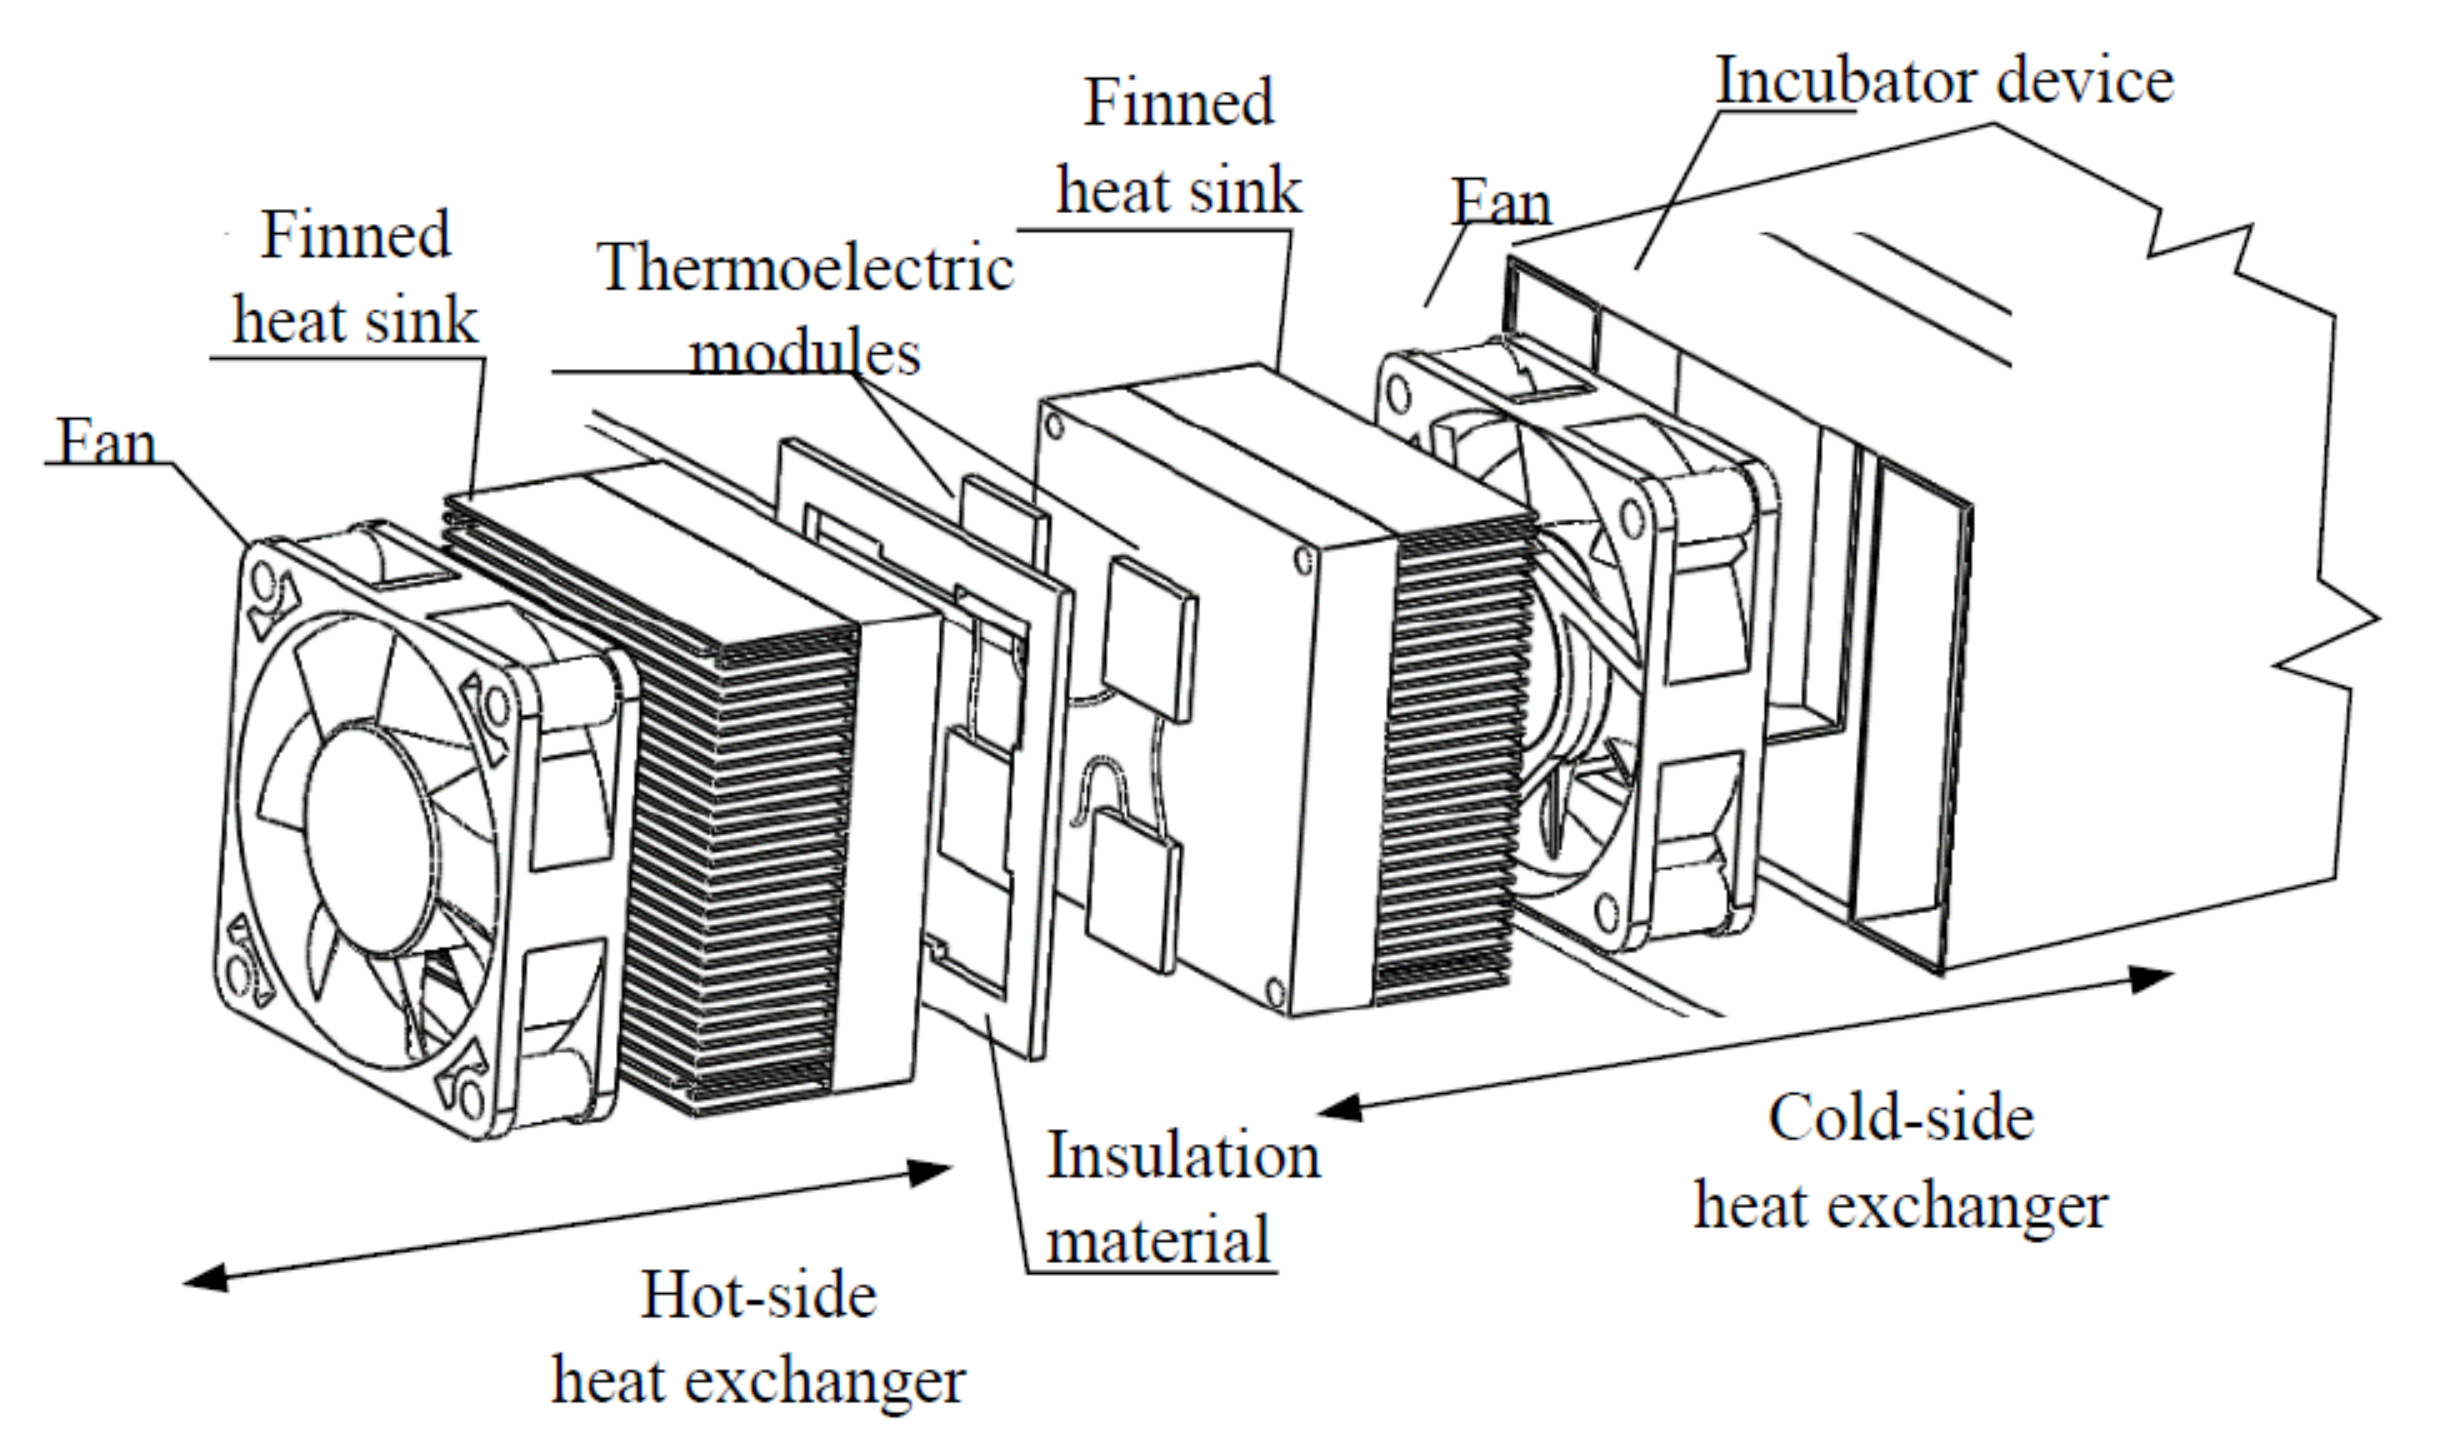
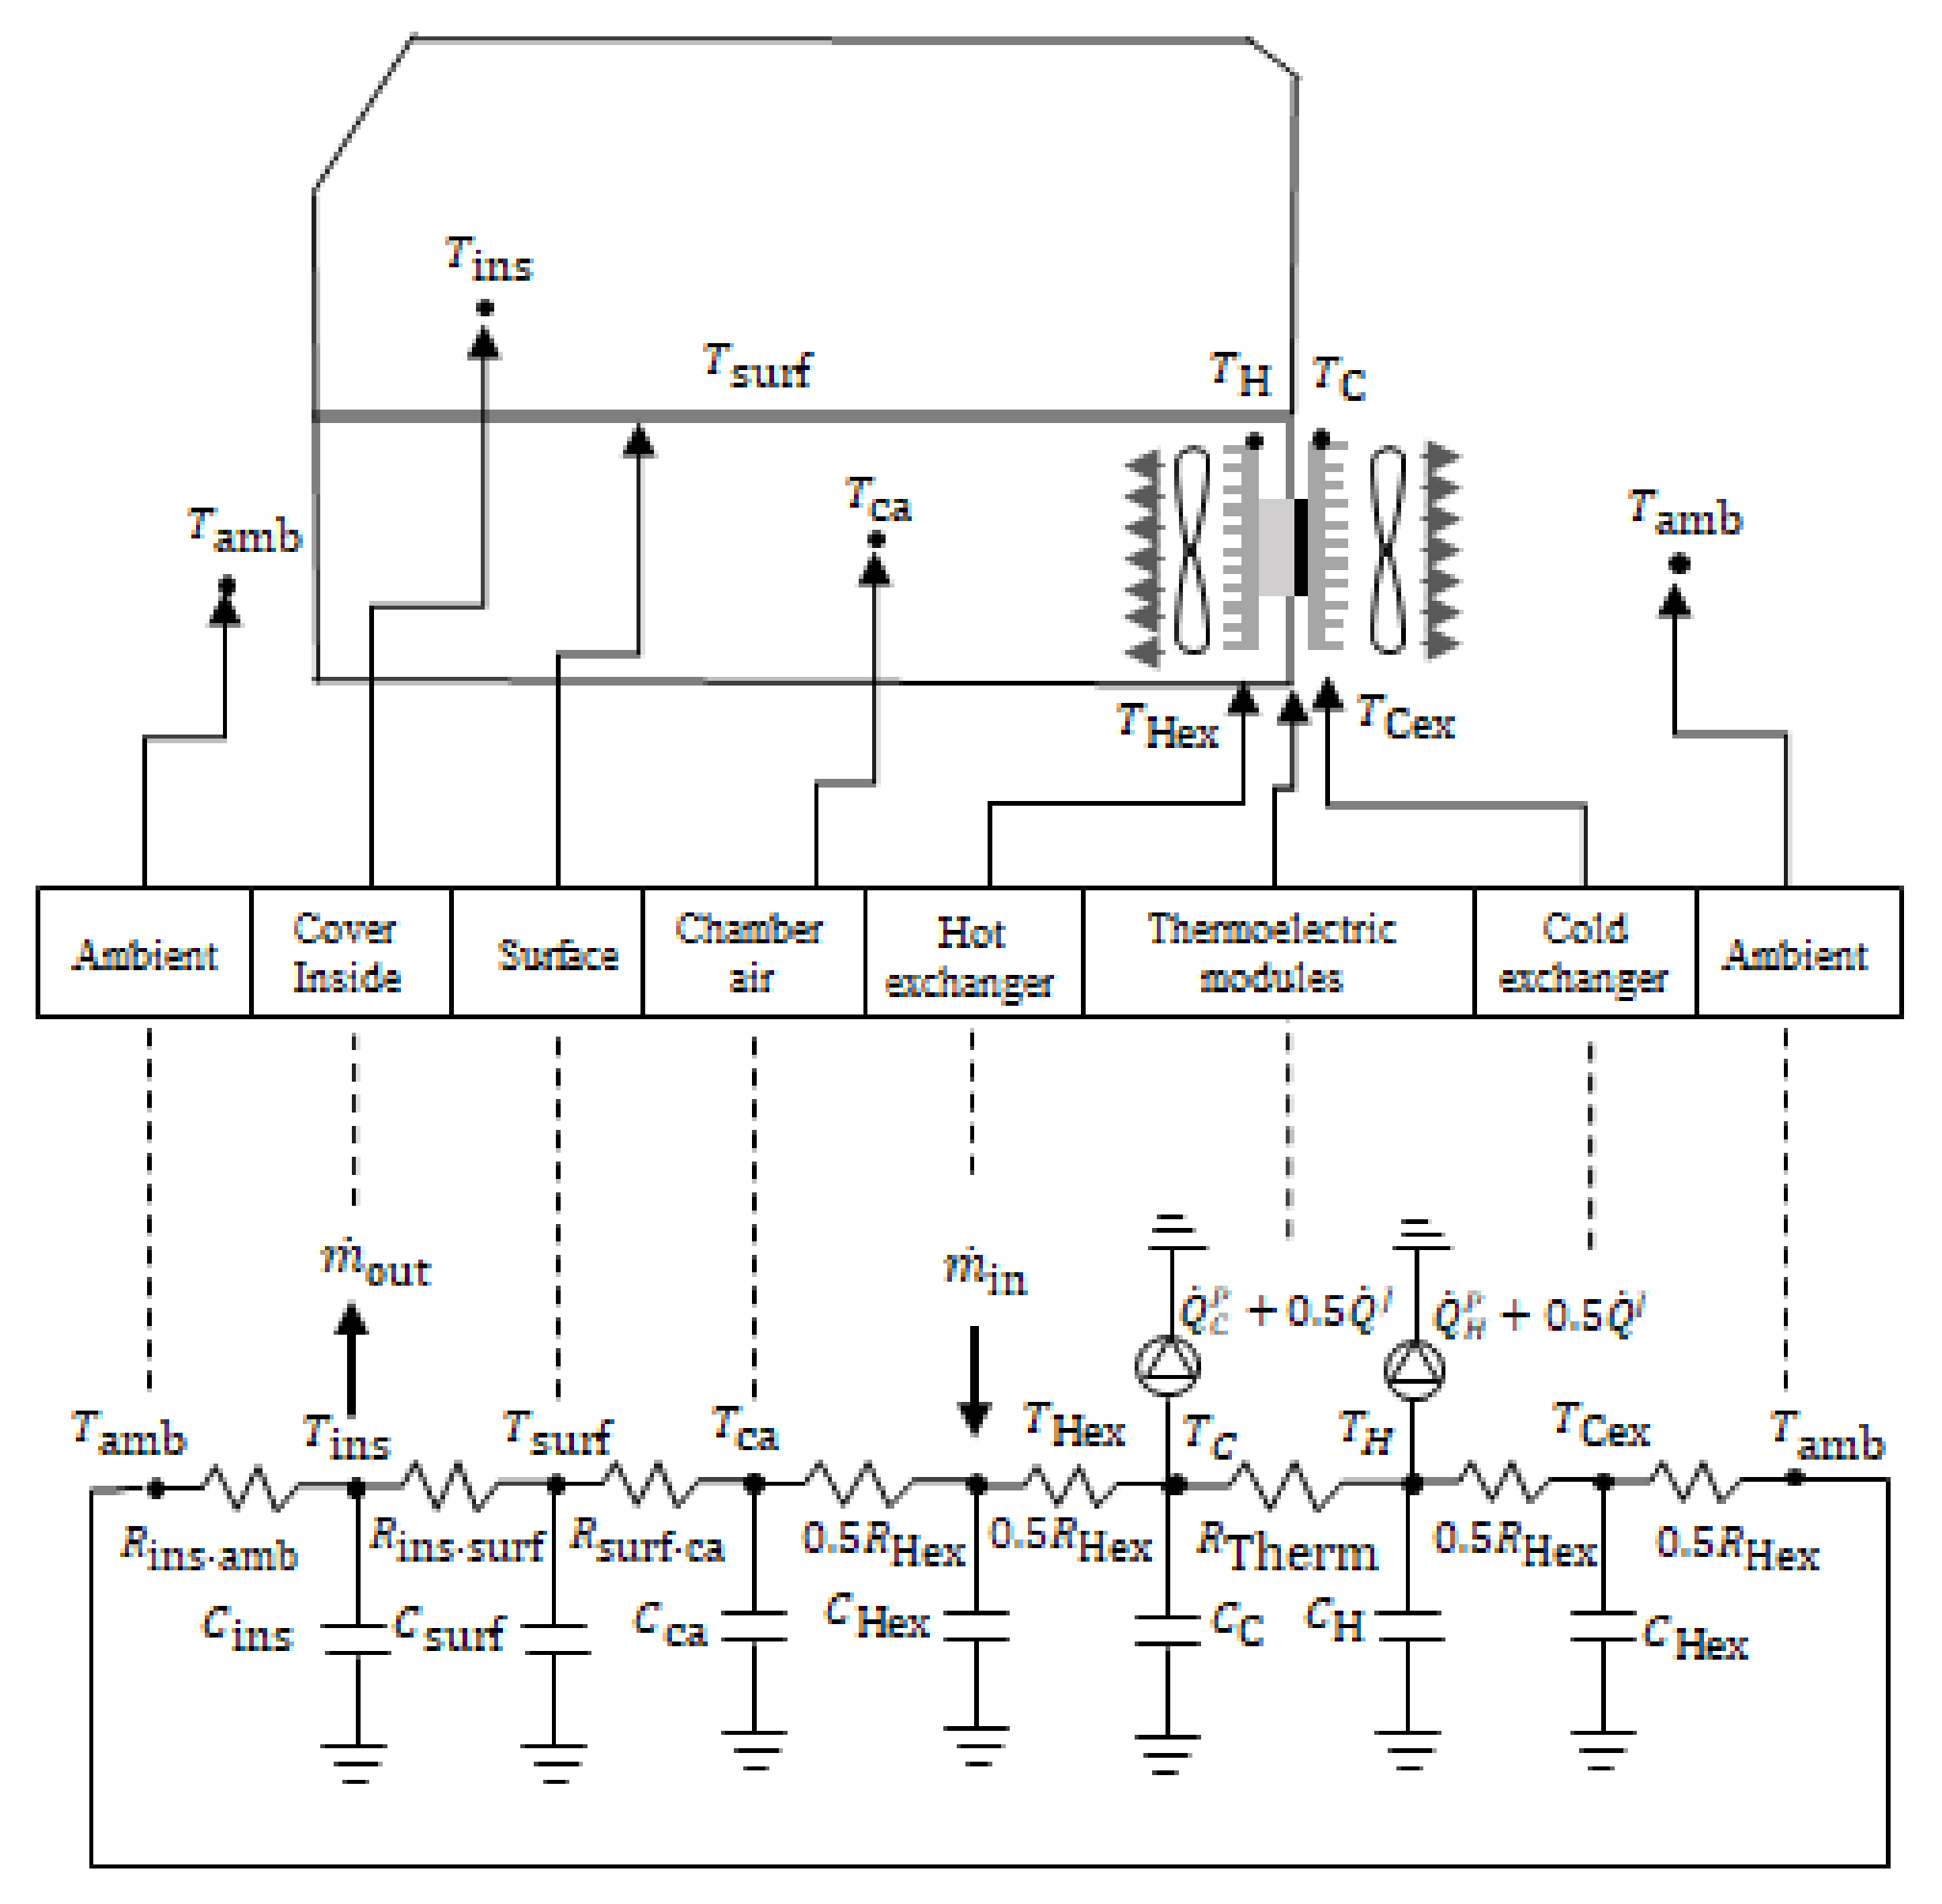
The aim of this work is to include the Peltier effect heating technology in a neonatal incubator, developing a nodal numerical model with the purpose of dimensioning the system according to the size of the incubator and experimentally validating the theoretical model. This technology improves the temperature control of the system by knowing at all times the temperature at each point, allowing precise correction of deviations, and also improves the thermal performance compared to the traditional thermal resistance system. The mathematical model used is easy to replicate by other researchers, as the nodal model used is explained in detail. Another advantage of the thermoelectric system is the reduction of noise and vibrations inside the incubator compared to the traditional system.
Recently, Yeler et al. [15] published a paper on the installation of a thermoelectric heating system in a neonatal incubator. A mathematical model including heat, mass and energy exchange processes, including PID (proportional integral derivative) automatic temperature controllers, is included. The accuracy of the developed model was analysed by comparing its results with experimental results. However, the complexity of the formulation presented and the use of correlations seem to make it difficult to replicate the results. In our work, the nodal scheme and the equations used are shown in a clear and simple way, and could be replicated by other researchers or companies for the design of new incubators.
The paper is structured as follows: in Section 2, materials and methods, the prototype incubator, the thermoelectric device used, and the computational model of the complete system are described, as well as the equations used for the model. In 
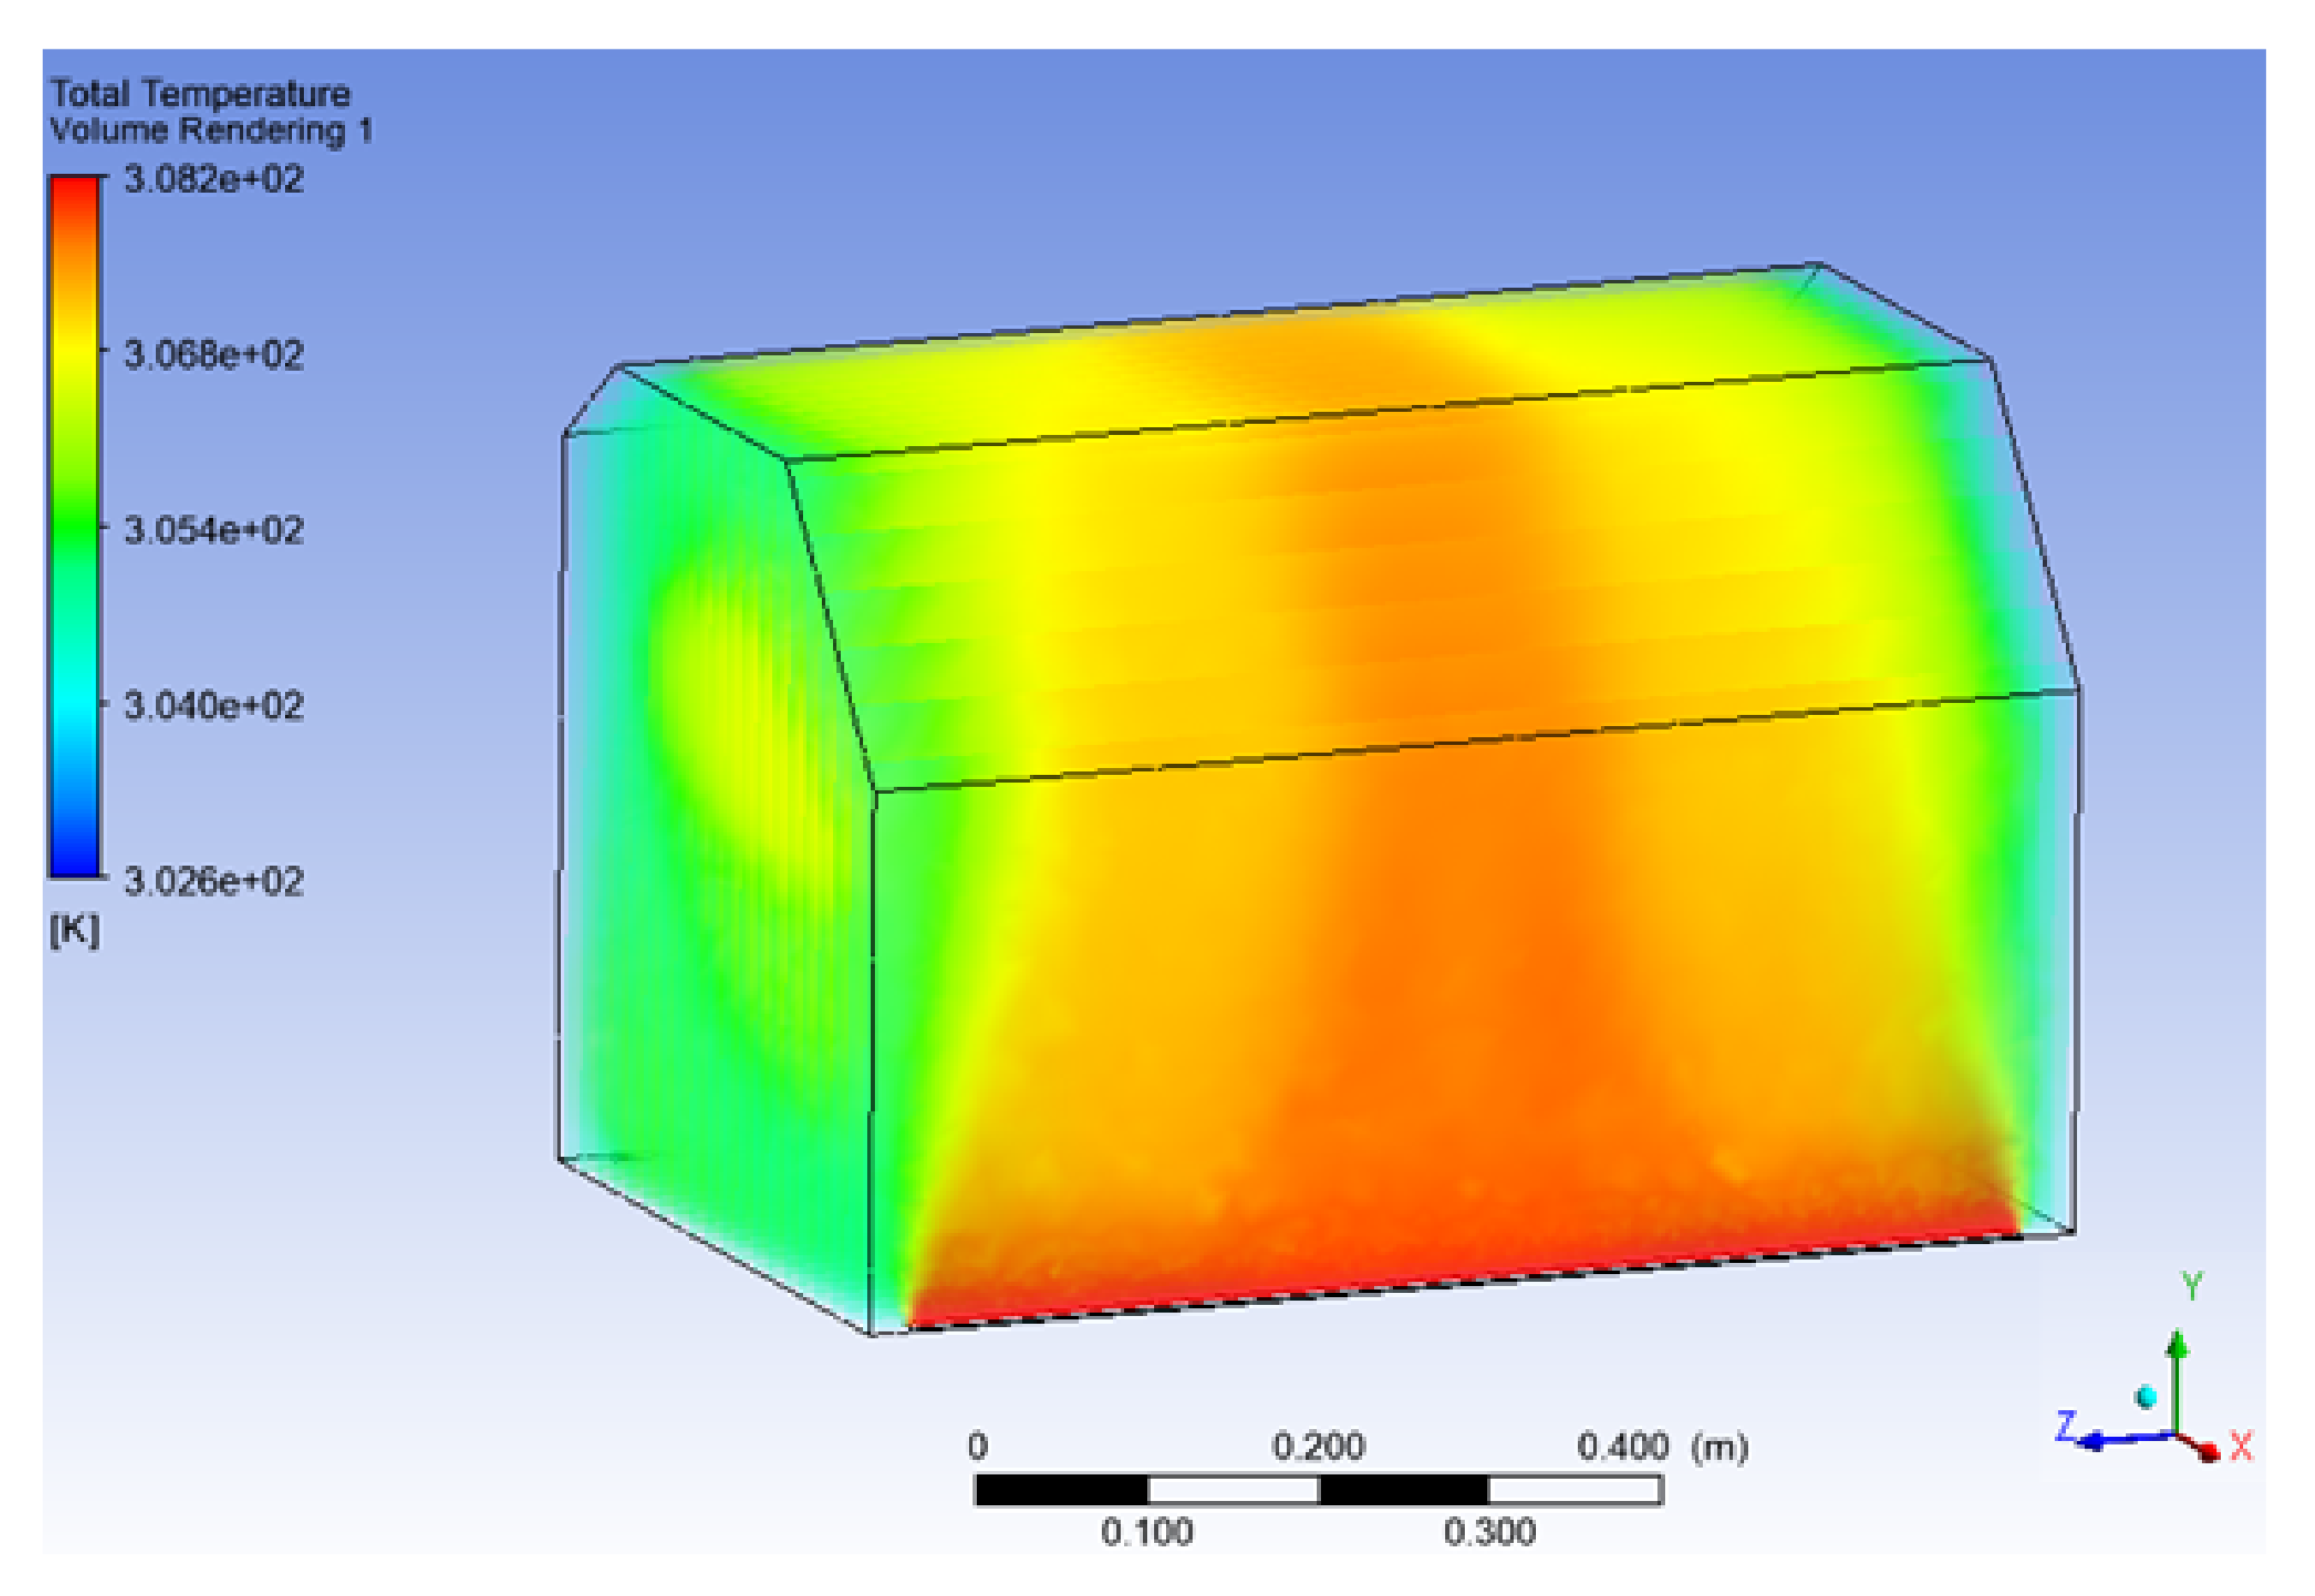
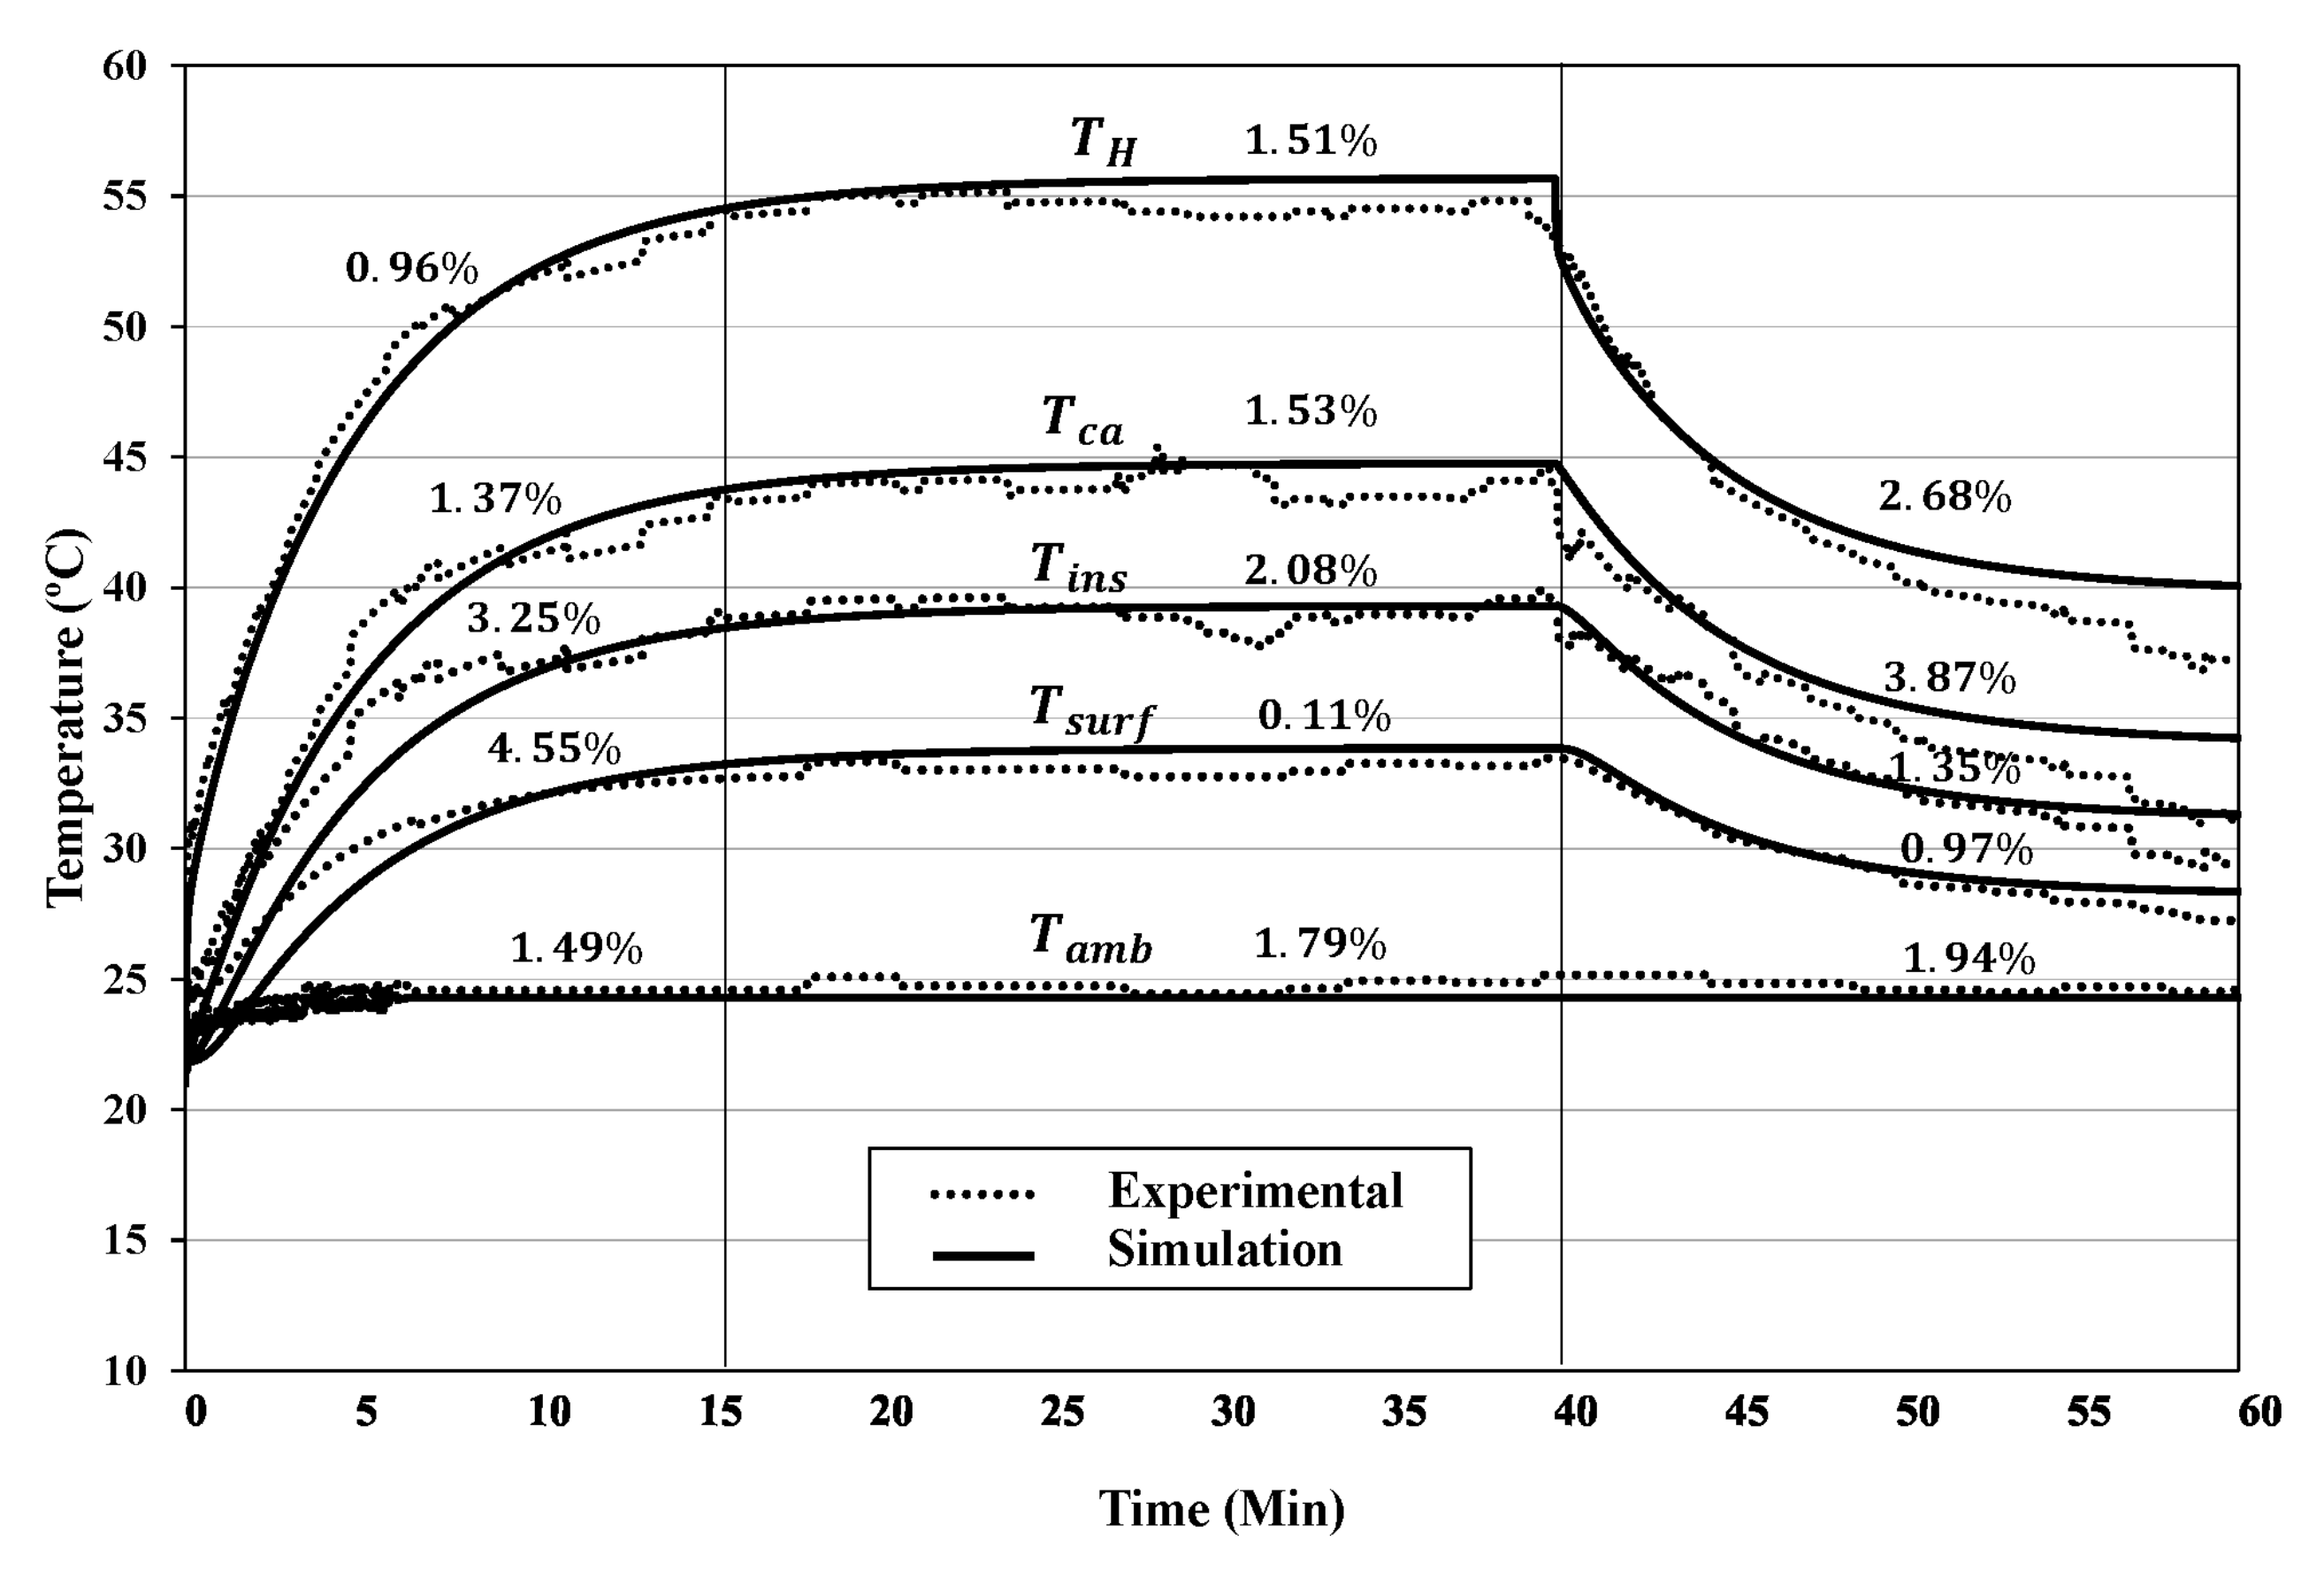
Section 3, results and discussion, a comparison between the computational and experimental models is made, and the performance of the system under different operating conditions is calculated. Finally, Section 4 shows the main conclusions obtained from the work carried out.

2. Material and Methods

The methodology followed in this work has three phases, the first phase consists of measuring the thermal conditions of an incubator in operation, measuring the temperature at different control points. In this phase, the power supplied as well as the temperature at different control points with the heating system are measured. In the second phase, a computational model of the incubator with an integrated thermoelectric system is developed, and this model allows a dimensioning of the thermoelectric system to cover the heating demand, and also in this phase CFD simulations are carried out to check if the temperatures inside the incubator are uniform. Finally, in the third phase, a thermoelectric device prototype is designed and installed inside the incubator, and measurements are taken for comparison with the computational model developed.
This methodology allows the comparison between the experimental model and the computational model and focuses on the temperature measurement of different control points inside the incubator, in addition to the control of the ambient temperature of the test room. To verify and validate the reliability of the model and the prototype, normal operating conditions are reproduced, such as switching on the incubator, maintaining the set point temperature suitable for the newborn, and switching off the incubator. In this way, the model demonstrates its reliability and accuracy with respect to the real prototype. As a result of this research, a computational model is obtained that can be used for other incubator models for the design of new thermoelectric devices.

2.1. Incubator Prototype

In this work, an Ohio Care Plus 3000 incubator was used (see Figure 1). The incubator has a hinged cover for full opening, the cover is made of 6 mm thick polymethylmethacrylate. The full opening is used for cleaning and disinfection of the incubator. On the other hand, the front part has ellipse-shaped openings used for the daily handling of the newborn baby. The technical characteristics and dimensions of the incubator are shown in Table 1. The incubator functions as a hood into which warm, humidified air is introduced to reach a temperature of 36 C and 65–90% humidity when the newborn is unable to regulate its body temperature, decreasing to 30–33 C and 50% when the newborn is able to regulate its temperature. To heat the incubator, the system has an electrical resistance through which air is blown by a fan. The air enters from the outside of the incubator and is passed through a basin of water, then it is conducted to the electrical resistance, exiting through longitudinal openings located around the perimeter of the mattress. The air flows through the entire incubator capsule and heats it uniformly. Figure 2 shows some CFD (computer fluid dynamics) simulations where it can be seen how the air distribution is homogeneous and how it works correctly from the point of view of the newborn’s comfort. The CFD simulation has been done with Fluent v19 (Ansys, [16]) software, using the standard k- ϵ turbulence models, with “enhanced wall treatment”. The parameter y+ must have a value of approximately one, the mesh is refined until this value is reached. Two convergence criteria are adopted: first, the residues of the equations must be below 10 6 ; and second, the three-point temperature inside the incubator must be kept constant for at least 100 iterations.
The neonatal incubator is instrumented to perform the experimental tests and record the variables of interest in this work. The temperature of the control points is measured by means of 5 K-type [17] temperature sensors connected to a 12-channel portable temperature recording station model PCE-T 1200 [17]. The thermolectic system is powered by an adjustable DC voltage source PCE-RPS 2305 [17]. The inlet air flow rate is measured by means of a PCE-VA 11 [17] anemometer flowmeter. Table 2 shows the resolution and accuracy values of the sensors used.

2.2. Device Thermoelectric Prototype

The purpose is to regulate the temperature range by means of a voltage so that the incubator is kept at a temperature suitable for the survival of the newborn and to achieve maximum thermal comfort in a localised manner. To achieve this, a system based on thermoelectricity will be installed in the lower part of the incubator to heat the air chamber under the mattress, and subsequently, this treated air will rise through the grille and heat the incubator. The thermoelectric conditioning device (Figure 3) consists of the following components: two heat exchangers made of extruded aluminium with 23 fins whose total dimensions are 150 × 150 × 70 mm 3 ; two fans type JF1225S2H with dimensions 120 × 120 × 24.5 mm 3 , and maximum power Pfans = 5.5 W (four thermoelectric modules type Marlow RC12-6L with dimensions 40 × 40 × 4 mm 3 ); an external voltage source type Grelco GVD. The system is installed with one of the heat exchangers connected to the fan on the outside, and the other heat exchanger coupled to the other fan, oriented towards the inside of the incubator. Four thermoelectric modules electrically connected in series are installed between the flat sides of the two heat exchangers. The coupling between the two heat exchangers together with the thermoelectric modules at their interface are mechanically connected by means of four screws at the corners.
The principle of operation of thermoelectric modules is based on the Peltier effect. When electrical voltage is applied to the thermoelectric modules, the current flowing through the semiconductor pairs absorbs heat on one side and gives off heat on the other side, functioning as a thermal machine. Thus, for the heating mode, the “hot” side of the modules is installed in contact with the heat exchanger facing the inside of the incubator, and the “cold” side faces the outside. The fans installed are responsible for absorbing and transferring the heat generated on the sides of the thermoelectric modules. In this way, the heat exchanger oriented towards the inside of the incubator is responsible for heating the air inside the incubator. The diagram of the thermoelectric system to be installed in the neonatal incubator can be seen in Figure 4.

2.3. Computational Model

The selected computational model is based on the electrical analogy between resistance, capacitance (capacitor) and voltage source with a heat generating. This modelling is widely used in the scientific literature [13,14] to solve the conduction-convection equations in 3D transient, by means of the Fourier equations in conduction and Newton’s cooling law in convection. The complete computational model for an incubator with Peltier cell heating is shown in Figure 5. The model is a nodal type, each node represents a component of the solid or fluid, and the nodes are linked by thermal resistances and capacities for the elements that have thermal inertia and the transient components are significant. The energy equations for the transient state have been programmed and simulated in Matlab. Section 2.3.2 and Section 2.3.3 present the methodology for calculating the thermal resistances and capacities of the materials, as well as the heat fluxes used.

2.3.1. Thermoelectric Model

The thermoelectric model system includes M Peltier modules, and each module is comprised of N pairs of thermoelectric semiconductors. The modules are connected electrically in series, but thermally in parallel. The semiconductors are electrically isolated from the outside by two ceramic plates on both sides, these ceramic plates have high thermal conductivity for heat conduction, but low electrical conductivity. The model chosen for this application is the Marlow RC12-6L (Table 3) with dimensions of 40 × 40.7 × 4 mm 3 . In the thermal model, only heat conduction through the thermoelectric module is considered, convection between the ceramic plates is neglected as the distance between the ceramic plates is small (2.5 mm) compared to the width (40 mm) and length (40.7 mm) and also the air is very confined behaving like a solid, but with a very low thermal conductivity close to insulating materials. Therefore, for the thermal model two nodes connected by their thermal resistance R T h e r m are considered. Both nodes have a thermal capacitor or capacitance connected, one at the hot node C H and one at the cold node C C , according to the equations Equations (1) and (2).
R T e r m = L l 2 N M k l A l + 2 L c M k c A c
C H = C C = M N L l A l ρ l c l + M L c A c ρ l c c
The applied electrical voltage passes a current through the semiconductor pairs of the thermoelectric module, causing the Peltier effect to emit heat on the hot side of each module ( Q H ), at the same time the cold side absorbs heat from the environment ( Q C ), according to the Equations (3) and (4) [18]. In addition to this generated heat, the heat of the Joule effect Equation (5) is added due to the passage of the electric current, Equation (8). The Thomson effect (Equation (6)) causes a negligible heat flux because the temperature difference between the two ends is low [18,19]. The computational model takes into account the Seebeck coefficients of the n-type and p-type legs as constants as a function of the mean module temperature, being equal but of opposite sign [14,20]. The thermal conductivity and electrical resistance of the ceramic plates are calculated at an average temperature of the thermoelectric module. The average temperature of the thermoelectric module varies over the simulation time, therefore the Seebeck coefficients, thermal conductivity and electrical resistance are calculated at each time step, so that the model correctly simulates the transient state. Finally, the Equations (8) and (9) show, respectively, the electrical energy consumed by all modules and the electrical current passing through them. The prototype includes four Marlow RC12-6L thermoelectric modules, as described in Section 2.2. All additional parameters needed to calculate the Equations (1)–(9) are presented in Table 3.
Q ˙ H P = M N 2 I T H α H
Q ˙ C P = M N 2 I T C α C
Q ˙ J = M I 2 R E l e c t = M I 2 2 N A l σ l L l
Q ˙ T h o m = I ( T H T C ) ( τ p τ n ) N M
τ n , p = T d α ˙ n , p d T
P = E I = Q ˙ J + Q ˙ H P + Q ˙ C P
I = E 2 M N ( T H α H T C α C ) R E l c t M

2.3.2. Heat Exchangers Models

The heat exchangers are located one on the cold side, which exchanges heat with the room environment (see Figure 5) and another heat exchanger in contact with the warm side of the modules transfers heat to the inside of the incubator. The heat exchangers are the same, made of an extruded aluminium block with 23 fins and dimensions of 150 × 150 × 70 mm 3 and a 1.5 mm thick aluminium casing which is used to attach the fan. The correct simulation of heat exchangers must include heat transfer mechanisms by conduction, convection, radiation and condensation on the cold side. The analytical calculation of the convection coefficients with correlations and the long-wave radiation heat exchanged with the environment presents great uncertainty. Therefore, the empirical measurement of convective-radiant thermal resistances is chosen, achieving greater precision and avoiding uncertainties. As shows in Figure 5, a single node represents each heat exchanger, and experimental tests are set up to obtain the corresponding thermal resistances ( R C e x , R H e x ). To predict the heat retention thermal capacity of the heat exchanger, it is estimated from the volume, density and specific capacity of the material ( V , ρ , C ) . Where 900 J/kgK is the specific heat of the aluminium, and 1.8 kg is the mass of either heat sink, giving C C e x and C H e x . To calculate the thermal resistances of the heat exchangers, the prototype is installed in a climatic chamber where the ambient temperature is set to 28 C. The thermoelectric modules are supplied with three power ratings as shown in Table 4 and the fan is connected at maximum power. Once the system reaches steady state, the indoor air ( T i n s ), ambient ( T a m b ), heat sink ( T H , T C ) and mattress surface ( T s u r f ) temperatures are recorded to calculate the average values, along with the final voltage (E) and electric current (I). Then, the Equations (10) and (11) apply the energy balance at the ends of the modules to calculate R H e x and R C e x . Each trial is replicated twice so that nine runs are performed. Finally, Table 4 shows the averages of the experimental temperatures, while the final values of the thermal resistances are shown in the last column.
R H e x = ( T H T c a ) ( T H T C ) M R T h e r m M Q ˙ J 2 Q ˙ H P 1
R C e x = ( T C T a m b ) ( T H T C ) M R T h e r m + M Q ˙ J 2 + Q ˙ C P 1

2.3.3. Incubator Model

For the thermal model of the incubator, three nodes have been defined, the first one in the air inside the metrachilate urn, the second one on the surface of the mattress and the third one in the inner chamber of the hot exchanger outlet. The proposed model does not include the newborn baby as the experimental test is not feasible; however, it is possible to incorporate one more node to the model with a constant temperature of 39 C and a storage capacity equivalent to its weight. The temperatures defined are inside the urn ( T i n s i d e ), on the surface of the mattress ( T s u r f ), and in the inner air chamber at the outlet of the hot exchanger of the thermoelectric device ( T c a ). The junction between nodes is made with thermal resistances R c a s u r f for the thermal resistance between the surface of the mattress and the chamber; R s u r f i n s for the thermal resistance between the surface and the air inside the incubator; and R i n s a m b for the thermal resistance between the air inside the incubator and the ambient air. For the calculation of the thermal resistances, heat is considered to flow from the node with the highest temperature to the node with the lowest temperature. In the case of R c a s u r f the heat transfer between the nodes includes the mechanism of conduction and convection. In the case of R s u r f i n s it includes the convective resistance between the surface of the mattress and the incubator air, it should be noted that the long wave radiation with the outside room is also included in this resistance when the system reaches steady state. Given the inhomogeneity of the materials and the expected uncertainty in the analytical calculation of the heat transfer coefficient by conduction, convection and radiation, a set of experimental tests are carried out to obtain the numerical values of thermal resistances. In addition to the thermal resistances between the nodes, they are assigned a thermal capacity, C c a , C s u r f , and C i n s , for the air in the chamber, mattress, and air inside the incubator, respectively. The values of the capacities are obtained from the material properties multiplied by the volume and density. The heat capacity of the air chamber and the air inside the incubator ( C c a and C i n s ) are obtained from the air volume 0.0315 3 , and 0.1715 m 3 , respectively. The density of air and the specific heat of air at 25 C are 1.21 kg/m 3 and 1007 J/kgK, respectively, [21]. For the capacity of the materials between the inner air space and the surface of the C s u r f mattress, the most insulating material is 30 mm foam rubber (insulation layer), whose density is 25 kg/m 3 and 1674 J/kgK of specific heat.
The thermal resistances are calculated experimentally by testing in a temperature-controlled room at 28 C in a similar way to how the thermal resistances in the heat exchangers are calculated. The thermoelectric modules are supplied in three power ratings, and the fans are supplied at maximum power (see Table 5). Once the system reaches steady state, the temperatures of the indoor air ( T i n s ), ambient ( T a m b ), heat sink ( T H , T C ) and mattress surface ( T s u r f ) are recorded to calculate the average values, together with the final voltage (E) and electric current (I). Then, Equations (12)–(14) apply the energy balance at the ends of the modules to calculate R c a s u r f , R s u r f i n s and R i n s a m b . Each test is replicated twice so that nine runs are performed. Finally, Table 5 shows the averages of the experimental parameters, while the final values of the thermal resistances are shown in the last row.
R c a s u r f = ( T c a T s u r f ) T H T C M R T h e r m M Q ˙ J 2 Q ˙ H P 1
R i n s s u r f = ( T i n s T s u r f ) T H T C M R T h e r m M Q ˙ J 2 Q ˙ H P 1
R i n s a m b = ( T i n s T a m b ) T H T C M R T h e r m M Q ˙ J 2 Q ˙ H P 1

2.3.4. Equations of Computational Model

The model developed by electrical analogy includes heat transfer between nodes by the general transient heat transfer Equation (15), and convective heat flow exchanged with the environment as a boundary condition is governed by Newton’s cooling law, as shown by Equation (16).
ρ c p T t = q ˙ c + q ˙ g + k 2 T
q ˙ c = h Δ T
The model is divided into 8 nodes, including resistors, capacities and heat sources. The thermal resistances link two nodes and represent the resistance they oppose to the flow of heat, either solid or fluid; the capacities determine the temperature variations of the node over time; and the power sources determine the heat flow generated or absorbed at each node. The heat flux is positive when it enters the node, and negative when it leaves the node. The particularised equations for the studied model result from applying the transient energy balance (15) at each node of the model. Equation (17) represent the energy balance in the hot and cold node of the thermoelectric module, respectively. The term on the left hand side of the equation represents the thermal capacity of the node ( C P ) times the number of modules of the thermoelectric system (M), multiplied by the variation of the node temperature with time; the first term on the right hand side of the equation represents the heat flux generated due to the Peltier effect ( Q ˙ H P ); the second term is the heat flux due to the Joule effect ( Q ˙ J ); the third term is the conduction heat flux transmitted to the heat exchanger ( Q ˙ H H e x ); and the fourth term is the internal heat transfer between the hot and cold side of the modules due to their internal thermal resistance ( Q ˙ H C ). Equation (18) is similar to Equation (17), but on the cold side. The Equations (19) and (20) show the energy balance in the hot and cold heat exchanger, respectively. Where the temperature of the node varies with time as a function of the capacity and the heat flow exchanged with the thermal resistors to which it is connected. Equation (21) represents the energy balance in the lower air chamber of the incubator. It is located underneath the newborn’s living quarters and is in contact with the thermoelectric device. The temperature of this node depends on the heat capacity of the air, the heat fluxes exchanged with the heat exchanger on the warm side and the surface of the mattress. Equation (22) represents the energy balance of the mattress surface. Its temperature depends on the heat capacity of the materials and the heat fluxes exchanged with the air chamber and the incubator cabin air. Finally, Equation (23) is the energy balance inside the incubator. In this balance, the temperature depends on the heat capacity of the air and the heat fluxes it exchanges with the environment and the surface of the mattress.
M C H d T H d t = Q ˙ H P + 0.5 Q ˙ J T H T H e x 0.5 R H e x T H T C M R T h e r m
M C C d T C d t = Q ˙ C p + 0.5 Q ˙ J + T C e x T C 0.5 R C e x + T H T C M R T h e r m
C H e x d T H e x d t = T H T H e x 0.5 R H e x T H e x T c a 0.5 R H e x m ˙ i n C p ( T c a T a m b )
C C e x d T C e x d t = T C e x T C 0.5 R C e x + T a m b T C e x 0.5 R C e x
C c a d T c a d t = T H e x T c a 0.5 R H e x T c a T s u r f R c a s u r f
C s u r f d T s u r f d t = T c a T i n s R c a s u r f T i n s T s u r f R s u r f i n s
C i n s d T i n s d t = T i n s T s u r f R s u r f i n s T i n s T a m b R i n s a m b m ˙ o u t C p ( T i n s T a m b )
For the input of the computational model are used: the initial temperatures; the geometrical dimensions, the specific heat and density of the materials; the number of thermoelectric modules and the number of pairs; the supplied electrical voltage; the ambient-surface thermal resistances, the surface-indoor air resistance and the resistance and capacity of the heat exchangers; dependence functions for the thermal conductivity, the Seebeck coefficient and the electrical resistance of the module. The results of the computational model are: time evolution of temperatures, heat fluxes, current intensity, electrical power consumption and coefficient of performance. The model uses the temperatures for time instant t to calculate the temperature-dependent thermoelectric properties from Table 3 (Seebeck coefficient, thermal conductivity and electrical resistivity of the semiconductor legs), which are then used to update the electrical parameters, heat flow rates and thermal resistance of the module with the Equations (1)–(9). Next, the temperatures for t+ D e l t a t are solved by obtaining them from the global thermal model. Each time step represents a real state of the system obtaining the transient response of the system. The model assumptions are:
  • 1-D model.
  • Half of the heat generated by Joule effect is applied to the hot end of the modules, the other half being applied to the cold end.
  • Thomson effect is negligible.
    α = α p = α n
    κ 1 = κ 1 p = κ 1 n
    σ 1 = σ 1 p = σ 1 n

3. Results and Discussion

3.1. Comparison between Experimental and Computational Models

In order to verify and validate the capacity of the computational model to reproduce the results of the experimental test, an experimental test is carried out, which will be repeated three times to check the repeatability of the results. In this test, the incubator starts from thermal rest in an air-conditioned room (28 C), after which the system is switched on at a setpoint temperature (37 C). The system evolves from the transient regime to the steady state regime and then stops to capture the transient regime of the off-phase. The input variables in the experimental prototype are the electrical voltage supplied by the voltage source and the ambient temperature of the room where it is located. On the other hand, the input variables to the computational model are: resistances, thermal capacities of the components, the supply voltage supplied to the thermoelectric modules and the number of modules. The computational model of differential equations is solved with the Runge–Kutta numerical method using Matlab software. The results obtained are compared with the computational model of resistances and capacities, observing an excellent agreement between the dynamic simulation and the experimental behaviour. Figure 6 shows the comparison between the computational model and the experimental model. Evidently, there are deviations. However, the computational model satisfactorily reproduces the transient and steady states of the system at the control nodes.

3.2. Performance of the Thermoelectric-Driven

This section shows a proof of concept of a thermoelectric heat pump applied to heat the indoor air of an incubator, and the influence of the power supply is studied. The incubator is tested in an air-conditioned room at 37 C. The fans of both heat exchangers are powered with 0.5, 2.5, and 5.5 W, while each thermoelectric module is powered with 15 V, 20 V, and 25 V. Regarding the thermal operating efficiency (COP) of the thermoelectric system, it is worth noting its advantage over the current thermal resistance system. It is known that thermoelectric modules in heating mode have an efficiency higher than unity ( C O P h e a t >1). The calculation of the C O P h e a t is calculated by Equation (24) from the ratio of the heat flux obtained to the electrical power supplied. In Table 6, the experimental and simulation results of the COP are shown as well as the obtained deviations. A statistical study of the errors was carried out to analyse the accuracy of the computational model with respect to the experimental model. Table 7 shows the five temperatures analysed, showing the arithmetic mean and standard deviation for the three periods (0–15 min), heating, steady state (15–40 min) and cooling (shutdown, 40–60 min). The Kolmogorov–Smirnov test has been applied to the 5 temperatures to check if the error distribution follows a normal distribution, obtaining a negative result, therefore, the statistical indicators used will be the mean and standard deviation of each variable. Analysing the results of the Table 7 and Figure 6 where the errors for each variable and period are shown, it can be seen that the largest errors occur in the heating and cooling period. In the cooling period, the T s u r f variable has the highest error (4.55%), a possible cause of this deviation is the estimation of the thermal capacity ( C s u r f ) of the mattress, the capacities of ordinary foam have been used, since the thermal characteristics of the existing mattress are not known with precision. On the other hand, in the cooling period, in general all temperatures show a larger deviation, i.e., when the system is switched off, the computational model cools down more slowly than the experimental model. In this period, the fan is still running and may be influenced by air leakage losses due to the poor airtightness of the incubator. However, the system behaves more accurately in the stationary state period, in this period the oscillations of the experimental model are around the average temperature of the computational model, where the maximum error is 2.08%. In general, the accuracy of the computational model is good for a 1D nodal model.
C O P = ( T a m b T i n s ) R i n s a m b + m ˙ a i r c a i r ( T a m b T i n s ) P + P F a n s

4. Conclusions

This paper describes the design, construction and testing of a thermoelectric conditioning system for a neonatal incubator in order to achieve stable temperature and precise temperature control. In addition, a nodal thermal model of the complete system and its environment has been developed and validated. This model allows precise temperature control at every point in the system and has the advantage that small temperature differences can be controlled end-to-end. The traditional system only controls the inlet and outlet temperatures by means of a thermostat and overheating occurs due to the transient effect when the system is switched on and off to reach the setpoint temperature. Regarding the energy efficiency of the thermoelectric system, the COP improves, obtaining values greater than one (1.72 and 1.94 for voltages of 15.2 V and 20.1 V, respectively). The thermal performances tested in this work may vary with respect to other environments depending on the degree of humidity of the environment, which influences the heat of the air flow that enters the system and passes to the newborn’s abitaculum. The validation process is carried out by comparing the simulated and experimental values of the electrical current, the temperature difference between the ends of the modules, the temperature difference between the interior air and the room environment, and the performance coefficient, obtaining satisfactory results. Furthermore, the model of thermal resistances and capacities developed allows flexibility to adapt it to any type of incubator, sizing the number of Peltier modules, as well as the heat exchangers, obtaining behaviour curves before its construction. It is therefore a very useful tool for incubator manufacturers. Other benefits to be highlighted are, on the one hand, the precise control of the temperature of each system point (inner air, mattress and inner chamber), and on the other hand, the reduction of vibrations inside the incubator, improving the quality of life of the newborn baby.

Author Contributions

Conceptualization, A.R.C. and M.L.-D.; methodology, A.R.C.; software, M.L.-D.; validation, M.L.-D., A.R.C. and F.F.Z.; formal analysis, A.R.C.; investigation, A.R.C.; writing—original draft preparation, A.R.C.; writing—review and editing, R.H.M.; visualization, F.F.Z.; supervision, A.R.C. and R.H.M.; project administration, R.H.M.; funding acquisition, R.H.M. All authors have read and agreed to the published version of the manuscript.

Funding

This work was funded by University of Cádiz.

Data Availability Statement

Not applicable.

Conflicts of Interest

The authors declare that they have no conflict of interest.

Nomenclature

Symbols
A surface area, (m 2 )
C thermal capacity, (J/K)
COP coefficient of performance
c specific heat, (J/kg K)
E electric voltage, (V)
h heat transfer coefficient , (W/m 2 K)
I current intensity, (A)
k thermal conductivity, (W/mK)
L length, (m)
M number of thermoelectric modules
m ˙  mass flow rate, (kg/s)
N number of pairs per module
P power, (W)
Q ˙  heat flow, (W)
q heat flux density, (W/m 2 )
R thermal resistance, (K/W)
T temperature, (K)
t time, (s)
Superscripts
J Joule effect
P Peltier effect
Subscripts
air inner air
amb room ambient
C cold ends of the modules
ca chamber air
cool cooling mode
ex heat exchanger
fan fans over the heat exchangers
H hot ends of the modules
in input air flow
ins chamber neonatal
l thermoelectric leg
surf neaonatal bed interface
Elect Electric
Term Termic
Greek Letters
α  Seebeck coefficient, (V/K)
Δ  model deviation, (%)
ρ  density, (kg/m 3 )
σ  electrical resistivity, ( Ω m)

References

  1. Pereira, C.B.; Heimann, K.; Czaplik, M.; Blazek, V.; Venema, B.; Leonhardt, S. Thermoregulation in premature infants: A mathematical model. J. Therm. Biol. 2016, 62, 159–169. [Google Scholar] [CrossRef] [PubMed]
  2. Aschoff, J.; Wever, R. Kern und Schale im Wärmehaushalt des Menschen. Die Naturwissenschaften 1958, 45, 477–485. [Google Scholar] [CrossRef]
  3. Burton, A.C. The Application of the Theory of Heat Flow to the Study of Energy Metabolism: Five Figures. J. Nutr. 1934, 7, 497–533. Available online: http://xxx.lanl.gov/abs/https://academic.oup.com/jn/article-pdf/7/5/497/23606632/jn0070050497.pdf (accessed on 20 June 2021). [CrossRef]
  4. Hammarlund, K.; Nilsson, G.E.; Öberg, P.A.; Sedin, G. Transepidermal Water Loss in Newborn Infants I. Relation to Ambient Humidity and Site of Measurement and Estimation of Total Transepidermal Water Loss. Acta Paediatr. 1977, 66, 553–562. Available online: http://xxx.lanl.gov/abs/https://onlinelibrary.wiley.com/doi/pdf/10.1111/j.1651-2227.1977.tb07946.x (accessed on 20 June 2021). [CrossRef] [PubMed]
  5. Rojas, R.; Bell, E.; Dove, E. A mathematical model of premature baby thermoregulation and infant incubator dynamics. WIT Trans. Biomed. Health 1970, 3, 16. [Google Scholar] [CrossRef]
  6. Simbruner, G. Thermodynamic Models for Diagnostic Purposes in the Newborn and Fetus; Facultas-Verlag: Wien, Austria, 1983. [Google Scholar]
  7. Ying, B.; Kwok, Y.; Li, Y.; Yeung, C.; Li, F.; Li, S. Mathematical modeling of thermal physiological responses of clothed infants. J. Therm. Biol. 2004, 29, 559–565. [Google Scholar] [CrossRef]
  8. Lyon, A.; Oxley, C. HeatBalance, a computer program to determine optimum incubator air temperature and humidity. A comparison against nurse settings for infants less than 29 weeks gestation. Early Hum. Dev. 2001, 62, 33–41. [Google Scholar] [CrossRef]
  9. Poole, D.R.; Segars, A.J. Incubator with Thermoelectric Cooler. U.S. Patent No. 09/250,454, 2001. [Google Scholar]
  10. Zermani, M.; Feki, E.; Mami, A. Building simulation model of infant-incubator system with decoupling predictive controller. IRBM 2014, 35, 189–201. [Google Scholar] [CrossRef]
  11. Fraguela, A.; Matlalcuatzi, F.D.; Ramos, Á.M. Mathematical modelling of thermoregulation processes for premature infants in closed convectively heated incubators. Comput. Biol. Med. 2015, 57, 159–172. [Google Scholar] [CrossRef] [PubMed]
  12. Kapen, P.T.; Mohamadou, Y.; Momo, F.; Jauspin, D.K.; Anero, G. An energy efficient neonatal incubator: Mathematical modeling and prototyping. Health Technol. 2019, 9, 57–63. [Google Scholar] [CrossRef]
  13. Rincón-Casado, A.; Martinez, A.; Araiz, M.; Pavón-Domínguez, P.; Astrain, D. An experimental and computational approach to thermoelectric-based conditioned mattresses. Appl. Therm. Eng. 2018, 135, 472–482. [Google Scholar] [CrossRef]
  14. Martinez, A.; Astrain, D.; Rodriguez, A.; Aranguren, P. Advanced computational model for Peltier effect based refrigerators. Appl. Therm. Eng. 2016, 95, 339–347. [Google Scholar] [CrossRef]
  15. Yeler, O.; Koseoglu, M.F. Performance prediction modeling of a premature baby incubator having modular thermoelectric heat pump system. Appl. Therm. Eng. 2021, 182, 116036. [Google Scholar] [CrossRef]
  16. ANSYS. ANSYS Fluent—CFD Software; ANSYS: Canonsburg, PA, USA, 2019. [Google Scholar]
  17. PCE Ibérica S.L. Available online: https://www.pce-iberica.es/ (accessed on 30 September 2020).
  18. Luo, Y.; Zhang, L.; Liu, Z.; Wang, Y.; Wu, J.; Wang, X. Dynamic heat transfer modeling and parametric study of thermoelectric radiant cooling and heating panel system. Energy Convers. Manag. 2016, 124, 504–516. [Google Scholar] [CrossRef]
  19. Enescu, D.; Virjoghe, E.O. A review on thermoelectric cooling parameters and performance. Renew. Sustain. Energy Rev. 2014, 38, 903–916. [Google Scholar] [CrossRef]
  20. Rowe, D.M. Thermoelectrics Handbook: Macro to Nano; CRC Press: Boca Raton, FL, USA, 2018. [Google Scholar]
  21. Bergman, T.L.; Incropera, F.P.; Lavine, A.S.; Dewitt, D.P. Introduction to Heat Transfer; John Wiley & Sons: Hoboken, NJ, USA, 2011. [Google Scholar]
Figure 1. Neonatal incubator with resistance heat device.
Energies 14 05278 g001
Figure 2. CFD neonatal incubator temperature distribution.
Energies 14 05278 g002
Figure 3. Neonatal incubator with thermoelectric conditioning device.
Energies 14 05278 g003
Figure 4. Thermoelectric-driven conditioned incubator.
Energies 14 05278 g004
Figure 5. Computational model.
Energies 14 05278 g005
Figure 6. Comparison of temperatures between the thermal resistance system with the computational model in three stages.
Energies 14 05278 g006
Table 1. Technical characteristics of the Ohio Care Plus 3000 incubator model.
PartDimensionsParameterValue
Incubator dome760 × 480 × 500 mm 3 Intensity3 A
Windows170 × 130 mm 2 Voltage230 V
Mattress500 × 400 × 50 mm 3 Frecuency50 Hz
Inlet70 × 50 mm 2 Temperature30–39  C
Outlet70 × 50 mm 2 Humidity15–70%
Table 2. Resolution and accuracy of the measuring sensors.
SensorResolutionAccuracy
Temperature (Type K)0.1  C 0.5 ± 2 % C
Air velocity0.01 m/s ± 0.01 ± 3 % m/s
Voltage0.1 V±0.1 V
Electric current0.1 A ± 0.02 A
Table 3. Input model parameters for Marlow RC12-6L thermoelectric module.
ParameterValue
N127
A l 1.4 × 1.4 mm 2
L l 1.5 mm
ρ l 7530 kg/mm 3
c l 544 J/kgK
α 10 6 ( 0.002025 T 2 + 1.423448 T 44.953611 ) V/K
k 1 0.000029 T 2 0.019593 T + 4.809677 W/mK
σ 1 10 6 ( 0.043542 T 2.754139 ) Ω m
A c 40 × 40 mm 2
L c 0.8 mm
ρ C 3570 kg/m 3
C c 837 J/kgK
k c 35.3 W/mK
Table 4. Experimental calculation of the thermal resistances for hot and cold hexchengers.
EI T H T C T H T ca T C T amb R Hex R Cex
(V)(A)( C)( C)( C)(K/W)(K/W)
15.101.713.790.890.740.0100.005
20.102.146.991.631.300.0200.007
25.003.0610.082.582.010.0300.006
Mean0.0200.006
Table 5. Experimental calculation of the thermal resistances of the incubator model.
EI T H T C T ca T surf T ins T surf T ins Tamb R ca surf R ins surf R ins amb
(V)(A)( C)( C)( C)( C)(K/W)(K/W)(K/W)
15.101.713.791.450.853.040.0180.0110.043
20.102.146.992.661.575.580.0340.0200.072
25.003.0610.084.192.478.790.0550.0320.116
Mean0.0360.0210.077
Table 6. Experimental and simulated results of the neonatal incubator.
E (V) P Fan (W)ParametersExperimentB Δ (%)
15.205.5I (A)1.721.710.6
T H T C  ( C)3.83.790.3
T i n s T a m b  ( C)3.033.04−0.3
COP H e a t 1.721.73−0.6
20.102.5I (A)2.132.14−0.4
T H T C  ( C)7.006.990.1
T i n s T a m b  ( C)5.595.580.1
COP H e a t 1.941.930.5
25.040.5I (A)3.083.060.6
T H T C  ( C)10.110.080.2
T i n s T a m b  ( C)8.818.790.2
COP H e a t 0.720.711.4
Table 7. Estimated errors between simulation and experimentation.
Time (min)VariableError Mean ( C)Standard Desviation ( C)Error Mean (%)Standard Desviation (%)
0–15 T H 0.340.940.962.20
T c a 0.411.151.373.19
T i n s 0.891.043.253.86
T s u r f 1.441.314.554.32
T a m b 0.360.111.490.47
15–40 T H −0.820.47−1.510.87
T c a −0.670.46−1.531.06
T i n s −0.690.24−2.080.72
T s u r f −0.040.53−0.111.36
T a m b 0.450.211.790.83
40–55 T H −1.031.04−2.682.67
T c a −1.310.86−3.872.74
T i n s −0.390.31−1.351.14
T s u r f −0.270.82−0.972.62
T a m b 0.480.231.940.92
Publisher’s Note: MDPI stays neutral with regard to jurisdictional claims in published maps and institutional affiliations.

