Abstract
The brick industry is currently facing a shortage of natural resources. Despite this, the demand for construction bricks is progressively increasing. Alternative materials, such as dredged sediments and solid organic waste, have been recently proposed as options to replace natural clay in brick manufacturing. Potential exploitation of dredged sediments in clay bricks is evaluated in this study. The chemical composition of the mixtures and the opto-thermal properties of brick samples, which differed for the dredged sediment content (from 10% to 50% of the clay weight), were investigated. Chemical analyses detected lower concentrations of heavy metals in bricks incorporating dredged sediments (DS). Negligible variations in thermal conductivity, thermal diffusivity, and specific heat were observed by increasing the amount of DS in the mixture. In particular, the thermal conductivity values ranged between 0.45 ± 0.03 W m−1 K−1 (DS-50) and 0.50 ± 0.03 W m−1 K−1 (DS-30). Conversely, the color shift value and spectral reflectance in the infrared field were found directly proportional to the concentration of DS. Using dredged sediments as building material demonstrated to be a solution to the problem of their disposal and the scarcity of raw materials, reducing the global warming score by up to 2.8%.
1. Introduction
Bricks have been utilized as principal building materials for centuries. Presently, the brick industry produces up to 1500 billion bricks per year worldwide, and the production is expected to rise, considering that almost 90% of bricks (around 1300 billion bricks) are required from developing countries, which are experiencing an acceleration in urbanization at an average rate of 6% per year [1]. Such a large use of clay bricks in construction industries is causing a scarcity of natural clay reserves. Furthermore, brick production processes are energy intensive (2.0 kWh per brick) and produce large volumes of waste and greenhouse gases (0.41 kgCO2-eq per brick) [2].
Within this framework, many countries have started limiting the production of bricks and are looking for different building blocks [3]. A wide variety of alternative and by-product materials have been proposed to replace natural clay (NC) in manufacturing bricks with lesser environmental impacts than conventional bricks. Numerous research studies investigated the potential for using various recycled materials, such as construction and demolition waste (i.e., brick dust, wood chips, lime, cement) [4,5], organic and inorganic solid waste (i.e., spent shea waste, waste tea, cigarette butts, gangue) [6,7,8], agricultural solid waste (i.e., rice husk, sugarcane bagasse, olive mill waste) [9,10], plastic waste (i.e., plastic bottles, straw, polypropylene fibers, crumb rubber) [11,12,13], and industrial waste (i.e., gold mill tailing, paper production residues) [14,15] to limit the utilization of NC. This approach aligns with sustainable development and is efficient at protecting the environment [16,17].
Raw materials, manufacturing processes, and firing temperature are the main parameters that control the properties of clay bricks. Thus, implementing brick mixtures that are enhanced with unconventional materials can alter the characteristics of the manufactured bricks. In particular, partially substituting NC with organic substances generally allows reducing the thermal conductivity of bricks [18]. In fact, the added organic matter is combusted during firing, leaving voids that contribute to lower bulk density and thermal conductivity, while increasing porosity [19]. Moreover, greater water absorption capacity is usually observed in low-weight bricks, such as the ones in which degraded municipal solid waste [20] or cigarette butts [8] are incorporated. However, higher porosity and lower density might result in deeper cracks and worsened mechanical properties as observed in brick specimens enhanced with glass waste powder [21], fly ashes [22], and olive mill waste [23].
In this paper, different dosages of dredged sediments (DS) in brick mixtures were investigated with the aim of partially substituting NC in the brick productive process. A comparative study was carried out by contrasting bricks made of DS and ordinary bricks realized in accordance with the Italian Standard UNI 8942:1986. Effects of the percentage of DS incorporated in the brick mixtures on mineral composition, mass variation, and moisture content were analyzed. This permitted detecting the presence of heavy metals, which represents a critical issue when it comes to the reuse of waste or residues, such as DS. Furthermore, the optical and thermal properties of the final bricks were assessed to investigate the thermal conductivity, thermal diffusivity, volumetric specific heat, color pattern, and spectral reflectance.
Considering that several studies already demonstrated worsening in the mechanical properties of bricks, due to the addition of sediments [24,25], the investigated bricks are expected to be applied to building façades as cladding instead of being exploited as load-bearing elements. Therefore, this study focused on the analysis of the opto-thermal properties of bricks, as well as on the assessment of the environmental impact of the final product.
The main research domains covered by this work concern:
- The suitability of DS to replace NC in brick manufacturing;
- Assessing the opto-thermal properties of brick specimens enhanced with DS against conventional clay bricks;
- The effectiveness of DS addition in reducing the environmental footprint of clay bricks.
The paper is structured as follows. The Background section outlines the state-of-the-art on clay bricks enhanced with dredged sediments (Section 2). Materials and Methods (Section 3) is articulated around five sections, describing the raw materials (Section 3.1), brick manufacturing (Section 3.2), and the performed analyses (Section 3.3, Section 3.4 and Section 3.5). Results and Discussion (Section 4), present the outcomes referring to the characterization of raw materials (Section 4.1) and brick mixtures (Section 4.2), before the opto-thermal properties of brick specimens are evaluated (Section 4.3) and the life-cycle assessment is reported (Section 4.4). Finally, Conclusions and Future Developments (Section 5) summarizes the results and the implications of this work.
2. Background
In recent years, there has been a considerable worsening in the conditions of natural areas. Specifically, increasing touristic flows, and the drastic reduction of national and local organizations (i.e., National Forest Guard Corps, Mountain Communities) that are responsible for the maintenance of forests and riverbeds have contributed to this scenario. Additionally, the increasing frequencies of extreme events due to ongoing climate change, such as floods and landslides, have negatively affected the economies and societies of vulnerable areas. Within this framework, the GEST-RIVER (Eco-Sustainable Management of Territories at Risk of Flooding and Economic Valorization of Resources) project aims to assess standards and regulations on floods, hydrogeological maintenance, and land management. The core of this project consists of the evaluation of socioeconomic and environmental impacts of hydrogeological instability of a territory to identify best practices and guidelines for policymakers. In particular, a work package specifically focuses on the recovery of biomass residue from maintenance activities, such as DS.
These consist of natural deposits at the bottom of seas, rivers, and lakes. Such a fine soil is collected from the public waterways during deepening, broadening, and maintaining activities. A significant amount of DS is generated yearly, which is usually polluted by heavy metals, organic contaminants, and organic matter [26,27]. Consequently, the DS needs to be adequately handled and disposed of in order to prevent land waste and environmental pollution. Thus, the reuse of DS is a priority, and its exploitation as building material, particularly in brick production, may be an ideal solution to the problem.
The feasibility of using DS in brick manufacturing has already been discussed in numerous research studies. Mesrar et al. [24] investigated the potential use of untreated DS from land deposits of the Seine estuary for the production of fired bricks. The raw material was found to be environmentally sustainable, with low levels of metal traces and adequate mechanical resistance. Haurine et al. [25] demonstrated that mixtures incorporating DS were characterized by linear drying and firing shrinkage, water absorption, and tensile rupture properties that matched the usual values of the heavy clay industry. Permeable bricks of wrap-shell aggregates from DS were prepared in [28]. The effects of process parameters on the compressive strength and water permeability coefficient were studied. Slimanou et al. [29] considered using harbor DS in designing new types of bricks to stabilize the behavior of heavy metals by its solidification in the glassy matrix of the bricks (during the firing) and to recycle waste from the dredged activities (with reduced disposal issues).
3. Materials and Methods
3.1. Raw Materials
NC and DS were utilized in this work for soft-paste brick production. The NC was extracted from the quarries located in Bevagna (Italy), and are currently exploited by the Fornaci Briziarelli Marsciano in their productive chain. On the other hand, the DS were collected from the terrains surrounding the water stream in Graffignano (Italy), which flows towards the Tiber River. These consist of waste from the cleaning activities of the riverbed, which are generally needed during periods characterized by intense precipitation events, when the stream floods. The DS were filtered with a sieve in order to reduce the content of gravels, plastic waste elements, and organic particles. It is worthy to highlight that DS were collected during a single dredging campaign. Thus, some changes might be observed in their properties and their compositions due to the fact that they are seasonal deposits.
3.2. Brick Production and Heating Procedure
The weight compositions of NC, DS, and water used in the production of soft-paste bricks are reported in Table 1. Water content was varied with DS due to the higher moisture content observed in DS, when compared to the NC. Components were mixed for around 15 min and wet paste was deposited in parallelepiped molds of 250 mm length, 125 mm width, and 60 mm height (Figure 1). The brick size was defined in compliance to the specific National UNI standard. Then, molding pressure was executed at 5 MPa for 3 min until the mixed components completely filled the mold volume. After that, samples were cured at 288 K for 48 h, then dried for six weeks. In particular, the first step of the drying process consisted of a couple of weeks during which the bricks were slowly heated from the ambient temperature till the temperature value of the drying room (314 K). Then, the bricks were dried at 314 K for up to four weeks.

Table 1.
Composition of the soft-paste bricks (quantities are reported in percentage by weight, wt%).
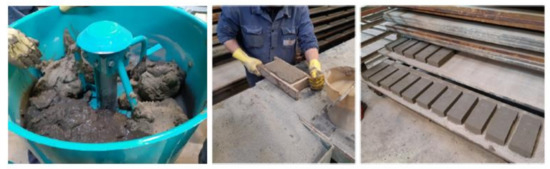
Figure 1.
Main steps of brick manufacturing, from the left, preparation of DS and NC mixture, molding, and curing phase.
A 100 m long furnace was exploited for the firing of the bricks. These were transported by carriages with a velocity of 5.6·10−4 m s−1, for 48 h. Moving throughout the furnace, the bricks passed through the three main stages of the heating process: the (i) pre-heating was conducted at 335 K for 16 h; the (ii) sintering stage at 1120 K for 16 h; and (iii) the gradual cooling until ambient temperature value (288 K) for 16 h. The last step, in particular, is fundamental to avoid the generation of cracks in the produced bricks.
3.3. Chemical Characterization
Static thermogravimetric analysis was performed with the Leco TGA701 (LECO Corporation, St. Joseph, Michigan) apparatus in triplicate, in compliance with the ASTM D 5142 protocol [30]. The moisture content, the volatile matter, the amount of ashes, and the quantity of fixed carbon were determined for each sample and expressed as percentages. In particular, the amounts referring to volatile matter, ashes, and fixed carbon were also reported for dry specimens. Only the fixed carbon was not directly measured, but calculated as the difference between the total weight of the sample and the weight of the other components (moisture content, volatile matter, and ashes).
Mass change with the temperature of the tested specimens were determined by thermogravimetric analysis. Tests were performed using the same Leco TGA701 apparatus with a heating rate of 20 K min−1 in air atmosphere, from an ambient temperature of 298 K to 1273 K. Analyses were executed in triplicate and the standard deviation among the results was used to define the error associated to the mean value.
The qualitative and quantitative analyses of metals contained in the samples were conducted via the PerkinElmer Inductively Coupled Plasma–Optical Emission Spectrometer (ICP-OES) Optima 800 instrument (PerkinElmer, Waltham, Massachusetts). From a heavy metals point of view—there is still no European legislation or recommendation that imposes a test or limits on the content or leaching of heavy metals in building materials. However, there are several national legislations, although they use different tests with different solid-to-liquid ratios, pH, sample types (granular or monolith), or exposure times. In this study, the limit values defined by the Italian DL 155/06 (Col. A) were considered when it came to the analysis of raw materials.
3.4. Opto-Thermal Characterization
The thermal characterization of brick samples was performed through a Hot Disk TPS 2500S apparatus (Hot Disk AB, Gothenburg, Sweden) and an ATT DM 340SR climatic chamber (Angelantoni Test Technologies, Massa Martana, Italy) (Figure 2) [31]. In particular, the climatic chamber permitted conducting the thermal characterization within a controlled environment whose ambient temperature and relative humidity were kept constant at 293 K and 50%, respectively.
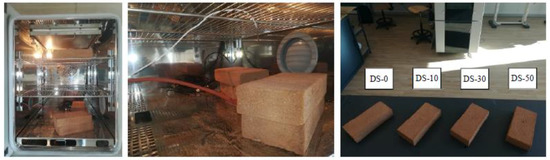
Figure 2.
From the left, the climatic chamber apparatus, a detailed view of the hot disk measuring sensor, and an overview of the four brick specimens that were assessed.
Thermal conductivity, thermal diffusivity, and volumetric specific heat were determined for the brick specimens by applying the Transient Plane Source (TPS) method, which is described in the ISO 22007-2:2008 standard. The TPS double spiral behaves as both a heat source and a dynamic temperature sensor. It was placed between two brick samples of the same type (same content of DS), and then electrically heated, due to the Joule’s effect. The heater supplied a specific heating power P0 for a time step t. Following this, thermal conductivity and thermal diffusivity of the bulk material were identified through the resistance of the sensor, while the volumetric specific heat was calculated through Equation (1):
where λ is the thermal conductivity (W m−1 K−1), α is the thermal diffusivity (m2 s−1), ρ is the density (kg m−3), and cp is the specific heat of the sample (J K−1 kg−1). Analyses were reiterated five times and executed in triplicate in order to define the error associated with the measured quantities for each brick typology. The standard deviation (σ) among the five reiterated measurements (N = 5) was calculated for the j-th brick sample as:
λ = α·ρ·cp
Following this, the error associated with the mean value of the five reiteration outcomes (Ej) was calculated by considering the nominal error (e) due to the measuring apparatus.
The nominal error was considered as high as 3% for thermal conductivity, 5% for thermal diffusivity, and 7% for specific heat, according to [32]. Finally, the error (E) referred to the mean value of the outcomes of the three brick samples (M = 3), and was calculated as follows for each of the DS-0, DS-10, DS-30, and DS-50 specimens:
The optical characterization of the clay bricks enhanced with DS was carried out by investigating the spectral reflectance and color shift parameters.
Firstly, the color patterns of the four brick samples were measured using a CR-200 Chroma Meter (Konica Minolta, Tokyo, Japan), setting illuminant D65. The estimated device-independent CIE xyY coordinates were initially converted into XYZ coordinates, according to the following system of linear equations; Equation (5):
The XYZ coordinates were then converted into RGB (device-dependent) and CIE Lab (device-independent) color coordinates to generate a virtual color patch and to define the color shift, due to the increment of the DS percentage in the brick mixtures. The two conversion processes were executed according to Equations (6) and (7) (easyrgb.com, accessed on 1 July 2021), respectively.
where Xref is equal to 94.8, Yref to 100.0, and Zref to 107.3 (corresponding to daylight condition).
Finally, the color shift (ΔC) was calculated as in [33]:
where LDS-x, aDS-x, and bDS-x are the CIE Lab coordinates for the brick sample with the x standing for the percentage of DS in the mixture (i.e., DS-10, DS-30, and DS-50); and LDS-0, aDS-0, and bDS-0 are the CIE Lab coordinates for the reference brick (DS-0).
The ΔC consists of the geometric distance between the point corresponding to the color of the reference case and the point from the other brick color, within the CIE Lab color space. As far as the CIE Lab color space is concerned, it is defined by the L-axis (relative to the lightness), the a-axis (relative to the green–red opponent colors), and the b-axis (relative to the blue–yellow opponent colors). The first varies between zero (black) and 100 (white), while the second and the third are unbounded.
Moreover, the spectral reflectance was assessed through the Solid Spec-3700 spectrophotometer, which was equipped with a 60 mm diameter integrated sphere, having a wavelength accuracy of 0.1 nm. According to the ASTM Standard E903-96, the measurement of the spectral near-normal reflectance focused on the wavelength interval, ranging between 250 and 2500 nm (with a step of 5 nm), while neglecting, mostly, the ultraviolet C spectrum (negligible thermal effects). The spectral reflectance was finally estimated according to the ASTM Standard G173-03. Discontinuities in the outcomes (drops) were observed due to the detectors changing at around the 750 and 1750 nm wavelengths. Analyses were reiterated twice and executed in triplicate. Finally, the mean spectral reflectance value was calculated for the ultraviolet (from 250 to 400 nm), the visible (from 400 to 750 nm), and the infrared spectrum (from 750 to 2500 nm), respectively. It is worth noting that the integrated sphere was characterized by a size, which may underestimate the radiation reflected diffusively by the sample. However, such a bias remained constant throughout the characterization campaign; thus, the results can be reliable as long as a comparative approach is followed.
3.5. Life-Cycle Assessment
A preliminary life-cycle assessment was performed to evaluate the impacts of NC content reduction on emissions due to brick manufacturing processes, according to standards ISO 14040 [34] and ISO 14044 [35]. The software SIMAPRO 9.1.1 (version 9.1.1., PRé Sustainability Amersfoort, The Netherlands) was used, while the ReCiPe 2016 Midpoint Hierarchy method was chosen for the impact assessment. Within this framework, up to 18 factors were assessed by excluding long-term emissions: global warming (GW), stratospheric ozone depletion (OD), ionizing radiation (IR), ozone formation human health (OFHH), fine particulate matter formation (PM), ozone formation, terrestrial ecosystems (OFTE), terrestrial acidification (TA), freshwater eutrophication (FEut), marine eutrophication (MEut), terrestrial ecotoxicity (TEcot), freshwater ecotoxicity (FEcot), marine ecotoxicity (MEcot), human carcinogenic toxicity (HCT), human non-carcinogenic toxicity (HN-CT), land use (LU), mineral resource scarcity (MRS), fossil resource scarcity (FRS), water consumption (W). Average data for existing suppliers were used in the attributional model for the inputs and outputs for the determining systems [36]. The functional unit was one kilogram of finished and packed clay brick. The system boundary was defined as cradle-to-gate and included clay pit operation, first grinding process, wet process (second grinding, mixing, and plastifying), storage in the factory, forming (extruding molding method), cutting, drying, firing, loading, packing with plastic, and storage on wood pallets. On the other hand, the dataset neglected charge of the wastewater and solid waste by assuming that the waste heat was totally reused for drying. The other three models were designed by substituting the clay content with dredged sediments according to the proportions described in Section 3.2. We should note that the dredged sediments enter the system as a burden-free input since they come from disposal materials. The goal and scope was to carry out a comparative analysis of the environmental impact of the four brick specimens, when produced at a laboratory scale.
4. Results and Discussion
4.1. Chemical Characterization of Raw Materials
Results from the static thermogravimetric analysis (Table 2) highlighted that almost 43.6% of the DS sample weight was due to moisture content, while it only accounted for 18.0% in NC. When the drying process of the samples concluded, the greatest percentage of ashes was observed in NC (86.2%). On the contrary, DS specimens showed a higher content of both dry volatile matter (16.6%) and dry fixed carbon (0.2%), when compared to NC.
Table 2.
Results from the static thermogravimetric analysis for the raw material samples.
Results from the analysis of the mass change are reported in Figure 3. Between ambient temperature and 623 K, a mass loss due to moisture evaporation was observed. It was equal to 44% in DS. Weight loss of around 4% took place between 623 and 1043 K due to the elimination of crystallization water. Further weight loss of around 5% was observed in the range 1043–1253 K. Fraction weight was almost constant above 1253 K. A total mass loss as high as 51% was noted during the thermal analysis.
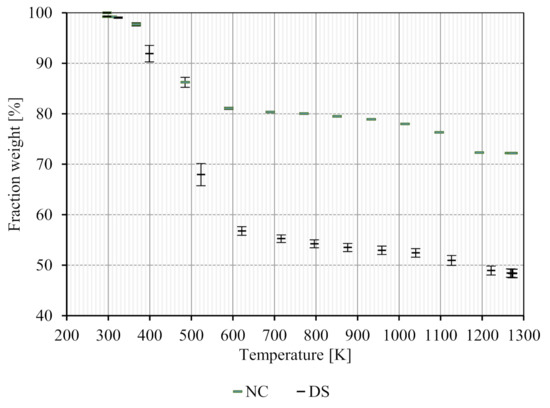
Figure 3.
Mass changes of the raw materials when heated with a heat rate of 20 K min−1 from ambient temperature till 1273 K, in air atmosphere.
When NC was heated from the ambient temperature to 590 K, the evaporation of physically-adsorbed and moisture water was produced (20% of mass loss). Within this temperature range, the dehydration of nontronite must be considered, since it generally happens between 333 and 473 K. Additionally, the combustion of organic compounds, which were consistent in dredged sediments, took place. In the range 590–850 K, the weight essentially remained constant. From 850 to 1190 K, a rate of 7% mass loss occurred, probably due to the dehydroxylation of muscovite and nontronite, as well as the combustion of some organic compounds found in the NC. There were no significant weight losses above 1190 K.
Table 3 shows the minor components of NC and DS. The DS present a considerable concentration of some heavy metals such as Co, Se, and V, if compared to the limit values defined by the DL 155/06 (Col. A). In particular, both Co (16.3 ppm) and V (79.3 ppm) turned out to be close to the respective thresholds (20 ppm for Co and 90 ppm for V), while the concentration of Se (10.3 ppm) was almost the triple of the limit (3 ppm). When compared to NC, DS showed higher concentrations of Cr, Ni and Zn. Conversely, NC was presenting greater concentrations of Cd, Pb, and Cu (Table 3).
Table 3.
Minor chemical components (in ppm) in row materials, and limit values for the concentration of heavy metals in the soil of both public and private green areas.
4.2. Chemical Characterization of the Bricks
Samples of the four mixtures utilized for the production of bricks were assessed with both static and non-static thermogravimetric analysis. In general, the content of moisture increased according to the percentage of dredged sediments in the mixture (Table 4), ranging from 24.1% (DS-10) to 29.5% (DS-50). In the dry specimens, almost the same amount of ashes was estimated (between 85.9% and 87.8%). Almost the same was observed for the volatile matter (ranging from 12.1% to 14.3%).
Table 4.
Results from the static thermogravimetric analysis for the different brick mixtures.
Outcomes from the mass change assessment are reported in Figure 4. Between ambient temperature and 673 K, a mass loss due to moisture was observed. It was equal to 25% in DS-10, 30% in DS-30, and 32% in DS-50. Weight loss of around 2% took place between 673 and 1073 K due to the elimination of water of crystallization, and the combustion of some organic compounds. Further weight loss of around 5% was observed in the range 1073–1253 K. Fraction weight was almost constant in all the specimens above the 1253 K. A total mass loss as high as 34%, 37%, and 40% was noted, respectively, in the DS-10, DS-30, and DS-50 mixtures during the thermal analysis.
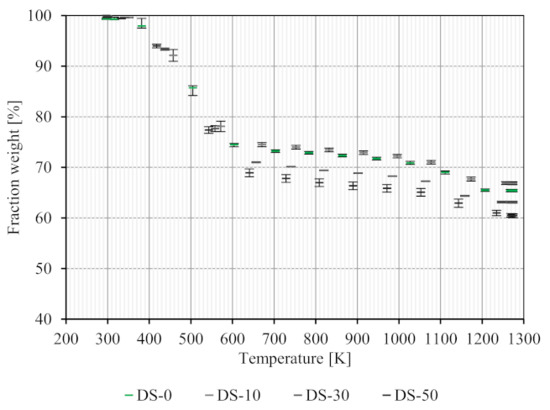
Figure 4.
Mass changes of the brick mixtures when heated with a heat rate of 20 K min−1 (from ambient temperature) to 1273 K, in air atmosphere.
In regard to DS-0, it is worth noting that such a brick mixture resulted from the combination of NC raw material and water. Thus, the mass changes observed in this sample were close to the ones of NC. When DS-0 was heated from the ambient temperature to 600 K, the evaporation of physically-adsorbed and moisture water caused a 25% of mass loss, mainly due the dehydration of nontronite. In the range 600–1027 K, a weight loss as high as 3% was observed. From 1027 to 1207 K, a rate of 6% mass loss occurred. As already noted for NC raw material, this variation can be addressed to the dehydroxylation of muscovite and nontronite as well as the combustion of organic compounds. Above the 1207 K, there were no significant weight losses.
Table 5 shows the minor components that were detected on the different mixtures of clay and dredged sediments. The DS-0 sample revealed a high concentration of heavy metals, such as As, Cr, Pb, and Se, when compared to the other specimens. In particular, the concentration of Cr (161.2 ppm) was 10 times the second-highest value (18.5 ppm), which was found in DS-30. We should note that both As and Se reached concentration levels, which were significantly greater than the rest samples. These were as high as 24.1 ppm (As) and 30.0 ppm (Se) in DS-0, while being under the detection limit in all other cases, except the Se in DS-10. In general, the lowest concentration value for each assessed heavy metal can be observed in the DS-10 sample, while the highest referred to the DS-0 mixture.
Table 5.
Minor chemical components (in ppm) in brick mixtures.
4.3. Opto-Thermal Properties
Figure 5 and Table 6 show the results of the thermal properties, which were estimated through the Hot Disk apparatus (Hot Disk AB, Gothenburg, Sweden).
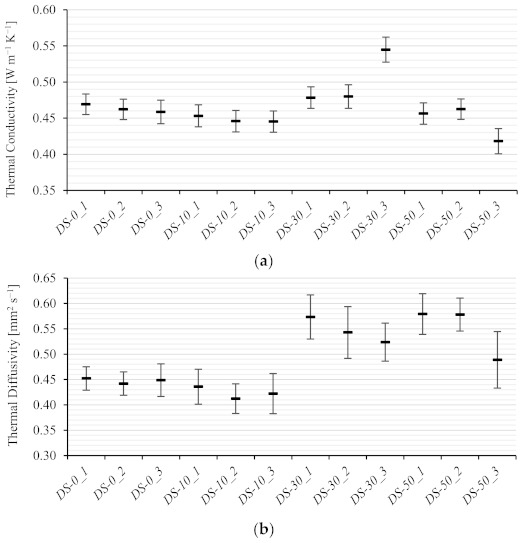
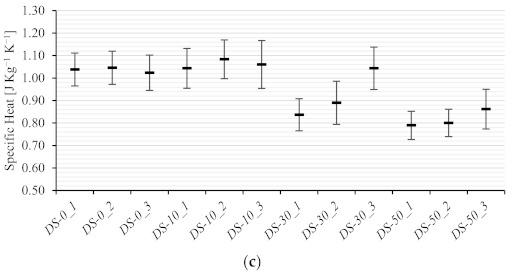
Figure 5.
Thermal conductivity (a), thermal diffusivity (b), and specific heat (c) estimated for brick specimens (three samples for each brick specimen) through the hot disk apparatus.
Table 6.
Overview of the thermal properties (with the corresponding errors) estimated for brick specimens (three samples for each brick specimen) through the hot disk apparatus.
Performing the test in triplicate permitted observation of the variations that existed among the estimated thermal properties for different samples of the same typology. Such variations, which are not significant, were more evident in those specimens characterized by higher exploitation of DS in their mixtures (DS-30 and DS-50). The reason might be found on the higher level of heterogeneity of DS raw material, when compared to the NC.
The estimated thermal conductivity was as high as 0.46 ± 0.03 W m−1 K−1 for DS-0, 0.45 ± 0.03 W m−1 K−1 for DS-10, 0.50 ± 0.03 W m−1 K−1 for DS-30, and 0.45 ± 0.03 W m−1 K−1 for DS-50. In general, the exploitation of DS seemed to have negligible effects on the resulting thermal conductivity value. The same can be observed for both thermal diffusivity and specific heat. In particular, the estimated thermal diffusivity was as high as 0.448 ± 0.046 mm2 s−1 for DS-0, 0.42 ± 0.06 mm2 s−1 for DS-10, 0.55 ± 0.08 mm2 s−1 for DS-30, and 0.55 ± 0.08 mm2 s−1 for DS-50. As far as the specific heat is concerned, it was quantified as equal to 1.04 ± 0.13 J Kg−1 K−1 for DS-0, to 1.06 ± 0.16 J Kg−1 K−1 for DS-10, to 0.92 ± 0.15 J Kg−1 K−1 for DS-30, and to 0.82 ± 0.12 J Kg−1 K−1 for DS-50.
Outcomes from the color assessments are reported in Table 7. Adding DS to the NC mixture barely caused a variation in the color pattern of the bricks. The color shifting from the reference case (DS-0) was estimated as high as 1.12, 3.09, and 5.88 for DS-10, DS-30, and DS-50, respectively. To better understand the magnitude of these color changes, it must be reported that a ΔC value lower than 1.50 is generally considered by most of the industries as the criterion for color approval when testing different samples of the products.
Table 7.
RGB and CIE Lab color space coordinates associated to the bricks’ color patterns, and color shift values from the reference case (DS-0).
Measured spectral reflectance values of the brick specimens are represented in Figure 6, together with the error associated to the nominal value. Table 8 shows, instead, the mean values calculated for each wavelength interval (ultraviolet, visible, infrared). In general, samples were capable of reflecting most of the infrared radiation, while absorbing a considerable amount of radiation within the visible range, as well as, almost, the totality of the ultraviolet radiation. In particular, the average spectral reflection values estimated in the ultraviolet spectrum ranged between 7.8% ± 0.6% (DS-0) and 5.6% ± 0.3% (DS-50). In the visible wavelength interval, the highest average spectral reflectance was observed in DS-30 (28.2% ± 1.0%), while the lowest value corresponded to DS-50 (26.1% ± 0.7%). Finally, the spectral reflectance amounts in the infrared range varied from 69.6% ± 2.5% (DS-0) to 74.3% ± 2.3% (DS-30).
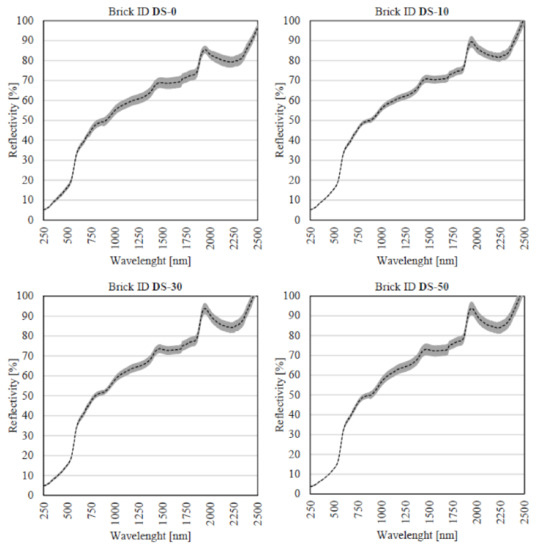
Figure 6.
Spectral reflectance measured for the four brick specimens.
Table 8.
Mean spectral reflectance calculated for each wavelength interval, for each brick specimen.
The comparison of the nominal values of the reflectance, which were estimated for the brick samples, are visualized in Figure 7. The trends, in regard to the brick reflectivity, were similar, so that the four lines appeared almost parallel. DS-0 and DS-10 bricks exhibited the highest reflectivity in the ultraviolet. Nonetheless, an inversion in this ranking was observed in the visible field when the four amounts were closer. When it came to wavelengths longer than 750 nm—the DS-30 and DS-50 showed the highest solar reflectivity.
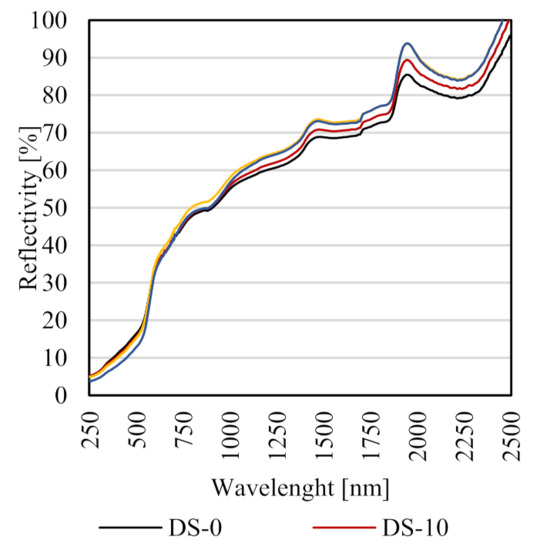
Figure 7.
Visual inter-brick comparison of the nominal values of spectral reflectance.
4.4. Life-Cycle Assessment
The results concerning normalized impact categories from the LCA analyses are presented in Table 9. Percentage variation from DS-0, in terms of GW score, ranged between −0.6% (DS-10) and −2.8% (DS-50). The greatest variations corresponded to MRS (−49.6% for DS-50), HN-CT (−29.1% for DS-50), and TEcot (−36.7% for DS-50) due to the preservation of raw clay. In particular, the ecotoxicity-related categories (i.e., TEcot, FEcot, MEcot, HCT, and HN-CT) showed most impact reductions once the clay was substituted by dredge sediments.
Table 9.
Normalized impact categories.
Sensitivity analysis was performed modifying the energy mix from “Market group for electricity, medium voltage in Europe, Cut-off, U” to “Market for electricity, medium voltage, Italy, Cut-off, U” to evaluate how local energy use could vary the results. Applying the local Italian energy mix had the best impact on the ionizing radiation and freshwater eutrophication scores. The stratospheric ozone depletion score increased to approximately 12% of the previous result with the European average mix (Figure 8).
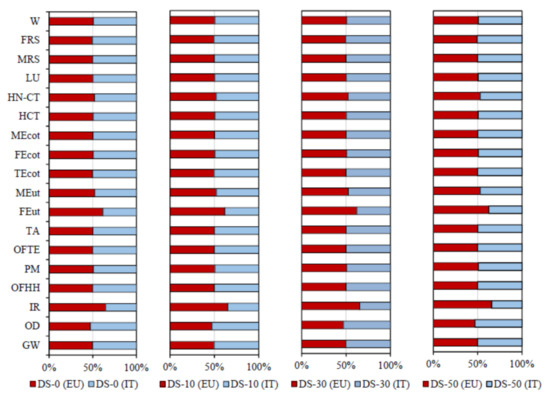
Figure 8.
Characterization factors (reported as percentage) for European and Italian energy mix.
5. Conclusions and Future Developments
The present study deals with natural clay replacement in brick manufacturing through the use of dredged sediments. Three different brick specimens were produced by varying the dredged sediment content in the mixture from 10% to 30%, and to 50%. A comparative analysis of their opto-thermal properties was performed against a conventional clay brick (reference case).
The main findings were that:
- DS-10 was the sample with the lowest concentration of heavy metals, the highest corresponded to the DS-0;
- Thermal conductivity of the four specimens varied between 0.45 ± 0.03 W m−1 K−1 (DS-50) and 0.50 ± 0.03 W m−1 K−1 (DS-30);
- Color shift value was directly proportional to DS’ content, the highest value (5.88) was calculated for DS-50;
- An increment of, approximately, 5% in spectral reflectivity could be achieved in the infrared range by substituting half of the NC in bricks with DS;
- GW score reduction ranged between 0.6% (DS-10) and 2.8% (DS-50), while the greatest impact reductions were observed in ecotoxicity-related categories.
Chemical characterization highlighted that lower concentration levels of heavy metals could be achieved by partially substituting DS to NC in the brick mixture. Conversely, thermal conductivity, thermal diffusivity, and specific heat barely varied from the reference case when DS were incorporated. As far as the optical analysis is concerned—a color shift parameter lower than six was calculated for each specimen. Thus, negligible variations in the color pattern were detected by the chromometer apparatus. Similarly, the reflectivity in the visible wavelength interval was almost unaltered, while it turned out to be enhanced in the infrared range.
In conclusion, the present study demonstrated that color, thermal properties, and heavy metal content of bricks made of DS are similar to ordinary bricks, and that opto-thermal properties are slightly affected by the DS-to-NC ratio of the brick mixtures. On the contrary, the environmental impact turned out to be reduced for bricks incorporating DS.
In regard to future developments—the mechanical and acoustic properties of clay bricks enhanced with dredged sediments can be investigated, and both their porosity and permeability to water might be assessed. Furthermore, other alternative materials or by-products could be added to the mixtures, together with the sediments, to further improve the thermal insulation of bricks.
Author Contributions
Conceptualization, F.C., A.N. and M.M.; methodology, M.M. and A.P.; software, M.M., F.F.d.A.L. and T.G.; formal analysis, M.M., F.F.d.A.L. and T.G.; investigation, M.M and A.P.; resources, M.M. and A.P.; data curation, M.M. and F.F.d.A.L.; writing—original draft preparation, M.M., F.F.d.A.L. and T.G.; writing—review and editing, A.P., F.C. and A.N.; visualization, M.M.; supervision, F.C. All authors have read and agreed to the published version of the manuscript.
Funding
This work was supported by the Italian Ministry for Ecological Transition through the project “GEST-RIVER Gestione ecosostenibile dei territori a rischio inondazione e valorizzazione economica delle risorse” (Italian Law 5/1/2017, 4).
Institutional Review Board Statement
Not applicable.
Informed Consent Statement
Not applicable.
Data Availability Statement
Not applicable.
Acknowledgments
The authors acknowledge Claudia Fabiani for her support in the thermal analysis and Costanza Vittoria Fiorini and Francesca Merli for contributing to the optical analysis. Finally, Mattia Manni thanks Chiara Biscarini for her supervision in the GEST-RIVER project framework.
Conflicts of Interest
The authors declare no conflict of interest.
Abbreviations
| Acronyms | |
| NC | Natural clay |
| DS | Dredged sediments |
| DS-0 | Traditional brick |
| DS-10 | Brick samples with a 10% content of DS |
| DS-30 | Brick samples with a 30% content of DS |
| DS-50 | Brick samples with a 50% content of DS |
| TPS | Transient plane source |
| GW | Global warming |
| OD | Stratospheric ozone depletion |
| IR | Ionizing radiation |
| OFHH | Ozone formation, Human health |
| PM | Fine particulate matter formation |
| OFTE | Ozone formation, Terrestrial ecosystems |
| TA | Terrestrial acidification |
| FEut | Freshwater eutrophication |
| MEut | Marine eutrophication |
| TEcot | Terrestrial ecotoxicity |
| FEcot | Freshwater ecotoxicity |
| MEcot | Marine ecotoxicity |
| HCT | Human carcinogenic toxicity |
| HN-CT | Human non-carcinogenic toxicity |
| LU | Land use |
| MRS | Mineral resource scarcity |
| FRS | Fossil resource scarcity |
| W | Water consumption |
| Nomenclature | |
| P0 | Specific heating power of Hot Disk |
| t | Heating time step of Hot Disk |
| λ | Thermal conductivity |
| α | Thermal diffusivity |
| ρ | Density |
| cp | Specific heat |
| σ | Standard deviation |
| E | Error |
| ΔC | Color shift |
References
- Aneke, F.I.; Shabangu, C. Green-efficient masonry bricks produced from scrap plastic waste and foundry sand. Case Stud. Constr. Mater. 2021, 14, e00515. [Google Scholar] [CrossRef]
- Zhang, L. Production of bricks from waste materials—A review. Constr. Build. Mater. 2013, 47, 643–655. [Google Scholar] [CrossRef]
- Chen, Y.; Zhang, Y.; Chen, T.; Zhao, Y.; Bao, S. Preparation of eco-friendly construction bricks from hematite tailings. Constr. Build. Mater. 2011, 25, 2107–2111. [Google Scholar] [CrossRef]
- Oti, J.E.; Kinuthia, J.M.; Robinson, R.B. The development of unfired clay building material using Brick Dust Waste and Mercia mudstone clay. Appl. Clay Sci. 2014, 102, 148–154. [Google Scholar] [CrossRef]
- Madrid, M.; Orbe, A.; Rojí, E.; Cuadrado, J. The effects of by-products incorporated in low-strength concrete for concrete masonry units. Constr. Build. Mater. 2017, 153, 117–128. [Google Scholar] [CrossRef]
- Adazabra, A.N.; Viruthagiri, G.; Kannan, P. Influence of spent shea waste addition on the technological properties of fired clay bricks. J. Build. Eng. 2017, 11, 166–177. [Google Scholar] [CrossRef]
- Zhu, M.; Wang, H.; Liu, L.; Ji, R.; Wang, X. Preparation and characterization of permeable bricks from gangue and tailings. Constr. Build. Mater. 2017, 148, 484–491. [Google Scholar] [CrossRef]
- Mohajerani, A.; Kadir, A.A.; Larobina, L. A practical proposal for solving the world’s cigarette butt problem: Recycling in fired clay bricks. Waste Manag. 2016, 52, 228–244. [Google Scholar] [CrossRef]
- Kazmi, S.M.S.; Munir, M.J.; Patnaikuni, I.; Wu, Y.-F.; Fawad, U. Thermal performance enhancement of eco-friendly bricks incorporating agro-wastes. Energy Build. 2018, 158, 1117–1129. [Google Scholar] [CrossRef]
- Vatani Oskouei, A.; Afzali, M.; Madadipour, M. Experimental investigation on mud bricks reinforced with natural additives under compressive and tensile tests. Constr. Build. Mater. 2017, 142, 137–147. [Google Scholar] [CrossRef]
- Donkor, P.; Obonyo, E. Compressed soil blocks: Influence of fibers on flexural properties and failure mechanism. Constr. Build. Mater. 2016, 121, 25–33. [Google Scholar] [CrossRef]
- Safinia, S.; Alkalbani, A. Use of Recycled Plastic Water Bottles in Concrete Blocks. Procedia Eng. 2016, 164, 214–221. [Google Scholar] [CrossRef]
- Mohammed, B.S.; Awang, A.B.; Wong, S.S.; Nhavene, C.P. Properties of nano silica modified rubbercrete. J. Clean. Prod. 2016, 119, 66–75. [Google Scholar] [CrossRef]
- Sutcu, M.; Akkurt, S. The use of recycled paper processing residues in making porous brick with reduced thermal conductivity. Ceram. Int. 2009, 35, 2625–2631. [Google Scholar] [CrossRef] [Green Version]
- Roy, S.; Adhikari, G.R.; Gupta, R.N. Use of gold mill tailings in making bricks: A feasibility study. Waste Manag. Res. 2007, 25, 475–482. [Google Scholar] [CrossRef] [PubMed]
- Ghorbani, M.; Sabour, M.R. Global trends and characteristics of vermicompost research over the past 24 years. Environ. Sci. Pollut. Res. 2021, 28, 94–102. [Google Scholar] [CrossRef]
- Al-Fakih, A.; Mohammed, B.S.; Liew, M.S.; Nikbakht, E. Incorporation of waste materials in the manufacture of masonry bricks: An update review. J. Build. Eng. 2019, 21, 37–54. [Google Scholar] [CrossRef]
- Contreras, M.; Gázquez, M.J.; Romero, M.; Bolívar, J.P. Recycling of Industrial Wastes for Value-Added Applications in Clay-Based Ceramic Products: A Global Review (2015–19). In New Materials in Civil Engineering; Samui, P., Kim, D., Iyer, N.R., Chaudhary, S., Eds.; Butterworth-Heinemann: Oxford, UK, 2020; pp. 155–219. ISBN 978-0-12-818961-0. [Google Scholar]
- Aouba, L.; Coutand, M.; Perrin, B.; Lemercier, H. Predicting thermal performance of fired clay bricks lightened by adding organic matter: Improvement of brick geometry. J. Build. Phys. 2015, 38, 531–547. [Google Scholar] [CrossRef]
- Goel, G.; Kalamdhad, A.S. Degraded municipal solid waste as partial substitute for manufacturing fired bricks. Constr. Build. Mater. 2017, 155, 259–266. [Google Scholar] [CrossRef]
- Lingling, X.; Wei, G.; Tao, W.; Nanru, Y. Study on fired bricks with replacing clay by fly ash in high volume ratio. Constr. Build. Mater. 2005, 19, 243–247. [Google Scholar] [CrossRef]
- Abbas, S.; Saleem, M.A.; Kazmi, S.M.S.; Munir, M.J. Production of sustainable clay bricks using waste fly ash: Mechanical and durability properties. J. Build. Eng. 2017, 14, 7–14. [Google Scholar] [CrossRef]
- Sutcu, M.; Ozturk, S.; Yalamac, E.; Gencel, O. Effect of olive mill waste addition on the properties of porous fired clay bricks using Taguchi method. J. Environ. Manag. 2016, 181, 185–192. [Google Scholar] [CrossRef]
- Mesrar, L.; Benamar, A.; Duchemin, B.; Brasselet, S.; Bourdin, F.; Jabrane, R. Engineering properties of dredged sediments as a raw resource for fired bricks. Bull. Eng. Geol. Environ. 2021, 80, 2643–2658. [Google Scholar] [CrossRef]
- Haurine, F.; Cojan, I.; Bruneaux, M.-A. Development of an industrial mineralogical framework to evaluate mixtures from reservoir sediments for recovery by the heavy clay industry: Application of the Durance system (France). Appl. Clay Sci. 2016, 132–133, 508–517. [Google Scholar] [CrossRef]
- Yozzo, D.J.; Wilber, P.; Will, R.J. Beneficial use of dredged material for habitat creation, enhancement, and restoration in New York–New Jersey Harbor. J. Environ. Manag. 2004, 73, 39–52. [Google Scholar] [CrossRef] [PubMed]
- Jia, Y.; Yang, Q.; Huang, Y.; Wang, D.; Liu, X. Introduction to the thematic set of papers on: Marine engineering geology. Bull. Eng. Geol. Environ. 2018, 77, 893–895. [Google Scholar] [CrossRef]
- Yang, M.; Ju, C.; Xue, K.; Peng, Y.; Han, H.; Wan, Q.; Peng, X.; Wu, Y. Environmental-friendly non-sintered permeable bricks: Preparation from wrap-shell lightweight aggregates of dredged sediments and its performance. Constr. Build. Mater. 2021, 273, 121751. [Google Scholar] [CrossRef]
- Slimanou, H.; Eliche-Quesada, D.; Kherbache, S.; Bouzidi, N.; Tahakourt, A.K. Harbor Dredged Sediment as raw material in fired clay brick production: Characterization and properties. J. Build. Eng. 2020, 28, 101085. [Google Scholar] [CrossRef]
- Cotana, F.; Cavalaglio, G.; Nicolini, A.; Gelosia, M.; Coccia, V.; Petrozzi, A.; Brinchi, L. Lignin as Co-product of Second Generation Bioethanol Production from Ligno-cellulosic Biomass. Energy Procedia 2014, 45, 52–60. [Google Scholar] [CrossRef] [Green Version]
- Kousis, I.; Fabiani, C.; Ercolanoni, L.; Pisello, A.L. Using bio-oils for improving environmental performance of an advanced resinous binder for pavement applications with heat and noise island mitigation potential. Sustain. Energy Technol. Assess. 2020, 39, 100706. [Google Scholar] [CrossRef]
- Gustafsson, S.E. Transient plane source techniques for thermal conductivity and thermal diffusivity measurements of solid materials. Rev. Sci. Instrum. 1991, 62, 797–804. [Google Scholar] [CrossRef]
- Buratti, C.; Belloni, E.; Merli, F.; Bianconi, F. Experimental characterization of the color rendering properties of transparent monolithic aerogel. Sol. Energy 2020, 205, 183–191. [Google Scholar] [CrossRef]
- International Organization for Standardization. ISO 14040:2006 Environmental Management—Life Cycle Assessment—Principles and framework; International Organization for Standardization: Geneva, Switzerland, 2006. [Google Scholar]
- International Organization for Standardization. ISO 14044:2006 Environmental Management—Life Cycle Assessment—Requirements and guidelines; International Organization for Standardization: Geneva, Switzerland, 2006. [Google Scholar]
- European Commission—Joint Research Centre—Institute for Environment and Sustainability (EC-JRC). ILCD Handbook—General Guide on LCA—Provisons and Action Steps, 1st ed.; Publications Office of the European Union: Luxemburg, 2010; ISBN 9789279158551. [Google Scholar]


Publisher’s Note: MDPI stays neutral with regard to jurisdictional claims in published maps and institutional affiliations. |
© 2021 by the authors. Licensee MDPI, Basel, Switzerland. This article is an open access article distributed under the terms and conditions of the Creative Commons Attribution (CC BY) license (https://creativecommons.org/licenses/by/4.0/).