Abstract
The urban population increase in the world, the economic expansion, and the rise in living standards associated with society’s habits and lifestyles accelerated the municipal solid waste (MSW) generation in undeveloped countries, such as in Brazil, in which the generation increased by 25% from 2012 to 2017. In the same period, the São Paulo state, the richest Brazilian state, increased its municipal solid waste generation by 51%. All this MSW needed to be collected and transported, and this process has a high economic and environmental cost. Therefore, this study aims to identify, using spatial analysis, the routes used by MSW trucks to estimate the distances traveled to dispose of the MSW on a regional scale considering all municipalities in the São Paulo state. The findings showed that the landfill numbers decrease, mainly individual ones, which receive MSW only from the city where it is located. Otherwise, the consortium landfills number is increasing, as well as the number of municipalities that share the same disposal site. Consequently, the distances to transport MSW from urban areas to final disposal sites increased by about 55% from 2012 to 2017, reaching 613 million kilometers during this period. This total distance is sufficient to make more than 12,806 laps on Earth and contribute to high fuel consumption and greenhouse gas emission.
1. Introduction
The urban population increase globally, together with the economic expansion and the rise in living standards associated with society’s habits and lifestyles, accelerated the municipal solid waste (MSW) generation [1]. However, in some developed countries, the generation reached the limit plateaus and even started to reduce [2]. Otherwise, in underdeveloped and developing countries, these generation rates continue to increase significantly.
In Brazil, according to the Public Cleaning and Special Waste Brazilian Association (ABRELPE in Portuguese), the MSW generation increased 25% from 2012 to 2017, reaching the amount of 78.4 million tons [3,4]. In the São Paulo state, according to the São Paulo State Environmental Company (CETESB in Portuguese), approximately 9,672,026 and 14,560,434 tons/year were generated for the same interval, which corresponds to about a 51% of MSW generation increase in this period [5,6].
Even though there is high growth in the MSW generation rates in Brazil and São Paulo, its management is considered a regional and municipal problem [7], and it is crucial for the city’s sustainable development.
The sustainable development is outlined by the Sustainable Development Goals (SDGs) of the 2030 agenda established by the United Nations (UN), and to achieve these goals, efficient MSW management is essential, considering that this issue is related to each of the seventeen SDG [8]. The MSW management deals with the generation at the source until the final disposal [9]. Nowadays, one of the most critical issues is collection and transportation [10,11].
The MSW collection and transportation often account for a significant part of the total management budget, reaching over 70%, depending on the geographical location and fuel price [12,13]. In addition, [14] point out that this value surpasses 80 to 90% in low-income countries and 50 to 80% in middle-income countries. So, even small savings in this process will result in more economic and environmental outcomes [10].
The MSW collected and transported in 2017 in Brazil reached more than 71.6 million tons, with approximately 91% of the population covered with this service. The resources applied to make it possible were 10,145 million reais: around 3180 million American US dollars (USD) in 2017 [3].
The southeast region, where the São Paulo state is located, maintained the exact total of waste collected in 2017 from the previous year, around 98.1%, presenting the highest collection coverage among all Brazilian states and spending approximately 5343 million reais, around 1675 million American US dollars [3].
For assessing financial budgets and management efficiencies in collection and transportation, it is first necessary to know the route used by the MSW truck’s vehicles, which can be performed using geographic information systems (GIS) [11,15,16]. This assessment using GIS considers features such as distance and travel time routes, traffic congestion, and the number of vehicles in the fleet [17].
Some other factors could also be indirectly measured, as the environmental impacts caused by the MSW collection and transport. One example is the air pollutant emissions levels, which include carbon dioxide (CO2) and nitrogen oxide (NOx) [9]: gases that are directly related to the greenhouse effect [18,19,20].
The geographic information system uses methods to manage, manipulate, analyze, model, and visualize spatially referenced data [21]. This system is designed to solve complex planning and management problems [22,23]. The distances for collection and transport in this study were analyzed using the GIS routing functions, which use digital maps to simplify the decision-making process to select the best economic and logistical alternatives for the MSW routes [24].
According to [25,26], in all activities involving the MSW collection and transport operation, it is essential to consider vehicle itineraries and efficient routes to minimize the distance covered, as well as the cost and time. Hence, GIS can be regarded as an effective method for analyzing spatial data in MSW studies [27,28,29,30,31]. This technology and its different processes associated with MSW management applications are widely accepted [9].
Therefore, this study aims to identify using spatial analysis through GIS techniques the routes used by MSW collection truck’s vehicles to estimate the distances traveled to dispose of the MSW from urban centers to final disposal sites from all municipalities of São Paulo state. First, the main novelties of this research are to estimate the distance traveled for MSW collection truck’s vehicles using GIS on a regional scale. Generally, this type of study is found in the literature just for a city or a neighborhood and not for a whole region. Second, we did our analyses for more than five years, which we have not found yet in any article published, as most usually analyze just one year.
2. Materials and Methods
2.1. Study Area
The study area is the São Paulo state, which is located in the southeastern region of Brazil. It borders the Atlantic Ocean to the east, Paraná state to the south, Mato Grosso do Sul state to the west, Minas Gerais state to the north, and Rio de Janeiro state to the northeast (Figure 1). São Paulo state has 645 municipalities in an area of approximately 248,000 km2. It had an estimated 45.9 million inhabitants in 2019, and it is the most populous state in Brazil [32].
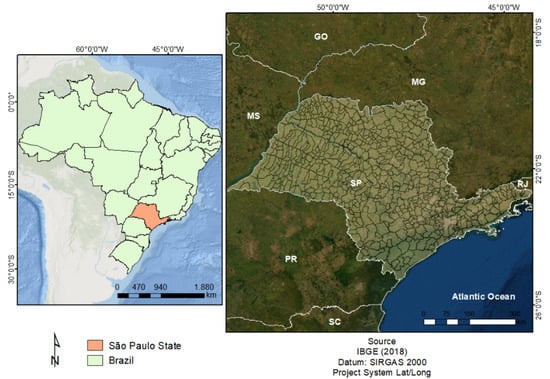
Figure 1.
Location of the São Paulo state and its 645 municipalities.
The São Paulo state is the main economic center in the country and holds 32.5% of the national GDP [33]. The state’s capital is the São Paulo municipality, one of the global metropolises on the planet, comprising the highest GDP among Brazilian cities and the tenth-largest GDP in the world [34]. As the economy and the population dimension are directly related to MSW generation, the São Paulo state has the most considerable generation levels in South America [35].
2.2. Methods
The methodology used was based on [24] and other similar articles that focused on the MSW collection and transport approaches in a GIS environment. Some examples are [10], which applied linear programming and GIS methods to optimize the routes for MSW collection and transportation for a municipality in Turkey, and [36], who carried out a study in Algeria to optimize the household waste collection. The steps used in our research are shown in the flowchart in Figure 2 and described later.
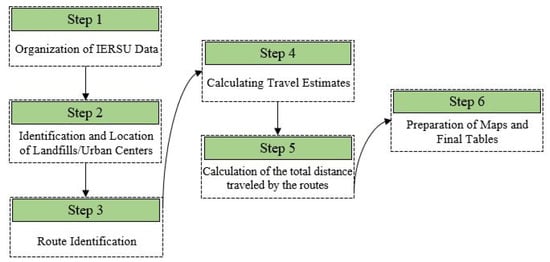
Figure 2.
Methodology flowchart containing the research steps.
In the first step, data were collected from the São Paulo State Inventory of Municipal Solid Waste (IERSU in Portuguese), which CETESB freely provides. The information that was extracted took into consideration the primary conditions of all sanitary landfills in the state for the years 2012 to 2017, such as (i) location, (ii) quantity of MSW disposed in each landfill in tons per day, and (iii) quantity of MSW generated individually by the 645 municipalities. This process also identified which one has disposed waste in landfills located in another city in the state, using consortium landfills, or even outside the São Paulo state. All these data were organized in tables using Excel software.
In the second step, using the ArcGis® 10.5 platform (ArcMap and Arctoolbox extensions), the tabular data were transferred to files in shapefile format. These data were prepared using the information available in the Landfill Waste Quality Index (IQR in Portuguese) spreadsheets, which were provided by Urban Waste Destination Map, also released by CETESB in <https://sistemasinter.cetesb.sp.gov.br/mapa_ugrhis/mapa.php#>. In addition to the information about the IQR, we also used the landfill’s geographical location (latitude and longitude). However, less than 10% of the landfills did not contain this information. Then, it was necessary to visually identify those using remote sensing images from Landsat satellite and, when necessary, the time-lapse in Google Earth Engine. This procedure was also performed for the urbanized coverage shapefile of the São Paulo state when urban center points were identified for all municipalities. The coordinate system adopted was the Brazilian system named SIRGAS 2000, considering the Zone UTM 22 and 23 S.
In the third step, the routes were created, represented by a line format shapefile connecting the urban center of each municipality with their corresponding final MSW disposal location. The main roads were based on the Landsat satellite images from 2012 to 2017 associated with the free transport data from Open Street Maps obtained in April 2018. Therefore, these databases contained the routes used by the MSW truck’s vehicles, where highways were preferably selected.
In the fourth step, data about the MSW quantity (ton/year) generated by each municipality were obtained in IERSU and used to calculate the number of trips made by the truck’s vehicles. According to the Brazilian Standard Regulations (NBR in Portuguese) number 13,463, two MSW truck vehicle types are the simple bucket and the compacting collector [37].
Usually, the model is chosen according to the MSW amount and the access conditions to the collection place [38]. In Brazil, rear-loading compactor vehicles are the most frequently used because they are more economical [39]. The load weight capacity of these trucks is 12 tons, according to the Integrated Solid Waste Management Manual—Brazilian Institute of Municipal Administration [40]. The value used to establish the load capacity in this study was 80% of the total weight, 9.6 tons since the maximum allowed cargo is not achieved on all trips. However, on rainy days, the MSW weight increases by about 20%. Thus, the maximum load weight capacity is reached before completing the total load volume [40]. It is worth mentioning that the decimal values different from zero were rounded up in the number of trips.
In the fifth step, the distances related to the routes made for each São Paulo municipality were calculated in kilometers using the Calculate Geometry attributes tool from ArcGIS®, as shown in Equation (1).
where Td is the estimated total distance traveled by the MSW truck’s vehicles; D is the distance measure by each municipality from urban center to landfill, which were multiplied by two to consider the round trip; and Nf is the number of trips necessary to transport all the MSW generated by the municipality in the landfill.
Lastly, in the sixth and final step, we obtained thematic cartographic products and organized the tables concerning (i) the MSW disposal sites situation in the São Paulo state, (ii) the number of the trips undertaken by the MSW truck’s vehicles, and (iii) the total distances obtained from routes. For the second analysis, only the distances for one-way travel were considered. Finally, for the third analysis, the distance traveled was undertaken and calculated considering the return journey, representing the number of the necessary trips to dispose of the MSW in the landfills.
3. Results and Discussion
3.1. Landfills in the São Paulo State
The most used MSW disposal methods in Brazil are dumps, uncontrolled landfills, and sanitary landfills [41]. The best way for the proper MSW disposal is sanitary landfills because they are engineering projects with undercoat and cover systems and provisions for leachate and gas collection [42].
In 2017, approximately 59% of the MSW was sent to sanitary landfills in Brazil, henceforth called only by landfill. However, dumps and uncontrolled landfills are still present in all country regions and received more than 80,000 tons of waste per day, which may cause environmental pollution and adverse health impacts. In the southeastern region, nearly 72% of MSW was disposed of in landfills by almost half of the region’s municipalities [3].
In the São Paulo state, CETESB, since 1976, has developed actions related to MSW management. From 1997 onwards, it started to elaborate the São Paulo State Inventory of Municipal Solid Waste (IERSU in Portuguese), which contains information about the collection, treatment, and disposal for all the 645 municipalities.
The information about landfills in operation from 2012 to 2017 is shown in Table 1. This study covered three categories: individual, consortium, and landfills located outside the state.

Table 1.
MSW disposal sites situation in the São Paulo state.
The total number of landfills used by all state municipalities decreases by 19% from 2012 to 2017, passim from 453 to 368, which is related to several aspects. Usually, landfills have many negative impacts, and there are several requirements for implementing a new one, including social, environmental, and legal factors [29,43].
This reduction is more significant in the individual landfills used to receive MSW only from the city where it is located. On the other hand, the consortium landfills number used in a shared way by more than one municipality increases in São Paulo state, albeit slowly. This fact is associated with the Brazilian National Solid Waste Policy, instituted by Federal Law No. 12,305 in 2010, which encourages the landfill consortium formation to increase scale and reduce costs [44].
Otherwise, the number of landfills outside the São Paulo state, which serves as the final destination for MSW generated by São Paulo cities, has been maintained over the years. The municipalities that sent their waste outside the state were not considered in this study. However, it is essential to highlight that this amount does not exceed 1% of all MSW disposed of in São Paulo. The total MSW disposed of in the individual and consortium landfills are shown in Table 2.
Table 2.
MSW disposed of in individual and consortium landfills in São Paulo state.
From 2013 to 2017, the MSW total amount disposed of in the state was approximately 14.5 million tons per year, making São Paulo the largest MSW-generating state in South America [35]. Furthermore, on average, the amount of MSW disposed in a consortium landfill is approximately 14 times bigger than in an individual landfill, which is associated with the high quantity of MSW that needs to be transported from further urban areas to landfill sites.
3.2. Routes and Distances from Urban Centers Areas and Landfills
A few municipalities in the São Paulo state disposed of their MSW in two different landfills, which means they had more than one route, and all of them were taken into consideration. Some of them are Arujá, Santo André, São Paulo, Suzano, Marília, and Piracicaba. All of them had a generation of more than 20,000 tons of MSW per year.
Finally, for the years 2012 to 2017, 646, 644, 645, 646, 644, and 643 routes were created, respectively. So, it was possible to estimate the distances between the urban centers and the final MSW disposal sites for São Paulo’s municipalities from these routes. The total results for the years under analysis were 1,468,000, 1,506,000, 1,676,000, 1,731,000, 1,764,000, and 1,997,000 km, following the chronological order of the years studied.
In this period, the total distances to dispose of MSW in the São Paulo state increased by 53,000 km, corresponding to 36%. In this period, there was a reduction of 85 individual landfills and an increase of seven consortium landfills from 31 to 38 landfills. In 2012, only 225 municipalities disposed of their waste in consortium landfills; this number increased significantly to 313 in 2017.
As mentioned before, these consortium landfills are usually more geographically distant, which is one reason that explains the increase in the total distances. Therefore, studies that cluster municipalities to join the same consortium must consider the distances from the urban areas and the landfill’s spatial distribution. A case study in the Parana state showed that non-contiguous consortia are a big problem in Brazil, and to solve this issue, the author created a model to find the best municipalities clusters configuration reaching values about 80% lower in the estimated distances traveled and consequently in the transport costs [45].
An example is the consortium landfill of Paulínia inserted in the Campinas Metropolitan Region, which had 33 municipalities disposing their MSW into it in 2017. The distances covered by them summed 23,000 km, about 12% of the total estimated from all the São Paulo state for this year. On average, these cities disposed of their waste at the Paulínia consortium landfill more than 70 km away. In comparison, municipalities with individual landfills have an average distance of 10 km from urban areas to the final MSW disposal site.
The information about the distance routes estimation per class for all the São Paulo state’s municipalities is shown in Table 3 and Figure 3.
Table 3.
Number of municipalities grouped in the distance classes from urban areas to MSW disposal sites by year and their total length.
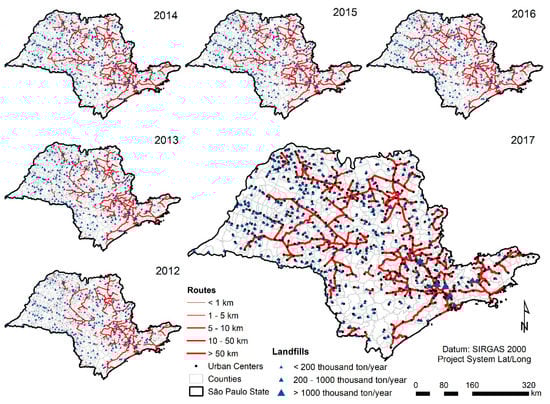
Figure 3.
Sao Paulo state’s municipalities MSW truck’s vehicles routes from 2012 to 2017.
The analysis in Table 3 shows that the number of municipalities classified as short distances (less than 1 km, 1 to 5 km, and 5 to 10 km) decreased about 19% from 2012 to 2017. The class with the most significant reduction was 1 to 5 km, corresponding to about 23%. On the other hand, the distance classes of 10 to 50 km and greater than 50 km had significant increases of 19% and 49%, respectively. This is explained by the rise in the landfill’s consortium number and the municipalities that started to use this type of MSW final destination.
The distance class of 1 to 5 km has the most significant number of municipalities for all years. This interval up to a maximum of 5 km can be regarded as short and represents an economic and environmental advantage associated with different factors such as reduced costs, time, and consequently impact generated by the MSW truck’s vehicles.
The most considerable distances correspond to the more than 50 km class. It is essential to highlight that all municipalities in this class disposed of their MSW in consortium landfills, which were located in more distant places from respective urban centers.
In contrast, even if it reduces transport costs, the proximity between landfills and urban centers has a negative social factor. The causes are the effects known in the international literature as the acronym “NIMBY” (Not in my back yard) and “NIABY” (Not in anyone’s backyard). Most people do not want a landfill to exist near their residence, keeping in mind that the landfill’s negative impacts will not be restricted to the final MSW disposal site but will extend beyond this area, affecting the entire population inserted in the environment [46]. The non-acceptance of landfill facilities by communities becomes an enormous challenge to decision-makers and planners to find a suitable place for a new landfill site [29,47].
The routes used from 2012 to 2017 are presented in Figure 3, where it can be noticed that consortium landfills that receive MSW from several cities tend to stand out in the landscape. In addition to the mentioned Paulínia landfill, the Piratininga landfill in the central region and the Catanduva landfill in the northern part of the São Paulo state stand out in the landscape, both receiving waste from 23 municipalities. Together, these consortium landfills are the final waste destination for the state’s most significant number of cities.
Paulínia consortium landfill is among the three landfills that received the most MSW in the state. It corresponds to about one million tons, followed by the São Paulo individual landfill and Caieiras consortium landfill. These two latter are located in the São Paulo Metropolitan Region, each receiving 2.5 and 2.4 million tons in 2017, respectively. In addition, the consortium landfills of Mauá, also located in the São Paulo Metropolitan Region, and Santos landfill located in the Baixada Santista Metropolitan Region, received 800,000 and 500,000 MSW tons, respectively, standing out among all the consortium landfills in the São Paulo state.
3.3. Number of Trips
The number of trips required for the MSW truck’s vehicle to transport waste from the urban center to the landfill is linked to the vehicle’s load capacity and the MSW amount generated by the municipality. To estimate the total number of trips all the waste generated during each year from 2012 to 2017 was considered. Some classes are shown in Table 4.
Table 4.
Municipalities classify by the number of MSW truck’s vehicles trip.
More than 70% of the municipalities in the São Paulo state carried out less than 1000 trips for all the years. They generate a relatively low MSW amount compared to the others, which occurs because about 42% of São Paulo’s cities have less than 10,000 inhabitants and are not large waste generators.
With an interval between 1000 and 10,000 trips, this class covers a little less than 23% of all municipalities, being the second more frequent. Otherwise, the municipalities that present more than 10,000 trips, although representing less than 4% of the cities, operate more trips than those classified in the other two classes together mainly because they are essentially colossal waste generators. Only São Paulo and Guarulhos municipality’s together in 2017 carried out more trips than the other 607 cities in the state summed up. It is worth mentioning that these two cities are the most significant waste generators in the state, with a generation of approximately 2 million and 500,000 tons/year, respectively.
For the interval that corresponds to fewer than 1000 trips, the sum of trips carried out by the municipalities was approximately 100,000. For the interval that corresponds to 1000 and 10,000 trips, this number was around 400,000. Finally, for the interval corresponding to more than 10,000, about 900,000 trips were made by the cities to dispose of MSW in the landfills.
3.4. Estimates of Total Distances
To obtain the total estimate distances traveled by the MSW truck’s vehicles, the value for the round-trip route was multiplied by the number of trips necessary for all waste generated in the municipalities to be disposed of in landfills. The total values corresponding to the sum of all distances covered by such vehicles are shown in Figure 4.
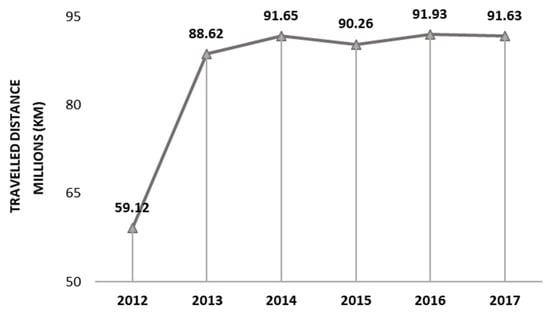
Figure 4.
Estimate of distances traveled by MSW truck’s vehicles.
The rapid increase in the amount of waste generated in the São Paulo state from 2012 to 2013 was mainly caused by an adjustment in CETESB methodology, which changed the per capita value of MSW accordingly to the municipality’s number of people; to see more information, check [6,48]. This caused an impact on the estimation of distances traveled by MSW truck’s vehicles, passing from about 59 million to approximately 89 million km. However, from 2013 to 2017, there is a slight tendency to increase the MSW amount and distance traveled.
Therefore, we found a strong positive Pearson’s correlation coefficient of 0.99 between the trip number and the waste quantity that must be transported, which in turn influences the estimation of distances traveled by the MSW truck’s vehicles. Thus, from 2016 to 2017, an anomaly occurred, and the total distances by all municipalities in the São Paulo state were reduced to about 430,000 km. This is mainly due to the decrease in the waste generated and the number of trips to transport the MSW caused by the economic and political crisis that the whole country experienced.
The MSW amount disposed of in consortium landfills also has a strong positive Pearson’s correlation coefficient of 0.98 with the estimation of distances traveled. Since 2013, the amount sent for the consortium landfill increased by an average of 4.7% per year, except for 2015, which decreased 2.5%. So, the reduction in total distances covered in 2015 explained this anomaly reduction in the waste generation in 2015. Therefore, the lower MSW amount disposed of in consortium landfills means shorter total distances because these landfills are located more and more distant from the urban centers.
It is worth noting that the total MSW received by all 441 landfills in 2013 exceeded the total volume of the following years, 2014 and 2015. However, the estimated value for the distances traveled in 2013 was not higher than in the followed years. The reason is probably that in 2013, the amount disposed of in individual landfills was approximately 6.8 million tons, which is the highest amount received in this landfill type considering all the years in the present study.
This information confirms that a large MSW amount destined for individual landfills results in short distances covered. Our finds show that cities that dispose of their waste in this landfill’s type within their territorial border travel around 10 km or less. The estimated number of municipalities and the estimated distance covered by the MSW truck’s vehicles are presented in Table 5 and Figure 5.
Table 5.
Municipalities are grouped in the estimation of distance traveled by MSW truck’s vehicles classes by year and their full estimated length.
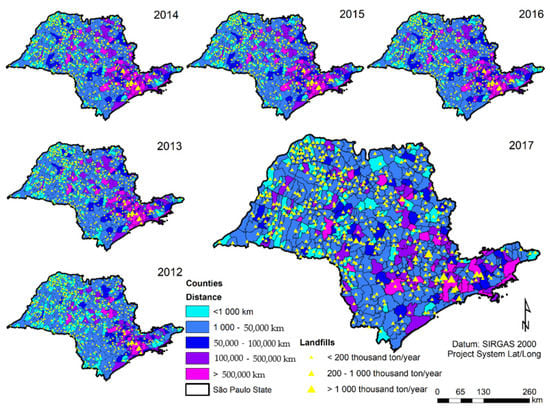
Figure 5.
Sao Paulo state’s municipalities classification according to the total distances covered by MSW truck’s vehicles from 2012 to 2017.
According to Table 5, the only distance class that the municipality’s number reduced significantly along the period was the class that considers less than 1000 km. Consequently, the distance covered by the MSW truck’s vehicle also declined, reaching approximately 40,000 km less from 2012 to 2017. A point to be emphasized is that all the cities in this class had individual landfills in their territories.
The second class, from 1000 to 50,000 km, pointed to the outgrowth of 101 municipalities when compared to the first and last year under analysis. From this, the distances covered in this interval increased by about 53%. In addition, in this same class, from 2013 to 2016, there were no meaningful changes in the city’s number and the total distance covered by them.
On the other hand, there is no significant variation in the number of municipalities that fall into class 50,000 to 100,000 km. The only years that there is more variation refer to 2013 and 2014. However, in general, the total distance covered was around 3 million km for almost all years. The class 100,000 to 500,000 km showed an increase of 26 municipalities and four million km of distance covered from 2012 to 2013. Between 2014 and 2016, these values remained very close, but in 2017, there was a substantial reduction.
Finally, the more than 500,000 km class comprises the smallest number of municipalities in the six years considered. However, from 2012 to 2013, this amount rose by 119%, and the estimated distances covered increased by 64%. In the following years, the number of cities did not go through significant variations; the same is valid for the distances covered.
Therefore, on average, 51% of municipalities traveled from 1000 to 50,000 km to dispose of their MSW. The total distance in this class was approximately 3 million km from 2012 to 2016 and 4 million in 2017. The class values below 1000 km were the second highest in the municipality’s number for all years. This represents about 45% of the total cities in 2012, 24% from 2013 and 2016, and 15% in 2017. The remaining municipalities are distributed in the classes of 50,000 to 100,000 km and 100,000 to 500,000 km, corresponding to 7% and 12%, respectively. Regarding distances covered by the over 500,000 km class, it is worth mentioning that although it presents the smallest cities number, it is responsible for the largest total distances covered with values higher than 60 million km from 2013 forward.
In Figure 5, it is possible to visualize how much each municipality traveled to dispose of their waste, considering the number of trips and the MSW quantity sent to landfills from 2012 to 2017.
It can be noticed in Figure 5 that the municipalities that covered more than 500,000 km and used consortium landfills in their territory are located mainly in a significant urban agglomeration region containing the São Paulo Macro-Metropolis, which comprises the Metropolitan Regions of São Paulo, Baixada Santista, Campinas, Sorocaba, and Vale do Paraíba and Litoral Norte, in addition to Jundiaí and Piracicaba Urban Agglomerations. Otherwise, the municipalities that traveled less than 1000 km were concentrated farther than the capital, mainly in the western region of São Paulo state.
4. Conclusions
The MSW generated in Brazil shows a growing trend in both per capita and total value. The greater this amount, the more efficient its management must be. So, there is a strong positive Pearson’s correlation coefficient of 0.99 between the waste amount and the distances covered to dispose of it in landfills. However, there is a moderate negative Pearson’s correlation coefficient of -0.66 between the number of landfills and the total distances. Thus, since the landfill’s number in the São Paulo state is decreasing over the years, there is an increase in the MSW truck’s vehicle distances covered because the landfills have become farther away.
The distances from urban areas to final disposal sites are increasing in the São Paulo state. From 2012 to 2017, these values were 147,000 and 199,000 kilometers, respectively. In this six-year interval, the total distance had a significant increase of 36%. This expansion mainly reflects the 22% reduction in individual landfills and, otherwise, it increased in consortium landfills. In addition, the municipalities that started to dispose of their MSW in consortium landfills increased by 40%.
Although the number of trips for more than 70% of the municipalities in the state is less than 1000 trips each to dispose of their waste, the São Paulo and Guarulhos cities carried out more trips than any other city in the state to dispose of their waste. In terms of comparing, the number of trips from these two municipalities summed up exceeds 94% of all other cities in the São Paulo state taken jointly.
The total estimated distance considering the round-trip distance and the number of trips had a more significant increase of approximately 55%. The sum of all the distances covered by the MSW trucks to dispose of waste in the São Paulo state exceeds 513 million km. In comparison, this estimated value would be enough to carry out more than 12,806 trips around planet Earth along the equator, causing a high economic cost. This total estimation of distances traveled by the MSW trucks enhances environmental pollution. It generates negative impacts on health, especially concerning the pollutants and greenhouse gas emissions responsible for global warming, subject to future studies.
In addition, clustering the municipalities more wisely to use an already existing landfill, or even find a suitable place for a new landfill that could be used for several cities and is not too far from them, could decrease the distances traveled to transport the MSW and consequently reduce economic costs and environmental impacts.
Author Contributions
V.N. and J.O. had the idea and wrote the project to obtain the grant and the scholarship, L.M. organized the data and elaborated on the analysis, L.M. and V.N. wrote the article, S.S. reviewed the article. All authors have read and agreed to the published version of the manuscript.
Funding
The authors thank CAPES for Victor Fernandez Nascimento’s post-doctoral scholarship process no 88882.316284/2019-0. The Institutional Program for Scientific Initiation Scholarships (PIBIC-INPE/CNPq) for scientific initiation grant for Laryssa Alvarenga de Morais process no 170752/2017-8 and the CNPq universal project 409690/2018-0. We also knowledge the support of the project International Nitrogen Management System (INMS).
Acknowledgments
The authors thank the National Institute for Space Research (INPE), Rio Grande do Sul Federal University (UFRGS), Integrated Colleges of Taquara (FACCAT), and São Paulo State University (UNESP) for the support given during this research.
Conflicts of Interest
There are no conflicts or competing interests.
References
- Minghua, Z.; Xiumin, F.; Rovetta, A.; Qichang, H.; Vicentini, F.; Bingkai, L.; Giusti, A.; Yi, L. Municipal Solid Waste Management in Pudong New Area, China. Waste Manag. 2009, 29, 1227–1233. [Google Scholar] [CrossRef]
- Bhada-Tata, P.; Hoornweg, D. Solid Waste and Climate Change. In Can a City be Sustainable? Island Press: Washington, DC, USA, 2016; p. 450. [Google Scholar]
- ABRELPE. Panorama of Solid Waste in Brazil 2017; ABRELPE: São Paulo, Brazil, 2018. [Google Scholar]
- ABRELPE. Panorama of Solid Waste in Brazil 2012; ABRELPE: São Paulo, Brazil, 2013. [Google Scholar]
- CETESB. Inventário Estadual de Resíduos Sólidos Urbanos—2017; CETESB: São Paulo, Brazil, 2018. [Google Scholar]
- CETESB. Inventário Estadual de Resíduos Sólidos Urbanos—2013; CESTEB: São Paulo, Brazil, 2013. [Google Scholar]
- Spinola, G.M.R.; Nascimento, V.F.; Andrade, P.R.; Ometto, J.P.B. Análise Estatística Da Composição Gravimétrica Dos Resíduos Sólidos Urbanos Com o Índice de Desenvolvimento Humano Para Os Municípios Do Estado de São Paulo. Geoambiente Online 2019, 106–123. [Google Scholar] [CrossRef]
- UN. The Sustainable Development Goals Report 2019; The Sustainable Development Goals Report; United Nations: New York, USA, 2019; ISBN 9789210478878. [Google Scholar]
- Tavares, G.; Zsigraiova, Z.; Semiao, V.; Carvalho, M.G. Optimisation of MSW Collection Routes for Minimum Fuel Consumption Using 3D GIS Modelling. Waste Manag. 2009, 29, 1176–1185. [Google Scholar] [CrossRef]
- Rızvanoğlu, O.; Kaya, S.; Ulukavak, M.; Yeşilnacar, M.İ. Optimization of Municipal Solid Waste Collection and Transportation Routes, through Linear Programming and Geographic Information System: A Case Study from Şanlıurfa, Turkey. Environ. Monit. Assess. 2020, 192, 1–12. [Google Scholar] [CrossRef] [PubMed]
- da Costa, N.R.M.; Nascimento, V.F.; Ometto, J.P.H.B. A História Da Coleta de Resíduos Em Novo Hamburgo, RS e Uma Proposta de Uma Nova Roteirização Utilizando Sistema de Informações Geográficas. Oficina Hist. 2020, 13, e38033. [Google Scholar] [CrossRef]
- Doǧan, K.; Süleyman, Ş. Report: Cost and Financial of Municipal Solid Waste Collection Services in Istanbul. Waste Manag. Res. 2003, 21, 480–485. [Google Scholar] [CrossRef] [PubMed]
- Ghose, M.K.; Dikshit, A.K.; Sharma, S.K. A GIS Based Transportation Model for Solid Waste Disposal—A Case Study on Asansol Municipality. Waste Manag. 2006, 26, 1287–1293. [Google Scholar] [CrossRef] [PubMed]
- Hoornweg, D.; Bhada-Tata, P. What a Waste—A Global Review of Solid Waste Management; World Bank: Washington, DC, USA, 2012. [Google Scholar]
- Kanchanabhan, T.E.; Abbas Mohaideen, J.; Srinivasan, S.; Kalyana Sundaram, V.L. Optimum Municipal Solid Waste Collection Using Geographical Information System (GIS) and Vehicle Tracking for Pallavapuram Municipality. Waste Manag. Res. 2011, 29, 323–339. [Google Scholar] [CrossRef]
- Khan, D.; Samadder, S.R. Municipal Solid Waste Management Using Geographical Information System Aided Methods: A Mini Review. Waste Manag. Res. 2014, 32, 1049–1062. [Google Scholar] [CrossRef] [PubMed]
- Zsigraiova, Z.; Semiao, V.; Beijoco, F. Operation Costs and Pollutant Emissions Reduction by Definition of New Collection Scheduling and Optimization of MSW Collection Routes Using GIS. The Case Study of Barreiro, Portugal. Waste Manag. 2013, 33, 793–806. [Google Scholar] [CrossRef]
- IPCC. Waste Generation, Composition and Management Data. In Guidelines for National Greenhouse Gas Inventories; Institute for Global Environmental Strategies: Kanagawa, Japan, 2006; p. 23. [Google Scholar]
- WMO; UNESCO; IPCC; UNEP. United in Science 2020—A Multi-Organization High-Level Compilation of the Latest Climate Science Information; World Meteorological Organization: Geneva, Switzerland, 2020. [Google Scholar]
- IPCC. IPCC Special Report on Climate Change, Desertification, Land Degradation, Sustainable Land Management, Food Security and Greenhouse Gas Fluxes in Terrestrial Ecosystems; IPCC: Geneva, Switzerland, 2019. [Google Scholar]
- Longley, P.A.; Goodchild, M.F.; Maguire, D.J.; Rhind, D.W. Geographic Information Science and Systems; Wiley: Hoboken, NJ, USA, 2015; ISBN 9781118676950. [Google Scholar]
- Nascimento, V.F.; Sobral, A.C.; de Andrade, P.R.; Ometto, J.P.H.B. Evolução e Desafios No Gerenciamento Dos Resíduos Sólidos Urbanos No Brasil. Rev. Ambiente Água 2015, 10, 889–901. [Google Scholar] [CrossRef]
- Nascimento, V.F.; da Silva, A.M.; Sobral, A.C. Indicação de Áreas Para Aterro Sanitário, Utilizando Geoprocessamento; Novas Edições Acadêmicas: Saarbrücken, Germany, 2015; ISBN 978-3-639-75242-7. [Google Scholar]
- de Morais, L.A.; Fernandez Nascimento, V.; Antonio Guasselli, L.; Pierre Baulbaud Ometto, J. Estimativas Das Distâncias Para Disposição de Resíduos Sólidos Urbanos No Estado de São Paulo. Rev. Bras. Cartogr. 2019, 71, 960–982. [Google Scholar] [CrossRef]
- Chang, N.-B.; Lu, H.Y.; Wei, Y.L. GIS Technology for Vehicle Routing and Scheduling in Solid Waste Collection Systems. J. Environ. Eng. 1997, 123, 901–910. [Google Scholar] [CrossRef]
- Malakahmad, A.; Md Bakri, P.; Md Mokhtar, M.R.; Khalil, N. Solid Waste Collection Routes Optimization via GIS Techniques in Ipoh City, Malaysia. Procedia Eng. 2014, 77, 20–27. [Google Scholar] [CrossRef]
- Sadek, S.; El-Fadel, M.; Freiha, F. Compliance Factors within a GIS-Based Framework for Landfill Siting. Int. J. Environ. Stud. 2006, 63, 71–86. [Google Scholar] [CrossRef]
- Nascimento, V.F.; Sobral, A.C.; Andrade, P.R.; Ometto, J.P.H.B.; Yesiller, N. Modeling Environmental Susceptibility of Municipal Solid Waste Disposal Sites: A Case Study in São Paulo State, Brazil. J. Geogr. Inf. Syst. 2017, 9, 8–33. [Google Scholar] [CrossRef][Green Version]
- Nascimento, V.F.; Loureiro, A.I.S.; Andrade, P.R.; Guasselli, L.A.; Ometto, J.P.B. A Worldwide Meta-Analysis Review of Restriction Criteria for Landfill Siting Using Geographic Information Systems. Waste Manag. Res. 2020. [Google Scholar] [CrossRef]
- Nascimento, V.F.; Yesiller, N.; Clarke, K.; Ometto, J.P.H.B.; Andrade, P.R.; Sobral, A.C. Modeling the Environmental Susceptibility of Landfill Sites in California. GIScience Remote Sens. 2017, 1–21. [Google Scholar] [CrossRef]
- Nascimento, V.F.; Sobral, A.C.; Andrade, P.R.; Ometto, J.P.H.B.; Yesiller, N. Natural Disaster Risk in Municipal Solid Waste Disposal Sites Using GIS: A Case Study in São Paulo State, Brazil. J. Water Resour. Prot. 2017, 9, 1213. [Google Scholar] [CrossRef]
- IBGE. População Estimada 2019: Estado de São Paulo, Brasil; IBGE: São Paulo State, Brazil, 2021. [Google Scholar]
- IBGE. Sistema de Contas Regionais: Brasil 2018; IBGE: São Paulo State, Brazil, 2020. [Google Scholar]
- IBGE. Produto Interno Bruto Dos Municípios 2018; IBGE: São Paulo State, Brazil, 2016. [Google Scholar]
- Nascimento, V.F.; Sobral, A.C.; Fehr, M.; Yesiller, N.; Andrade, P.R.; Ometto, J.P.H.B. Municipal Solid Waste Disposal in Brazil: Improvements and Challenges. Int. J. Environ. Waste Manag. 2019, 23, 300–318. [Google Scholar] [CrossRef]
- Abdelli, I.S.; Abdelmalek, F.; Djelloul, A.; Mesghouni, K.; Addou, A. GIS-Based Approach for Optimised Collection of Household Waste in Mostaganem City (Western Algeria). Waste Manag. Res. 2016, 34, 417–426. [Google Scholar] [CrossRef]
- ABNT. (Brazilian Association for Technical Standards) NBR 13463–Coleta de Resíduos Sólidos; ABNT: Rio de Janeiro, Brazil, 1995; pp. 5–7. [Google Scholar]
- CEMPRE. Lixo Municipal–Manual de Gerenciamento Integrado; CEMPRE: São Paulo, Brazil, 2018; ISBN 9788587345028. [Google Scholar]
- Spigolon, L.M.G. A Otimização Da Rede de Transporte de RSU Baseada No Uso Do SIG e Análise de Decisão Multicritério Para a Localização de Aterros Sanitários; Digital Library of Theses and Dissertations of USP: São Carlos, Brazil, 2015. [Google Scholar]
- Monteiro, J.H.P.; Zular, V.Z.; José, T.; Penido, H.; Carlos, M.; Moutinho, E.; Antônio, F.; Magalhães, F.; Antônio, M.; De, F.; et al. Manual Gerenciamento Integrado de Resíduos Sólidos; IBAM: Rio Janeiro, Brazil, 2001. [Google Scholar]
- IBGE. Atlas Saneamento—2011; IBGE: Rio de Janeiro, Brazil, 2011. [Google Scholar]
- Nascimento, V.F.; da Silva, A.M. Identifying Problems for Choosing Suitable Areas for Installation of a New Landfill through GIS Technology: A Case Study. J. Air Waste Manag. Assoc. 2014, 64, 80–88. [Google Scholar] [CrossRef][Green Version]
- Calvo, F.; Moreno, B.; Ramos, Á.; Zamorano, M. Implementation of a New Environmental Impact Assessment for Municipal Waste Landfills as Tool for Planning and Decision-Making Process. Renew. Sustain. Energy Rev. 2007, 11, 98–115. [Google Scholar] [CrossRef]
- BRASIL. Lei No 12.305, de 2 de Agosto de 2010. Institui a Política Nacional de Resíduos Sólidos; Altera a Lei No 9.605, de 12 de Fevereiro de 1998; e Dá Outras Providências; Diário Oficial da União: Brasilia, Brazil, 2010. [Google Scholar]
- De Franco, D.G.B.; Steiner, M.T.A.; Assef, F.M. Optimization in Waste Landfilling Partitioning in Paraná State, Brazil. J. Clean. Prod. 2021, 283. [Google Scholar] [CrossRef]
- Dear, M. Understanding and Overcoming the NIMBY Syndrome. J. Am. Plan. Assoc. 1992, 58, 288–300. [Google Scholar] [CrossRef]
- Chang, N.B.; Parvathinathan, G.; Breeden, J.B. Combining GIS with Fuzzy Multicriteria Decision-Making for Landfill Siting in a Fast-Growing Urban Region. J. Environ. Manag. 2008, 87, 139–153. [Google Scholar] [CrossRef] [PubMed]
- CETESB. Inventário Estadual de Resíduos Sólidos Urbanos—2012; CESTESB: São Paulo, Brazil, 2013; p. 114. [Google Scholar]


Publisher’s Note: MDPI stays neutral with regard to jurisdictional claims in published maps and institutional affiliations. |
© 2021 by the authors. Licensee MDPI, Basel, Switzerland. This article is an open access article distributed under the terms and conditions of the Creative Commons Attribution (CC BY) license (https://creativecommons.org/licenses/by/4.0/).