Abstract
Scientific and timely sustainability evaluation of the photovoltaic industry along the Belt and Road is of great significance. In this paper, a novel hybrid evaluation model is proposed for accurate and real-time assessment that integrates modified set pair analysis with least squares support vector machine that combines improved cuckoo search algorithm. First, the indicator system is set from five principles, namely economy, politics, society, ecological environment and resources. Then, the traditional approach is established through modifying set pair analysis on the basis of variable fuzzy set coupling evaluation theory. A modern intelligent assessment model is designed that integrates improved cuckoo search algorithm and least squares support vector machine where the concept of random weight is introduced in improved cuckoo search algorithm. In the case analysis, the relative errors calculated by the proposed model all fluctuate in the range of [−3%, 3%], indicating that it has the strongest fitting and learning ability. The empirical analysis verifies the scientificity and precision of the method and points out influencing factors. It provides a new idea for rapid and effective assessment of PV industry along the Belt and Road, as well as assistance for the sustainable development of this industry. This paper innovatively proposes the sustainability evaluation index system and evaluation model for the photovoltaic industry in countries along the Belt and Road, thus contributing to the promotion of sustainable development of the photovoltaic industry in countries along the Belt and Road.
1. Introduction
With the increasing attention paid to global warming all over the world, clean and renewable energy, such as photovoltaic (PV) energy, has become of great importance [1]. The development of the PV industry demands unity and cooperation of all countries. The initiative known as “the Belt and Road” is one of the momentous links that cohere the countries along the road to promote the growth of the PV industry [2]. In the past seven years, this proposal has facilitated close energy cooperation, especially in the field of renewable energy such as PV [3]. However, uneven comprehensive national strength and resources bring about significant differences in the sustainable development of the PV industry in these countries. Some countries are faced with many problems that seriously affect the development and exploitation of solar energy resources. Hence, the sustainable growth of the PV industry has become a hot issue in current research [4]. This study conducts a sustainable development evaluation of the PV industry in the countries along the Belt and Road so as to provide a reference for PV escalation.
While various studies have considered sustainability evaluation, few studies have focused on the PV industry along the Belt and Road. Considering the similarities between the PV industry and other fields in sustainability assessment such as influential factors, it is of great necessity to study the existing research [5]. Reference [6] established a small hydropower sustainability estimation index system for countries along the Belt and Road. Analytic hierarchy process (AHP) combined with fuzzy comprehensive evaluation model was employed to realize the evaluation. Reference [7] accomplished the site selection from the perspective of sustainability assessment. Although this study mentioned PV power station evaluation, it was focused on the micro level of the project and unconcerned with the whole PV industry. The core issue of sustainable development is the coordinated growth of economy, society and environment, according to [8]. This study followed the concept of the Chinese sustainable development index system (CSDIS) to form the indicator system. Natural discontinuity classification, exploratory spatial data analysis and geographic detector analysis were utilized to explore urban sustainability and coordination degree. Reference [9] studied the sustainability of private internal combustion vehicles replaced with shared electric vehicles. Despite the lack of research on sustainable estimation aiming at the PV industry, these studies have a certain reference value for the establishment of an indicator system in this paper.
The existing evaluation approaches are of great significance to the sustainable development assessment of PV industries and are mainly divided into traditional estimation methods and modern intelligent algorithms [10]. Conventional evaluation models incorporate subjective and objective modes [11]. For instance, expert assessment, fuzzy analytic hierarchy process and network analytic hierarchy process are employed for subjective determination, while entropy weight method, principal component analysis, grey correlation analysis, matter-element extension model and set pair analysis (SPA) are all used for objective estimation [12]. Additionally, intelligent algorithms chiefly comprise artificial neural network (ANN), support vector machine (SVM), least squares support vector machine (LSSVM), etc. [13]. Considering the mature theory and accurate calculation of traditional models [14], as well as quick data processing of intelligent techniques [15], this paper integrates these two methods for sustainability evaluation of the PV industry in the countries along the Belt and Road.
First of all, the entropy weight method is used to determine the index weight so as to quantify the estimation and reduce the deviation caused by human factors [16]. SPA is able to describe the internal correlation via connection degree [17]. However, the variable fuzzy set method (VFSM) can illustrate the dynamic of clusters in detail [18]. In line with the aforementioned two techniques, the modified SPA is utilized in this study. With regard to the evaluation approaches, the drawbacks of low convergence speed and ease of becoming trapped in local optima limit the application of ANN [19]. SVM needs to transform the solving process into quadratic programming via kernel function [20], which results in low efficiency and convergence precision [21]. LSSVM takes advantage of least squares linear system as the loss function so that the process of quadratic programming can be avoided [22]. Meanwhile, the transformation of evaluation problems into equations and the conversion of inequality constraints into equality ones contribute to the enhancement of estimation accuracy and speed [23]. Hence, LSSVM is selected here for research. Due to the blind selection of penalty coefficient and kernel parameters in LSSVM, it is of great significance to apply an appropriate technique to optimize these values [24]. Cuckoo search (CS) algorithm is a novel heuristic algorithm proposed by Yang Xinshe and S. Deb in 2009. In comparison with particle swarm algorithm and genetic algorithm, this technique is inspired by the cuckoo breeding method and presents satisfactory performance in optimization problems [25,26]. CS is commonly used in project scheduling, engineering optimization, etc. It has been a hot issue on the basis of simple structure and few control parameters. However, it is noteworthy that CS can easily fall into optima [27]. Thus, random weight is introduced to change the update mode of nest position, which is conducive to improving convergence speed and realizing global optimal search.
The main contributions of this paper are the following:
- (1)
- The indicator system of sustainability evaluation on PV industry in countries along the Belt and Road is constructed from five aspects: economy, politics, society, ecological environment and resources, and the question of what the aspects of sustainability of the PV industry in countries along the Belt and Road are is answered.
- (2)
- The evaluation index weights are determined based on the entropy weight method, and the evaluation results are obtained by designing an improved SPA model from the perspective of the classical evaluation method.
- (3)
- The basic cuckoo algorithm is improved by using random weights, and the improved algorithm is used to optimize the LSSVM and establish an intelligent evaluation model. It provides decision support to promote the sustainable development of the PV industry in countries along the Belt and Road.
All in all, this paper establishes an index system for sustainability evaluation of the PV industry in the countries along the Belt and Road. Moreover, a comprehensive evaluation model incorporating modified SPA and ICS-LSSVM is proposed in this study. The rest of the paper is organized as follows: Section 2 selects the indicators and provides a brief description. Section 3 introduces the methodology of entropy weight method, modified SPA, ICA and LSSVM in detail. The evaluation model that integrates modified SPA with ICS-LSSVM is constructed in Section 4. Section 5 provides the results of an experimental study conducted to verify the effectiveness of this novel technique and analyzes the sustainability of the PV industry. The study is concluded in Section 6.
2. Index System
2.1. Establishment Principles
In accordance with construction experience, the indicator system of sustainability evaluation on PV industry in countries along the Belt and Road is established based on the following principles [28]:
- (1)
- Sustainability: the promotion of PV power stations can not only acquire economic benefits, but also reduce poverty and promote social development on the premise of ecological protection. Thus, in index selection, it is necessary to take both protection and development into account.
- (2)
- Systematicness: the evaluation index system should be treated as a whole in order to interrelate the indicators and endue the system with rigorous structure and complete content.
- (3)
- Pragmatism: key factors should be selected and appropriate assessment standards should be set in line with the inherent development law of the PV industry and data availability.
2.2. Index Selection
Based on the aforementioned principles as well as existing literature and data collection [29,30,31], this study establishes the evaluation index system of PV industry along the Belt and Road from five aspects, namely economy, politics, society, ecological environment and resources, as listed in Table 1.

Table 1.
Index system of sustainability evaluation in countries along the Belt and Road.
2.3. Index Description
This paper elaborates on the definition of indicators as follows:
- (1)
- Gross domestic product (GDP) refers to the production activity achievement of all resident units in a country (or) region during a period of time, which is calculated in terms of the national market price. GDP is commonly recognized as the most appropriate indicator to measure a national economy. As a comprehensive statistical index in an accounting system, GDP reflects the economic strength and market scale in a country (or region).
- (2)
- Per capita GDP equals the ratio of GDP in a country or region during the accounting period (usually one year) to the corresponding permanent population.
- (3)
- GDP growth rate stands for the annual increasing ratio calculated via GDP at a comparable price.
- (4)
- Political stability is affected by regime change, ethnic contradictions and so on.
- (5)
- National political openness represents the openness scale and level of a country to other countries in politics.
- (6)
- Support of national policies for the PV industry indicates the relevant policies in a country aimed at PVs.
- (7)
- National perception index takes entrepreneurs, risk analysts and general public as survey objects to assess the integrity and bribery of government officials.
- (8)
- Urbanization rate generally utilizes demographic indicators, namely the proportion of urban population in the total population (including agriculture and non-agriculture).
- (9)
- Human development index (HDI) is a comprehensive indicator obtained from three basic variables, namely life expectancy, education level and life quality.
- (10)
- Power supply and demand identify the electricity development in a country.
- (11)
- CO2 emissions equal the gross carbon emission in a country.
- (12)
- Biodiversity can be judged via national representative species, threatened status and diverse habitat types.
- (13)
- Emphasis on environmental protection is chiefly determined by the formulation and implementation of related policy.
- (14)
- Solar radiation conditions incorporate the amount of solar radiation, sunshine hours and peak sunshine hours.
- (15)
- Meteorological conditions refer to various hydrothermal states. This study mainly analyzes annual average wind speed, annual average wind speed, historical maximum instantaneous wind speed, annual average temperature, extreme maximum temperature, extreme minimum temperature, annual average rainfall, annual average relative humidity, annual frost-free period, annual average evaporation, annual thunderstorm days and special climate impact in the construction sites of PV generation projects.
- (16)
- Engineering geological conditions comprise basic geological structure, underground hydrological conditions and negative impacts.
- (17)
- Total primary energy consumption represents the amount of primary energy consumed by a country or region during a certain period of time.
- (18)
- Per capita consumption of primary energy is equivalent to the ratio of primary energy consumption to the corresponding permanent population in a country or region during the accounting period (usually one year).
- (19)
- Renewable energy consumption equals the amount consumed by a country or region in a certain period of time.
- (20)
- Total power generation includes thermal power, hydropower, nuclear energy and other modes (such as geothermal power, PV, wind, tidal power and bioenergy) from all electricity industry plants, self-owned power plants and rural small electric stations.
- (21)
- PV power generation identifies total electricity generated from PV stations.
- (22)
- Proportion of PV power generation equals the ratio of PV electricity generation to gross amount in a country.
3. Methodology
3.1. Entropy Weight
As a common technique for objective weight calculation, the principle of entropy weight comes from thermodynamics. Entropy is a measure of system uncertainty. A larger entropy corresponds to a more chaotic system and less information [32]. Suppose the system stays in states, the probability of each state is expressed as . Thus, the entropy weight can be computed by Equation (1):
where satisfies the conditions and .
The specific procedures of entropy weight are presented as follows [33]:
- (1)
- Establishment of standardized judgment matrix
The standardized judgement matrix is constructed based on the standardized data.
- (2)
- Information entropy calculation of each indexif fij = 0,
- (3)
- Index weightwhere .
3.2. Modified SPA
SPA is modified in this paper via variable fuzzy set coupling evaluation theory which takes the multiscale fuzzy relationship between the indicators and grade as well as the influence of indexes on evaluation object. The basic steps are listed as follows:
- (1)
- Determine the evaluation index and estimation grade as and , respectively, where and equal the number of indicators and grades.
- (2)
- In virtue of basic principles of SPA [34], set as the set pair and conduct analysis from the perspective of identity, discrepancy and opposition. The connection degree between grade and the -th sample in index is calculated as follows:where represent the degree of identity, discrepancy and opposition, respectively. . is the discrepancy coefficient determined based on research object;. is the opposition coefficient; .
In line with the simple calculation of connection degree and fuzziness of evaluation object and standard, a membership function is adopted to confirm which avoids calculating in Equation (6) directly. If they belong to the same grade, . If they pertain to the adjacent level, . Additionally, if they are attributed to separate grades, . The connection degree is computed by Equation (8) [35]:
where takes full advantage of the information in and from three aspects, namely identity, discrepancy and opposition.
- (3)
- The connection degree between -th sample and assessment grade is acquired on the foundation of and [34].where is the weight of -th index. . If approximates −1, it indicates the consistency between -th sample and assessment grade is small. If approximates 1, it demonstrates the consistency is great.
- (4)
- The relative membership is computed between -th sample and evaluation grade where is deemed as the relative difference in VFSM [36].
In accordance with the principle of maximum membership degree, is used for evaluation. The eigenvalue is taken as an alternative for result recognition due to estimation precision.
where is the eigenvalue of the -th sample. A larger eigenvalue corresponds to better sustainability. .
3.3. Improved CS (ICS)
3.3.1. CS
CS is a novel heuristic algorithm proposed in 2009 [37]. The core idea of this technique is brood parasitism behavior and Levy flight mode.
- (1)
- Brood parasitism behavior
On the foundation of long-term observation and research of entomologists, cuckoos do not raise their offspring, but secretly put their nestlings in other birds’ nests. If they are not detected by the nest owner, their offspring will be brought up. This is also known as nest parasitism, which is a special breeding method different from other birds. Cuckoos do not build nests or hatch their young eggs all the time; instead, they search for birds with similar egg shapes and sizes along with feeding periods and habits. Cuckoos quickly lay their eggs in the nests of orioles and skylarks when they watch other birds leave the nests and allow these birds to hatch on their own behalf. Due to the similar color and size, cuckoos remove one egg from the original nest before laying eggs, so that other birds substitute for cuckoos to feed the young. The CS algorithm simulates cuckoos’ nest search and brood parasitic behavior where the selected nests are perceived as solution distribution in space. Moreover, the nest position symbolizes the fitness value and the process of nest search represents the optimization procedures.
- (2)
- Levy flight
Levy flight adopted in CS belongs to random walk that satisfies heavy-tailed stable distribution where short-distance exploration alternates with occasional long-distance walking. This approach is able to increase search space, expand population diversity and escape local optima. As a continuous probability distribution, Levy flight is named after Paul Levy. Several vital parameters are listed here: characteristic index , scale , displacement and direction . The definition of Levy distribution is Fourier transformation of its characteristic function [38]:
where .
The probability density function of Levy flight distribution is shown in Equation (13):
where .
Equation (14) presents the probability density function of jump distribution in Levy flight [39].
It is a remarkable fact that there exists a great jump in Levy flight owing to its second-moment divergence.
3.3.2. Improved CS
CS has been successfully adopted in many fields, such as nonlinear optimization. This approach has advantages of good local and global convergence, few parameters, strong robustness and high search efficiency. However, the drawback of easily falling into local optima limits the application of CS. Thus, random weight is introduced in this paper to change the update mode of bird nest position so as to enhance the convergence speed and realize global optimal search.
Random weight is a dynamic method of weight selection. It randomly determines a weight value, i.e., a larger or smaller weight, from the Gaussian distribution each time. This technique can prevent the CS algorithm from becoming trapped in local optima at the initial stage of the search. Simultaneously, the random occurrence of larger and smaller weights brings about the improvement of convergence speed and precision. Equation (15) generates a number in .
where represents a random number that obeys normal distribution.
where represent the maximum and minimum of the randomly selected weights, is the random number and equals the bias.
Random weight obeys Gaussian distribution, namely . The stochastical appearance of larger and smaller weights contributes to optimum determination as well as the balance of local and global search. Hence, random weight is combined with CS algorithm in this study to update bird nest position. The specific procedures of ICS are listed as follows:
Step 1: Determine the optimization function where is the dimension, is the domain, represents the discovery probability (namely the possibility of a new nest replacing the old one) and equals the number of population. Randomly generate and the initial nest positions as .
Step 2: Calculate the objective function of each nest and record the current optimum.
Step 3: Keep the optimal position of the previous nest and randomly generate the weight as . The nest position is updated according to Equation (17):
where equals the number of iterations, represents the step length and means entrywise multiplication. It describes a random walk where the first term in the current equation and the second term in the transition probability equation determine the position of the next generation. Levy flight belongs to a random search path whose step length satisfies Levy distribution.
Step 4: Compare with . If is superior to , namely , is regarded as the optimal position.
Step 5: Compare discovery probability with the random number of possibility that a host bird can discover an alien egg. If , the optimal position is obtained. Otherwise, repeat Step 2 to update the nest positions.
Step 6: Output the global optimum.
3.4. LSSVM
As an extension of SVM, LSSVM owns two principal characteristics: (i) equality constraints are utilized to replace the inequality ones in SVM; (ii) kernel function is adopted to transform prediction problems into solving equations. These two aspects can greatly improve assessment accuracy and speed [40].
The training sample is set as where stands for the total number. The regression model is established as Equation (18):
where is employed to map the training sample into a high-dimensional space. equals the weighted vector and is the bias.
Equation [19] presents the transformation of the optimization problem [41]:
where represents the penalty parameter that can be applied to balance the accuracy as well as complexity. is the estimation error.
The Lagrange function is exploited here to solve the problem above.
where equals Lagrange multipliers. Equation (22) is derived via derivation of each variable and making it zero.
Through eliminating and , the transformation of the optimization problem is achieved in Equation (23).
Accordingly, Equation (28) is obtained as follows:
where represents the kernel function that meets the Mercer condition. In view of the wide convergence domain and application of radial basis function (RBF), it is selected as the kernel function of LSSVM as listed in Equation (29)
where is the kernel width that reflects the characteristics of the training data set and affects the generation capability of the system.
To sum up, the appropriate determination of kernel parameter and penalty parameter is of great significance to enhance the learning and generalization ability of LSSVM.
4. Evaluation Method Combining Modified SPA with ICS-LSSVM
A hybrid evaluation approach integrating modified SPA with ICS-LSSVM is constructed in this paper where modified SPA is employed to derive traditional results and ICS is adopted to optimize the parameters in LSSVM. The assessment framework is displayed in Figure 1. The specific procedures are as follows:
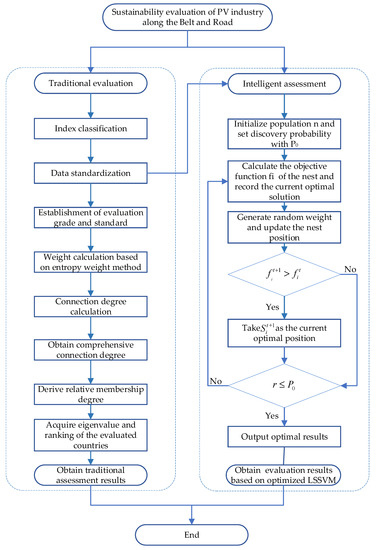
Figure 1.
The assessment framework of the proposed model.
- (1)
- Implement index classification and standardization. This paper applies the targeting standardization method for different indicators to transform them with the same nature. The indexes involved in this study mainly incorporate the minimal and maximal types. Besides, they can also be divided into quantitative and qualitative indicators.
The standardization for a maximal index is as follows:
The standardization for a minimal index is as follows:
where is the normalized value of . are the maximum and minimum values, respectively.
- (2)
- Establish evaluation grade and standard. The assessment level and classification standard of indicators are determined on the basis of obtained data and expert suggestions.
- (3)
- Derive traditional evaluation results based on entropy weight method and modified SPA.
- (4)
- Initialize the parameters in ICS and LSSVM algorithm and optimize the parameters in LSSVM via ICS. The key parameters of LSSVM have a crucial impact on the estimation precision. Therefore, this study utilizes ICS to search for the optimal parameters in LSSVM. If the conditions are satisfied, the optimal parameters are acquired. Through training and testing, the final evaluation model for sustainable development of the PV industry in the countries along the Belt and Road is established.
- (5)
- Output intelligent assessment results. This study carries out the simulation according to the proposed intelligent technique to assess the sustainability of the PV industry along the Belt and Road. Additionally, the intelligent evaluation results are compared with the traditional ones here.
5. Experimental Study
5.1. Classification and Standardization of Evaluation Indexes
The assessment indicators are classified as illustrated in Table 2, which offers the basis of data standardization. Classification I divides the indicators into maximal and minimal ones, while Classification II separates the indexes into quantitative and qualitative ones.
Table 2.
Classification results of indicators.
In this study, 15 countries are selected, including Indonesia, Singapore, Malaysia, Thailand and Saudi Arabia. The experimental data are derived from expert scoring method along with actual data analysis. Table 3 exhibits the standardization results in accordance with Equations (30) and (31).
Table 3.
Data standardization.
5.2. Evaluation Grade and Standard
Considering the assessment indicators on the sustainability of PV industry along the Belt and Road and specialist recommendations, the evaluation grades are divided into three levels, namely good, general and bad. Table 4 lists the classification standard.
Table 4.
Positive and negative solutions.
5.3. Traditional Evaluation Using Entropy Weight and Modified SPA
Table 5 manifests the weight calculated via the entropy weight approach.
Table 5.
Indicator weight.
The connection degree of three levels are acquired through SPA as follows:
Table 6 and Table 7 show the comprehensive connection degree and relative membership degree, respectively. Besides, the eigenvalues and ranking of the evaluated countries are displayed in Table 8 and Figure 2.
Table 6.
Comprehensive connection degree.
Table 7.
Relative membership degree.
Table 8.
Eigenvalue and ranking.
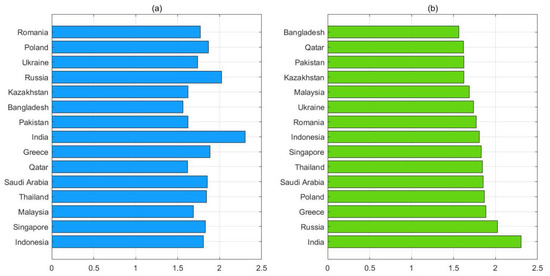
Figure 2.
Results of eigenvalues. Note: (a) shows the disordered eigenvalues; (b) shows the ranking results.
It can be seen that the assessment results of eight countries, namely Indonesia, Singapore, Thailand, Saudi Arabia, Greece, India, Russia and Poland are superior to the average level. India presents the optimal PV industry sustainability and is followed by Russia; their eigenvalues are both higher than 2. It is worth noting that the GDP of India is the highest at USD 2868.9 billion while Russia ranks second with a GDP of USD 1700 billion. Furthermore, these two countries also have advantages in total primary energy consumption, renewable energy consumption, total power generation and PV power generation. Hence, strong economic strength and adequate resources play an important part in the sustainable development of the PV industry, which also explains why the sustainability levels of the other six countries are better than the average value.
As for the countries with worse-than-average sustainability, the prime influential factors that restrict the sustainable growth of the PV industry are backward economy, total renewable energy consumption and PV power generation. It should be pointed out that human activities and natural forces have an impact on the trend of these complicated and nonlinear indicators, which brings about uncertainty together with temporal and spatial differences. Therefore, countries along the Belt and Road should be classified to enhance the sustainability of the PV industry. Meanwhile, the effectiveness of this established model based on modified SPA is verified in this study. It also provides a reference for sustainability estimation of the PV industry in other countries.
5.4. Intelligent Evaluation Based on ICS-LSSVM and Comparative Analysis
Here, the data of 5 countries, namely Kazakhstan, Russia, Ukraine, Poland and Romania, are taken as test samples while the other 10 countries are selected as training samples. Simultaneously, four assessment techniques, namely ICS-LSSVM, CS-LSSVM, LSSVM and SVM, are involved in this study to make a comparison. The estimation results of the test samples are exhibited in Table 9 and Figure 3.
Table 9.
Estimation results of the test samples.
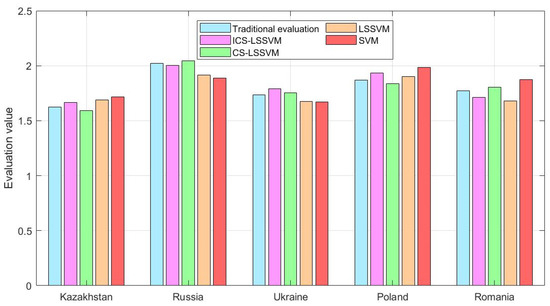
Figure 3.
Comparison of estimation results.
As displayed in Figure 3 and Table 4, the evaluation result derived from ICS-LSSVM is the closest to the traditional assessment value. The accuracy and stability of the intelligent estimation approach have been proved in this study. In contrast with SVM, the estimation values of LSSVM are closer to the conventional ones. The cause lies in the fact that LSSVM employs kernel function to transform prediction problems into equations. The precision and classification capability of LSSVM is superior, especially in coping with unstable data.
Figure 4 illustrates the relative errors of the four techniques. It can be found that ICS-LSSVM has the strongest fitting and learning ability. The number of relative errors ranging in [−3%, 3%] of ICS-LSSVM, CS-LSSVM, LSSVM and SVM is equivalent to 5, 2, 1 and 0, respectively. There exist two countries in ICS-LSSVM and only one country in CS-LSSVM with a relative error within [−1%, 1%]. In line with the absolute value, the maximum of relative errors is −2.05%, 3.67, −5.26% and −6.59% for ICS-LSSVM, CS-LSSVM, LSSVM and SVM, respectively, while the corresponding minimum of relative errors is 0.87%, −0.97%, 1.86% and −3.68%. The study demonstrates that the proposed approach has the strongest nonlinear fitting ability together with the most satisfactory accuracy and robustness.
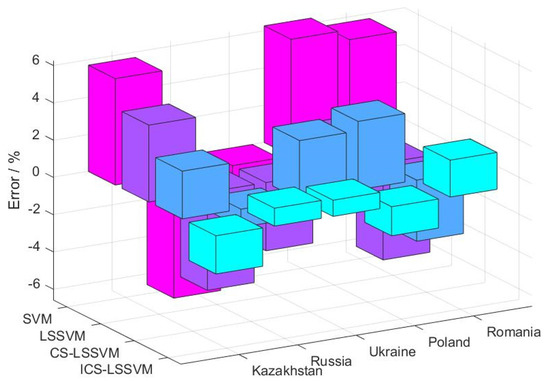
Figure 4.
Comparison of relative errors.
To sum up, this paper introduces ICS to fine-tune the parameters in LSSVM so as to reduce the evaluation errors. The experimental study verifies the effectiveness and stability of the established model. Simultaneously, intelligent assessment approaches have advantages in workload reduction, efficiency improvement and rapid calculation.
6. Conclusions
In order to guarantee the sustainable development of the PV industry along the Belt and Road, in this study, assessment indicators were selected from five aspects, namely economy, politics, society, ecological environment and resources, based on the principles of sustainability, systematization and pragmatism. Then, the variable fuzzy set coupling evaluation theory was employed to modify the SPA process considering the multiscale fuzzy relationship between indicators and grade standards. This traditional assessment method is conducive to acquiring exact results. Additionally, this study established a novel technique integrating ICS with LSSVM where random weight is utilized to modify CS. The intelligent evaluation model built in this study was shown to have the strongest fitting and learning ability; the relative errors all fluctuate in the range of [−3%, 3%], and the relative errors of two countries are in the range of [−1%, 1%]. Based on this fast and accurate calculation, this paper not only offers new ideas for rapid and effective sustainability estimation, but also provides a reference for the sustainable growth strategy of the PV industry in the countries along the Belt and Road. The constructed index system and evaluation model can solve the problems considered in this paper and are also applicable to the sustainability evaluation of the PV industry in other countries or regions. The study presents a certain degree of generalizability.
Author Contributions
Conceptualization, Y.L.; methodology, H.W.; software, H.W.; validation, Y.L.; formal analysis, H.W.; investigation, H.W.; resources, Y.L.; data curation, H.W.; writing—original draft preparation, Y.L. and H.W.; writing—review and editing, H.W.; visualization, Y.L.; supervision, Y.L. All authors have read and agreed to the published version of the manuscript.
Funding
This work is supported by Natural Science Foundation of Hebei Province, China (Project No. G2020403008).
Institutional Review Board Statement
Not applicable.
Informed Consent Statement
Informed consent was obtained from all subjects involved in the study.
Data Availability Statement
Not applicable.
Conflicts of Interest
The authors declare no conflict of interest.
Abbreviations
| AHP | Analytic hierarchy process |
| ANN | Artificial neural network |
| CS | Cuckoo search algorithm |
| CSDIS | Chinese sustainable development index system |
| GDP | Gross domestic product |
| HDI | Human development index |
| ICS | Improved cuckoo search algorithm |
| LSSVM | Least squares support vector machine |
| PV | Photovoltaic |
| SPA | Set pair analysis |
| SVM | Support vector machine |
| VFSM | Variable fuzzy set method |
References
- Zhang, Z.; Du, E.; Teng, F.; Zhang, N.; Kang, C. Modeling Frequency Dynamics in Unit Commitment with a High Share of Renewable Energy. IEEE Trans. Power Syst. 2020, 35, 4383–4395. [Google Scholar] [CrossRef]
- Zhou, N.; Wu, Q.; Hu, X.; Xu, D.; Wang, X. Evaluation of Chinese natural gas investment along the Belt and Road Initiative using super slacks-based measurement of efficiency method. Resour. Policy 2020, 67, 101668. [Google Scholar] [CrossRef]
- Jing, S.; Zhihui, L.; Jinhua, C.; Zhiyao, S. China’s renewable energy trade potential in the "Belt-and-Road" countries: A gravity model analysis. Renew. Energy 2020, 161, 1025–1035. [Google Scholar] [CrossRef]
- Shuai, J.; Chen, C.F.; Cheng, J.; Leng, Z.; Wang, Z. Are China’s solar PV products competitive in the context of the Belt and Road Initiative? Energy Policy 2018, 120, 559–568. [Google Scholar] [CrossRef]
- Ma, Z. Research on Sustainable Evaluation of Poverty Alleviation Governance at County Level in China Based on Survey Data of 86 Counties. Chin. Stud. 2020, 9, 83–95. [Google Scholar] [CrossRef]
- Zhang, C.; Chen, S.; Qiao, H.; Dong, L.; Huang, Z.; Ou, C. Study on Sustainability Evaluation of Small Hydropower in Countries along “Belt and Road”. Sci. Technol. Manag. Res. 2019, 18, 41–52. [Google Scholar]
- Devika, K.; Sahar, M.; Mostafayi, D.S.; Ahmadreza, A. A hybrid approach based on MCDM methods and Monte Carlo simulation for sustainable evaluation of potential solar sites in east of Iran. J. Clean. Prod. 2021, 279, 122368. [Google Scholar]
- Wei, J.F.; Ding, Z.W.; Meng, Y.W.; Li, Q. Regional Sustainable Assessment at City Level Based on CSDIS (China Sustainable Development Indicator System) Concept in the New Era, China. Chin. Geogr. Sci. 2020, 30, 976–992. [Google Scholar] [CrossRef]
- Fournier, G.; Boos, A.; Wörner, R.; Jaroudi, I.; Morozova, I.; Nemoto, E.H. Substituting individual mobility by mobility on demand using autonomous vehicles—A sustainable assessment simulation of Berlin and Stuttgart. Int. J. Automot. Technol. Manage 2020, 20, 369–407. [Google Scholar] [CrossRef]
- Song, J.; Zhao, Z.; Zhang, Y. Study on Enterprise Competitive Intelligence Evaluation Based on Mixed Uncertain Attribute Group Decision-making. IOP Conf. Ser. Mater. Sci. Eng. 2020, 790, 012101. [Google Scholar] [CrossRef]
- Feng, H. AHP-Based Evaluation of Port Logistics Transportation Efficiency. J. Coast. Res. 2020, 106, 477–480. [Google Scholar] [CrossRef]
- Chu, X.; Wang, J.; Wu, F.; Luo, Y.; Wang, W.; Li, Y. Simulink-Based Modeling and PCA-Based Nonlinearity Evaluation for High-Speed Links. IEEE Trans. Electromagn. Compat. 2020, 62, 1386–1397. [Google Scholar] [CrossRef]
- Niu, D.; Liang, Y.; Hong, W.-C. Wind speed forecasting based on EMD and GRNN optimized by FOA. Energies 2017, 10, 2001. [Google Scholar] [CrossRef]
- Ameri, A.A.; Pourghasemi, H.R.; Cerda, A. Erodibility prioritization of sub-watersheds using morphometric parameters analysis and its mapping: A comparison among TOPSIS, VIKOR, SAW, and CF multi-criteria decision making models. Sci. Total Environ. 2018, 613, 1385–1400. [Google Scholar] [CrossRef] [PubMed]
- Jin, J.; Zhu, L.; Li, Z.H.; Tong, X.H.; Yang, C.W. Application of Variable Structure of BPNN in Risk Evaluation of Overseas Railway Construction in Target Countries. Tiedao Xuebao 2018, 40, 7–12. [Google Scholar]
- Güdücü, C.; Olcay, B.O.; Schäfer, L.; Aziz, M.; Schriever, V.A.; Özgören, M.; Hummel, T. Separating Normosmic and Anosmic Patients Based on Entropy Evaluation of Olfactory Event-Related Potentials. Brain Res. 2019, 1708, 78–83. [Google Scholar] [CrossRef] [PubMed]
- Zhao, C.; Wang, L.; Zhang, X. Service agent networks in cloud manufacturing: Modeling and evaluation based on set-pair analysis. Robot. Com-Int. Manuf. 2020, 65, 101970. [Google Scholar] [CrossRef]
- Yan, F.; Liu, L.; Zhang, Y.; Chen, M.; Chen, N. The Research of Dynamic Variable Fuzzy Set Assessment Model in Water Quality Evaluation. Water Resour. Manage 2016, 30, 63–78. [Google Scholar] [CrossRef]
- Liang, Y.; Niu, D.X.; Hong, W.C. Short Term Load Forecasting Based on Feature Extraction and Improved General Regression Neural Network model. Energy 2019, 166, 653–663. [Google Scholar] [CrossRef]
- Hu, B. Application of Evaluation Algorithm for Port Logistics Park Based on PCA-SVM Model. Pol. Marit. Res. 2018, 25, 29–35. [Google Scholar] [CrossRef]
- Torija, A.J.; Ruiz, D.P.; Ramos-Ridao, A.F. A tool for urban soundscape evaluation applying Support Vector Machines for developing a soundscape classification model. Sci. Total Environ. 2014, 482–483, 440–451. [Google Scholar] [CrossRef] [PubMed]
- Ahmadi, M.H.; Baghban, A.; Sadeghzadeh, M.; Zamen, M. Evaluation of electrical efficiency of photovoltaic thermal solar collector. Eng. App. Comp. Fluid Mech. 2020, 14, 545–565. [Google Scholar] [CrossRef]
- Wang, H.; Liang, Y.; Ding, W. The Improved Least Square Support Vector Machine Based on Wolf Pack Algorithm and Data Inconsistency Rate for Cost Prediction of Substation Projects. Math. Probl. Eng. 2020, 6, 1–14. [Google Scholar]
- Ge, Q.; Guo, C.; Jiang, H.; Lu, Z.; Yao, G.; Zhang, J.; Hua, Q. Industrial Power Load Forecasting Method Based on Reinforcement Learning and PSO-LSSVM. IEEE Trans. Cybern. 2020, 1–13. [Google Scholar] [CrossRef] [PubMed]
- Gandomi, A.H.; Yang, X.S.; Alavi, A.H. Erratum to: Cuckoo search algorithm: A metaheuristic approach to solve structural optimization problems. Eng. Comput. 2013, 29, 245. [Google Scholar] [CrossRef]
- Wang, R.Q.; Jiao, Y.C. Synthesis of Sparse Linear Arrays With Reduced Excitation Control Numbers Using a Hybrid Cuckoo Search Algorithm With Convex Programming. IEEE Antennas Wirel. Propag. Lett. 2020, 19, 428–432. [Google Scholar] [CrossRef]
- Chen, Y.; Wang, N. Cuckoo search algorithm with explosion operator for modeling proton exchange membrane fuel cells. Int. J. Hydrog. Energy 2019, 44, 3075–3087. [Google Scholar] [CrossRef]
- Kienzle, J.; Mussbacher, G.; Combemale, B.; Bastin, L. Toward model-driven sustainability evaluation. Commun. ACM 2020, 63, 80–91. [Google Scholar] [CrossRef]
- Han, M.; Lao, J.; Yao, Q.; Zhang, B.; Meng, J. Carbon inequality and economic development across the Belt and Road regions. J. Environ. Manage 2020, 262, 110250. [Google Scholar] [CrossRef]
- Khan, A.; Yang, C.; Khan, G.; Muhammad, F. The dilemma of natural disasters: Impact on economy, fiscal position, and foreign direct investment alongside Belt and Road Initiative countries. Sci. Total Environ. 2020, 743, 140578. [Google Scholar] [CrossRef]
- Lei, Y.; Lu, X.; Shi, M.; Wang, L.; Lv, H.; Chen, S.; Hu, C.; Yu, Q.; da Silveira, S.D.H. SWOT analysis for the development of photovoltaic solar power in Africa in comparison with China. Environ. Impact Assess. Rev. 2019, 77, 122–127. [Google Scholar] [CrossRef]
- Lv, Q.; Wu, Z. Evaluation of Economic Vitality of Beijing and Analysis of Influencing Factors—Based on Entropy Method and Grey Correlation Analysis Model. Open J. Soc. Sci. 2020, 08, 445–453. [Google Scholar] [CrossRef][Green Version]
- Wu, H.; Liu, S.; Sun, Y.; An, Y.; Dong, S.; Liu, G. Ecological security evaluation based on entropy matter-element model: A case study of Kunming city, southwest China. Ecol. Indic. 2019, 102, 469–478. [Google Scholar] [CrossRef]
- Wan, X.; Yang, T.; Zhang, Q.; Yan, X.; Hu, C.; Sun, L.; Zheng, Y. A novel comprehensive model of set pair analysis with extenics for river health evaluation and prediction of semi-arid basin—A case study of Wei River Basin, China. Sci. Total Environ. 2021, 775, 145845. [Google Scholar] [CrossRef]
- Chen, W.; Zhang, G.; Jiao, Y.; Wang, H. Unascertained Measure-Set Pair Analysis Model of Collapse Risk Evaluation in Mountain Tunnels and Its Engineering Application. KSCE J. Civil Eng. 2020, 25, 1–17. [Google Scholar]
- Sun, B.; Ma, W.; Chen, X. Variable precision multigranulation rough fuzzy set approach to multiple attribute group decision-making based on λ-similarity relation. Comput. Ind. Eng. 2019, 127, 326–343. [Google Scholar] [CrossRef]
- Arivudainambi, D.; Pavithra, R.; Kalyani, P. Cuckoo search algorithm for target coverage and sensor scheduling with adjustable sensing range in wireless sensor network. J. Discrete Math. Sci. Cryptog. 2020. [Google Scholar] [CrossRef]
- Liang, Y.; Niu, D.; Cao, Y.; Hong, W.-C. Analysis and modeling for China’s electricity demand forecasting using a hybrid method based on multiple regression and extreme learning machine: A view from carbon emission. Energies 2016, 9, 941. [Google Scholar] [CrossRef]
- Mittal, N.; Singh, S.; Singh, U.; Salgotra, R. Trust-aware energy-efficient stable clustering approach using fuzzy type-2 Cuckoo search optimization algorithm for wireless sensor networks. Wirel. Netw. 2021, 27, 151–174. [Google Scholar] [CrossRef]
- Ma, W.L.; Liu, H. Classification method based on the deep structure and least squares support vector machine. Electron. Lett. 2020, 56, 538–541. [Google Scholar] [CrossRef]
- Liang, Y.; Dongxiao, N.; Minquan, Y. Short-term load forecasting based on wavelet transform and least squares support vector machine optimized by improved cuckoo search. Energies 2016, 9, 827. [Google Scholar] [CrossRef]
Publisher’s Note: MDPI stays neutral with regard to jurisdictional claims in published maps and institutional affiliations. |
© 2021 by the authors. Licensee MDPI, Basel, Switzerland. This article is an open access article distributed under the terms and conditions of the Creative Commons Attribution (CC BY) license (https://creativecommons.org/licenses/by/4.0/).