
Using Improved SPA and ICS-LSSVM for Sustainability Assessment of PV Industry along the Belt and Road


Abstract
1. Introduction
- (1)
- The indicator system of sustainability evaluation on PV industry in countries along the Belt and Road is constructed from five aspects: economy, politics, society, ecological environment and resources, and the question of what the aspects of sustainability of the PV industry in countries along the Belt and Road are is answered.
- (2)
- The evaluation index weights are determined based on the entropy weight method, and the evaluation results are obtained by designing an improved SPA model from the perspective of the classical evaluation method.
- (3)
- The basic cuckoo algorithm is improved by using random weights, and the improved algorithm is used to optimize the LSSVM and establish an intelligent evaluation model. It provides decision support to promote the sustainable development of the PV industry in countries along the Belt and Road.
2. Index System
2.1. Establishment Principles
- (1)
- Sustainability: the promotion of PV power stations can not only acquire economic benefits, but also reduce poverty and promote social development on the premise of ecological protection. Thus, in index selection, it is necessary to take both protection and development into account.
- (2)
- Systematicness: the evaluation index system should be treated as a whole in order to interrelate the indicators and endue the system with rigorous structure and complete content.
- (3)
- Pragmatism: key factors should be selected and appropriate assessment standards should be set in line with the inherent development law of the PV industry and data availability.
2.2. Index Selection
2.3. Index Description
- (1)
- Gross domestic product (GDP) refers to the production activity achievement of all resident units in a country (or) region during a period of time, which is calculated in terms of the national market price. GDP is commonly recognized as the most appropriate indicator to measure a national economy. As a comprehensive statistical index in an accounting system, GDP reflects the economic strength and market scale in a country (or region).
- (2)
- Per capita GDP equals the ratio of GDP in a country or region during the accounting period (usually one year) to the corresponding permanent population.
- (3)
- GDP growth rate stands for the annual increasing ratio calculated via GDP at a comparable price.
- (4)
- Political stability is affected by regime change, ethnic contradictions and so on.
- (5)
- National political openness represents the openness scale and level of a country to other countries in politics.
- (6)
- Support of national policies for the PV industry indicates the relevant policies in a country aimed at PVs.
- (7)
- National perception index takes entrepreneurs, risk analysts and general public as survey objects to assess the integrity and bribery of government officials.
- (8)
- Urbanization rate generally utilizes demographic indicators, namely the proportion of urban population in the total population (including agriculture and non-agriculture).
- (9)
- Human development index (HDI) is a comprehensive indicator obtained from three basic variables, namely life expectancy, education level and life quality.
- (10)
- Power supply and demand identify the electricity development in a country.
- (11)
- CO2 emissions equal the gross carbon emission in a country.
- (12)
- Biodiversity can be judged via national representative species, threatened status and diverse habitat types.
- (13)
- Emphasis on environmental protection is chiefly determined by the formulation and implementation of related policy.
- (14)
- Solar radiation conditions incorporate the amount of solar radiation, sunshine hours and peak sunshine hours.
- (15)
- Meteorological conditions refer to various hydrothermal states. This study mainly analyzes annual average wind speed, annual average wind speed, historical maximum instantaneous wind speed, annual average temperature, extreme maximum temperature, extreme minimum temperature, annual average rainfall, annual average relative humidity, annual frost-free period, annual average evaporation, annual thunderstorm days and special climate impact in the construction sites of PV generation projects.
- (16)
- Engineering geological conditions comprise basic geological structure, underground hydrological conditions and negative impacts.
- (17)
- Total primary energy consumption represents the amount of primary energy consumed by a country or region during a certain period of time.
- (18)
- Per capita consumption of primary energy is equivalent to the ratio of primary energy consumption to the corresponding permanent population in a country or region during the accounting period (usually one year).
- (19)
- Renewable energy consumption equals the amount consumed by a country or region in a certain period of time.
- (20)
- Total power generation includes thermal power, hydropower, nuclear energy and other modes (such as geothermal power, PV, wind, tidal power and bioenergy) from all electricity industry plants, self-owned power plants and rural small electric stations.
- (21)
- PV power generation identifies total electricity generated from PV stations.
- (22)
- Proportion of PV power generation equals the ratio of PV electricity generation to gross amount in a country.
3. Methodology
3.1. Entropy Weight
- (1)
- Establishment of standardized judgment matrix
- (2)
- Information entropy calculation of each indexif fij = 0,
- (3)
- Index weightwhere .
3.2. Modified SPA
- (1)
- Determine the evaluation index and estimation grade as and , respectively, where and equal the number of indicators and grades.
- (2)
- In virtue of basic principles of SPA [34], set as the set pair and conduct analysis from the perspective of identity, discrepancy and opposition. The connection degree between grade and the -th sample in index is calculated as follows:where represent the degree of identity, discrepancy and opposition, respectively. . is the discrepancy coefficient determined based on research object;. is the opposition coefficient; .
- (3)
- The connection degree between -th sample and assessment grade is acquired on the foundation of and [34].where is the weight of -th index. . If approximates −1, it indicates the consistency between -th sample and assessment grade is small. If approximates 1, it demonstrates the consistency is great.
- (4)
- The relative membership is computed between -th sample and evaluation grade where is deemed as the relative difference in VFSM [36].
3.3. Improved CS (ICS)
3.3.1. CS
- (1)
- Brood parasitism behavior
- (2)
- Levy flight
3.3.2. Improved CS
3.4. LSSVM
4. Evaluation Method Combining Modified SPA with ICS-LSSVM
- (1)
- Implement index classification and standardization. This paper applies the targeting standardization method for different indicators to transform them with the same nature. The indexes involved in this study mainly incorporate the minimal and maximal types. Besides, they can also be divided into quantitative and qualitative indicators.
- (2)
- Establish evaluation grade and standard. The assessment level and classification standard of indicators are determined on the basis of obtained data and expert suggestions.
- (3)
- Derive traditional evaluation results based on entropy weight method and modified SPA.
- (4)
- Initialize the parameters in ICS and LSSVM algorithm and optimize the parameters in LSSVM via ICS. The key parameters of LSSVM have a crucial impact on the estimation precision. Therefore, this study utilizes ICS to search for the optimal parameters in LSSVM. If the conditions are satisfied, the optimal parameters are acquired. Through training and testing, the final evaluation model for sustainable development of the PV industry in the countries along the Belt and Road is established.
- (5)
- Output intelligent assessment results. This study carries out the simulation according to the proposed intelligent technique to assess the sustainability of the PV industry along the Belt and Road. Additionally, the intelligent evaluation results are compared with the traditional ones here.
5. Experimental Study
5.1. Classification and Standardization of Evaluation Indexes
5.2. Evaluation Grade and Standard
5.3. Traditional Evaluation Using Entropy Weight and Modified SPA
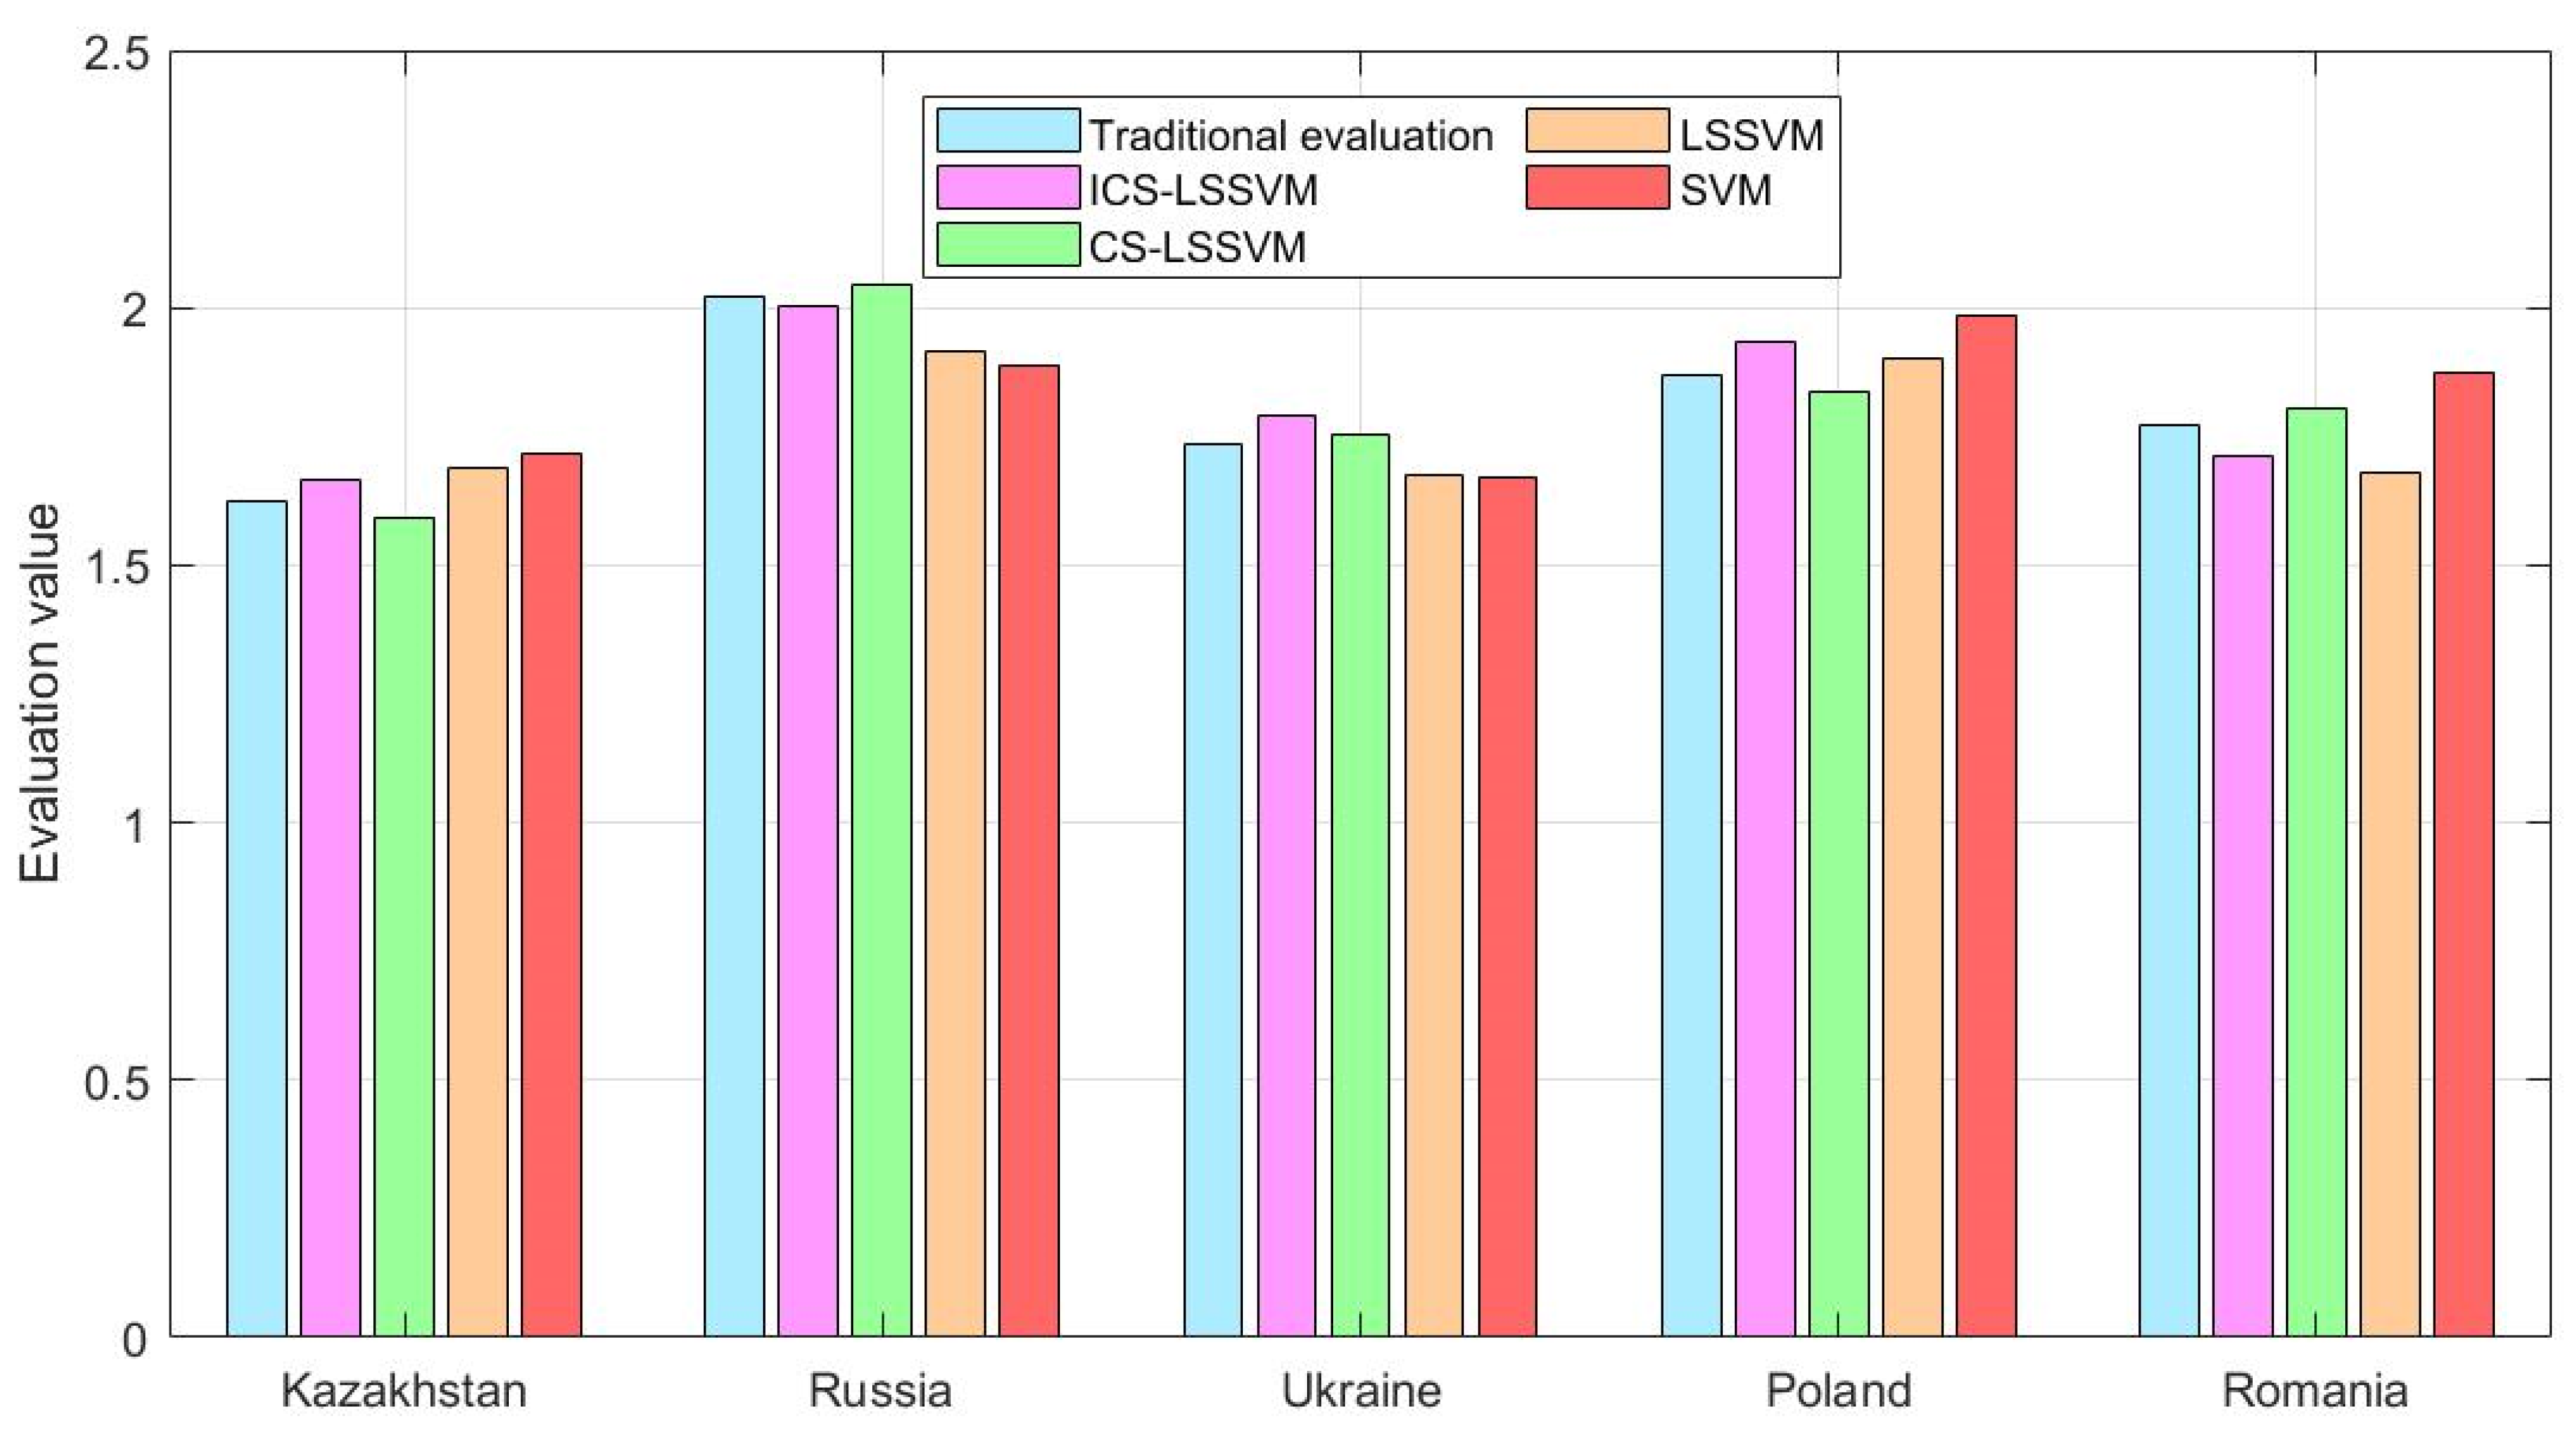
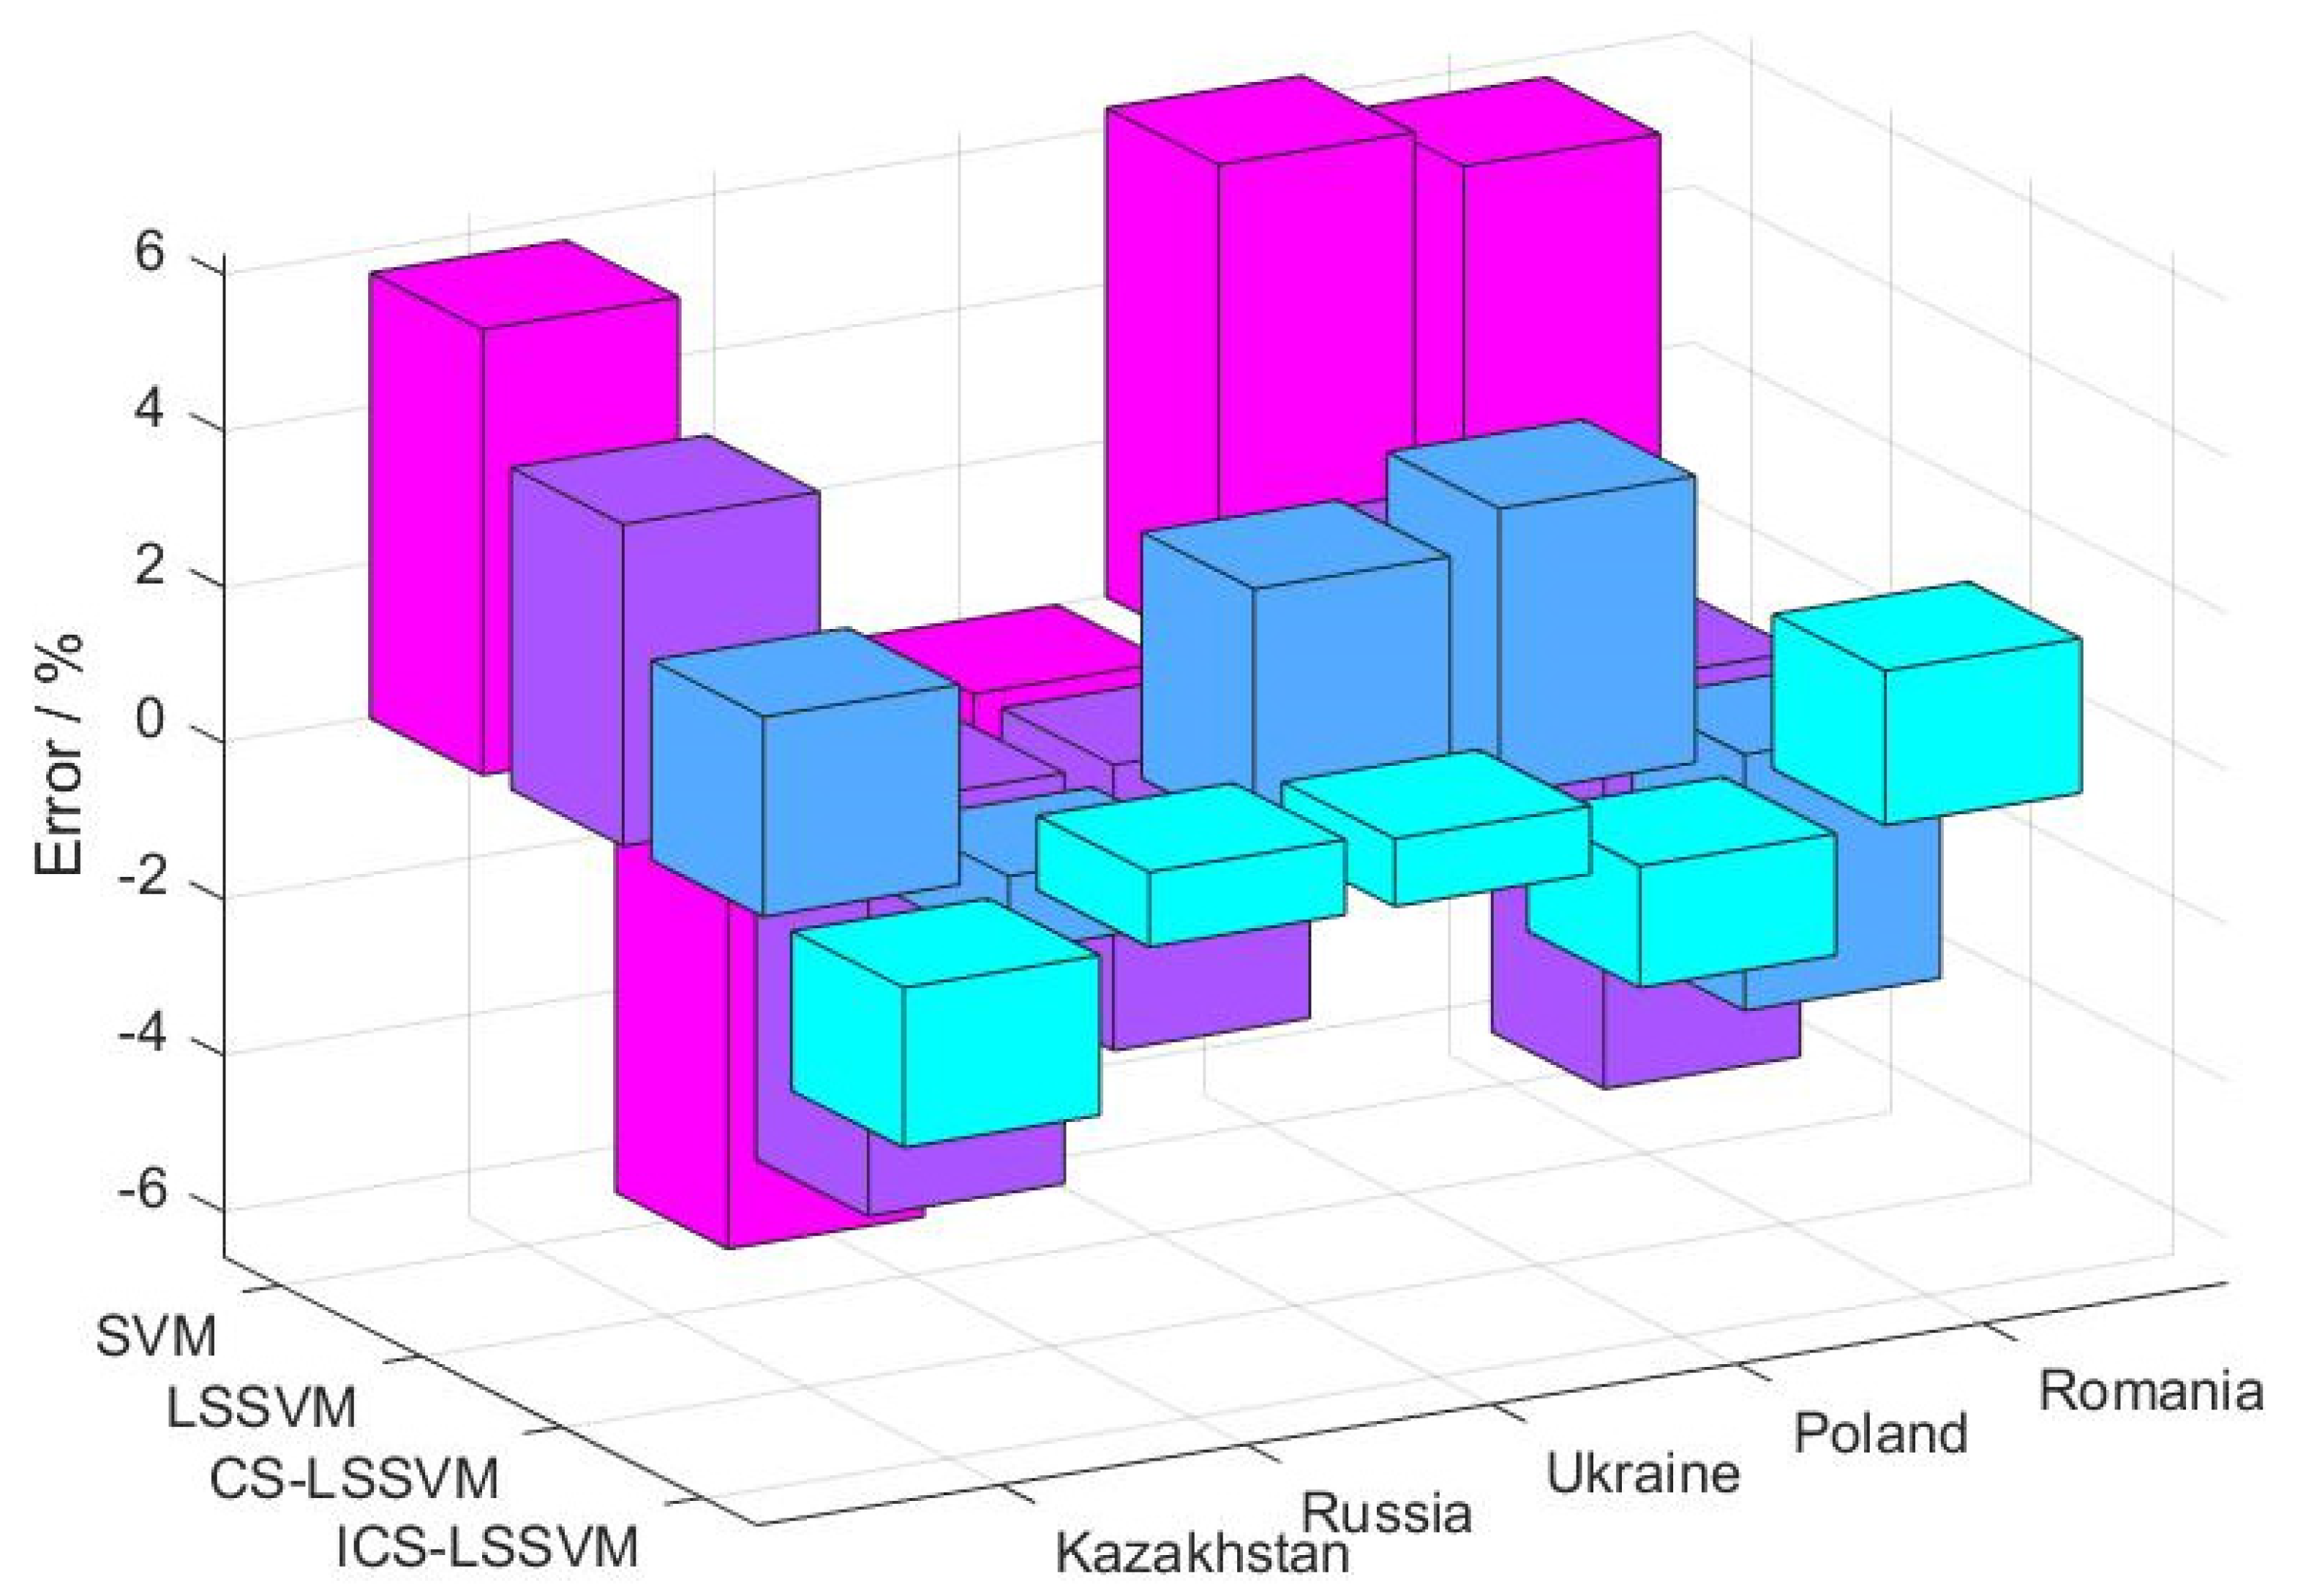
5.4. Intelligent Evaluation Based on ICS-LSSVM and Comparative Analysis
6. Conclusions
Author Contributions
Funding
Institutional Review Board Statement
Informed Consent Statement
Data Availability Statement
Conflicts of Interest
Abbreviations
| AHP | Analytic hierarchy process |
| ANN | Artificial neural network |
| CS | Cuckoo search algorithm |
| CSDIS | Chinese sustainable development index system |
| GDP | Gross domestic product |
| HDI | Human development index |
| ICS | Improved cuckoo search algorithm |
| LSSVM | Least squares support vector machine |
| PV | Photovoltaic |
| SPA | Set pair analysis |
| SVM | Support vector machine |
| VFSM | Variable fuzzy set method |
References
- Zhang, Z.; Du, E.; Teng, F.; Zhang, N.; Kang, C. Modeling Frequency Dynamics in Unit Commitment with a High Share of Renewable Energy. IEEE Trans. Power Syst. 2020, 35, 4383–4395. [Google Scholar] [CrossRef]
- Zhou, N.; Wu, Q.; Hu, X.; Xu, D.; Wang, X. Evaluation of Chinese natural gas investment along the Belt and Road Initiative using super slacks-based measurement of efficiency method. Resour. Policy 2020, 67, 101668. [Google Scholar] [CrossRef]
- Jing, S.; Zhihui, L.; Jinhua, C.; Zhiyao, S. China’s renewable energy trade potential in the "Belt-and-Road" countries: A gravity model analysis. Renew. Energy 2020, 161, 1025–1035. [Google Scholar] [CrossRef]
- Shuai, J.; Chen, C.F.; Cheng, J.; Leng, Z.; Wang, Z. Are China’s solar PV products competitive in the context of the Belt and Road Initiative? Energy Policy 2018, 120, 559–568. [Google Scholar] [CrossRef]
- Ma, Z. Research on Sustainable Evaluation of Poverty Alleviation Governance at County Level in China Based on Survey Data of 86 Counties. Chin. Stud. 2020, 9, 83–95. [Google Scholar] [CrossRef]
- Zhang, C.; Chen, S.; Qiao, H.; Dong, L.; Huang, Z.; Ou, C. Study on Sustainability Evaluation of Small Hydropower in Countries along “Belt and Road”. Sci. Technol. Manag. Res. 2019, 18, 41–52. [Google Scholar]
- Devika, K.; Sahar, M.; Mostafayi, D.S.; Ahmadreza, A. A hybrid approach based on MCDM methods and Monte Carlo simulation for sustainable evaluation of potential solar sites in east of Iran. J. Clean. Prod. 2021, 279, 122368. [Google Scholar]
- Wei, J.F.; Ding, Z.W.; Meng, Y.W.; Li, Q. Regional Sustainable Assessment at City Level Based on CSDIS (China Sustainable Development Indicator System) Concept in the New Era, China. Chin. Geogr. Sci. 2020, 30, 976–992. [Google Scholar] [CrossRef]
- Fournier, G.; Boos, A.; Wörner, R.; Jaroudi, I.; Morozova, I.; Nemoto, E.H. Substituting individual mobility by mobility on demand using autonomous vehicles—A sustainable assessment simulation of Berlin and Stuttgart. Int. J. Automot. Technol. Manage 2020, 20, 369–407. [Google Scholar] [CrossRef]
- Song, J.; Zhao, Z.; Zhang, Y. Study on Enterprise Competitive Intelligence Evaluation Based on Mixed Uncertain Attribute Group Decision-making. IOP Conf. Ser. Mater. Sci. Eng. 2020, 790, 012101. [Google Scholar] [CrossRef]
- Feng, H. AHP-Based Evaluation of Port Logistics Transportation Efficiency. J. Coast. Res. 2020, 106, 477–480. [Google Scholar] [CrossRef]
- Chu, X.; Wang, J.; Wu, F.; Luo, Y.; Wang, W.; Li, Y. Simulink-Based Modeling and PCA-Based Nonlinearity Evaluation for High-Speed Links. IEEE Trans. Electromagn. Compat. 2020, 62, 1386–1397. [Google Scholar] [CrossRef]
- Niu, D.; Liang, Y.; Hong, W.-C. Wind speed forecasting based on EMD and GRNN optimized by FOA. Energies 2017, 10, 2001. [Google Scholar] [CrossRef]
- Ameri, A.A.; Pourghasemi, H.R.; Cerda, A. Erodibility prioritization of sub-watersheds using morphometric parameters analysis and its mapping: A comparison among TOPSIS, VIKOR, SAW, and CF multi-criteria decision making models. Sci. Total Environ. 2018, 613, 1385–1400. [Google Scholar] [CrossRef] [PubMed]
- Jin, J.; Zhu, L.; Li, Z.H.; Tong, X.H.; Yang, C.W. Application of Variable Structure of BPNN in Risk Evaluation of Overseas Railway Construction in Target Countries. Tiedao Xuebao 2018, 40, 7–12. [Google Scholar]
- Güdücü, C.; Olcay, B.O.; Schäfer, L.; Aziz, M.; Schriever, V.A.; Özgören, M.; Hummel, T. Separating Normosmic and Anosmic Patients Based on Entropy Evaluation of Olfactory Event-Related Potentials. Brain Res. 2019, 1708, 78–83. [Google Scholar] [CrossRef] [PubMed]
- Zhao, C.; Wang, L.; Zhang, X. Service agent networks in cloud manufacturing: Modeling and evaluation based on set-pair analysis. Robot. Com-Int. Manuf. 2020, 65, 101970. [Google Scholar] [CrossRef]
- Yan, F.; Liu, L.; Zhang, Y.; Chen, M.; Chen, N. The Research of Dynamic Variable Fuzzy Set Assessment Model in Water Quality Evaluation. Water Resour. Manage 2016, 30, 63–78. [Google Scholar] [CrossRef]
- Liang, Y.; Niu, D.X.; Hong, W.C. Short Term Load Forecasting Based on Feature Extraction and Improved General Regression Neural Network model. Energy 2019, 166, 653–663. [Google Scholar] [CrossRef]
- Hu, B. Application of Evaluation Algorithm for Port Logistics Park Based on PCA-SVM Model. Pol. Marit. Res. 2018, 25, 29–35. [Google Scholar] [CrossRef]
- Torija, A.J.; Ruiz, D.P.; Ramos-Ridao, A.F. A tool for urban soundscape evaluation applying Support Vector Machines for developing a soundscape classification model. Sci. Total Environ. 2014, 482–483, 440–451. [Google Scholar] [CrossRef] [PubMed]
- Ahmadi, M.H.; Baghban, A.; Sadeghzadeh, M.; Zamen, M. Evaluation of electrical efficiency of photovoltaic thermal solar collector. Eng. App. Comp. Fluid Mech. 2020, 14, 545–565. [Google Scholar] [CrossRef]
- Wang, H.; Liang, Y.; Ding, W. The Improved Least Square Support Vector Machine Based on Wolf Pack Algorithm and Data Inconsistency Rate for Cost Prediction of Substation Projects. Math. Probl. Eng. 2020, 6, 1–14. [Google Scholar]
- Ge, Q.; Guo, C.; Jiang, H.; Lu, Z.; Yao, G.; Zhang, J.; Hua, Q. Industrial Power Load Forecasting Method Based on Reinforcement Learning and PSO-LSSVM. IEEE Trans. Cybern. 2020, 1–13. [Google Scholar] [CrossRef] [PubMed]
- Gandomi, A.H.; Yang, X.S.; Alavi, A.H. Erratum to: Cuckoo search algorithm: A metaheuristic approach to solve structural optimization problems. Eng. Comput. 2013, 29, 245. [Google Scholar] [CrossRef]
- Wang, R.Q.; Jiao, Y.C. Synthesis of Sparse Linear Arrays With Reduced Excitation Control Numbers Using a Hybrid Cuckoo Search Algorithm With Convex Programming. IEEE Antennas Wirel. Propag. Lett. 2020, 19, 428–432. [Google Scholar] [CrossRef]
- Chen, Y.; Wang, N. Cuckoo search algorithm with explosion operator for modeling proton exchange membrane fuel cells. Int. J. Hydrog. Energy 2019, 44, 3075–3087. [Google Scholar] [CrossRef]
- Kienzle, J.; Mussbacher, G.; Combemale, B.; Bastin, L. Toward model-driven sustainability evaluation. Commun. ACM 2020, 63, 80–91. [Google Scholar] [CrossRef]
- Han, M.; Lao, J.; Yao, Q.; Zhang, B.; Meng, J. Carbon inequality and economic development across the Belt and Road regions. J. Environ. Manage 2020, 262, 110250. [Google Scholar] [CrossRef]
- Khan, A.; Yang, C.; Khan, G.; Muhammad, F. The dilemma of natural disasters: Impact on economy, fiscal position, and foreign direct investment alongside Belt and Road Initiative countries. Sci. Total Environ. 2020, 743, 140578. [Google Scholar] [CrossRef]
- Lei, Y.; Lu, X.; Shi, M.; Wang, L.; Lv, H.; Chen, S.; Hu, C.; Yu, Q.; da Silveira, S.D.H. SWOT analysis for the development of photovoltaic solar power in Africa in comparison with China. Environ. Impact Assess. Rev. 2019, 77, 122–127. [Google Scholar] [CrossRef]
- Lv, Q.; Wu, Z. Evaluation of Economic Vitality of Beijing and Analysis of Influencing Factors—Based on Entropy Method and Grey Correlation Analysis Model. Open J. Soc. Sci. 2020, 08, 445–453. [Google Scholar] [CrossRef][Green Version]
- Wu, H.; Liu, S.; Sun, Y.; An, Y.; Dong, S.; Liu, G. Ecological security evaluation based on entropy matter-element model: A case study of Kunming city, southwest China. Ecol. Indic. 2019, 102, 469–478. [Google Scholar] [CrossRef]
- Wan, X.; Yang, T.; Zhang, Q.; Yan, X.; Hu, C.; Sun, L.; Zheng, Y. A novel comprehensive model of set pair analysis with extenics for river health evaluation and prediction of semi-arid basin—A case study of Wei River Basin, China. Sci. Total Environ. 2021, 775, 145845. [Google Scholar] [CrossRef]
- Chen, W.; Zhang, G.; Jiao, Y.; Wang, H. Unascertained Measure-Set Pair Analysis Model of Collapse Risk Evaluation in Mountain Tunnels and Its Engineering Application. KSCE J. Civil Eng. 2020, 25, 1–17. [Google Scholar]
- Sun, B.; Ma, W.; Chen, X. Variable precision multigranulation rough fuzzy set approach to multiple attribute group decision-making based on λ-similarity relation. Comput. Ind. Eng. 2019, 127, 326–343. [Google Scholar] [CrossRef]
- Arivudainambi, D.; Pavithra, R.; Kalyani, P. Cuckoo search algorithm for target coverage and sensor scheduling with adjustable sensing range in wireless sensor network. J. Discrete Math. Sci. Cryptog. 2020. [Google Scholar] [CrossRef]
- Liang, Y.; Niu, D.; Cao, Y.; Hong, W.-C. Analysis and modeling for China’s electricity demand forecasting using a hybrid method based on multiple regression and extreme learning machine: A view from carbon emission. Energies 2016, 9, 941. [Google Scholar] [CrossRef]
- Mittal, N.; Singh, S.; Singh, U.; Salgotra, R. Trust-aware energy-efficient stable clustering approach using fuzzy type-2 Cuckoo search optimization algorithm for wireless sensor networks. Wirel. Netw. 2021, 27, 151–174. [Google Scholar] [CrossRef]
- Ma, W.L.; Liu, H. Classification method based on the deep structure and least squares support vector machine. Electron. Lett. 2020, 56, 538–541. [Google Scholar] [CrossRef]
- Liang, Y.; Dongxiao, N.; Minquan, Y. Short-term load forecasting based on wavelet transform and least squares support vector machine optimized by improved cuckoo search. Energies 2016, 9, 827. [Google Scholar] [CrossRef]


| First-Grade | Second-Grade | Indexes |
|---|---|---|
| Economy | Gross domestic product (GDP) | x1 |
| Per capita GDP | x2 | |
| GDP growth rate | x3 | |
| Politics | Political stability | x4 |
| National political openness | x5 | |
| Support of national policies for PV industry | x6 | |
| National perception index | x7 | |
| Society | Urbanization rate | x8 |
| Human development index (HDI) | x9 | |
| Power supply and demand | x10 | |
| Ecological Environment | CO2 emissions | x11 |
| Biodiversity | x12 | |
| Emphasis on environmental protection | x13 | |
| Resources | Solar radiation conditions | x14 |
| Meteorological conditions | x15 | |
| Engineering geological conditions | x16 | |
| Total primary energy consumption | x17 | |
| Per capita consumption of primary energy | x18 | |
| Renewable energy consumption | x19 | |
| Total power generation | x20 | |
| PV power generation | x21 | |
| Proportion of PV power generation | x22 |
| Indexes | Classification I | Classification II |
|---|---|---|
| Gross domestic product (GDP) | maximal | quantitative |
| Per capita GDP | maximal | quantitative |
| GDP growth rate | maximal | quantitative |
| Political stability | maximal | qualitative |
| National political openness | maximal | qualitative |
| Support of national policies for PV industry | maximal | qualitative |
| National perception index | maximal | qualitative |
| Urbanization rate | maximal | quantitative |
| Human development index (HDI) | maximal | quantitative |
| Power supply and demand | maximal | qualitative |
| CO2 emissions | minimal | quantitative |
| Biodiversity | maximal | qualitative |
| Emphasis on environmental protection | maximal | qualitative |
| Solar radiation conditions | maximal | qualitative |
| Meteorological conditions | maximal | qualitative |
| Engineering geological conditions | maximal | qualitative |
| Total primary energy consumption | maximal | quantitative |
| Per capita consumption of primary energy | maximal | quantitative |
| Renewable energy consumption | maximal | quantitative |
| Total power generation | maximal | quantitative |
| PV power generation | maximal | quantitative |
| Proportion of PV power generation | maximal | quantitative |
| Index | Indonesia | Singapore | Malaysia | Thailand | Saudi Arabia | Qatar | Greece | India | Pakistan | Bengal | Kazakhstan | Russia | Ukraine | Poland | Romania |
|---|---|---|---|---|---|---|---|---|---|---|---|---|---|---|---|
| x1 | 0.3556 | 0.0804 | 0.0777 | 0.1436 | 0.2354 | 0.0081 | 0.0207 | 1.0000 | 0.0458 | 0.0548 | 0.0103 | 0.5695 | 0.0000 | 0.1628 | 0.0355 |
| x2 | 0.0446 | 1.0000 | 0.1584 | 0.1020 | 0.3418 | 0.9508 | 0.2861 | 0.0127 | 0.0000 | 0.0089 | 0.1334 | 0.1611 | 0.0371 | 0.2253 | 0.1819 |
| x3 | 0.6242 | 0.1092 | 0.5378 | 0.3037 | 0.0612 | 0.0000 | 0.2461 | 0.5234 | 0.1405 | 1.0000 | 0.5618 | 0.1825 | 0.4094 | 0.5666 | 0.5198 |
| x4 | 0.3667 | 0.9667 | 0.2667 | 0.0000 | 0.6000 | 0.6333 | 0.7333 | 0.6667 | 0.6333 | 0.5000 | 0.7667 | 1.0000 | 0.0000 | 0.8333 | 0.2667 |
| x5 | 0.2778 | 0.9444 | 0.4722 | 0.2222 | 0.0000 | 0.1944 | 0.9167 | 0.5000 | 1.0000 | 0.8056 | 0.7778 | 0.6667 | 0.5278 | 0.5278 | 0.5000 |
| x6 | 0.0000 | 0.7174 | 0.7391 | 0.8913 | 0.5217 | 0.2609 | 1.0000 | 0.7826 | 0.6304 | 0.6087 | 0.5435 | 0.2609 | 0.6957 | 0.3043 | 0.8261 |
| x7 | 0.0250 | 1.0000 | 0.1500 | 0.0250 | 0.0250 | 0.0000 | 0.4000 | 0.1000 | 0.4750 | 0.3000 | 0.2500 | 0.2000 | 0.5000 | 0.3500 | 0.2250 |
| x8 | 0.3030 | 1.0000 | 0.6212 | 0.2424 | 0.7576 | 0.9848 | 0.6818 | 0.0000 | 0.0455 | 0.0455 | 0.3485 | 0.6061 | 0.5303 | 0.3939 | 0.3030 |
| x9 | 0.4226 | 1.0000 | 0.6640 | 0.5774 | 0.7795 | 0.7638 | 0.8688 | 0.2310 | 0.0000 | 0.1969 | 0.7034 | 0.7008 | 0.5827 | 0.8478 | 0.7113 |
| x10 | 0.0000 | 1.0000 | 0.4516 | 0.3871 | 0.5484 | 0.2258 | 0.4194 | 0.6129 | 0.2903 | 0.0000 | 0.1290 | 0.8387 | 0.4194 | 0.9677 | 0.9355 |
| x11 | 0.7670 | 0.9384 | 0.9278 | 0.9041 | 0.7886 | 0.9867 | 0.9995 | 0.0000 | 0.9470 | 0.9851 | 0.9297 | 0.3933 | 0.9523 | 0.9031 | 1.0000 |
| x12 | 0.6429 | 0.6071 | 0.7857 | 0.6786 | 0.0000 | 0.0357 | 0.8214 | 0.8571 | 1.0000 | 0.4643 | 0.1786 | 0.9643 | 0.4286 | 0.8214 | 0.9286 |
| x13 | 0.4286 | 1.0000 | 0.6286 | 0.2857 | 0.1714 | 0.2286 | 0.9429 | 0.2000 | 0.0000 | 0.1714 | 0.2857 | 0.6000 | 0.2857 | 0.7714 | 0.7429 |
| x14 | 0.2727 | 0.6364 | 0.3939 | 0.5455 | 0.0606 | 0.4242 | 0.2727 | 0.2424 | 0.2727 | 0.8182 | 0.9394 | 1.0000 | 0.4848 | 0.0000 | 0.7576 |
| x15 | 0.8250 | 0.7000 | 0.0000 | 0.4750 | 0.3500 | 0.4750 | 0.9250 | 0.9500 | 1.0000 | 0.5500 | 0.0000 | 0.5750 | 0.6000 | 0.1250 | 0.0500 |
| x16 | 0.2326 | 0.0930 | 0.1395 | 0.0698 | 0.0465 | 0.6744 | 0.4186 | 0.0000 | 0.2791 | 0.6744 | 0.3953 | 0.6744 | 1.0000 | 0.6744 | 0.4186 |
| x17 | 0.2358 | 0.0729 | 0.0945 | 0.1355 | 0.3005 | 0.0264 | 0.0000 | 1.0000 | 0.0732 | 0.0185 | 0.0593 | 0.8709 | 0.0687 | 0.0951 | 0.0067 |
| x18 | 0.0314 | 0.8540 | 0.1743 | 0.0992 | 0.4424 | 1.0000 | 0.1402 | 0.0200 | 0.0080 | 0.0000 | 0.2222 | 0.2751 | 0.0947 | 0.1451 | 0.0853 |
| x19 | 0.3195 | 0.0041 | 0.0207 | 0.2365 | 0.0124 | 0.0000 | 0.0871 | 1.0000 | 0.0456 | 0.0000 | 0.0041 | 0.0124 | 0.0373 | 0.2033 | 0.0788 |
| x20 | 0.1526 | 0.0036 | 0.0811 | 0.0913 | 0.2045 | 0.0000 | 0.0011 | 1.0000 | 0.0581 | 0.0272 | 0.0396 | 0.7082 | 0.0701 | 0.0764 | 0.0072 |
| x21 | 0.0011 | 0.0032 | 0.0162 | 0.1070 | 0.0378 | 0.0000 | 0.0854 | 1.0000 | 0.0249 | 0.0076 | 0.0054 | 0.0205 | 0.0616 | 0.0141 | 0.0357 |
| x22 | 0.0000 | 0.0421 | 0.0545 | 0.3335 | 0.0590 | 0.0085 | 1.0000 | 0.3700 | 0.1065 | 0.0517 | 0.0304 | 0.0068 | 0.2321 | 0.0493 | 0.3557 |
| Index | Bad | General | Good | |||
|---|---|---|---|---|---|---|
| Lower Limit | Upper Limit | Lower Limit | Upper Limit | Lower Limit | Upper Limit | |
| Gross domestic product (GDP) | 0 | 3014 | 3014 | 10198 | 10198 | 28689 |
| Per capita GDP | 0 | 7107 | 7107 | 26533 | 26533 | 65233 |
| GDP growth rate | 0 | 2 | 2 | 4 | 4 | 8 |
| Political stability | 0 | 79 | 79 | 88 | 88 | 97 |
| National political openness | 0 | 73 | 73 | 83 | 83 | 94 |
| Support of national policies for PV industry | 0 | 72 | 72 | 84 | 84 | 97 |
| National perception index | 0 | 65 | 65 | 75 | 75 | 99 |
| Urbanization rate | 0 | 54 | 54 | 74 | 74 | 100 |
| Human development index (HDI) | 0 | 0.7357 | 0.7357 | 0.8380 | 0.8380 | 0.9380 |
| Power supply and demand | 0 | 69 | 69 | 79 | 79 | 90 |
| CO2 emissions | 805 | 2480 | 164 | 805 | 0 | 164 |
| Biodiversity | 0 | 68 | 68 | 77 | 77 | 83 |
| Emphasis on environmental protection | 0 | 71 | 71 | 81 | 81 | 95 |
| Solar radiation conditions | 0 | 73 | 73 | 83 | 83 | 95 |
| Meteorological conditions | 0 | 70 | 70 | 83 | 83 | 96 |
| Engineering geological conditions | 0 | 66 | 66 | 79 | 79 | 99 |
| Total primary energy consumption | 0 | 3 | 3 | 13 | 13 | 34 |
| Per capita consumption of primary energy | 0 | 76 | 76 | 282 | 282 | 714 |
| Renewable energy consumption | 0 | 0.0203 | 0.0203 | 0.3210 | 0.3210 | 1.2100 |
| Total power generation | 0 | 91 | 91 | 514 | 514 | 1559 |
| PV power generation | 0 | 3 | 3 | 10 | 10 | 46 |
| Proportion of PV power generation | 0 | 0.4559 | 0.4559 | 2.4712 | 2.4712 | 7.9681 |
| Gross domestic product (GDP) | 0 | 3014 | 3014 | 10198 | 10198 | 28689 |
| Indicator | Weight | Indicator | Weight |
|---|---|---|---|
| Gross domestic product (GDP) | 0.0738 | Biodiversity | 0.0186 |
| Per capita GDP | 0.0616 | Emphasis on environmental protection | 0.0235 |
| GDP growth rate | 0.0252 | Solar radiation conditions | 0.0219 |
| Political stability | 0.0208 | Meteorological conditions | 0.0284 |
| National political openness | 0.0164 | Engineering geological conditions | 0.0310 |
| Support of national policies for PV industry | 0.0135 | Total primary energy consumption | 0.0764 |
| National perception index | 0.0415 | Per capita consumption of primary energy | 0.0600 |
| Urbanization rate | 0.0266 | Renewable energy consumption | 0.1022 |
| Human development index (HDI) | 0.0135 | Total power generation | 0.0925 |
| Power supply and demand | 0.0270 | PV power generation | 0.1444 |
| CO2 emissions | 0.0085 | Proportion of PV power generation | 0.0729 |
| Country | First-Level | Second-Level | Third-Level |
|---|---|---|---|
| Indonesia | 0.3239 | 0.3602 | −0.3239 |
| Singapore | 0.2494 | −0.0852 | −0.2494 |
| Malaysia | 0.5881 | 0.7371 | −0.5881 |
| Thailand | 0.3094 | 0.9292 | −0.3094 |
| Saudi Arabia | 0.2766 | 0.7489 | −0.2766 |
| Qatar | 0.5449 | −0.1565 | −0.5449 |
| Greece | 0.1943 | 0.4345 | −0.1943 |
| India | −0.4085 | −0.3115 | 0.4085 |
| Pakistan | 0.6449 | 0.4026 | −0.6449 |
| Bengal | 0.6922 | 0.1749 | −0.6922 |
| Kazakhstan | 0.6424 | 0.4178 | −0.6424 |
| Russia | −0.0374 | 0.2092 | 0.0374 |
| Ukraine | 0.4940 | 0.7515 | −0.4940 |
| Poland | 0.2389 | 0.5999 | −0.2389 |
| Romania | 0.4044 | 0.5361 | −0.4044 |
| Country | First-Level | Second-Level | Third-Level |
|---|---|---|---|
| Indonesia | 0.6619 | 0.6801 | 0.3381 |
| Singapore | 0.6247 | 0.4574 | 0.3753 |
| Malaysia | 0.7941 | 0.8685 | 0.2059 |
| Thailand | 0.6547 | 0.9646 | 0.3453 |
| Saudi Arabia | 0.6383 | 0.8745 | 0.3617 |
| Qatar | 0.7724 | 0.4217 | 0.2276 |
| Greece | 0.5971 | 0.7173 | 0.4029 |
| India | 0.2957 | 0.3443 | 0.7043 |
| Pakistan | 0.8225 | 0.7013 | 0.1775 |
| Bengal | 0.8461 | 0.5874 | 0.1539 |
| Kazakhstan | 0.8212 | 0.7089 | 0.1788 |
| Russia | 0.4813 | 0.6046 | 0.5187 |
| Ukraine | 0.7470 | 0.8758 | 0.2530 |
| Poland | 0.6195 | 0.7999 | 0.3805 |
| Romania | 0.7022 | 0.7680 | 0.2978 |
| Country | Eigenvalue | Ranking |
|---|---|---|
| Indonesia | 1.8072 | 8 |
| Singapore | 1.8289 | 7 |
| Malaysia | 1.6853 | 11 |
| Thailand | 1.8425 | 6 |
| Saudi Arabia | 1.8524 | 5 |
| Qatar | 1.6168 | 14 |
| Greece | 1.8869 | 3 |
| India | 2.3039 | 1 |
| Pakistan | 1.6209 | 13 |
| Bengal | 1.5639 | 15 |
| Kazakhstan | 1.6241 | 12 |
| Russia | 2.0233 | 2 |
| Ukraine | 1.7367 | 10 |
| Poland | 1.8673 | 4 |
| Romania | 1.7713 | 9 |
| Average | 1.8021 | - |
| Country | Traditional Evaluation Result | SVM | LSSVM | CS−LSSVM | ICS−LSSVM | ||||
|---|---|---|---|---|---|---|---|---|---|
| Result | Error | Result | Error | Result | Error | Result | Error | ||
| Kazakhstan | 1.6241 | 1.7168 | 5.71 | 1.6910 | 4.12 | 1.6657 | 2.56 | 1.5908 | −2.05 |
| Russia | 2.0233 | 1.8900 | −6.59 | 1.9169 | −5.26 | 2.0037 | −0.97 | 2.0427 | 0.96 |
| Ukraine | 1.7367 | 1.6728 | −3.68 | 1.6731 | −3.66 | 1.7916 | 3.16 | 1.7518 | 0.87 |
| Poland | 1.8673 | 1.9842 | 6.26 | 1.9020 | 1.86 | 1.9358 | 3.67 | 1.8382 | −1.56 |
| Romania | 1.7713 | 1.8726 | 5.72 | 1.6794 | −5.19 | 1.7132 | −3.28 | 1.8064 | 1.98 |
Publisher’s Note: MDPI stays neutral with regard to jurisdictional claims in published maps and institutional affiliations. |
© 2021 by the authors. Licensee MDPI, Basel, Switzerland. This article is an open access article distributed under the terms and conditions of the Creative Commons Attribution (CC BY) license (https://creativecommons.org/licenses/by/4.0/).
Share and Cite
Liang, Y.; Wang, H. Using Improved SPA and ICS-LSSVM for Sustainability Assessment of PV Industry along the Belt and Road. Energies 2021, 14, 3420. https://doi.org/10.3390/en14123420
Liang Y, Wang H. Using Improved SPA and ICS-LSSVM for Sustainability Assessment of PV Industry along the Belt and Road. Energies. 2021; 14(12):3420. https://doi.org/10.3390/en14123420
Chicago/Turabian StyleLiang, Yi, and Haichao Wang. 2021. "Using Improved SPA and ICS-LSSVM for Sustainability Assessment of PV Industry along the Belt and Road" Energies 14, no. 12: 3420. https://doi.org/10.3390/en14123420
APA StyleLiang, Y., & Wang, H. (2021). Using Improved SPA and ICS-LSSVM for Sustainability Assessment of PV Industry along the Belt and Road. Energies, 14(12), 3420. https://doi.org/10.3390/en14123420