Abstract
This paper presents a three-dimensional modeling approach to simulate the thermal performance of a Li-ion battery module for a new urban car. A single-battery cell and a 52.3 Ah Li-ion battery module were considered, and a Newman, Tiedemann, Gu, and Kim (NTGK) model was adopted for the electrochemical modeling based on input parameters from the discharge experiment. A thermal–electrochemical coupled method was established to provide insight into the temperature variations over time under various discharge conditions. The distribution temperature of a single-battery cell was predicted accurately. Additionally, in a 5C discharge condition without a cooling system, the temperature of the battery module reached 114 °C, and the temperature difference increased to 25 °C under a 5C discharging condition. This condition led to the activation of thermal runaway and the possibility of an explosion. However, the application of a reasonable fan circulation and position reduced the maximum temperature to 49.7 °C under the 5C discharge condition. Moreover, accurate prediction of the temperature difference between cell areas during operation allowed for a clear understanding and design of an appropriate fan system.
1. Introduction
After more than a century of development and use, the lithium-ion battery is familiar to consumers. It is widely applied in fields related to electronic products and electric vehicles. In the last few years, a promising market for urban electric cars has emerged, with fierce competition among mobile device manufacturers [1,2,3]. This has spurred system-level studies related to optimal small-size battery management to ensure high thermal performance and longevity of lithium-ion batteries. Regarding the idea of developing a heat management system, some systems have established a criterion [4,5] of maintaining the optimal temperature range between 20 °C and 40 °C. This is necessary to extend the life of battery devices and to ensure their safety. During operation, unevenly generated heat sources should be considered, and appropriate adjustments should be made to ensure that the maximum temperature difference does not exceed 5 °C [6]. This is a major challenge under rapid discharge conditions because of the requirement for a high volumetric energy density in electric-drive vehicles. Recently, several effective approaches have been proposed and studied in terms of their production cost.
Battery thermal management systems can be divided into three types: air cooling [7,8], liquid cooling [9,10], and PCM (phase change material) [11]. The selection of a PCM material plays a vital role in developing an effective battery thermal management system (BTMS). Although such PCM cooling systems can effectively reduce the temperature and maintain a small temperature difference, it is not easy to find materials with a suitable specific heat value. Bernardo et al. [12] delayed the time to reach the critical and evenly distributed temperatures, but the maximum temperature remained above 50 °C. Zhiguo et al. [13] proposed a paraffin-based (RT44HC)/expanded graphite (EG) composite PCM coupled with fluid cooling to ensure a slow rise in temperature and an appropriate temperature difference, although it was successful only under 3C discharge conditions. Pendergast et al. [14] studied Panasonic’s available battery generation methods which ensured operation within the permissible temperature range from −20 °C to 60 °C. Jiateng et al. [15] used mini-channel liquid cooling for a cylindrical lithium-ion battery to restrict the maximum temperature to below 40 °C. Most recent studies conducted separate electrochemical and heat fluid flow simulations instead of simultaneous simulation of the two approaches, which may affect the accuracy of the simulation applications under real-world conditions. Fan et al. [16] performed a three-dimensional transient analysis and applied an airflow passage to small gaps. This is a good option in the early stages of optimum thermal management design research since it allows for flexibility in terms of design changes.
To better design the cooling system for lithium-ion batteries, a detailed understanding of their thermal behavior is essential. There are two main ways to study thermal behavior under discharge and charge conditions. One is based on a theoretical model using a porous electrode and a concentrated solution [17,18,19]. However, this is not the ideal approach in the heat treatment industry. The other is to use empirical parameters to predict the temperature evolution. This second approach is presently considered the best research direction. Two models that are widely used in commercial software are the equivalent circuit model (ECM) [20] and the Newman, Tiedemann, Gu, and Kim (NTGK) model. The NTGK semi-empirical model, proposed by Kwon et al. [21], has been used by others [22,23,24,25,26], who have found it to be effective at predicting the rapid heat evolution of lithium-ion batteries. This model is set up by curve fitting the experimental data. Yi et al. [27] also used the NTGK model to obtain the total heat from an electrochemical reaction and predict the temperature distribution of battery cells. Shahid and Agelin-Chaab [28] studied the technology to improve cooling and temperature uniformity in a simple battery pack with cylindrical batteries. They considered various types of inlet configurations and investigated the maximum temperature and temperature difference of each configuration using both experiments and numerical simulations with the k−ω SST (shear stress transport) model.
The present work focused on a new design of a cooling system of a Li-ion battery module for a NEV (neighborhood electric vehicle). The system consisted of six battery modules in series, in which each battery module was made up of ten serial single prismatic cells. The 3D thermal–electrochemical coupled model of the battery module with ten 52.3 Ah cells was applied under various discharge conditions and the simulation results were validated with experimental data. The multi-scale multi-domain (MSMD) modeling for a large Li-ion battery module was combined with the conjugate heat transfer (CHT) method in computational fluid dynamics (CFD). The effect of the number of fans and the installed position of the fans were considered to study the thermal behavior of the designed cooling system. The maximum temperature and temperature difference between each cell were investigated.
2. Methodology
A lithium-ion structure of 10 prismatic cells connected in series is under development by the company Scanjet. A battery cell consists of electrodes, electrolytes, separators, and pouches. The battery cells are 227 mm long, 249 mm wide, and 8 mm thick. The negative and positive electrodes are separated by porous separators. The cells are linked via a busbar, and the distance between the cells is 2.3 mm. The active material of the battery cell is covered by an aluminum pouch layer with a thickness of 0.3 mm. Additionally, to decrease (and more evenly distribute) the temperature of the battery module, a multi-level fresh air supply fan system is added on either side of the battery module. The components of the single-battery cell and the sizes of the battery module model and fluid domain are shown in Figure 1a,b, respectively.
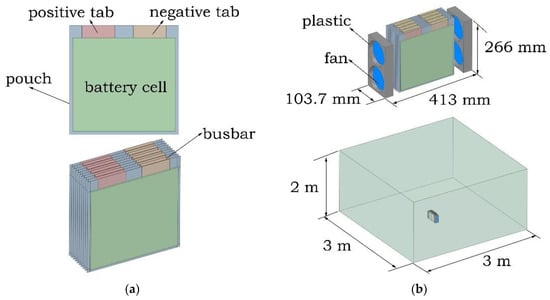
Figure 1.
Schematic showing the battery components and fluid domain: (a) single-battery cell and battery module, and (b) the supply fan system and domain dimensions.
The current distribution and potential distribution are similar [22,23,24,25,26]. The heat generated inside the cell is conducted through the pouch and dispersed into the air. The 3D fan model, material composition, and parameters related to the thermoelectricity are listed in Table 1. The calculation process was performed using the analysis software ANSYS Fluent 2019 R2 [29] based on the finite volume method.

Table 1.
The specifications of the battery cell, supply fan, and fluid domain.
Thermal performance plays a key role in the efficient operation of a battery; therefore, it is essential to capture the changes in temperature inside a cell. In this study, single-battery cell analysis and operation of a battery module without and with a fan system were implemented using a thermal–electrochemical coupled model.
2.1. Numerical Computation
Three types of models were considered in this study: a single-battery cell, a battery module without fans, and a battery module with fans. The initial temperature for all zones was 25 °C, as in the experimental setup conditions. The inlet boundary condition was set to be the pressure inlet, whereas the outlet one is a pressure outlet. The temperature conditions for the fixed surfaces were coupled. The selected turbulent model was the k−ω SST because the maximum Reynolds number was 65,819, where is the density, is the dynamic viscosity, is the rotor diameter, and is the velocity of air (in the case of a maximum fan rpm of 3800). The outer surface of the fluid domain was defined as free convection with a heat transfer coefficient of . The governing equations were solved using the semi-implicit method for pressure-linked equations consistent (SIMPLEC) method, and the second-order upwind was selected for the spatial discretization of the convection terms in the pressure, momentum, energy, and potential equations. The time step was set at 1, the maximum iteration step was set at 30, and the simulation times for the discharge conditions of 1C, 2C, 3C, 4C, and 5C (C-rates) were 3534 s, 1723 s, 1129 s, 841 s, and 664 s, respectively.
A hexahedral mixing grid was used for the inner battery cell, while that of the fluid domain was polyhedral. The battery cell was divided into 16 layers, as shown in Figure 2. The grid number plays an important role in ensuring the accuracy of transient simulations; therefore, an independent grid test was thoroughly studied. As shown in Figure 3, the maximum temperature in a single-battery cell simulation decreased significantly from 30.97 °C at 176,300 elements to 30.90 °C at 413,000 elements; there was a slight change of about 0.01 °C when the number of elements was increased to 864,800. The variation in the heat transfer rate was very small at only 0.0032%. Therefore, the number of grids was set at 413,000 for the single-battery cell simulations. The other models were based on the present grid system of a single-battery cell.
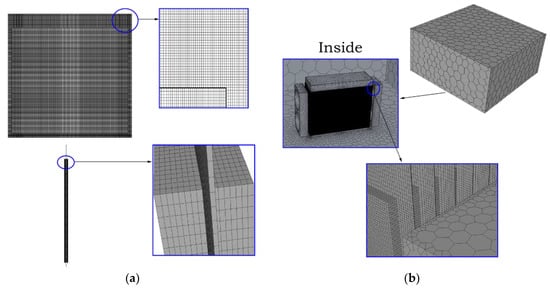
Figure 2.
The grid model: (a) single-battery cell, and (b) battery module inside the fluid domain.
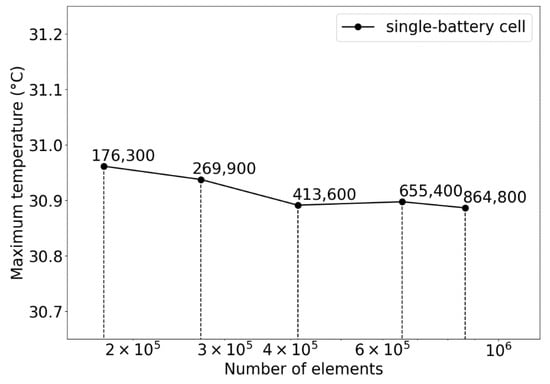
Figure 3.
Independent grid test with various mesh numbers.
Two air-cooling methods were investigated: natural and forced. The natural method was used to assess the air in a stagnant condition. The forced model was used when the fluid flow was introduced into the domain by a fan.
The simulations in this study were composed of four different stages. First, the single-battery cell was tested under 1C, 2C, 3C, 4C, and 5C discharging conditions to verify the reliability of the model. In the second stage, the battery module was tested under 1C, 3C, and 5C discharging conditions. In the third stage, the selection of a suitable fan system was evaluated under a 5C fast discharging condition. Finally, in the fourth stage, the influence of speed was considered under 3C and 5C discharging conditions.
2.2. Mathematical Model and Verification of Simulation Reliability
The goal was to determine the temperature distribution of the battery cell at the battery length scale to determine the exact location of easy heat accumulation. For predicting the temperature using a thermal management method, the multi-domain and multi-physics nature was adopted. The anode–separator–cathode sandwich layers and the Li-ion transport equation of the battery scale needed to be determined. The multi-scale multi-domain (MSMD) [30] approach is effective at analyzing different physical properties in different solution domains. Based on the charge conservation during discharge, the Poisson equations are as follows:
where and are the effective electrical conductivities for the positive and negative electrodes, respectively; and are the phase potentials for the positive and negative electrodes, respectively; is the volumetric current transfer rate calculated using an electrochemical submodel; and and denote the domains of the positive and negative electrodes, respectively.
In Equations (1) and (2), the volume current transfer rate is a function of the potential difference between the positive and negative electrodes of the battery. The functional form depends on the polarization curve of the electrodes. Tiedemann and Newman [31] and Gu [32] found that varies linearly with the cell voltage. The NTGK model was proposed by Kwon et al. [21]:
where is the specific area of the electrode sandwich sheet in the battery cell, while and are the empirical fitting parameters. Gu’s experiment [32] found that both and depend on the depth of discharge (DOD) of the battery and temperature. The following and functions were proposed in Gu [32]:
where the coefficients and are constants to be calculated experimentally. The fitting parameters used to determine the potential and current density distribution on the electrodes during discharge are shown in Table 2.
Table 2.
The fitting parameters used in the Newman, Tiedemann, Gu, and Kim (NTGK) model.
To verify the accuracy of the adopted model and simulation procedure, the simulated data were compared with experimental data provided by the Scanjet company. In Figure 4, the predicted curves under different discharge conditions agreed well with the experimental results for both voltage and temperature. The value of the discharging current was equal to C-rate multiplied by the nominal capacity, and the operating time of a battery depended on the discharge rate, which meant the higher is the discharge rate, the shorter the operating time of the battery, as shown in Figure 4a. Figure 4b shows that the temperature increased rapidly when the discharge condition increased. For example, the maximum temperature of the single-battery cell after discharging at 1C, 2C, 3C, 4C, and 5C rates were 35 °C, 48 °C, 70 °C, 84 °C, and 92 °C, respectively. Under discharge conditions greater than 3C, the maximum temperature was outside the operating range specified by the manufacturer, as shown in Table 1. Additionally, under the condition of rapid discharge at 5C, the temperature history error increased to 5% and exceeded 92 °C. This partly depends on the process used to set the ambient for the experiment. Kim et al. [25] found that the ambient temperature during this type of experiment is quite sensitive.
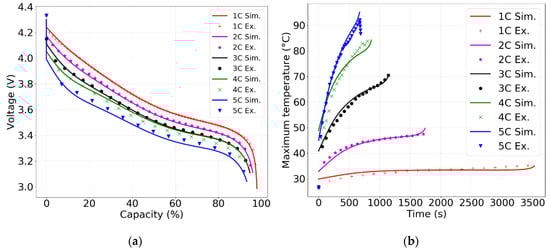
Figure 4.
Comparison of experimental and simulated results of the single-battery cell under different discharging rates: (a) voltage and (b) maximum temperature.
The volumetric heat source in the battery cell can be expressed as irreversible heat from the internal resistance of the cell and reversible heat from the electrochemical reaction inside the cell . Additionally, the ohmic heating in the battery is added, while the heat generated by the resistivity of the current collecting tab and the resistivity of the electrical contact between the current collecting tab and the lead wire are excluded. The total heat generation is as follows:
where is the open-circuit potential of the cell , and T is the working temperature of the battery.
Because natural convection and forced convection are understood to disperse the temperature of the cell, the conjugate heat transfer problem should be studied. The equation of energy conversion of the battery is calculated as follows [33]:
where is the density, is the heat capacity, and is the thermal conductivity of the battery.
Additionally, the fluid flow and heat transfer can be expressed using the equations of mass conservation, momentum, and energy:
where is the density, is the heat capacity, is the thermal conductivity, and is the velocity of air.
3. Results and Discussion
As discussed earlier, a battery module in which many cells were connected in series was studied. In addition to the natural convection analysis for the battery module, the forced convection model was applied to determine a favorable distribution location of the fan, a suitable fan quantity, and the optimal speed of the fan.
3.1. Battery Module under Various Discharging Conditions
The temperature distributions of the battery module without fans, discharging at 1C, 3C, and 5C, are shown in Figure 5. The temperature near the current collecting tab of the electrode zones was higher than in the other zones. Because the electrical conductivity of the active material was much lower than that of the electrodes, as shown in Table 1, the current flows near the tabs of both the positive and negative electrodes were high, as explained by Kim et al. [22].
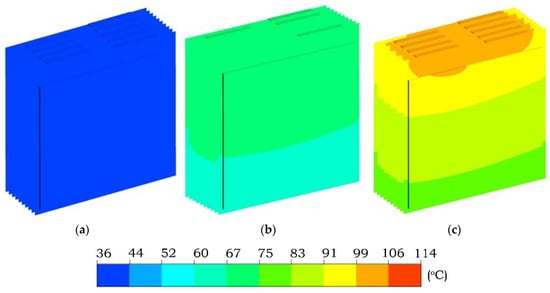
Figure 5.
Temperature distribution of the battery module after discharging at (a) 1C, (b) 3C, and (c) 5C.
The heat source and maximum temperature curves over time of the battery module are shown in Figure 6a,b, respectively. The highest volumetric heat source of the battery module after discharging at 1C, 3C, and 5C was 42,786, 144,849, and 250,996 W/m3, respectively. The corresponding maximum final temperatures were 46 °C, 74 °C, and 114 °C, respectively. The temperature of the battery module increased immediately with an increase of current. Particularly, the value in the 5C case (after discharging) was almost twice the maximum permissible operating temperature of the battery. Under 3C and 5C discharging conditions, the maximum temperatures were increased by 4 °C and 22 °C, respectively, compared to that of the single-battery cell. It is important to note that the initial and ambient temperatures were set at 25 °C, which is an ideal condition. This means that if the room temperature was higher than this standard, the battery module would be operating in a dangerous situation, with a risk of thermal runaway and explosion. In the following section, the scheme of fan systems and the appropriate number of fans are analyzed.
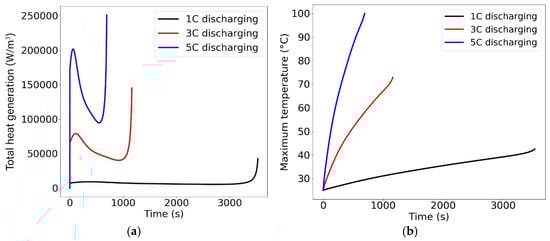
Figure 6.
Curve histories at various C-rates of the battery module in the conjugate simulation: (a) average volume heat generation and (b) maximum temperature.
3.2. Battery module with Supply Fan Systems under a Fast Discharging Condition
In the present work, six models with fans were considered to investigate the effects of the fan position and the number of fans. Five models contained two fans with varying positions, and the other comprised four fans. For example, the D1 design had two fans, both placed on the left, and the D3 design had the same number of fans but on the right. Similarly, the D2, D4, and D5 designs had two fans at different positions, as shown in Figure 7. Finally, four fans were adopted in the D6 design.
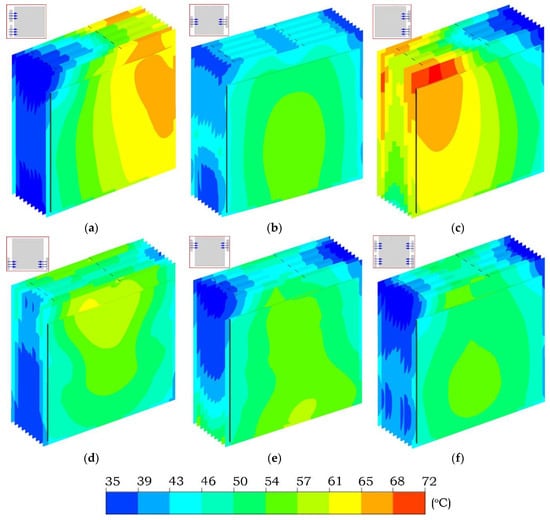
Figure 7.
Temperature distribution of the battery module after 5C discharging at an rpm of 2000: (a) D1—two fans on the left, (b) D2—two fans in the middle, (c) D3—two fans on the right, (d) D4—two fans on the bottom, (e) D5—two fans on the top, and (f) D6—four fans.
The speed of the fans was set to 2000 rpm in all models. Although the location of the heat source was near the two electrode zones, placing the fan near this zone did not improve heat dissipation. Figure 8 shows the history of the maximum temperature and the temperature difference between cells for the various designs. The design layouts and the temperature contours are shown in Figure 7. In the 5C discharge condition, only the D2 and D6 designs produced operating temperatures within an acceptable range (less than 60 °C). The D1, D3, D4, and D5 designs had maximum temperatures of 70.5 °C, 72.5 °C, 62.7 °C, and 61.0 °C, respectively. For the D1 and D3 designs, the two fans were placed only on one side of the battery module, which caused uneven temperature distributions. Although only two fans were used in the D2 design, it had the same maximum temperature of 58.9 °C as the D6 design, which contained four fans. As shown in Figure 8a,b, both the maximum temperature and the temperature difference curves of the D2 design were better than those of the D6 design. Thus, the closer the fan was to the center of the battery, the more uniform the dispersion effect was. Even though the minimum temperature of design D6 was lower than that of design D2 by approximately 3.3 °C, as shown in Figure 7f,b, respectively, in general, the D2 design was advantageous in terms of heat dissipation.
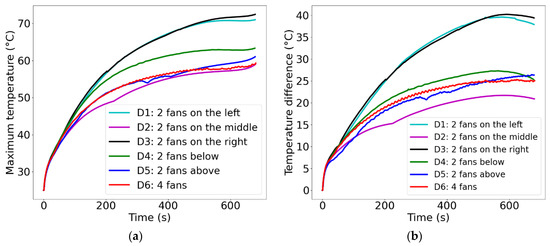
Figure 8.
Temperature histories of a battery module with various fan systems: (a) maximum temperature curves and (b) temperature difference curves.
Additionally, in comparison with the D6 design, the D2 design was easier to model and optimize in terms of cost. For these reasons, the D2 design was selected as the final option for analyzing the influence of speed in the subsequent experiments.
3.3. Effect of Fan Speed
According to the analysis in the previous section, high temperatures were concentrated in two main areas, the positive zone and the central zone of the battery cell. Although the outer two batteries were contacted with more space, the heat dissipation is poor, and therefore the temperature was higher. This was partly due to the axial properties of the fans, which flowed more directly into the middle of the battery module via gaps. In this section, the fan speeds of 3000 and 3800 rpm were considered based on the D2 design. The temperature distribution of the battery module and velocity vectors of the fan system after 3C and 5C discharging are shown in Figure 9. The comparison of the maximum temperature and temperature difference with various fan speeds is plotted in Figure 10.
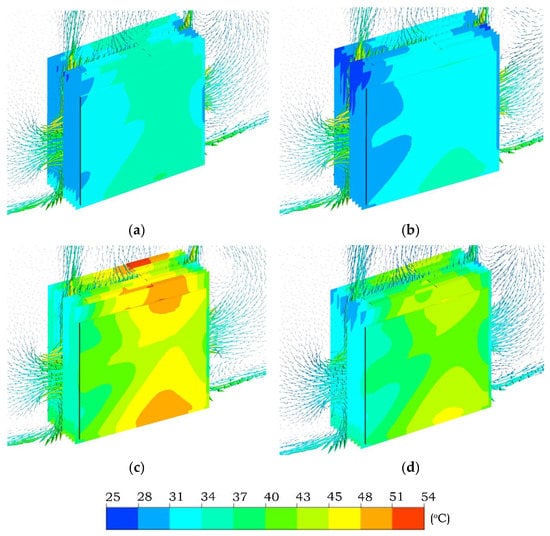
Figure 9.
Temperature distribution with the flow direction vector of the battery module after 3C and 5C discharging conditions: (a) 3000 rpm at 3C, (b) 3800 rpm at 3C, (c) 3000 rpm at 5C, and (d) 3800 rpm at 5C.
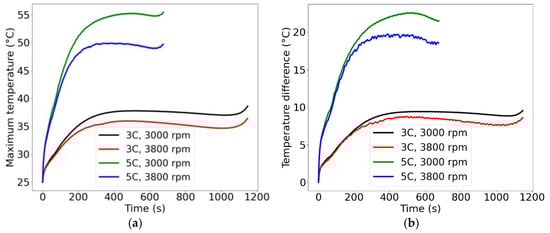
Figure 10.
Temperature histories of the battery module at various fan speeds: (a) maximum temperature curves and (b) temperature difference curves.
As shown in Figure 9, temperatures over the battery surface decreased with an increase in fan speed. The fan system blew the airflow near the center part inside the gap between the battery cell, which caused airflow to go out of the upper and lower gaps of the battery cell. The pattern of streamlines did not show a significant change as a function of fan speed. However, the temperature of the airflow escaping the battery cell decreased as the fan speed increased, which means that the amount of heat transfer increased with an increase in fan speed.
As the fan speed increased, the maximum temperature decreased. For example, when the fan speed was 3000 rpm, the maximum battery module temperatures after 3C and 5C discharging conditions were 38.6 °C and 55.4 °C, respectively. When the fan speed increased to 3800 rpm, the maximum temperature dropped to 36.4 °C and 49.7 °C for 3C and 5C, respectively. In other words, compared with the results at a fan speed of 3000 rpm, the maximum temperature of the battery module decreased by 2.2 °C and 5.7 °C for 3C and 5C, respectively.
Concerning the variation in the temperature difference of the battery module, as shown in Figure 10b, when the fan speed was 3000 rpm, the temperature differences after discharging under 3C and 5C conditions were 9.7 °C and 21.5 °C, respectively. When the fan speed increased to 3800 rpm, the corresponding temperature difference was only 8.6 °C and 18.5 °C, respectively. Compared with the 3000 rpm case, this produced decreases of 1.1 °C and 3.0 °C, respectively.
The detailed evolution of temperature is illustrated by the histogram in Figure 11. In a 3C discharging condition, the maximum temperatures among the cells were similar, with 37–38 °C and 35–36 °C at 3000 and 3800 rpm, respectively. Figure 11b shows that, after discharging at 5C, the temperature varied with the fan speed, with ranges of 52–55 °C and 46–49 °C at 3000 and 3800 rpm, respectively. The temperature differences for each battery cell are shown for 3C and 5C discharging conditions. In Figure 11b, the highest temperature differences, which were 19 °C and 17 °C for 3000 and 3800 rpm, respectively, are marked in bold text. For fast discharging conditions, the temperature in the positive electrode tab rose abruptly, whereas the small distance between the cells of the battery module (2.3 mm) interfered with the airflow to the middle of the battery module.
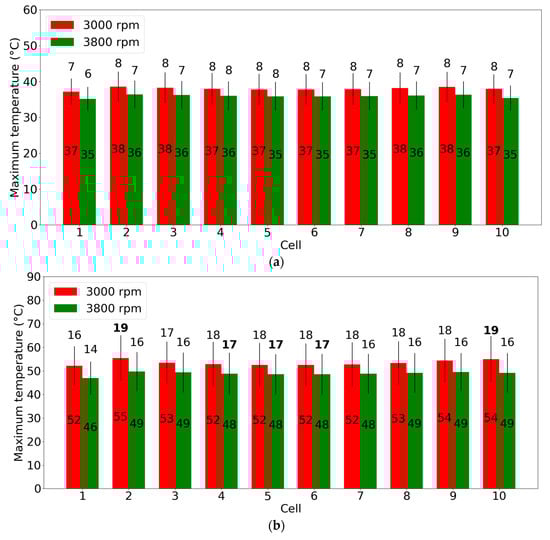
Figure 11.
Maximum temperature and temperature difference for each single-battery cell in the battery module after discharging at (a) 3C and (b) 5C rates.
The above results show that the maximum temperature and temperature difference of the battery module can be reduced by increasing the fan speed. This ensures that the battery module can operate within the permissible temperature range.
4. Conclusions
In this study, an integrated thermal–electrochemical coupled transient analysis was conducted on a single-battery cell and in a battery module with or without a fan system. The application of a transient model to a heat management system was essential since it provided an accurate description of the temperature change over time. The results indicate that the model may be suitable for cooling system control.
The analysis results of a single-battery cell agreed well with experimental data, providing suggestions for an effective heat management design. Unlike the convective heat transfer boundary condition used in previous studies of the internal thermal behavior of Li-ion batteries, the conjugate heat transfer condition was applied to provide a better prediction of the heat dissipation. The battery module model showed a temperature rise of 10 °C above that of the single battery. This result required a design process with a cooling system for the battery module or battery pack.
Installation of the fan-cooled system ensured that the working temperature stayed within the allowed limits (−40 °C to 60 °C). As the distance between the fans and the center of the battery decreased, the cooling efficiency and cost savings increased. Additionally, as the fan speed increased, the temperature difference between the battery cells decreased.
Future work will further clarify the thermal behavior under conditions of rapid discharge with the support of aluminum plates and coolant.
Author Contributions
Conceptualization, V.-T.H. and K.C.; methodology, V.-T.H. and K.C.; software, V.-T.H. and K.C.; validation, V.-T.H., K.C., and S.W.L.; investigation, S.H.K.; resources, S.H.K; data curation, S.H.K.; writing—original draft preparation, V.-T.H.; writing—review and editing, V.-T.H. and K.C.; visualization, V.-T.H. and K.C.; supervision, K.C.; project administration, S.W.L. All authors have read and agreed to the published version of the manuscript.
Funding
This work was supported by Upbringing Business with the Innovative Urban Public Institution by the Ministry of Trade, Industry and Energy (MOTIE, Korea) (project name: Establishment of Battery/Ess-Based Energy Industry Innovation Ecosystem) and by the Technology Innovation Program (20006974, Development of the multi-layered sheets and their forming/joining technologies for the fabrication of 28% lightweight battery pack/module components of electric vehicles) funded by MOTIE, Korea.
Conflicts of Interest
The authors declare no conflict of interest.
References
- Orbach, Y.; Gila, E.F. Forecasting sales and product evolution: The case of the hybrid/electric car. Technol. Forecast. Soc. 2011, 78, 1210–1226. [Google Scholar] [CrossRef]
- Falvo, M.C.; Lamedica, R.; Bartoni, R.; Maranzano, G. Energy management in metro-transit system: An innovative proposal toward an integrated and sustainable urban mobility system including plug-in electric vehicles. Electr. Power Syst. Res. 2011, 81, 2127–2138. [Google Scholar] [CrossRef]
- Ghassan, Z.; Rodolfo, D.L.; Monica, C.; Guzay, P. The Lithium-ion battery: State of the art and future perspectives. Renew. Sustain. Energy Rev. 2018, 89, 292–308. [Google Scholar]
- Tran, T.-H.; Souad, H.; Bernard, D.; Sebastien, F. Experimental investigation on the feasibility of heat pipe cooling for HEV/EV lithium-ion battery. Appl. Therm. Eng. 2014, 63, 551–558. [Google Scholar] [CrossRef]
- Ye, Y.; Lip, H.S.; Shi, Y.; Andrew, A.O.T. Numerical analyses on optimizing a heat pipe thermal management system for lithium-ion batteries during fast discharging. Appl. Therm. Eng. 2015, 86, 281–291. [Google Scholar] [CrossRef]
- Rao, Z.; Qian, Z.; Kuang, Y.; Li, Y. Thermal performance of liquid cooling based thermal management system for cylindrical lithium-ion battery module with variable contact surface. Appl. Therm. Eng. 2017, 123, 1514–1522. [Google Scholar] [CrossRef]
- Saw, L.H.; Ye, Y.; Tay, A.A.O.; Chong, W.T.; Kuan, S.H.; Yew, M.C. Computational fluid dynamics and thermal analysis of lithium-ion battery pack with air cooling. Appl. Energy 2016, 177, 783–792. [Google Scholar] [CrossRef]
- Wang, H.; Xu, W.; Ma, L. Actively controlled thermal management of prismatic Li-ion cells under elevated temperatures. Int. J. Heat Mass Transf. 2016, 177, 315–322. [Google Scholar] [CrossRef]
- Lan, C.; Xu, J.; Qiao, Y.; Ma, Y. Thermal management for high power lithium-ion battery by mini-channel aluminum tubes. Appl. Therm. Eng. 2016, 101, 284–292. [Google Scholar] [CrossRef]
- Yang, X.-H.; Tan, S.-C.; Liu, J. Thermal management of Li-ion battery with liquid metal. Appl. Therm. Eng. 2016, 117, 577–587. [Google Scholar] [CrossRef]
- Azizi, Y.; Sadrameli, S.M. Thermal management of a LiFePO4 battery pack at high temperature environment using a composite of phase change materials and aluminum wire mesh plates. Energy Convers. Manag. 2016, 117, 294–302. [Google Scholar] [CrossRef]
- Bernardo, B.; Davide, E.; Oronzio, M.; Ferdinando, M. Thermal cooling behaviors of lithium-ion batteries by metal foam with phase change materials. Energy Procedia 2018, 148, 1175–1182. [Google Scholar]
- An, Z.; Chen, X.; Zhao, L.; Gao, Z. Numerical investigation on integrated thermal management for a lithium-ion battery module with a composite phase change material and liquid cooling. Appl. Therm. Eng. 2019, 163, 114–345. [Google Scholar] [CrossRef]
- Pendergast, D.R.; DeMauro, E.P.; Fletcher, M.; Stimson, E.; Mollendorf, J.C. A rechargeable lithium-ion battery module for underwater use. J. Power Sources 2011, 196, 793–800. [Google Scholar] [CrossRef]
- Zhao, J.; Rao, Z.; Li, Y. Thermal performance of mini-channel liquid cooled cylinder based battery thermal management for cylindrical lithium-ion power battery. Energy Convers. Manag. 2015, 103, 157–165. [Google Scholar] [CrossRef]
- Fan, L.; Khodadadi, J.M.; Pesaran, A.A. A parametric study on thermal management of an air-cooled lithium-ion battery module for plug-in hybrid electric vehicles. J. Power Sources 2013, 238, 301–312. [Google Scholar] [CrossRef]
- Doyle, M.; Fuller, T.F.; Newman, J. Modeling of galvannostatic charge and discharge of the lithium-ion/polymer/insertion cell. J. Electrochem. Soc. 1993, 140, 1526–1533. [Google Scholar] [CrossRef]
- Smith, K.; Wang, C.Y. Solid-state diffusion limitations on pulse operation of a lithium-ion cell for hybrid electric vehicles. J. Power Sources 2006, 161, 628–639. [Google Scholar] [CrossRef]
- Cai, L.; White, R.E. Reduction of model order based on proper orthogonal decomposition for lithium-ion battery simulations. J. Electrochem. Soc. 2009, 156, A154–A161. [Google Scholar] [CrossRef]
- Chen, M.; Rincón-Mora, G.A. Accurate electrical battery model capable of predicting runtime and I-V performance. IEEE Trans. Energy Convers. 2006, 21, 504–511. [Google Scholar] [CrossRef]
- Kwon, K.H.; Shin, C.B.; Kang, T.T.; Kim, C.S. A Two-dimensional modeling of a lithium-polymer battery. J. Power Sources 2006, 163, 151–157. [Google Scholar] [CrossRef]
- Kim, U.S.; Shin, C.B.; Kim, C.S. Effect of electrode configuration on the thermal behavior of a lithium-polymer battery. J. Power Sources 2008, 180, 909–916. [Google Scholar] [CrossRef]
- Kim, U.S.; Shin, C.B.; Kim, C.S. Modeling for the scale-up of a lithium-ion polymer battery. J. Power Sources 2009, 189, 841–846. [Google Scholar] [CrossRef]
- Kim, U.S.; Yi, J.; Shin, C.B.; Han, T.; Park, S. Modeling for the thermal behavior of a lithium-ion battery during charge. J. Power Sources 2011, 196, 5115–5121. [Google Scholar] [CrossRef]
- Kim, U.S.; Yi, J.; Shin, C.B.; Han, T.; Park, S. Modeling the temperature dependence of the discharge behavior of a lithium-ion battery on the environmental temperature. J. Electrochem. Soc. 2011, 158, A611–A618. [Google Scholar]
- Yi, J.; Kim, U.S.; Shin, C.B.; Han, T.; Park, S. Modeling the temperature dependence of the discharge behavior of a lithium-ion battery in low environmental temperature. J. Power Sources 2013, 244, 143–148. [Google Scholar] [CrossRef]
- Yi, J.; Koo, B.; Shin, C.B. Three-dimensional modeling of the thermal behavior of a lithium-ion battery module for hybrid electric vehicle applications. Energies 2014, 7, 7586–7601. [Google Scholar] [CrossRef]
- Shahid, S.; Agelin-Chaab, M. Analysis of Cooling Effectiveness and Temperature Uniformity in a Battery Pack for Cylindrical Batteries. Energies 2017, 10, 1157. [Google Scholar] [CrossRef]
- ANSYS. ANSYS Fluent User’s Guide, Release 18.0. 2017. Available online: http://www.ansys.com (accessed on 7 June 2017).
- Kim, G.-H.; Smith, H.; Lee, K.-J.; Santhanagopalan, S.; Pesaran, A. Multi-domain modeling of lithium-ion batteries encompassing multi-physics in varied length scales. J. Electrochem. Soc. 2011, 158, A955–A969. [Google Scholar] [CrossRef]
- Tiedemann, W.; Newman, J. Current and potential distribution in lead-acid battery plates. In Battery Design and Optimization; Gross, S., Ed.; The Electrochemical Society Inc.: Pennington, NJ, USA, 1979; pp. 39–49. [Google Scholar]
- Gu, H. Mathematical analysis of a Zn/NiOOH cell. J. Electrochem. Soc. 1983, 130, 1459–1464. [Google Scholar] [CrossRef]
- Huo, Y.; Rao, Z.; Liu, X.; Zhao, J. Investigation of power battery thermal management by using mini-channel cold plate. Energy Convers. Manag. 2015, 189, 387–395. [Google Scholar] [CrossRef]


© 2020 by the authors. Licensee MDPI, Basel, Switzerland. This article is an open access article distributed under the terms and conditions of the Creative Commons Attribution (CC BY) license (http://creativecommons.org/licenses/by/4.0/).