Abstract
A Chinese traditional narrow street, named Cold-Lane, can create a microclimatic zone that provides pedestrian thermal comfort under hot and humid climate conditions. This phenomenon was observed through experimental measurement during the summer of 2016. The heat transfer rate over the pedestrian body surface was calculated to reveal why pedestrians experience a cool sensation, and computational flow dynamics (CFD) simulation was carried out to study the influence of the street aspect ratio on the shading effect. It was found that the perception of thermal comfort can be attributed mainly to the radiation between the relatively cool surrounding walls and the human body, and the wind velocity has little effect on sensible heat dissipation. The cool horizontal and vertical surfaces in the street canyon are mainly due to the shading effect as a result of the small aspect ratio, which is a typical characteristic of the traditional Chinese street. The shading effect of the high walls on both sides creates the cooling effect of this narrow street.
1. Introduction
The street microclimate has a significant impact on pedestrian thermal comfort and many studies have focused on the street canyon [1,2,3]. Nagaraet et al. [4] performed measurements on the physical–thermal environment on a street in Osaka, Japan and found that the thermal sensation of pedestrians was generally consistent with the ambient conditions, and a buffer zone between the exit and the outdoor space is important to improve the thermal comfort of the pedestrians. Santamouris et al. [5] carried out a field experiment in a deep pedestrian canyon in Athens, measuring air temperature inside and outside the canyon, in addition to the surface temperature for seven continuous days. They found that air temperature stratification was significant, with up to 3 °C difference, and the traffic area in the canyon was hotter than that in the pedestrian area by about 2 °C.
Pearlmutter et al. [6] used a semi-empirical model to predict the effect of street geometry on pedestrian thermal comfort under trans-seasonal weather conditions. The results from the model indicated that a suitable street orientation can substantially increase the pedestrian thermal comfort level. Pantavou et al. [7] carried out a field survey and measurement of environmental parameters to assess the relationship between pedestrian thermal comfort and environmental parameters in three urban areas in Athens, Greece. They concluded that air temperature and wind velocity are the main meteorological parameters affecting pedestrian thermal comfort sensation, but metabolic rate has no significant effect.
Hong and Lin [8] found that tree arrangement, building layout patterns, and orientations with respect to the prevailing wind direction have a significant impact on the outdoor wind environment and pedestrian thermal comfort level, and a square central space can offer good exposure to air currents. Rosso et al. [9] evaluated the application of sustainable and cost-effective materials, i.e., grassland, asphalt, and natural stones, as roofing and paving materials, and demonstrated how thermal perception is positively influenced by high albedo surfaces because pedestrians are more sensitive to lower surface temperature.
Jamei and Rajagopalan [10] showed that deeper canyons, higher height-to-width aspect ratios, and lower sky view factors, in future climate scenarios, contributed to lower levels of mean radiant temperatures, and increasing the tree canopy coverage from 40% to 50% leads to a more effective cooling effect than vegetation. Zhang et al. [11] investigated street canyons in the hot and humid area in Guangzhou, China and evaluated the effects of different design factors and their interactions on pedestrian thermal comfort through numerical simulations.
In central China, traditional narrow streets have been developed over a period of centuries, and provide a cool sensation to pedestrians even when the outdoor air temperature is above 30 °C. Chen and Zhong [12,13] conducted a survey on a traditional street which resembles an urban gorge in Zhejiang province and found that the temperature inside the street was 5 °C lower than that outside and more stable. Ma [14] investigated a narrow street at Guangzhou, and concluded that radiation is the most prominent influence on pedestrian thermal comfort.
Zhu et al. [15] and Höppe [16] proposed similar methodologies to calculate body energy balance, based on the Munich Energy Balance Model, for individuals to define the balance equation of the human body considering metabolic rate, sensible thermal convection rate, radiation rate, evaporative heat dissipation rate, and the heat storage capacity of human body.
The survey in this study was conducted on a traditional street in Yiyang, a city in central China. The studied street is narrower than those in previous studies, and located in the subtropical humid climate zone, which is usually referred to as the hot-summer and cold-winter zone in China. Historical typical temperature profiles in this city during summer are presented in Figure 1, which shows that the daily average temperature ranges from 20 to 33 °C [17].
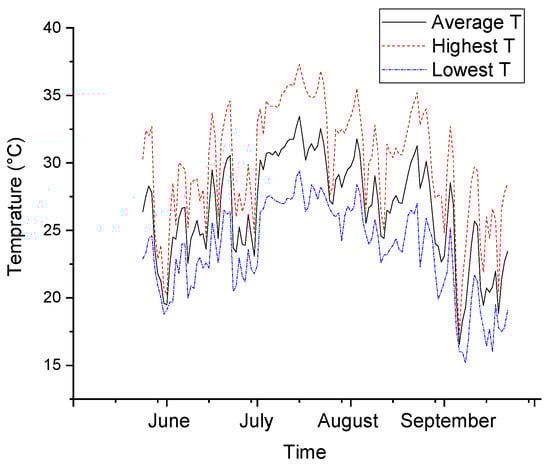
Figure 1.
Local typical temperatures from Yiyang meteorological station.
Figure 2 shows two pictures of the traditional narrow pedestrian street, known as Cold-Lane, near a local temple named Wei Gong Miao. The walls are composed of bricks and clay with gray plaster and the ground is covered by moor stones. Local people report that it is cool and comfortable while walking in this traditional street. It is an example of traditional urban development to keep pedestrians comfortable.
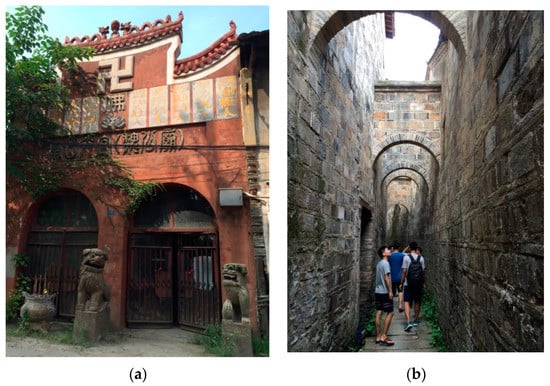
Figure 2.
A traditional gorge in central China. (a) Front view of the temple; (b) Front view of the street.
To the best of the authors’ knowledge, no study has yet been conducted on such narrow street canyons in this climate region. The measurements presented in this paper were taken during 24–26 August 2016 with the first two days being sunny and the third day rainy. An analysis of the heat transfer rate over the pedestrian body surface was conducted based on the data from the field measurement.
2. Survey Methodology
As shown in Figure 3, the old street is located near a river (marked with white color). The city is located at 28.6° N latitude and 112.3° E longitude. The lane is around 80 m long, 1 to 2 m wide, and surrounded with 6 to 8 m high walls on the east and west. Therefore, the width-to-height ratio ranges from 4 to 6.
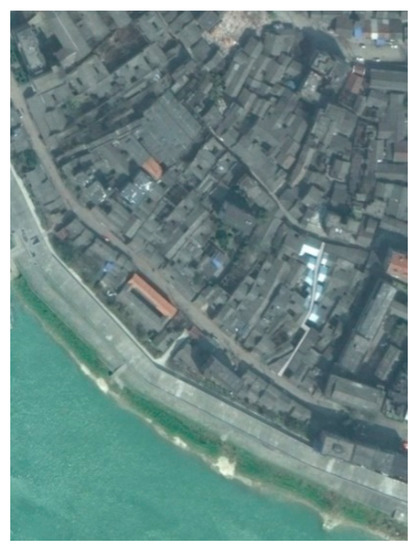
Figure 3.
Cold-Lane seen from a satellite image (from Google Map).
Figure 4a illustrates the eight measuring points, of which points 1 and 8 were outside the lane, and points 2 to 7 were inside the lane. At each point the dry-bulb air temperature, relative humidity, and air velocity were recorded by a hygrothermograph and anemometer. The surface temperatures inside the lane were measured by radiant thermometers, as shown in Figure 4b. During the three-day investigation, the measurement time and weather conditions are listed in Table 1.
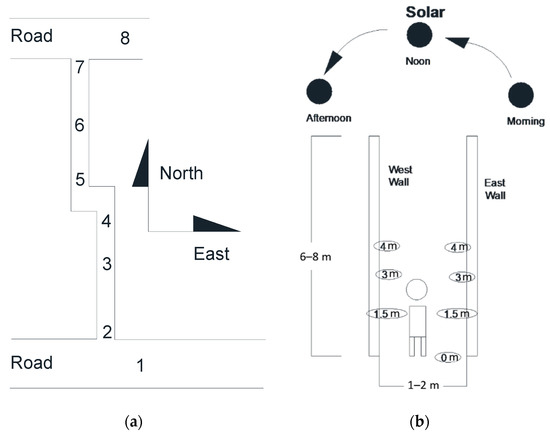
Figure 4.
Measuring points: (a) top view; (b) front view.

Table 1.
Measurement time and weather conditions during investigation [17].
Each measurement period lasted for one hour, starting from point 1 and reaching point 8 within the hour.
3. Results and Analysis from Investigation
3.1. Thermal Sensations Directly
The measurements were carried out by three architectural students and two teachers who stayed in the street. During this time, they did not complain of being hot when in the Cold-Lane (at points 2 to 7 in Figure 4a). On the contrary, the researchers reported feeling unbearably hot while standing outside the Cold-Lane (at points 1 and 8). The same feedback was reported by the local residents.
3.2. Dry-Bulb Temperatures
A total of 4 ONSET Temp/RH (relative humidity) Loggers were used to measure the air temperature (with accuracy of ±0.21 °C) and relative humidity (with accuracy of ±0.3.5%). Figure 5a presents the variation of temperatures of every measurement point at different times, which shows the same trend. Figure 5b shows that the difference between the inside and outside average air temperatures was less than 2 °C. There was a slight time lag of the inside temperatures following the outside temperature. This may be caused by radiant cooling and night-time ventilation, through which the walls could dissipate heat at night.
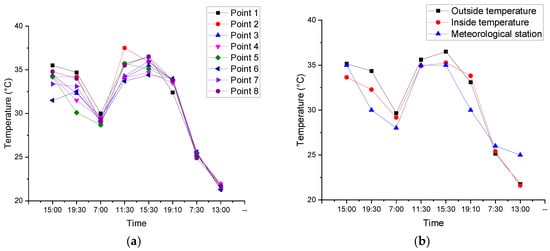
Figure 5.
Measurement of dry-bulb temperature: (a) variation of dry-bulb temperatures with time; (b) comparison of dry-bulb temperatures inside and outside the street.
3.3. Relative Humidity and Air Velocity
A hot wire anemometer was used to measure the air velocity with an accuracy of ±0.1 m/s and average values with an interval of 1 min to account for the fluctuations in air velocity. From Figure 6, it can be observed that the relative air humidity inside and outside the lane are similar, and both varied between 60% and 100%. As observed from Figure 7, the outside air velocity was higher than that inside most of the time, with less fluctuation. Compared with the wind speed in Table 1, which range from 0 to 4 m/s, the velocities measured are much lower than those from the local meteorological station. This is due to the highly crowded buildings in this city, which lower the wind speed near the ground.
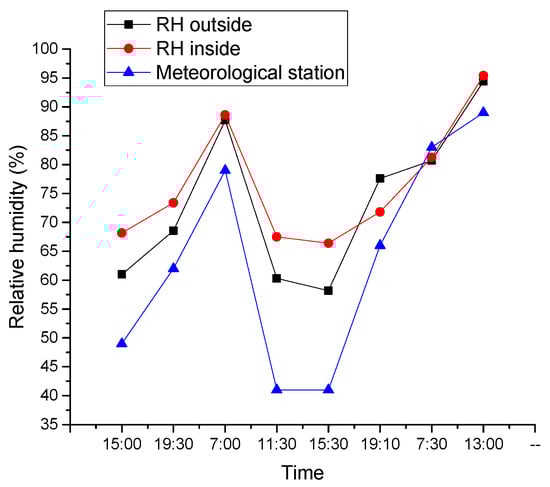
Figure 6.
Relative air humidity.
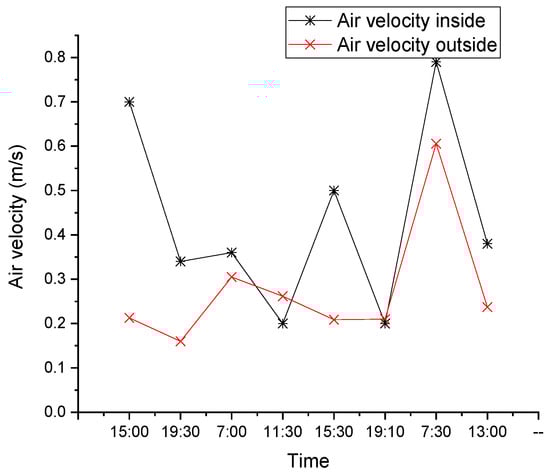
Figure 7.
Air velocity.
3.4. Surface Temperatures at Each Position at Specific Time
Two rectified radiation thermometers were used to measure the wall surface temperature at the same time, and the average value was used as the final reading. The accuracy of each thermometer is ±0.1 °C. Figure 8 presents the profiles of surface temperatures at the ground surface, 1.5, 3, and 4 m above the ground at positions 2 to 7 at different times. Figure 8a,c,d indicate strong solar radiation, and show that the temperature in the center (positions 4 and 5) was lower than those at the two ends (positions 2 and 7). The reason for this is uncertain and perhaps due to a better shading effect or higher air velocity inside the lane.
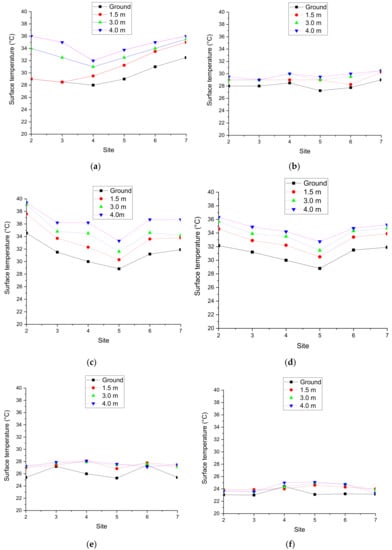
Figure 8.
Temperature profiles at different heights: (a) 24 August, 15:00 (sunny); (b) 25 August, 7:00 (sunny); (c) 25 August, 15:00 (sunny); (d) 25 August, 19:10 (sunny); (e) 26 August, 7:30 (started raining); (f) 26 August, 13:00 (rainy).
Figure 8b shows that the temperature stratification at different sites was about the same and the temperatures were less than 30 °C in the morning. The low temperature is due to radiation heat loss from the ground/wall surface and night-time ventilation.
When it began to rain and the solar radiation was low, the surface temperatures all fell continually to approximately the same level, as shown in Figure 8e,f.
3.5. Comparison of Surface Temperatures between the West Wall and the East Wall
The result of the comparisons of the surface temperatures between the west wall and east wall at the same height is presented in Figure 9, demonstrating that their temperature profiles were similar.
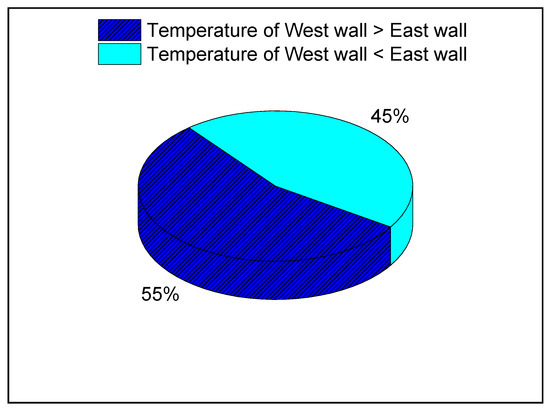
Figure 9.
Percentage in comparison of temperatures between west wall and east wall.
3.6. Surface Temperatures at Different Heights with Time
In Figure 10 it is observed that the surface temperatures increase when the positions are higher; the average gradient is 0.88 °C/m. This may be caused by different shading schemes that resulted in the variation of the solar radiation intensity on the wall surface at different heights. All of the surface temperatures dropped to almost the same value on the last day with an overcast sky.
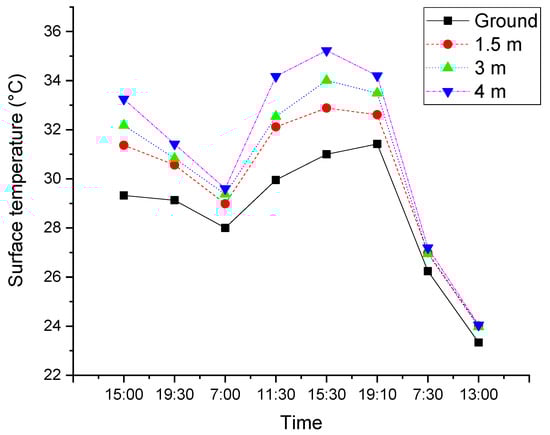
Figure 10.
Temperatures at different heights.
3.7. Average Surface Temperatures Inside and Outside the Lane
Figure 11 reveals that the average temperature at the ground surface of the outside road (position 1 and 8) was about 5 °C higher than that inside the Cold-Lane (position 2 to 7). During the day, the outside road surface temperature was much higher than that inside the lane due to solar radiation. At night the temperature difference was small due to long-wave radiation between the road surface and the sky and night-time ventilation.
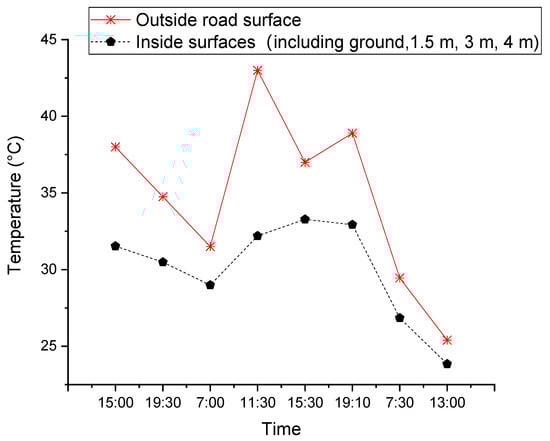
Figure 11.
Average surface temperatures inside and outside.
4. Calculation of Heat Transfer Rate on the Pedestrian Body
As shown in Figure 8, Figure 10 and Figure 11, the wall surface temperature at the bottom of the street canyon was relatively low. In order to evaluate the total heat gain, and the impact of wall temperature on the heat dissipation of the human body, the human body heat balance model was developed to calculate the heat convection, radiation from the surrounding walls, and latent heat dissipation from evaporation. Four cases are considered in this section, i.e., pedestrian still and no wind, pedestrian still and windy, pedestrian walking, and pedestrian on the outside road.
4.1. Parameter
The survey was conducted by five people lasting for one hour each time. Human body heat dissipation was calculated based on the heat transfer theory of Yang and Tao [18] and the human body heat balance model was drawn from Zhu [15]. Three key parameters, (a) sensible heat convection, (b) radiation, and (c) latent heat dissipation from evaporation, were calculated.
We assume that the clothing insulation value is 0.5 clo. (0.08 m2 K/W), and the surface temperature of the clothes is close to that of the ambient air at 34.5 °C (tcloth) [15]; thus, the skin temperature is 37 °C (tskin) and approximately one-third of the human skin is exposed to air directly. For an adult with height of 1.78 m and weight of 65 kg, the average body surface temperature can be estimated as [15]:
Based on data from the field survey, the following conditions were included for further calculations (see Table 2).
Table 2.
Parameters for calculation of the heat transfer rate over the pedestrian’s body.
4.2. Case 1—Pedestrian Still and no Wind
4.2.1. Sensible Heat Convection over Pedestrian Body to Air
The human body in the gorge can be assumed to be an isothermal cylinder, whose sensible heat transfer rate can be calculated as follows, according to [18]:
where
See Table 2 for the input values for Equations (2)–(5).
To validate the reliability of the above method, the calculated convective heat transfer coefficient (hc) was compared with those calculated by the method of Birkebak [19]:
The relative error was found to be 6.3%, indicating the models show good agreement.
4.2.2. Radiation Dissipation
While people are in the Cold-Lane, the view factor between the human body and the surface of the ground and walls is close to 1.0. This is due to the high aspect ratio of 3 and the narrow width of the street canyon. In addition, it was observed that there was no direct solar radiation on the human body during the survey at 3:00 pm. Thus, it was assumed in this case that the heat transfer process is similar to that of a body with a temperature of 35.3 °C inside a cavity of 31.6 °C, and the heat flux can be calculated as follows [18]:
4.2.3. Latent Heat Transfer over the Human Body
The heat balance equation over the human body was used to evaluate the evaporative heating transfer rate over the human body [15]:
where M is the heat dissipation due to the metabolism, the metabolic rate (m) is at about 1.2 Met or equal to 70 W/m2 over the human skin when standing still [15]. Therefore:
where W is the mechanical output of the human body, which is about 0 W here; Qc is the sensible convective heat transfer rate, taken as 1.72 W from Equation (2); Qr is the radiation heat transfer rate, taken as 50.83 W from Equation (7); S is the heat storage of human body, assumed to be 0 W. Therefore, for a human body with 1.78 m2 skin area, the evaporative heat dissipation rate can be calculated as:
4.3. Case 2—Pedestrian Still and Windy
From field investigation, the average wind velocity v inside the street was found to be 0.29 m/s. The sensible convective heat transfer coefficient can be calculated according to [19] as:
Based on Equations (2) and (7), the evaporative heat dissipation rate can be obtained:
4.4. Case 3—Pedestrian Walking
This situation is similar to a pedestrian remaining still in a windy environment. Assuming walking speed is 1.2 m/s, and that the internal heat-generation rate rises to 2.6 Met (150 W/m2) [15], the evaporative heat dissipation rate can be calculated as:
4.5. Case 4—Pedestrian on the Outside Road
Using the above method with the surface temperature on the ground of the outside road (tr = 34.8 °C) from Table 2, and assuming the same air temperatures inside and outside the Cold-Lane, while the pedestrian stays still, the sensible long-wave radiative heat transfer rates are 1.73 W and 5.09 W, respectively. Therefore, the evaporative heat dissipation is:
Because there is no shading outside the road, the heat gain due to solar radiation Qsolar is calculated from the local monthly mean horizontal solar radiation intensity [20] and hypothetical exposure of half of the human skin surface area exposed to the outside [15]. Qsolar is about 327.70 W. Similarly, the evaporative heat dissipation rate while pedestrian remains still or is walking can be obtained as:
4.6. Results Analysis
Clearly, all parameters in the actual situations are dynamic and the analysis provided here is intended to show the heat transfer rates under typical situations. All results are displayed in Figure 12.
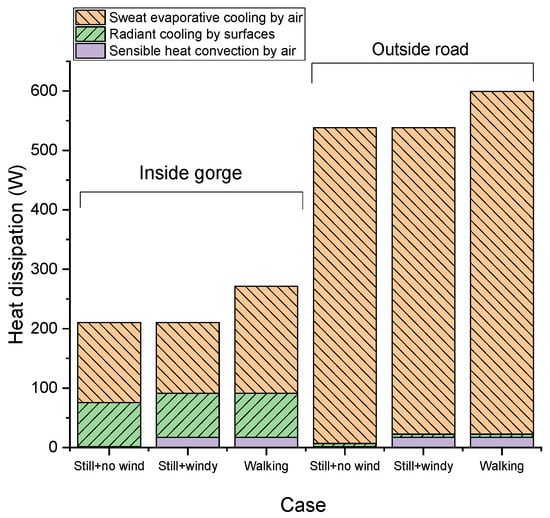
Figure 12.
Total heat gain and dissipation of the human body.
From Figure 12, it can be observed that:
- (1)
- The total heat gained by the human body inside the street is less than 50% of that gained outside the street. This is mainly due to the shading effect of the high walls on both sides of the narrow street.
- (2)
- Inside the gorge, the radiant heat dissipation accounts for about 30–40% of the total heat dissipation, which shows that the relatively low temperature of the ground and walls significantly cools the human body. Evaporative cooling accounts for 50–70%, which shows that sweating is essential in summer, even in the streets with shading. The proportion of sensible heat dissipation is very small. When people stand still and there is no wind, heat dissipation only accounts for 0.8%. When there is wind or when the pedestrian is walking, the proportion of heat dissipation rises to 8.2% and 6.4%, respectively. In this kind of street, compared to standing, the heat generated by walking can help increase the total body heat gain by 29%.
- (3)
- When the pedestrian is outside the road, the radiant heat dissipation from surrounding surfaces and sensible heat dissipation by the air become relatively very small, together accounting for less than 4.5%. Evaporative heat dissipation accounts for more than 95%. Correspondingly, the increase in heat gain due to walking decreased to 11% of the total heat gain.
5. The Influence of Street Aspect Ratio on the Shading Effect
The aspect ratio of the Cold-Lane is about 3–4, so the low temperature of the Cold-Lane is clearly due to the shading effect of the high walls on both sides. In the following section, computational flow dynamics (CFD) simulation is conducted to investigate the temperature variation at the inner surface of the street on 25 August with solar radiation and the different height-to-width ratios of the canyons.
5.1. CFD Simulation Setting and Validation
5.1.1. Building Model and Flow Field
Similar to Bottillo et al. [21], this study simulates solar ray tracing in the street canyon using Fluent software licensed from Ansys (Canonsburg, USA); in addition, however, the current study focuses on the inner surface temperature. To simplify the simulation, the Cold-Lane is considered to be a straight street canyon, with walls on both sides of 2 m in width and 20 m in length. Because the goal of this discussion is examination of the shading effect of walls with different heights, the heights of the walls were set to be 2, 4, 6, and 8 m, respectively, corresponding to aspect ratios of 1, 2, 3, and 4. The building model and the flow field are shown in the left schematic diagram in Figure 13, referring to the setting method from van Hooff et al. [22]. Based on the maximum height of the building (H = 8 m), the building is 24 m (3 H) away from the wind incoming flow entrance boundary in the north direction; 40 m (5 H) away from the west boundary, east boundary, and sky boundary; and 120 m (15 H) from the south wind outlet boundary. As shown in the right schematic diagram in Figure 13, following its trajectory, the sun shines on the east wall in the morning, vertically on the street ground at noon, and on the west wall in the afternoon.
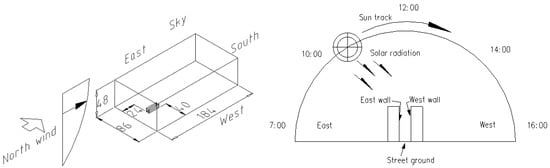
Figure 13.
Schematic diagram of flow field and sun altitude angle.
5.1.2. Boundary Conditions and Solution Settings
The inflow boundary condition of the flow field is set to be velocity-inlet, and the wind velocity is set to be 0.5 m/s at the pedestrian height of 1.5 m with a temperature of 300 K. The wind speed at the height of the building (assuming to be 8 m) comes from the distribution formula of the incoming air obtained from measurements in wind tunnel based on our previous studies [23,24], and can be calculated as:
where Uz (m/s) and UH (m/s) are the mean wind velocity at a height of z (m) and at the reference height of the building of H (m), respectively. The turbulent kinetic energy κ can be approximated by Equation (14):
where κ(z) (m2/s2) is the turbulent kinetic energy at a height of z (m).
For Equation (13), the wind velocity at 8 m height is calculated from the wind speed at pedestrian height, then compiled into a UDF (Universal Disk Format) file and imported into the velocity inlet boundary condition. The exit boundary is set to be vent-outlet, the west and east boundary conditions are set to be symmetric boundary, and the ground is adiabatic.
The interior of the walls on both sides of the street are red brick walls with density of 1668 kg/m3, specific heat of 754 kJ/(kg °C), thermal conductivity of 0.43 W/(m °C), and radiation absorption rate of 0.67. The interface between the walls and the surrounding air is a coupled boundary.
For the simulation of solar radiation on 25 August, assuming that the wall surface temperature increase due to solar radiation is a quasi-static process, the wall surface temperature at the beginning of each hour was simulated. The radiation model adopts solar ray tracing in discrete ordinates (DO). The building location is 112.3° E longitude and 28.6° N latitude, and the time period for simulation is 7:00 AM to 18:00 AM. Both direct solar and diffuse solar radiation were calculated.
The viscous model adopts the shear stress transport (SST) k-ω model, which was validated by Fu et al. [24] using the default settings. Four levels of street canyon heights (2, 4, 6, and 8 m), with one-hour intervals, from 7:00 to 18:00, were simulated. The modeling and CFD simulation time lasted for around 20 days.
This study considered three types of equal density mesh with grid sizes of 0.35, 0.5, and 0.7 m. The results show that the differences between these three grid sizes are very small, and finally 0.5 m was adopted in the CFD simulation. The control equations were discretized by the second-order finite element method. The Semi-Implicit Method for Pressure Linked Equations (SIMPLE) algorithm was used for pressure-velocity coupling, and all residuals were required to be less than 10−5 before being considered as converged. More information can be found in our previous research [23,24,25] in which the grid sensitivity analysis was carried out.
5.1.3. Temperature Data Processing
Due to the fact that the entire model is simplified and many factors are excluded, some discrepancy will exist between the outcomes of the temperature data from CFD simulation and the measured data. However, according to the principle of similarity, the distribution of the surface temperature field on the street ground and the inner wall are likely to be similar. Therefore, if the surface temperature data obtained by CFD simulation can be converted reasonably, compared with the measured data, it is possible to acquire reasonable results. In this study, it is assumed that the temperature distribution of the CFD simulation result is similar to that of the field measurement result, and approximately conforms to Equation (15):
where TCFD represents the surface temperature at any place obtained by CFD simulation; TCFD-lowest is the lowest temperature at the wall surface; TField represents the temperature measured at the same proportional position on site; and TCFD-lowest and TCFD-highest are the lowest and highest temperature, respectively.
5.1.4. Validation
Based on Equation (15), the temperature data simulated by CFD was converted into measured data at the corresponding position. Figure 14 shows the average of the inner surface temperature of the Cold-Lane (east wall, ground, and west wall) at different heights at 15:00 on 25 August, based on field measurements and CFD simulations. It can be observed from this figure that the difference in the temperature between the CFD simulation and measurement is less than 1 K.
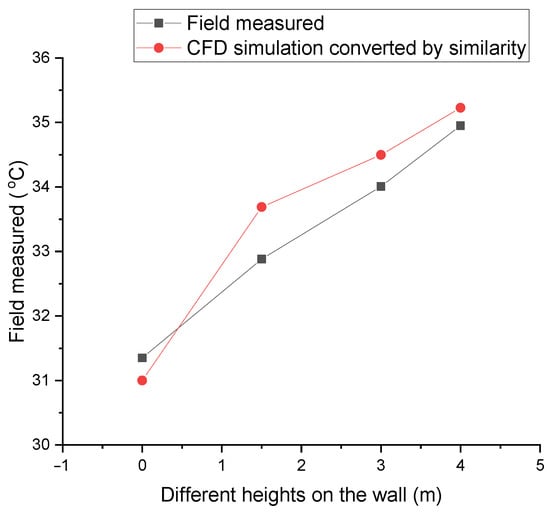
Figure 14.
Temperature at different heights by measurement and computational flow dynamics (CFD) simulation in the street canyon.
The comparison results at different times are shown in Figure 15. It can be seen that the CFD simulation value and the measured value has a similar trend. The average temperature difference between them is about 1.5 K with an error of 30%. Clearly, however, the measured temperature has a time delay, which may be caused by the heat storage of the wall and night-time ventilation.

Figure 15.
Hourly temperature by measurement and CFD simulation in the street canyon.
It can be seen from Figure 14 and Figure 15 that the spatial distribution of the temperature simulated and transformed by CFD is more accurate with a similar trend to the measured data. However, it has a time lag and an error of 30%. Therefore, in the following analysis, only the average temperature distribution on the surface of the block is analyzed, and the variations of temperatures over time are not considered.
5.2. Results Analysis
5.2.1. The Average Temperature in the Street Canyon with Different Aspect Ratios
It can be seen from Figure 16 that the average temperature at the inner surface of the canyon in the block decreases with the increase in aspect ratio. The average ground temperature drops by 0.2 K with every 1 m increase in height; that is, with the aspect ratio of 1 as the benchmark, each time the aspect ratio increases by 100%, the average temperature drops by about 0.4 K.
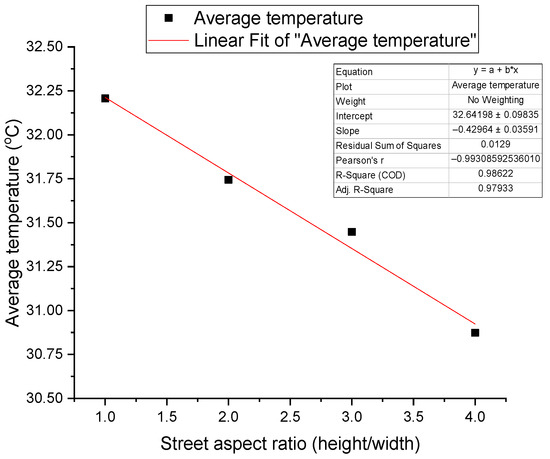
Figure 16.
Variation of the inner surface temperature with aspect ratio.
5.2.2. The Variation of Inner Surface Temperature in a Day
As shown in Figure 17, in the morning and evening hours, the surface temperature of the block (the average value of the west wall, ground, and east wall) is relatively low for all cases. However, at noon, the temperature difference between the different aspect ratios is relatively high. When the aspect ratio is 4, compared to an aspect ratio of 1, the average temperature is about 1.3 K higher. For all 12 h, the average difference between the two adjacent aspect ratios is around 0.4 K. It should be noted that there should be a time lag for surface temperature if the heat storage effect of the wall material is taken into account.
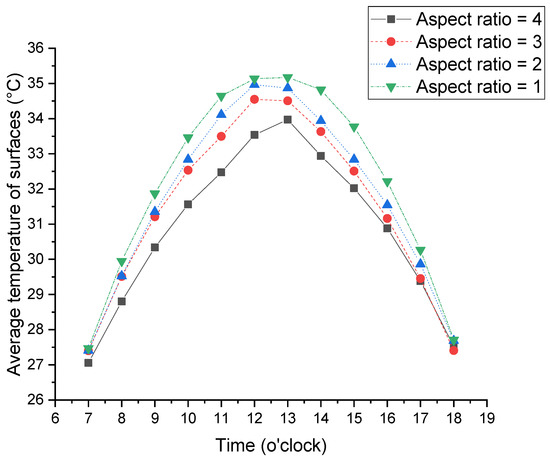
Figure 17.
Variation of the hourly average temperature under different aspect ratios during the day.
5.2.3. The Temperature Differences between the West Wall, Street Ground, and East Wall
It can be observed from Figure 18 that the ground temperature of the street at noon is obviously higher than that of the east wall and the west wall, which is caused by the direct solar radiation on the ground. However, the ground temperature is the lowest in the morning and afternoon, which is due to the shading effect from the walls on both sides of the street.
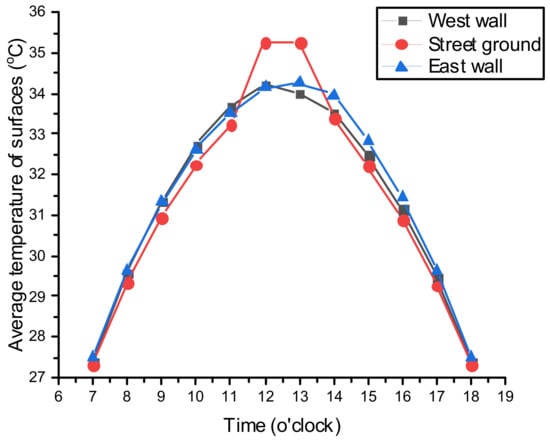
Figure 18.
Variation of the hourly average temperature on the west wall, street ground, and east wall, with an aspect ratio of 3.
The temperature on the west wall surface was the highest in the morning, which is caused by direct solar radiation from the east in the morning, as shown in the right schematic diagram of Figure 13. In the afternoon, the surface temperature of the east wall was the highest, which is caused by solar radiation from the west. For the other three aspect ratios (1, 2, and 4), the same temperature trend can be observed.
5.2.4. The Influence of Incoming Wind Speed on Wall Surface Temperature
It is assumed that that the wind speed at the pedestrian height of 1.5 m increases from 0.5 m/s to 1 m/s and to 1.5 m/s, and the air temperature is 300 K at 3:00 pm on 25 August. As shown in Figure 19, for every 1 m/s increase in wind velocity, the surface temperature of the west wall, ground, and east wall drop by an average of 2.4 K. This indicates that increasing the wind speed can effectively reduce the wall temperature in the street canyon.
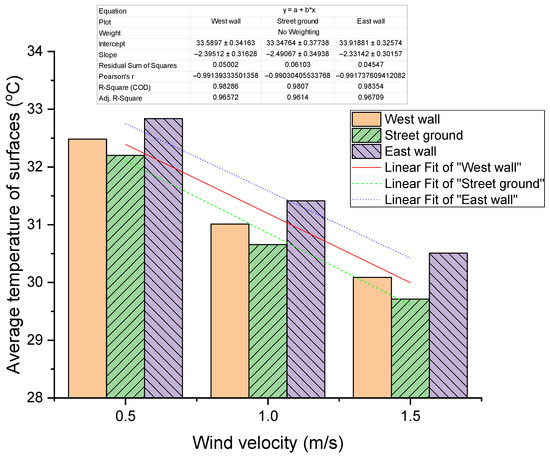
Figure 19.
The average temperature of each inner surface at different wind velocities.
6. Conclusions
The Cold-Lane in central China within a hot-summer and cold-winter region can make pedestrians feel cool during a hot summer. The following conclusions can be made:
- The air temperature difference between the inside and outside of the lane is less than 2 °C, and the difference in relative humidity and air velocity are less than 10% and 0.5 m/s, respectively. The small differences indicate that they are clearly not the factors producing the cold sensation felt by pedestrians.
- The highest surface temperature of the inner wall is less than 39 °C, which is relatively low. The walls and ground are cooled by radiative heat dissipation and ventilation at night.
- Based on the calculation of the specific four cases at 3:00 pm, it is observed that the proportion of sensible heat dissipation is small, and radiative cooling between the human body and low-temperature surfaces of the inner wall plays an important role in cooling down the pedestrian. This is similar to the conclusion reached by Rosso et al. [9] that pedestrians are sensitive to lower surface temperatures.
- Under the conditions of this study, for every 1 m increase in the height of the walls on both sides, the average temperature throughout the day decreases by 0.2 K. When the wind velocity across the street increases by 0.5 m/s, the average surface temperature drops by 1.2 K. Thus, increasing the aspect ratio of the street canyon and enhancing natural ventilation can both effectively reduce the temperature of the inner surface of the street and improve the thermal comfort for pedestrians.
It should be noted that there are some limitations with this study. Due to the limited conditions, this article is only a preliminary investigation. In addition, the quantity of data collected is insufficient and many parameters were assumed during the calculation process. Firstly, the air temperature and wall temperature were surveyed for only three days in the street canyon. Secondly, a large number of assumptions were made in the calculation of pedestrian heat dissipation, e.g., in Section 4, the human body and clothing were regarded as a whole. Thirdly, in the CFD simulation, the model was also simplified, and only the situation on 25 August was analyzed. However, due to the similarity between the field investigation and simulation in the flow and temperature fields, similar trends were exhibited in the two sets of results, which revealed the basic characteristics of the Cold-Lane. More detailed investigation of thermal comfort and CFD simulation in the street will be carried out in the future.
Author Contributions
Y.L., H.C., W.Y., M.K. and G.Z. contributed to the conception of the study, the development of the methodology. Y.W. and X.C. developed computer models, and simulated and analyzed data. W.Y. and Y.L. contributed to the whole revision process. X.L., G.Z., Y.L., Y.W. and G.Z. wrote the manuscript. All authors have read and agreed to the published version of the manuscript.
Funding
This research was funded by Machinery Industry Innovation Platform Construction Project: Key Laboratory of Healthy Environment and Energy Conservation of Large-space Plants (Grant No. 2019SA-10-07), International Science and Technology Cooperation Program of China grant number 2014DFA72190, 201413370083, 201513370014, China Scholarship Council, Natural Science Foundation of China, grant number 51308206, China Postdoctoral Science Foundation, Natural Science Foundation of Hunan, grant number 201631440729, IEA-EBC Annex 62--Ventilative Cooling, and Annex80--Resilient Cooling.
Acknowledgments
Thanks for the work from Quan Tu, Liang Wei, Dong Cao and Qu Ye.
Conflicts of Interest
The authors declare no conflict of interest.
Nomenclature
| A | human body surface area, taken as 1.78, m2 |
| g | gravity of acceleration, m/s2 |
| Gr | Grashof number, dimensionless |
| hc | sensible convection heat transfer coefficient, W/(m2 °C) |
| l | characteristic length taken as human height, assumed as 1.78 m |
| M | heat dissipation due to metabolism, W |
| m | metabolic rate, W/m2 |
| Nu | Nusselt number, dimensionless |
| Pr | Prandtl number, dimensionless |
| Qc | sensible heat transfer rate of a human body, W |
| Qr | radiant heat flux, W |
| S | heat storage of human body, W. |
| ta | air dry-bulb temperature, °C |
| tcloth | surface temperature of clothes, °C |
| th | equivalent human body surface temperature, °C |
| tskin | skin temperature, respectively, °C |
| tw | mean surface temperature of wall in the street, °C |
| W | mechanical output of human body, W |
| α | expansion factor, equal to 1/(273 + tm), in which tm is (th + ta)* 1/2, °C−1 |
| ε | emissivity of human body, taken as 0.85 |
| λ | thermal conductivity of the air, W/(m K) |
| σ | blackbody radiation constant from law of Stefan-Boltzmann, taken as 5.67×10⁻⁸ W/m2·K4 |
| υ | kinematic viscosity of the air, taken as 16.5 × 10⁻⁶ m2/s |
| Δt | temperature difference between ambient air and human body, equal to (th−ta), °C |
References
- Blocken, B.; Carmeliet, J. Pedestrian wind environment around buildings: Literature review and practical examples. J. Therm. Envel. Build. Sci. 2004, 28, 107–159. [Google Scholar] [CrossRef]
- Jamei, E.; Rajagopalan, P.; Seyedmahmoudian, M.; Jamei, Y. Review on the impact of urban geometry and pedestrian level greening on outdoor thermal comfort. Renew. Sustain. Energy Rev. 2016, 54, 1002–1017. [Google Scholar] [CrossRef]
- Morakinyo, T.E.; Kong, L.; Lau, K.K.L.; Yuan, C.; Ng, E. A study on the impact of shadow-cast and tree species on in-canyon and neighborhood’s thermal comfort. Build. Environ. 2017, 115, 1–17. [Google Scholar] [CrossRef]
- Nagara, K.; Shimoda, Y.; Mizuno, M. Evaluation of the thermal environment in an outdoor pedestrian space. Atmos. Environ. 1996, 30, 497–505. [Google Scholar] [CrossRef]
- Santamouris, M.; Papanikolaou, N.; Koronakis, I.; Livada, I.; Asimakopoulos, D. Thermal and air flow characteristics in a deep pedestrian canyon under hot weather conditions. Atmos. Environ. 1999, 33, 4503–4521. [Google Scholar] [CrossRef]
- Pearlmutter, D.; Berliner, P.; Shaviv, E. Integrated modeling of pedestrian energy exchange and thermal comfort in urban street canyons. Build. Environ. 2007, 42, 2396–2409. [Google Scholar] [CrossRef]
- Pantavou, K.; Theoharatos, G.; Santamouris, M.; Asimakopoulos, D. Outdoor thermal sensation of pedestrians in a Mediterranean climate and a comparison with UTCI. Build. Environ. 2013, 66, 82–95. [Google Scholar] [CrossRef]
- Hong, B.; Lin, B. Numerical studies of the outdoor wind environment and thermal comfort at pedestrian level in housing blocks with different building layout patterns and trees arrangement. Renew. Energy 2015, 73, 18–27. [Google Scholar] [CrossRef]
- Rosso, F.; Pisello, A.L.; Cotana, F.; Ferrero, M. On the thermal and visual pedestrians’ perception about cool natural stones for urban paving: A field survey in summer conditions. Build. Environ. 2016, 107, 198–214. [Google Scholar] [CrossRef]
- Jamei, E.; Rajagopalan, P. Urban development and pedestrian thermal comfort in Melbourne. Sol. Energy 2017, 144, 681–698. [Google Scholar] [CrossRef]
- Zhang, Y.; Du, X.; Shi, Y. Effects of street canyon design on pedestrian thermal comfort in the hot-humid area of China. Int. J. Biometeorol. 2017, 61, 1–12. [Google Scholar] [CrossRef]
- Chen, X.; Zhong, D. Passive energy conservation strategy of natural ventilation. China J. Archit. 2011, 9, 34–37. [Google Scholar]
- Chen, X.; Zhong, D. The principles of passive-cooling alley and its inspiration. New Archit. China 2011, 88–91. [Google Scholar] [CrossRef]
- Ma, J. Analysis of Natural Ventilation in Cold Gorge. Master’s Thesis, Guangzhou University, Guangzhou, China, 2011; pp. 13–53. (In Chinese). [Google Scholar]
- Zhu, Y. Building Environment, 4th ed.; China Building Industry Press: Beijing, China, 2016. [Google Scholar]
- Höppe, P. The physiological equivalent temperature—A universal index for the biometeorological assessment of the thermal environment. Int. J. Biometeorol. 1999, 43, 71–75. [Google Scholar] [CrossRef] [PubMed]
- Weather Underground. 2020. Available online: http://www.wunderground.com (accessed on 15 May 2020).
- Yang, S.; Tao, W. Heat Transfer, 4th ed.; Higher Education Press: Beijing, China, 2006. [Google Scholar]
- McIntyre, D.A. Indoor Climate; Applied Science Publisher: London, UK, 1980. [Google Scholar]
- China Meteorological Administration, Tsinghua University. China Meteorological Dataset for Building Thermal Environment; China Building Industry Press: Beijing, China, 2005. [Google Scholar]
- Bottillo, S.; De Lieto Vollaro, A.; Galli, G.; Vallati, A. CFD modeling of the impact of solar radiation in a tridimensional urban canyon at different wind conditions. Sol. Energy 2014, 102, 212–222. [Google Scholar] [CrossRef]
- Van Hooff, T.; Blocken, B.; Tominaga, Y. On the accuracy of CFD simulations of cross-ventilation flows for a generic isolated building: Comparison of RANS, LES and experiments. Build. Environ. 2016, 114, 148–165. [Google Scholar] [CrossRef]
- Wang, T.; Yin, W.; Fu, L.; Zhang, Z. Estimation model for natural ventilation by wind force considering wind direction and building orientation for low-rise building in China. Indoor Built Environ. 2020, 8. [Google Scholar] [CrossRef]
- Fu, L.; Yin, W.; Wang, T.; Zhang, G. Effect of the porosity the upstream building on the natural ventilation of the downstream building and the reliability of its computational fluid dynamics simulation. J. Civ. Environ. Eng. 2020. [Google Scholar] [CrossRef]
- Fu, L.; Yin, W.; Wang, T.; Hao, X.; Liu, H.; Zhang, G.; Chen, H. Reliability of CFD simulation for the wind pressure on a cubic after another cavity in comparison of wind tunnel experiment. J. Civ. Environ. Eng. 2020, 42, 180–190. [Google Scholar]
Publisher’s Note: MDPI stays neutral with regard to jurisdictional claims in published maps and institutional affiliations. |
© 2020 by the authors. Licensee MDPI, Basel, Switzerland. This article is an open access article distributed under the terms and conditions of the Creative Commons Attribution (CC BY) license (http://creativecommons.org/licenses/by/4.0/).