Abstract
In this article the solution based on hydrogen generation to increase the flexibility of energy storage systems is proposed. Operating characteristics of a hydrogen generator with integrated electrical energy storage and a photovoltaic installation were determined. The key role of the electricity storage in the proposed system was to maintain the highest operating efficiency related to the nominal parameters of the hydrogen generator. The hydrogen generators achieved the highest energy efficiency for the nominal operating point at the highest power output. Lead-acid batteries were used to ensure the optimal operating conditions for the hydrogen generator supplied with renewable energy throughout the day. The proposed system reduces significantly the hydrogen generator nominal power and devices in system operate in such a way to improve their efficiency and durability. The relations between individual components and their constraints were determined. The proposed solution is fully in-line with previously investigated technologies for improving grid stability and can help incorporate renewable energy sources to increase the sustainability of the energy sector and green hydrogen production.
1. Introduction
Renewable energy sources (RES), such as solar and wind farms [1,2], have recently grown in popularity because of the desire to decrease reliance on fossil fuels in the energy sector. The conversion of non-renewable fuels into other forms of useful energy releases large amounts of pollution, which can harm the environment. The constantly growing need for energy requires the development of new energy systems that are sustainable and effective [3,4]. Many countries have built power plants based on renewable energy sources, most of which are directly connected to the power grid. Because of the legal framework that determines the priority of energy from RES, all generated energy is fed into the power system, irrespective of the current demand. This may require additional regulatory mechanisms that contribute to network stabilization [5,6,7]. Because of frequent and dynamic changes in RES-generated power, the operation of photovoltaic and wind farms can reduce the quality of electricity in the network. Therefore, it is important to develop technologies for storing the energy generated by RES [8,9,10].
Photovoltaic installations (PV) have rapidly developed. Most of PVs are connected to the power grid through inverters because of the relatively simple construction of this type of installation, as well as the lower investment costs compared with systems equipped with electrical energy storage. However, this solution also has a significant negative impact on the stability of the power grid. The operation of PV installations primarily depends on the instantaneous solar radiation intensity and the temperature of the solar cell, which are both related to the geographical location and local climatic conditions.
In addition to the constant changes in solar radiation intensity due to the earth’s rotation, cloudiness causes sudden changes in the power generated by PV installations, resulting in unstable operation of the grid. This significantly affects the amount of electricity generated throughout the day, but in this case, long-term changes in weather conditions and seasons are more important [11,12].
In the coming years, the problem of stabilizing grid parameters and adapting generated power to the demand with many unstable energy sources must be solved [13,14]. If the majority of electricity is generated from renewable sources, the capacity of wind and solar energy installations will be enormous and will significantly exceed the instantaneous power demand. Cross-border shipping (exports) may not be enough, as atmospheric conditions can be very similar in neighboring countries. One of the possible solutions for managing excess power is energy storage [15,16].
Power-to-gas (P2G) and power-to-gas-to-power (P2G2P) systems can be used to store the energy generated from wind and PV farms [17]. As part of P2G or P2G2P installations, hydrogen is generated in the process of water electrolysis, which does not require the use of fossil fuels [18]. The electricity necessary for electrolysis comes from renewable energy installations or from the power system during excess production. Electrolyzers, which are responsible for water electrolysis process has a high total efficiency of up to 80%; however, because of the need for multiple energy conversion, the efficiencies of P2G2P installations are limited to 40% [19,20]. The vital role for these systems is buffering electricity during overproduction. The stored energy can be fed back into the grid when the electricity demand exceeds the production. It is postulated that properly utilizing the plants designed to buffer the surplus electricity may help conventional plants adapt to the current system demand. This may allow for their effective use in the National Power System, using both conventional power plants with limited flexibility and renewable energy sources [21]. Research is still being carried out globally to improve the efficiency of energy storage solutions, such as P2G systems. Relevant studies cover both the technological side in terms of the use of new types of devices (e.g., electrolyzers) [22,23], numerical analyses [24], as well as the impact of such installations on the functioning of power systems [25,26]. Further research will improve the way pilot and demonstration plants operate and also increase the efficiency of energy storage systems. These activities may positively impact the flexibility of power systems while increasing the stability of their operation.
For distributed low-energy sources, the most mature energy storage technology is electrochemical batteries, which are most often used in systems that operate in one-day cycles. The long-term storage of large amounts of energy is possible by using Power-To-Gas technology, which uses electrolyzers to produce hydrogen. To replace fossil fuels with renewable energy sources, extending the energy storage time is a priority. Although the total efficiencies of energy storage in power-to-gas or power-to-gas-to-power systems are significantly lower than systems using electrochemical batteries, the ability to store greater amounts of surplus energy may be more important.
Hydrogen tanks have energy storage densities that are several times higher than batteries, so the use of hydrogen as an energy carrier allows larger amounts of energy to be stored for a longer time. In addition, power-to-gas installations are more durable and do not require the use of large amounts of metals, such as lead, whereas the use of batteries allows for very flexible electricity storage. Hybrid systems take advantage of the benefits of each technology and reduce the weakness of entire installations.
Extensive research on PV cooperating with energy storage systems are conducted all over the world. For example, in reference [27] the authors show a photovoltaics installation connected with a hydrogen production system. Paper demonstrates that with a proper design of the system proposed by the authors it can operate correctly charging the batteries, supplying the electrolyzer, and occasionally producing excess electricity. The paper [28] presents a self-sufficient solution for residential buildings with photovoltaic and battery storage systems. Model presented by the authors included hybrid PV and hydrogen fuel cell installation with a battery energy storage unit for system optimization. In reference [29] a study of optimum design, size, and economic analysis of photovoltaic installations with a battery system and a standalone photovoltaic with battery and hydrogen production are shown. In another reference [30] authors proposed the photovoltaic-hydrogen-fuel cell installation as a solution for reactive power control and optimization solution which can help improve the quality of supplied power. Another PV-H2 installation is presented by the authors in [31]. The research shows two solutions—with and without batteries’ subsystem, as well as two different locations to find the best balance between the efficiency and sizes of the installations. Photovoltaic systems are also frequently connected with wind installations in hybrid units for hydrogen production [32,33]. Review of recent trends in optimization techniques for PV-wind hybrid energy systems are presented in [34]. Solutions for systems containing photovoltaic installations with Proton Exchange Membrane (PEM) electrolyzers for hydrogen production are presented in [35,36,37].
The main novelty of the paper is the evaluation of the concept of using a lead-acid battery as an electrical energy buffer to ensure the operation of a hydrogen generator with its nominal parameters, despite being supplied only from a photovoltaic installation. The characteristics of individual devices included in the installation were investigated, and the basic criteria for cooperation between them were determined. PV panels were used to generate electricity to supply PEM-type electrolyzers, which are the main component of hydrogen generators, and to charge an electricity storage buffer. All measurements were conducted simultaneously.
2. Experimental Setup
The main purpose of this work was to determine the characteristics of devices directly powered by electricity from photovoltaic panels. The following quantities were measured: current supplying the electrolyzers (Isupply), the hydrogen stream generated during electrolysis (), the temperature of the electrolyzers (Telectrolyser), the temperature of the generator cooler (Tcool), the current (Ibatt) and voltage (Ubatt) during battery charge and discharge, and the value of the load current (Iload). The battery was connected to solar panels via a charge controller.
2.1. Photovoltaics
Two types of polycrystalline photovoltaic panels were used in the research installation, each consisted of 60 cells connected in series. The panel used three bypass diodes that were successively connected in parallel to 20 cells. The parameters of the panels are presented in Table 1. STC stands for “Standard Test Conditions” and is an industry standard used to indicate the performance of PV panels, and indicates an irradiance of 1000 W/m2 with an air mass 1.5 (AM1.5) spectrum and a cell temperature of 25 °C.

Table 1.
Parameters of the photovoltaic panels used in the laboratory stand.
The panels were placed on the roof of a building with geographical coordinates of 50°17′36″ N 18°40′55″ E. The panels were positioned at an angle of 50° to the horizontal and facing 30° southeast (SE). This arrangement was dictated by the location of the building. The panels were connected to two energy storage installations. Photovoltaic panels labeled PV2 and PV3 were connected to the electrolyzers, while the panel PV1 was connected to the battery charging system.
2.2. Electrolyzers
The basic component of the research installation was a hydrogen generator equipped with two PEM electrolyzers that were electrically connected in series and directly supplied from the solar panels. An accurate description of the PEM technology was presented in the references [38,39,40]. The generated hydrogen was fed into one discharge pipe. The maximum output hydrogen pressure is 5 bar. The electrolyzers had similar electrical parameters. For a single electrolyzer, the supply current was 13 A, and the supply voltage was 14 V (at the nominal operating point of the electrolyzer). In this type of electrolyzer, water was supplied to the anode (positive electrode), where it was broken down into hydrogen and oxygen. The positive electrode and the negative electrode (cathode) were separated by a polymer membrane, which was penetrated by H+ ions. The cations were reduced to molecular hydrogen within the cathode. The chemical reactions describing the PEM electrolyzers operation are presented in Equation (1) for the anode and Equation (2) for the cathode [41,42]. The scheme of the device is presented in Figure 1.
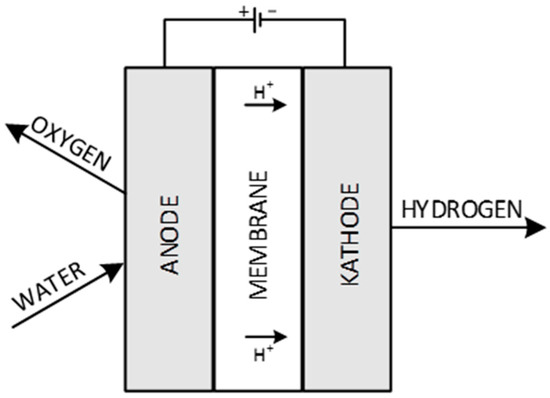
Figure 1.
PEM electrolyzer scheme.
The direct cooperation of the hydrogen generator with the PV system allowed various supply current values to be analyzed. In addition to the electrolyzers, the hydrogen generator consisted of a feed water tank, a pump that circulated water through the electrolyzer, a cooling system, and a hydrogen treatment system. The cooler maintained the optimal temperature of the electrolyzer. Equipping the hydrogen generator with a cooling system stabilized the operating temperature of the membrane electrolyzers, while a set of basic filters on the hydrogen discharge pipe maintained its high purity. Hydrogen generators are designed to operate at nominal parameters because this is when they achieve maximum efficiency with maximum operating capacity [20,43]. The variability of a generator’s efficiency as a function of supply current may depend on multiple parameters, such as the types of electrolyzers used, the generator size, the generator’s own needs factor, and the electrolyte temperature [20]. The hydrogen generator installation includes numerous auxiliary devices that also require electricity. Hydrogen generators are designed to be supplied from the electrical grid, while electrolyzers require DC power supply. The AC/DC conversion process causes additional energy losses, depending on the efficiency of the rectifier.
Figure 2 presents the scheme of the H2 generator installation supplied by a PV system. The auxiliary devices, i.e., pumps, fans, electric valves, and the measurement and data acquisition system, were supplied by an AC network. The power to supply all the auxiliary devices of hydrogen generator was constant (29 W) and it was not related to the output stream.
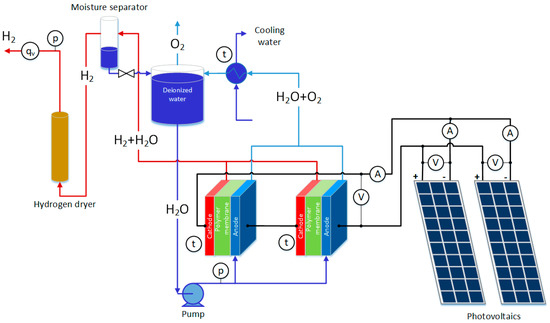
Figure 2.
Scheme of the electrolyzers supplied with electricity from photovoltaic (PV) panels.
The electrolyzer efficiency was calculated according to Equation (3) using the consumed power and the generated H2 flowrate. Figure 3 presents the efficiency of the investigated electrolyzer as a function of the generator supply power, which is the sum of the electrolyzer power and the auxiliary device power.
where:
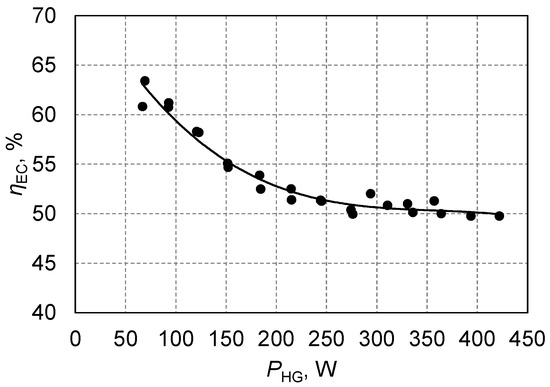
Figure 3.
Electrolyzer efficiency as a function of hydrogen generator supply power.
- —higher heating value of hydrogen, 1.275 × 10⁷ J/m3,
- U—electrolyzer voltage, V,
- I—electrolyzer current supply, A,
- —hydrogen flowrate, m3/s,
- PE—electrolyzer supply power, W.
Based on previous tests, a minimum efficiency of 49.8% was obtained at the highest hydrogen generator power, while decreasing the power supplied to the device to 69 W increased the efficiency of the electrolyzer to 63.8%.
The efficiency of the generator was lower than the electrolyzer because of the need to power the auxiliary devices and AC/DC conversion losses in the hydrogen generator energy balance. The generator’s efficiency was calculated using Equation (4) and is presented in Figure 4. The investigated hydrogen generator had a maximum efficiency of 46.5% at maximum power. The highest operating efficiency of this type of equipment was obtained for the nominal operating point at the highest power output.
where:
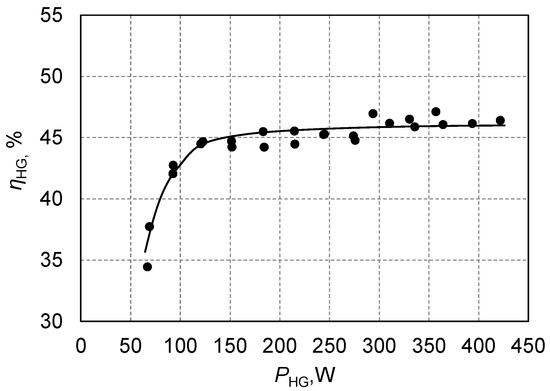
Figure 4.
Hydrogen generator efficiency as a function of supply power.
- PHG—hydrogen generator supply power, W.
2.3. Charge Controller and Battery
The second part of the investigated setup was electrical energy storage supplied with electricity from PV panels, according to the scheme presented in Figure 5. A charge controller was equipped with a photovoltaic panel (PV1), a typical lead-acid battery (voltage 12 V) with a capacity of 56 Ah and a regulated load—resistor with variable resistance. This battery allows storage of about 0.55 kWh of energy when depth of discharge up to 80% is adopted.
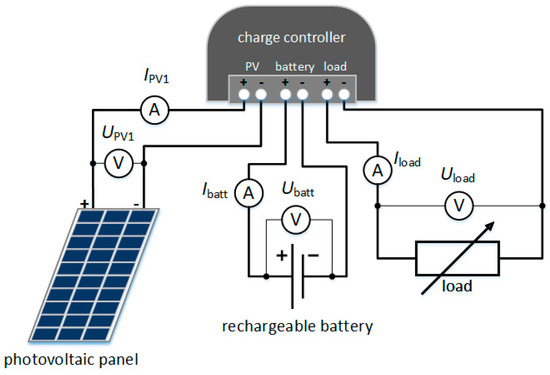
Figure 5.
Scheme of the PV-battery experimental setup.
In the system presented in Figure 5, the following quantities were measured: the current (IPV1) and voltage (UPV1) of the PV panel, the current (Ibatt) and voltage (Ubatt) of the battery, and the current (Iload) and voltage (Uload) of the variable resistor. The energy flowing into the charge controller was assumed to be positive, and the outflow was negative. According to this assumption, positive Ibatt values corresponded to battery discharge, while negative values corresponded to the battery charge. The values of Iload were always negative.
The main component of this system was the charging controller, which allowed the PV panel to be connected to the battery. It also allowed the load to be connected and prevent the battery from deep discharge and overcharging. The system utilized a maximum power point tracking (MPPT) controller, parameters of which are presented in Table 2. The MPPT allowed the PV panel to be loaded at the point corresponding to the maximum power for the given irradiance values on the panel surface and its temperature.
Table 2.
Parameters of solar charge controller with maximum power point tracking (MPPT).
The devices used in the system (Figure 5) did not allow for the maximum utilization of energy from the PV panel. The main limitation was the battery capacity, and secondary limitations were the operating parameters and efficiency of the charge controller. Controller efficiency is usually very high, reaching values over 98%. The operation of the charge controller was also limited by the minimum open-circuit voltage of the PV panel. Therefore, the system did not work at low irradiance. If the elements of the system are properly selected, the amount of energy lost for these reasons will be negligible.
The battery capacity is key to system operation and the use of solar energy. This capacity depends on the energy consumption of the receivers, the amount of energy produced in PV panels, and the operating cycle of the batteries. Because of large irradiance variations, it is difficult to select the appropriate PV peak power and battery capacity that will ensure the uninterrupted operation of receivers throughout the year in an off-grid system. When a large battery is installed, the operation may constantly be in an incomplete state of charge, which negatively affects its durability, and also increases the initial investment. A low battery capacity, sufficient to continuously supply the receiver for one day, may not provide enough energy for the receivers in the case of several consecutive days with low insolation. It may also prevent the complete collection of energy from PV1 panels when there are several consecutive days with high solar insolation. Considering the system operation in a one-day cycle, the use of a battery ensures continuous operation of the receiver with a demand of 0.55 kWh per day. On the other hand, the PV panel, with annual insolation similar to Poland, produces an average of 0.6 kWh per day and cannot generate enough energy to supply the receiver all day for about 180 days.
3. Results and Discussion
3.1. PV—Electrolyzer Setup
Measurements were carried out in clear weather in October 2018. The measured quantities were recorded every 30 s throughout a full day. Figure 6 shows the values of solar irradiance in the plane of the modules, ambient temperature, and temperature on one of the PV panels (TPV1). Ambient temperature was measured by thermometer placed behind the PV panel, whereas panels’ temperature was averaged from the measurements by two contact thermometers (one-wire type) connected to the back side of a one panel. It was assumed that panels’ temperature is the same. The rapid increase in the measured irradiance around 8:15 AM was related to a shadow of a building affecting the modules before this time, while a temporary increase around 10:30 AM was associated with the reflection of sunlight from the windows of the adjacent building.
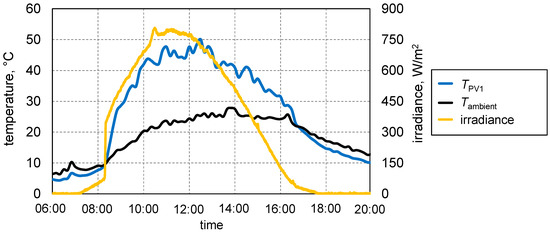
Figure 6.
Measured solar irradiance, ambient temperature, and temperature of the PV panel during measurements.
The maximum irradiance was 807 W/m2, and the panel warmed to 50 °C during the experiment. The ambient temperature was in the range of 20–28 °C. The PV temperature linearly increased by about 10 °C for every 300 W/m2 increase in the irradiance. The PV temperature increase decreased the open-circuit voltage UOC and maximum power Pmax and also changed the shape of the current–voltage characteristics. This means that solar panels must be loaded with different resistance, depending on the radiation intensity and temperature. Figure 7 presents the relation between the photovoltaic panel temperature and the solar irradiance at an ambient temperature (Tambient) of about 25 °C.
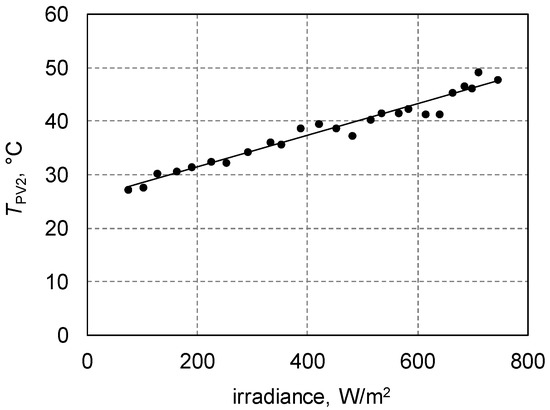
Figure 7.
PV panel temperature as a function of solar irradiance; Tambient ≈ 25 °C.
Figure 8 presents the current supplying the H2 generator, temperature of the electrolyzer, and the hydrogen flow rate. The maximum flow rate during the measurements was 0.63 dm3/min and the supply current was 9.9 A. The hydrogen generator could not operate with a constant load because of variable solar radiation throughout the day.
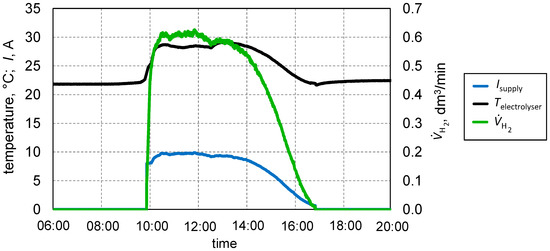
Figure 8.
The current supplying the H2 generator, temperature of the electrolyzer, and hydrogen flow rate during measurements.
Figure 9 presents the hydrogen flowrate as a function of the investigated generator supply current. According to Faraday’s first law of electrolysis (Equation (5)), the mass of substance generated during electrolysis is proportional to the current passing through the electrolyte [44]. In this case, some hydrogen was lost in the flow system, and some passed through the membrane; therefore, the flow of hydrogen appeared at currents exceeding 0.5 A, and then increased linearly.
where:
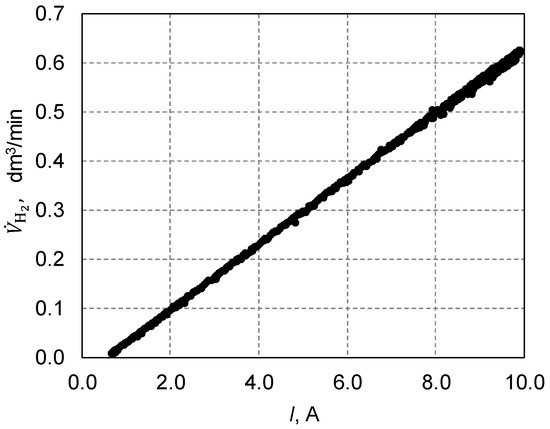
Figure 9.
The hydrogen flow rate as a function of the H2 generator supply current.
- m—mass of the substance, kg,
- q—electric charge, C,
- ke—electrochemical equivalent, kg/C,
- I—current, A,
- τ—time, s.
Figure 10 shows the current–voltage characteristics of two PEM electrolyzers connected in series and the characteristics of two photovoltaic panels connected in parallel. The electrolyzers characteristic was obtained based on experimental results, whereas characteristics of photovoltaic panels were determined using the electrical model of a photovoltaic cell based on the rated data. The voltage of the electrolyzer significantly increased with increasing current, but it was not a linear relationship because of the changes in the electrolyzer parameters (internal resistance) when the current was changed. The maximum voltage of the two electrolyzers was 28 V. Connecting the electrolyzers directly to the PV panels requires appropriately adjusting the parameters of these devices to each other. This applies mainly to the electrolyzer voltage, which should correspond to the voltage at the maximum power point UMPP of the PV panels, irrespective of the irradiance and temperature. Theoretically, such a combination is possible, but only over a small range of changes in the irradiance and temperature of the photovoltaic panel. Because of the large changes in these quantities throughout a day, it is not possible to continuously load PV panels at the maximum power point. Thus, not all usable solar irradiance will be transformed in the PV cells.
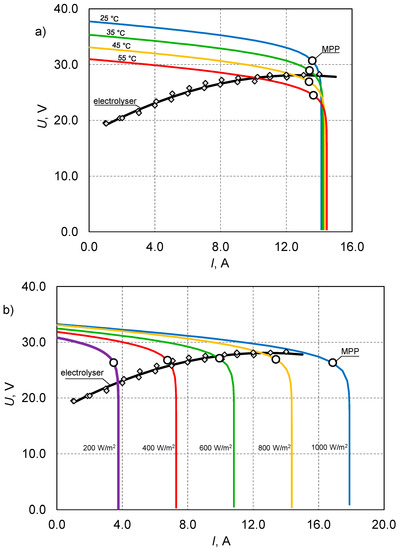
Figure 10.
The current–voltage characteristics of two PEM electrolyzers connected in series, and the characteristics of two photovoltaic panels connected in parallel: (a) at different temperatures (irradiance 800 W/m2), (b) at different irradiance (panel temperature 45 °C).
When the generator supply current changes because of the variable power generated by the photovoltaic system, the hydrogen generator voltage also changes. A change in the supply current from 0.65 A to 10 A changed the voltage from 17.8 V to 28 V. Hydrogen generators in energy storage installations such as power-to-gas or power-to-gas-to-power systems are electricity receivers and can receive energy immediately after switching on; however, continuous operation in the regime of variable supply parameters impacts its performance and efficiency.
In this type of system, the electrolyzer nominal power should be slightly lower than the maximum power of the PV panels. In general, PV panels only reach maximum power for a few hours per year, and it is theoretically possible to temporarily overload the electrolyzers without causing damage. However, because of the relatively fewer hours per year in which solar radiation conditions correspond to the STC conditions, directly connecting the electrolyzers to PV panels causes them to work at maximum efficiency for only several dozen hours per year.
3.2. PV—Battery Setup
Figure 11 presents the results of the measurements that were carried out on the same day as the electrolyzer measurements. The charging controller system was started the day before the measurements, and the battery was discharged at night until the voltage reached 11.6 V, which corresponds to complete battery discharge. The load was constantly connected to the charge controller.
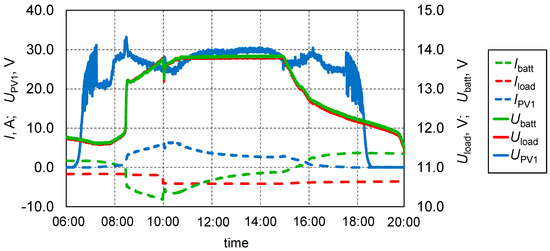
Figure 11.
Current and voltage values in the PV-battery setup.
The controller began to draw energy from the PV panel when the irradiance exceeded 5 W/m2, and IPV1 increased and Ibatt decreased. The battery charging began when the power of the PV panel at the maximum power point (MPP) was greater than the power consumed by the load and the sum of losses in the charging controller. During system operation, Ubatt was stabilized by the controller, and the battery was considered to be charged to its maximal level. At the same time, IPV1 gradually decreased and followed a trend that was completely different than the irradiance changes, indicating that the charge controller did not load the PV panel at the MPP. The battery capacity was too small to receive all the usable energy from the PV panel.
Because of the different voltage in systems with a charge controller, it is better to present the system operation using power flows through a controller (Figure 12). To generalize the results, all powers were referenced to the surface of the PV panels connected to the installation and described as surface power density (kW/m2). As a result, it is possible to compare the installations with different powers and to match the received power with the solar irradiance. PPV23 refers to the sum of the power of panels PV2 and PV3 connected to the electrolyzers. The PV1 panel started to generate energy at 7:17 AM. Charging of the battery started at 8:26 AM, when the PPV1 power exceeded Pload value. The charge controller loaded the PV1 panel at the MPP point until the end-of-charge voltage was reached on the battery. For the later part of the day, the battery was only charged, while the PV1 panel was not loaded in the MPP. At 10:00 the load was changed by increasing the Pload value and the electrolyzers were connected to the PV23 panels.
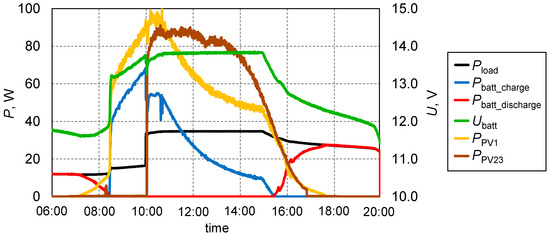
Figure 12.
Power flows in the PV-battery setup.
Until the battery is fully charged, the power obtained from the solar panel connected to the charge controller will be higher than the power of the panels connected to the electrolyzers. When the voltage corresponding to a fully charged battery was reached, PPV1 was significantly lower than PPV23, even though panels PV2 and PV3 did not work at the maximum power point. PPV1 of the panels connected to the charging controller and PPV23 of the panels connected to the electrolyzers are presented in Figure 13 as a function of the irradiance.
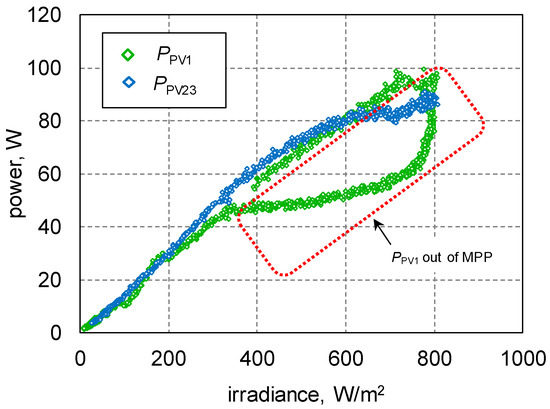
Figure 13.
Power of 1 m2 of PV panels in investigated setups as a function of irradiance.
The PPV1 characteristics in the MPPT device operating range were nearly linear, but when the battery was fully charged, the panel was loaded beyond its maximum power point, as observed by a significant decrease in the power received from panel PV1. The characteristics of PPV23 were non-linear, and a significantly lower power was achieved compared to PV1 at higher irradiance values. This was important because most of the energy from the photovoltaic panels was obtained for irradiance above 500 W/m2. In this range of irradiance the panel temperature usually increases and the operating point of the panel and the electrolyzer move away from the MPP, which is shown in Figure 10. The efficiency of PV23 was higher than PV1 (Table 1); therefore, the characteristics of PV23 from irradiance values of 200–500 W/m2 were higher than the characteristics of PV1. This is when the PV panels were loaded by electrolyzers near the maximum power point.
3.3. Concept and Advantages of PV–Battery–Hydrogen Generator Setup
When the hydrogen generator cooperates with a power source with a strongly variable amount of electricity produced that depends mainly on the current weather conditions, the generator operates at variable supply currents. Since the final product of this type of equipment is hydrogen, the best solution is when they operate at maximum output (at the nominal operating point), which also corresponds to the maximum efficiency [20,21,43]. Therefore, it is proposed to use an electricity buffer to store surplus energy generated in the PV system to ensure optimal operating conditions for the hydrogen generator. The use of an energy storage system assumes the use of a charging controller, batteries, and a voltage regulator as intermediary components to supply electrolyzers and hydrogen generator auxiliary devices (Figure 14). The batteries should ensure that the system operates in a daily cycle, i.e., its capacity should not exceed the daily amount of energy produced by the PV system, minus the amount of energy that the hydrogen generator can use during PV operation. Energy losses in charge controller, battery, and voltage regulator should also be considered in the total energy balance.
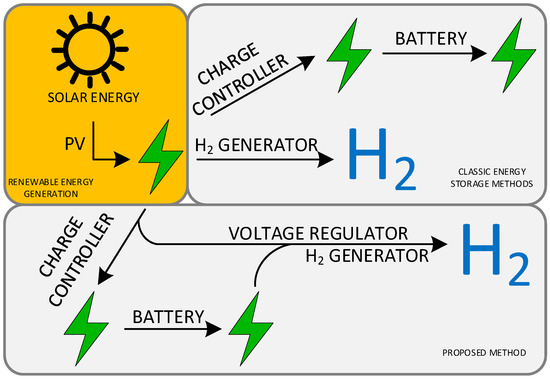
Figure 14.
The overall idea of the proposed energy storage system.
It is proposed to use a system where the power of the hydrogen generator corresponds to the average daily power of the solar panels (maximum daily energy gain from PV, divided by 24 h), which is possible to obtain annually. In the analyzed case, it was assumed that all energy from the PV installation must be used.
For the analyzed geographical location and positioning of 1 kWp panels, such as those described in Section 2.1, the maximum daily energy production is 6 kWh. At the same time, the instantaneous maximum power achieved by the installations only slightly exceeded 1 kW. The maximum power values were obtained in April and May, as determined based on measurements of a photovoltaic installation connected to a power grid (on-grid) through an MPPT inverter (Figure 15).
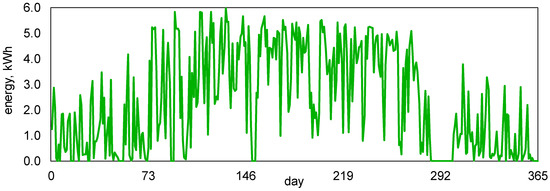
Figure 15.
Daily energy generation by 1 kWp PV system (location: 50°17′36″N 18°40′55″E; PV panels were positioned 50° to the horizontal and faced 30° southeast (SE)). Data from 2016.
In the proposed energy storage system the power of hydrogen generator—PHG depends on the maximum daily energy production by photovoltaic system. The calculations assume that the system operation time is 24 h, therefore power of hydrogen generator can be defined as:
where:
- EmaxPV—maximum daily energy production by photovoltaic system, Wh.
Daily energy production from the PV should permit the continuous operation of a hydrogen generator, which means that in the analyzed system a hydrogen generator with a power of only 250 W (Equation (6)) can use all the energy produced by the PV panels. It can be assumed that in this location, the fixed PV panels operated a maximum of 8 h per day with a power higher than that of the hydrogen generator (Figure 16). For days with maximum energy production from the PV, hydrogen generators would operate 24 h a day. This requires the use of batteries capable of powering the hydrogen generators for maximum 16 h, enabling the storage of 5.9 kWh of energy (Equation (7)), i.e., excess energy not used by the hydrogen generator during the day. It was assumed that depth of discharge is 80% and battery efficiency is 95%.
where:
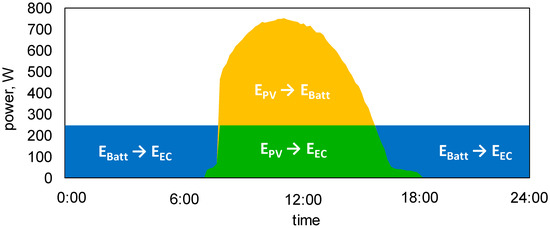
Figure 16.
The energy distribution during a daily cycle in the proposed energy storage system.
- DOD—depth of discharge, -,
- ηbatt—battery efficiency, -,
- EmaxHG—maximum daily energy consumption by hydrogen generator direct from PV, Wh.
The direct integration of electrolyzers and PV panels requires the use of hydrogen generators with a power similar to that of PV panels. Even if it was possible to slightly overload the electrolyzers, their power would be several times higher than the proposed system with an electricity buffer. It is planned that hydrogen generators will always work with constant power. If the energy in the batteries is insufficient to power the hydrogen generator, and the power of the photovoltaic panels is less than the power of the hydrogen generator, it will be switched off until the batteries are charged to the appropriate level. It is also assumed that the batteries should be discharged for as short as possible, and they should not be brought to a state in which the batteries are completely discharged for long periods. Based on the information about the energy stored in batteries, we can determine how many hours they can power the hydrogen generator and start it in advance before operating PV panels. This prevents the batteries from being deeply discharged, and also ensures the shortest discharge duration.
The amount of energy that could be obtained and stored in individual variants of the energy storage system was determined by analyzing measurement results from a selected day. For the proposed energy storage system (charge controller + battery + hydrogen generator), it was assumed that all electricity buffered in the batteries was converted to hydrogen in the electrolyzer. In this case, it was assumed that the system operated until the battery was fully discharged.
The amount of electricity from photovoltaic panels was calculated based on experimental results obtained in a clear day in October 2018, during the operation of the panels presented in Figure 6 and Figure 12. The energy received from photovoltaic panels or stored was calculated using Equation (8). Panels started to operate at 7:17 and stopped working at 17:31.
where:
- P—measured power, kW.
The first case considers the connection of the PV panel to the battery through the charging controller. Electricity from photovoltaic panels PV1 was calculated based on the measured power PPV1, and energy stored in batteries based on power calculated using Equation (9).
In the case of hydrogen generator connected directly to the PV panels, the electricity from photovoltaic panels was determined based on the characteristic presented in Figure 13. It was assumed that power PPV23 is polynomial function of irradiance. Energy of stored hydrogen was calculated from the amount of hydrogen produced during the day.
In the case of the proposed hybrid system, i.e., hydrogen generator connected to the PV panels through electricity buffer, photovoltaic panels should be loaded at the MPP during all day. The photovoltaic panels’ power PMPP depends on irradiance and panel temperature (Figure 7), and was calculated using Equation (10).
where:
- G0—solar irradiance, W/m2,
- APV—area of photovoltaic panel, m2,
- ηPV—photovoltaic panel efficiency, -,
- TPV—photovoltaic panel temperature, °C,
- γ—temperature coefficient of power, %PPV/°C.
In this case of the energy of stored hydrogen directly depends on daily energy production by photovoltaic system and maximum hydrogen generator efficiency because hydrogen generators always work with max power (Equation (11)).
The results in Table 3 indicate that more energy from the PV panels can be used to produce more hydrogen by integrating the charge controller and battery system with the hydrogen generator. Such results are possible when using a battery with a constant capacity and hydrogen generator with a four-times lower nominal power (than PV panels) and also four-times lower volumetric efficiency.
Table 3.
Energy received and stored in analyzed systems during one specific day referenced to a 1 kW photovoltaic installation.
4. Conclusions
The article presents a concept of photovoltaic—battery—hydrogen generator hybrid system dedicated for energy storage. This solution increases the flexibility of energy storage systems, while maintaining the highest operating efficiency related to the nominal parameters of the hydrogen generator. It was also assumed that PV panels should operate at their maximum power as long as possible, and the batteries should be used to maximize their lifetimes.
Experimental research was conducted to develop the operating characteristics of a hydrogen generator integrated with electrical energy storage and PV systems. According to the results presented in this paper, hydrogen generators achieved the highest efficiency (ηHG = 46.5%) for the nominal operating point, at the highest power output.
The direct connection of a hydrogen generator and PV system requires the use of a receiver with a similar nominal power as the primary energy source, but this would be an inefficient solution because PV systems operate at maximum power for only several dozen hours per year. This means that a hydrogen generator will operate below its nominal power almost all the time.
Experimental research also allowed to show the cooperation of PV panels separately with hydrogen generators and batteries. Measurements were made under the same solar radiation conditions and at the same time. It was found that the PV panels were not loaded at the maximum power point across the entire range of solar irradiance.
It was proposed to use the electricity buffer to store the surplus energy generated in the PV system to ensure the optimal operating conditions for the hydrogen generator. For the proposed system of 1 kWp of PV power, it is possible for a hydrogen generator with a power of 250 W to use all the energy produced by the solar system. On days with maximum energy production from the PV, hydrogen generators would operate 24 h a day at their nominal operating point. This requires the use of batteries capable of powering the hydrogen generators for maximum 16 h, enabling the storage of excess energy not used by the hydrogen generator during the day.
In order to optimize the proposed system, the authors anticipate further research which will include, among others, an analysis of the system assuming different battery capacity and photovoltaic plant energy production profiles over a longer period of time. The implementation of new technological solutions will improve the efficiency of technologies dedicated to energy storage.
Author Contributions
Conceptualization, D.W., M.J., W.U., and A.S.-O.; methodology, D.W. and M.J.; investigation, D.W. and M.J.; formal analysis, D.W. and M.J.; resources, M.J.; data curation, D.W. and M.J.; writing—original draft preparation, D.W. and M.J.; writing—review and editing, W.U.; visualization, D.W., W.U.; project administration, A.S.-O.; supervision, A.S.-O.; funding acquisition, A.S.-O. and W.U. All authors have read and agreed to the published version of the manuscript.
Funding
The publication was funded within Silesian University of Technology grant no. 08/050/BKM20/0218. Authors also gratefully acknowledge the support of the Polish National Science Centre within the framework of the research project entitled “Utilization of electrolysis and oxygen gasification processes for the production of synthetic natural gas in a polygeneration system”, no. 2017/27/B/ST8/02270.
Conflicts of Interest
The authors declare no conflict of interest.
References
- Miller, G. Beyond 100% renewable: Policy and practical pathways to 24/7 renewable energy procurement. Electr. J. 2020, 33, 106695. [Google Scholar] [CrossRef]
- Shahnazi, R.; Shabani, Z.D. Do renewable energy production spillovers matter in EU? Renew. Energy 2020, 150, 786–796. [Google Scholar] [CrossRef]
- Lorién, G.; Casero, P.; Bourasseau, C.; Chabert, A. Use of hydrogen in off-grid locations, a techno-economic assessment. Energies 2018, 11, 3141. [Google Scholar] [CrossRef]
- Castellani, B.; Morini, E.; Nestasi, B.; Nicolini, A.; Rossi, F. Small-scale compressed air energy storage application for renewable energy integration in a listed building. Energies 2018, 11, 1921. [Google Scholar] [CrossRef]
- Koceman, A.S.; Modi, V. Value of pumped hydro storage in a hybrid energy generation allocation system. Appl. Energy 2017, 205, 1202–1215. [Google Scholar] [CrossRef]
- Luo, X.; Wang, J.; Dooner, M.; Clarke, J. Overview of current development in electrical energy storage technologies and the application potential in power system operation. Appl. Energy 2015, 137, 511–536. [Google Scholar] [CrossRef]
- Stenzel, P.; Linssen, J. Concept and potential of pumped hydro storage in federal waterways. Appl. Energy 2016, 162, 486–493. [Google Scholar] [CrossRef]
- Gahleitner, G. Hydrogen from renewable electricity: An international review of power-to-gas pilot plants for stationary applications. Int. J. Hydrogen Energy 2013, 38, 2039–2061. [Google Scholar] [CrossRef]
- Uchman, W.; Skorek-Osikowska, A.; Jurczyk, M.; Węcel, D. The analysis of dynamic operation of power-to-SNG system with hydrogen generator powered with renewable energy, hydrogen storage and methanation unit. Energy 2020, 213, 118802. [Google Scholar] [CrossRef]
- Guandalini, G.; Robinius, M.; Grube, T.; Campanari, S.; Stolten, D. Long-term power-to-gas potential from wind and solar power: A country analysis for Italy. Int. J. Hydrogen Energy 2017, 42, 13389–13406. [Google Scholar] [CrossRef]
- Cotfas, D.T.; Deaconu, A.M.; Cotfas, P.A. Application of successive discretization algorithm for determining photovoltaic cells parameters. Energy Convers. Manag. 2019, 196, 545–556. [Google Scholar] [CrossRef]
- Hernandez-Callejo, L.; Gallardo-Saavedra, S.; Alonso-Gomez, V. A review of photovoltaic system: Design, operation and maintenance. Sol. Energy 2019, 426–440. [Google Scholar] [CrossRef]
- Bartela, Ł.; Katla, D.; Skorek-Osikowska, A. Evaluation of conceptual electrolysis-based energy storage systems using gas expanders. Int. J. Hydrogen Energy 2020, in press. [Google Scholar] [CrossRef]
- Agrali, C.; Gultekin, H.; Tekin, S.; Oner, N. Measuring the value of energy storage systems in power network. Int. J. Electr. Power 2020, 120, 106022. [Google Scholar] [CrossRef]
- Mahmoud, M.; Ramadan, M.; Olabi, A.-G.; Pullen, K.; Naher, S. A review of mechanical energy storage systems combined with wind and solar applications. Energy Convers. Manag. 2020, 210, 112670. [Google Scholar] [CrossRef]
- Bartela, Ł. A hybrid energy storage system using compressed air and hydrogen as the energy carrier. Energy 2020, 196, 117088. [Google Scholar] [CrossRef]
- Balan, O.M.; Buga, M.-R.; Brunot, A.; Badea, A.; Froelisch, D. Technical and economic evaluation of power-to-gas in link with a 50 MW wind park. J. Energy Storage 2016, 8, 111–118. [Google Scholar] [CrossRef]
- Dispenza, G.; Sergi, F.; Napoli, G.; Antonucci, V.; Andalaro, L. Evaluation of hydrogen production cost in different real case studies. J. Energy Storage 2019, 24. [Google Scholar] [CrossRef]
- Kotowicz, J.; Jurczyk, M. Economic analysis of an installation producing hydrogen through water electrolysis. J. Power Technol. 2019, 99, 170–175. [Google Scholar]
- Kotowicz, J.; Węcel, D.; Jurczyk, M. Analysis of component operation in power to gas to power operation. Appl. Energy 2018, 216, 45–59. [Google Scholar] [CrossRef]
- Kotowicz, J.; Jurczyk, M.; Węcel, D.; Ogulewicz, W. Analysis of hydrogen production in alkaline electrolyzers. J. Power Technol. 2016, 96, 149–156. [Google Scholar]
- Kupecki, J.; Motylinski, K.; Jagielski, S.; Wierzbicki, M.; Brouwer, J.; Naumovich, Y.; Skrzypkiewicz, M. Energy analysis of a 10 kW-class power-to-gas system based on a solid oxide electrolyzer (SOE). Energy Convers. Manag. 2019, 199, 111934. [Google Scholar] [CrossRef]
- Prabhakarm, P.; Giannopoulos, D.; Koppel, W.; Mukherjee, U.; Remesh, G.; Graf, F.; Trimis, D.; Kolb, T.; Founti, M. Cost optimization and life cycle analysis of SOEC based power to gas systems used for seasonal energy storage in decentral systems. J. Energy Storage 2019, 26, 100987. [Google Scholar] [CrossRef]
- Ancona, M.A.; Bianchi, M.; Branchini, L.; Catena, F.; De Pascale, A.; Melino, F.; Peretto, A. Numerical prediction of off-design performance for a power-to-gas system coupled with renewable. Energy Convers. Manag. 2020, 210, 112702. [Google Scholar] [CrossRef]
- Liang, J.; Tang, W. Stochastic multistage co-planning of integrated energy systems considering power-to-gas and cap-and-trade market. Int. J. Electr. Power 2020, 119, 105817. [Google Scholar] [CrossRef]
- Lynch, M.; Devine, M.T.; Bertsch, V. The role of power-to-gas in the future energy system: Market and portfolio effects. Energy 2019, 185, 1197–1209. [Google Scholar] [CrossRef]
- Hassani, H.; Zaouche, F.; Rekiouna, D.; Belaid, S.; Rekioua, T.; Bacha, S. Feasibility of standalone photovoltaic/battery system with hydrogen production. J. Energy Storage 2020, 31, 101644. [Google Scholar] [CrossRef]
- Lokar, J.; Virtic, P. The potential for integration of hydrogen for complete energy self-sufficiency in residential buildings with photovoltaic and battery storage systems. Int. J. Hydrogen Energy 2020, in press. [Google Scholar] [CrossRef]
- Dalilah Nordin, N.; Abdul Rahman, H. Comparison of optimum design, sizing and economic analysis of standalone photovoltaic/battery without and with hydrogen production systems. Renew. Energy 2019, 141, 107–123. [Google Scholar] [CrossRef]
- Lin, R.; Ye, Z.; Wu, B. The application of hydrogen and photovoltaic for reactive power optimization. Int. J. Hydrogen Energy 2020, 45, 10280–10291. [Google Scholar] [CrossRef]
- Gutiérrez-Martín, F.; Amodio, L.; Paga, M. Hydrogen production by water electrolysis and off-grid solar PV. Int. J. Hydrogen Energy 2020. [Google Scholar] [CrossRef]
- Sophian, K.; Zamri, I.M.; Wan Daud, W.R.; Othman, M.Y.; Yatim Baharuddin, Y.; Amin, N. Performance of PV-wind hybrid system for hydrogen production. Renew. Energy 2009, 34, 1973–1978. [Google Scholar] [CrossRef]
- Bernal-Agustin, J.L.; Dufo-Lopez, R. Techno-economical optimization of the production of hydrogen form PV-Wind systems connected to the electrical grid. Renew. Energy 2010, 35, 747–758. [Google Scholar] [CrossRef]
- Sinha, S.; Chandel, S.S. Review of recent trends in optimization techniques for solar photovoltaic-wind based hybrid systems. Renew. Sust. Energy Rev. 2015, 50, 755–769. [Google Scholar] [CrossRef]
- Akyuz, E.; Coskun, C.; Oktay, Z.; Dincer, I. Hydrogen production probability distributions for PV-electrolyser system. Int. J. Hydrogen Energy 2011, 36, 11292–11299. [Google Scholar] [CrossRef]
- Muhammad-Bashir, S.; Al-Oufi, M.; Hakami, M.; Nadeem, M.A.; Mudiyanselage, H.; Idriss, H. Comparison between the performance of high concentrated and non-concentrated PV-cells for hydrogen production PEM water electrolyzers. Sol. Energy 2020, 205, 461–464. [Google Scholar] [CrossRef]
- Stansberry, J.M.; Brouwer, J. Experimental dynamic dispatch of a 60 kW proton exchange membrane electrolyzer in power-to-gas application. Int. J. Hydrogen Energy 2020, 45, 9305–9316. [Google Scholar] [CrossRef]
- Garcia-Valverde, R.; Espinosa, N.; Urbina, A. Simple PEM water electrolyser mode and experimental validation. Int. J. Hydrogen Energy 2012, 37, 1927–1938. [Google Scholar] [CrossRef]
- Hernandez-Gomez, A.; Ramirez, V.; Guilbert, D. Investigation of PEM electrolyzer modeling: Electrical domain, efficiency, and specific energy consumption. Int. J. Hydrogen Energy 2020, 45, 14625–14639. [Google Scholar] [CrossRef]
- Carmo, M.; Fritz, L.D.; Mergel, J.; Stolten, D. A comprehensive review on PEM water electrolysis. Int. J. Hydrogen Energy 2013, 38, 4902–4934. [Google Scholar] [CrossRef]
- Millet, P.; Ngameni, R.; Grigoriev, S.A.; Mbemba, N.; Brisset, F.; Ranjbari, A.; Etievant, C. PEM water electrolyzers: From electrocatalysis to stack development. Int. J. Hydrogen Energy 2010, 35, 5043–5052. [Google Scholar] [CrossRef]
- Ursua, A.; Gandia, L.M.; Sanchis, P. Hydrogen production from water electrolysis: Current status and future trends. Proc. IEEE 2012, 100, 410–426. [Google Scholar] [CrossRef]
- Kotowicz, J.; Bartela, Ł.; Węcel, D.; Dubiel, K. Hydrogen generator characteristic for storage of renewably-generated energy. Energy 2017, 118, 156–171. [Google Scholar] [CrossRef]
- Millet, P.; Grigoriev, S. Water electrolysis technologies. In Renewable Hydrogen Technologies. Production, Purification, Storage, Applications and Safety; Elsevier: Amsterdam, The Netherlands, 2013; Chapter 2; pp. 19–41. [Google Scholar] [CrossRef]


Publisher’s Note: MDPI stays neutral with regard to jurisdictional claims in published maps and institutional affiliations. |
© 2020 by the authors. Licensee MDPI, Basel, Switzerland. This article is an open access article distributed under the terms and conditions of the Creative Commons Attribution (CC BY) license (http://creativecommons.org/licenses/by/4.0/).