Abstract
Bioethanol synthesis techniques have been studied intensively due to the energy crisis and various environmental concerns. A two-step bioethanol production process was carried out multiple times in an unbaffled agitator tank. The parameters varied, including the fermentation temperature, the pH level, the amount of yeast, and the impeller type. Then, a simulation was used to obtain an image of the agitation behavior inside the agitator tank to compare the velocity profile of each type of impeller design. The impeller with eight blades was found to produce the highest flow velocity: 0.28 m/s. The highest concentration of bioethanol generated from the fermentation was 34 g/L, which was produced by using an eight-blade impeller at 30 °C, a pH level of 5, an agitation speed of 70 rpm, and 2 wt % yeast. The two-blade impeller produced the lowest bioethanol concentration, 18 g/L, under the same conditions. Ethanol concentration was found to peak at 40 °C and a pH level of 5. The geometry of the impeller, the fermentation temperature, and the pH level were each found to have a significant effect on the resulting bioethanol concentration according to the results of an ANOVA test. The amount of yeast had no effect on the fermentation reaction. Finally, the results demonstrated the possibility of using computational fluid dynamic modeling to determine the impeller’s behavior for the development of the bioethanol fermentation process. The simulation and experimental results from this research support the scaling up of a bioethanol production facility.
1. Introduction
The efficient production method for bio-fuel, such as bioethanol and biodiesel, from sustainable resources is now mandatory for humanity today and in the near future [1]. A shortage of petroleum reserves, increasing oil prices, and the degradation of the environment have driven countries around the world to seek scientific knowledge of how to produce more and better-quality biofuels [2]. In Thailand, the Ministry of Energy recognized the potential for bioethanol production from various biomass, such as sugar cane and agricultural wastes. Many financial subsidies from the government and Kyoto protocols have been issued as an incentive to establish a production base in Thailand that is capable of generating at least 11.9 million liters of bioethanol daily by the year 2036 according to the Alternative Energy Development Plan [3]. Bioethanol is produced by fermentation of reduced sugar (glucose, xylose, and fructose) in aqueous solution inhabited by saccharomyces cerevisiae yeast, which is also the kind of yeast that is used to make bread. However, in the case of agricultural waste or biomass fermentation it is important for the carbohydrate in these materials to first be broken down to fermentable sugar through a hydrolysis process in acidic solution.
In addition to biological activity, another important parameter for the fermentation process is the mechanical motion of the agitator. Mixing intensity in typical operating conditions depends on the formation of a vortex as it interacts with the liquid solution. A graphic representation of these interactions in the form of a vector is known as vorticity. Vortex depth is an important factor for a reaction that is affected by the air-to-liquid interface. This is especially relevant in the case of ethanol fermentation, which was found to improve significantly with the amount of oxygen in the reactor [4]. Additionally, in order to achieve a deep vortex, the water height-to-agitator tank diameter (h:d) should be greater than 1. Bimlesh Kumar et al. [5] demonstrated that the critical speed for the impeller’s rotation is just enough for the vortex to reach the impeller. For small and medium-sized tanks, the critical speed is 60 rpm and 72 rpm, respectively. Under these conditions, and with a Reynolds number higher than 20,000, the turbulence flow system is usually adopted when simulating agitator and vortex behavior [6,7]. Basudeb Munshi et al. [8] reported the simulation of a mixing tank using the Reynolds Averaged Navier–Stokes (RANS) equations with k-ε turbulence to predict the surface pressure of flow inside the mixing tank. Since their main concern is to observe the gas-to-liquid interaction, they proposed the volume of fluid (VOF) approach, which resulted in accurate simulation data. Recent studies have characterized molasses slurry as a non-Newtonian fluid that demonstrates shear thinning behavior during simulation based on computational fluid dynamics using a combined Eulerian–LES (Large Eddy Simulation) model [9].
One of the main obstacles in the fermentation of biomass is the viscosity of the biomass slurry. Energy intensive and time-consuming technologies have been adapted to help prepare feedstock in order to enhance fermentation. Consequently, bioreactors have to be designed to achieve efficient mass transfer, low shear stress force, and inexpensive material cost. For this reason, a continuous-mode reactor with a bubble generator as its agitation method has been designed and referred to as a gas-lift bioreactor [9]. Plasma-assisted detoxification has been applied to treat sugarcane biomass [10]. Bae et al. [11] suggested a bamboo treatment with a hydrogen peroxide–acetic acid solution. A more convenient approach would be to improve bioethanol by understanding the contribution of agitation inside the bioreactor. Agitation speed and impeller geometry are important parameters that influence flow patterns, which prevent dead-zone areas (no-flow areas) in the case of a high viscosity liquid medium. The Reynolds number of a given flow was greatly affected by the impeller geometry. Marine blade and pitched paddle impellers were observed to provide flows with the highest Reynolds numbers (6000 and 8000) compared with both the Rushton turbine and Pitch Blade turbine [12]. In this experiment, the marine blade impeller offered superior biological activity even though its Reynolds number is smaller than that of the pitched paddle impeller. This is because the marine blade impeller implemented both radial and axial flow behavior. Ruihong Zhang et al. [13] reported a successful utilization of a hybrid helical ribbon and screw impeller for an aerobic compost bioreactor [13]. Currently, a new type of impeller with a curved blade (Scaba 6SRGT) was reported to significantly increase the well-mixed region but also increase power consumption [14]. Apart from measuring the improvement in biological activity due to the type of impeller, this research also monitors and takes into consideration the power consumption.
This research aimed to simulate the agitation profiles of impellers with different geometries, including pitched two-blade, pitched four-blade, Rushton four-blade, and modified propellers. An unbaffled agitator tank (constructed in the laboratory) was used to carry out the fermentation of treated Napier grass to bioethanol. An unbaffled tank was chosen because it was found to consume less power compared with a baffle tank [15]. Simulation of each type of impeller was controlled and executed by Simflow 3.1 software (SIMFLOW Technologies, Warsaw, Poland). The size of fresh Napier grass was mechanically reduced and treated using a solution of low-concentration sulfuric acid to liberate reduced sugar. The resulting slurry containing reduced sugar was then transferred and fermented in a separate reactor. Operating conditions such as temperature (30 °C, 40 °C, and 50 °C), amount of yeast (2.0 wt %, 3.5 wt %, and 5.0 wt %), and pH level (4, 5, and 6), were adjusted. This research also investigated the effect of additional acetic acid during the fermentation process. Finally, a statistical analysis of the data was obtained from the experiments to confirm the significance of the impeller’s geometry and the operating conditions at a confidence level of 95%.
2. Experiment
The Napier grass was obtained from a plantation in Chaing Rai, Thailand. The biomass was stored in a low-temperature refrigerator (4 °C) to preserve the integrity of the biological structure. Prior to being used, the long Napier grass leaves were mechanically transformed to smaller pieces with sizes of 30–50 mm, as shown in Figure 1. A 15 wt % concentrated sulfuric acid was prepared and mixed with the biomass in a batch reactor at an agitation rate of less than 70 rpm for 5 h. The liquid slurry was then removed and passed through a vacuum filtration system in order to remove the liquid from the biomass, and it was washed with deionized water three times. The treated biomass was then transferred to another batch reactor for fermentation. Fermentation was carried out at different temperatures, amounts of yeast, and pH levels for 10 h. Each experimental trial was repeated three times to certify reproducibility. Calcium hydroxide was added in order to adjust the pH level of the fermentation solution. Acetic acid was added after fermentation to stop the bioethanol process. The concentration of bioethanol was sampled and analyzed every hour using a high-performance liquid chromatography system (Series 1100; Hewlett-Packard, Palo Alto, CA, USA) containing a model 168 UV detector. The injection temperature was set at 70 °C, the injection volume was 10 µL, and the mobile phase’s flow rate was 0.9 mL/min sulfuric acid. The agitation reactor’s dimensions are illustrated in Figure 2. Each operating condition was tested using a different type of impeller. The dimensions of each type of impeller used in this experiment are shown in Figure 3.
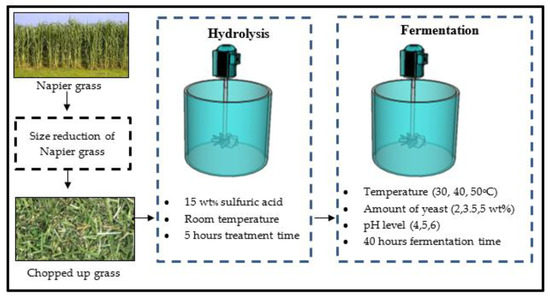
Figure 1.
Bioethanol production process using Napier grass.
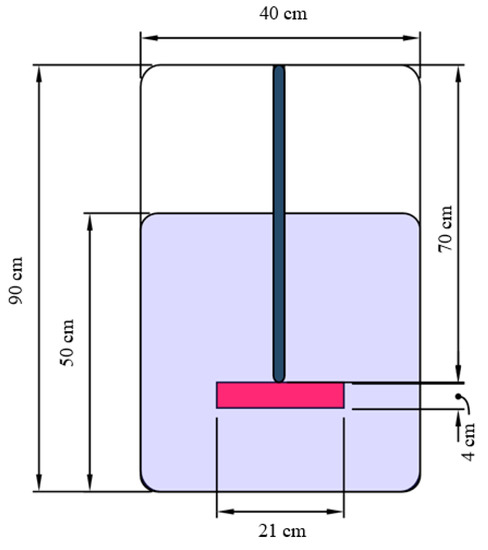
Figure 2.
Dimensions of the agitation tank with an h:d ratio greater than 1 in order to optimize the vortex depth.
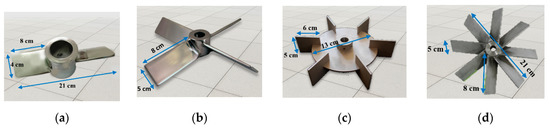
Figure 3.
Geometry of the four types of impeller including (a) a two-pitched blade turbine, (b) a four-pitched blade turbine, (c) a Rushton turbine, and (d) an eight-pitched blade turbine.
3. Simulation Procedure
3.1. Governing Equation for the Simulation
Vorticity is a quantity representing the local rotational motion of the fluid under investigation or simply expressed as the curl of the velocity profile as shown in Equation (1). This value indicates the tendency of a specific microscopic point in the fluid to form a vortex. If the value of vorticity is not equal to 0, then the fluid is referred to as rotational. However, if the value of vorticity is equal to 0, then the fluid is considered as irrotational.
where = vorticity and = velocity flow vector.
The velocity vector in both the x and y-direction can be derived from the Navier–Stokes equation as shown in Equation (2). According to the equation of motion, the two-dimensional unsteady form of the equation illustrated the relationship between dynamic parameters such as velocity, pressure, temperature, and density. However, for the derivation of vorticity, the pressure value at a specific location inside the dynamic flow system can be calculated using Equation (2).
where x, y, and z are the directions inside the Cartesian coordinate system; , , and are the vectors corresponding to each direction; and the f value is related to density of the flowing liquid.
The equation for conservation of momentum was employed to calculate the pressure of the water–air interface during agitation. Assuming transient behavior and non-slip conditions, the pressure profile in the radial direction of a cylinder shape can be developed as shown in Equation (3).
The continuity equation or the Navier–Stokes equation was employed to calculate the pressure along the height of the simulated cylinder, as shown in Equation (4).
where = pressure at a specific location inside flowing liquid, = hydrostatic pressure, h = height of liquid flow, = gravity, = density, and = velocity profile.
3.2. Simulating Conditions
Simulation of the agitating behavior inside a cylindrical batch reactor was performed using SimFlow software, which was developed to simplify OpenFOAM software (OpenFOAM v8, The OpenFOAM Foundation Ltd., London, England). Three-dimensional geometries of the impellers were drawn using AutoCAD software (AutoCAD 2017, Autodesk Inc., Bangkok, Thailand) and imported to SimFlow. Meshing of the agitating system was conducted using a radial division of 15, radial grading of 1.02, and circumferential division of 15. Agitation was assumed to create a turbulence flow inside the cylindrical tank. For this reason, a RANS (Reynolds-averaged Navier–Stokes) turbulence equation with the realizable k-ε for a transient system was used. The agitation speed for the simulation was fixed at 6.28 rad/s (60 rpm). The two isosurfaces created 1 min after agitation at the water–air interface and bottom of the cylindrical reactors were rendered using ParaView software (Microsoft, Redmond, WA, USA).
4. Results and Discussions
4.1. Simulated Agitation Pattern
The simulated agitation system inside an unbaffled reactor was rendered, as shown in Figure 4. The isosurface layers of the bottom and water–air interface were also illustrated. It was observed that the bottom isosurface of a two-blade impeller indicated a low-velocity flow profile with very little change in velocity. In contrast, the isosurface of an eight-blade impeller indicated a high-velocity flow profile. The flow gradient changed dramatically from a low-velocity flow profile to a high-velocity flow profile and then back to a lower-velocity flow profile. Figure 5 demonstrates the simulated combined velocity at specific location from the center of the impeller. The impeller’s center corresponds to the origin of the graph (0, 0) while the other end (0, 18) represents the wall of the reactor tank according to the boundary conditions. The maximum flow velocity from the four types of impellers was achieved very close to the impeller’s tip. The highest simulated flow velocity from the two-blade, four-blade, Rushton, and eight-blade turbines were 0.132, 0.208, 0.154, and 0.281 m/s, respectively. It is clear that the two-blade and Rushton turbines both produce flows with lower velocity compared with the four-blade and eight-blade turbines. The velocity profile of the Rushton blade was significantly higher than that of the two-blade turbine. These data correspond well with another experiment conducted for non-Newtonian fluids [16]. It was also observed that the eight-blade turbine was the only type of impeller where the velocity of the fluid increased beyond the impeller’s tip. This is due to the momentum created by the collision of vortex rings generated by the shear force of the pitched blade [17,18].
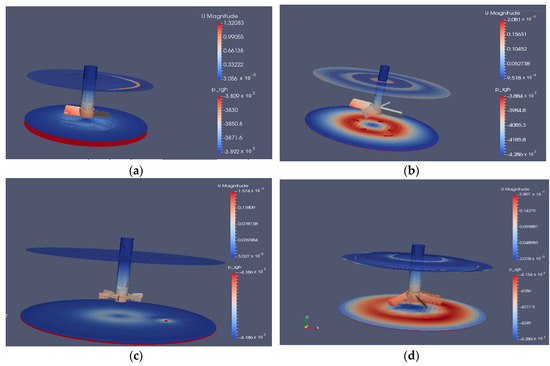
Figure 4.
Isosurface comparing water interfaces for four different impellers including (a) a three-blade turbine, (b) a four-blade turbine, (c) a Rushton turbine, and (d) an eight-blade turbine.
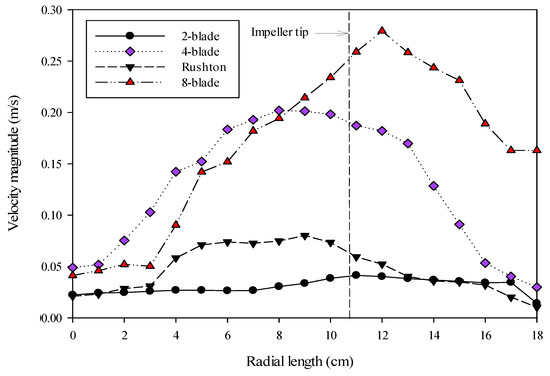
Figure 5.
Simulated velocity profile of four different impellers, including a two-blade, a four-blade, a Rushton, and an eight-blade turbine.
4.2. Effect of Operating Conditions on Bioethanol Fermentation
A two-step bioethanol production strategy was adopted for this experiment, including the primary hydrolysis reaction under acidic conditions to liberate reduced sugar inside of the biomass’s structure. A fermentation reaction was promoted by the addition of acetic acid inside the solution in order to help digest the lignin present in most biomass materials [19]. Figure 6 demonstrates the effect of the type of impeller on the ethanol concentration of the fermented biofuel. After 40 h of fermentation, the eight-blade impeller was found to give the highest ethanol concentration of almost 34 g/L, followed by the four-blade impeller (30 g/L), the Rushton blade (20 g/L), and then the two-blade impeller (18 g/L). This is because of the increase in radial and axial mixing intensity as the number of pitched blades increases [20]. The ethanol concentration of the biofuel obtained in this experiment was slightly smaller than that of the fermentation of waste coke [21] and corn stover [22]. However, when an appropriate type of impeller was used, the ethanol concentration obtained from Napier grass for this experiment was higher than the concentration obtained from the fermentation of switchgrass [23]. This is because an ionic liquid was employed to break down the carbohydrate content inside the switchgrass instead of sulfuric acid, which was used in this experiment. Even though ionic liquids are currently less effective in releasing sugar from biomass compared with the chemical pretreatment method, they are environmentally friendly and can endure severe reaction conditions.
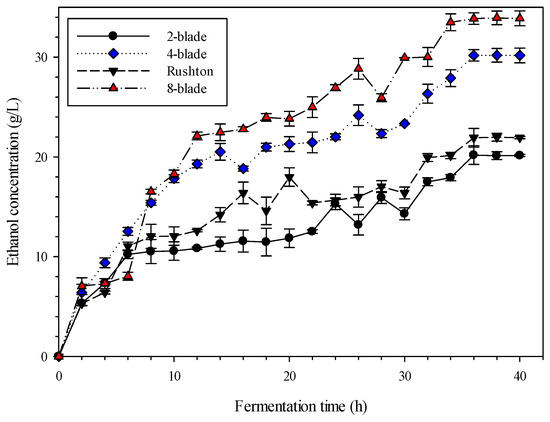
Figure 6.
Effect of impeller type on fermentation of treated Napier grass at 30 °C, a pH level of 5, an agitation speed of 70 rpm, and 2 wt % yeast.
Figure 7 demonstrates the effect of temperature on bioethanol fermentation. An increase in temperature from 30 °C to 40 °C resulted in an increase in ethanol concentration from 28.9 g/L to 34.3 g/L according to the samples collected after 40 h of fermentation. This is because an increase in temperature helps to promote lignin dissolution in the fermented solution. With lower lignin content, yeast habitants can easily penetrate to sugar molecules that are intertwined among larger macroscopic molecules, such as cellulose and hemicellulose. An increase in temperature also increases the kinetic energy, causing the fermentation rate to increase. However, when the system was exposed to higher temperatures, the ethanol concentration decreased gradually starting at 20 h after the beginning of fermentation. This result corresponds well with other research papers [24,25]. Techaparin et al. reported five thermotolerant yeasts that are capable of producing biofuel consisting of 48.51 g/L ethanol at a fermentation temperature of 40 °C [26].
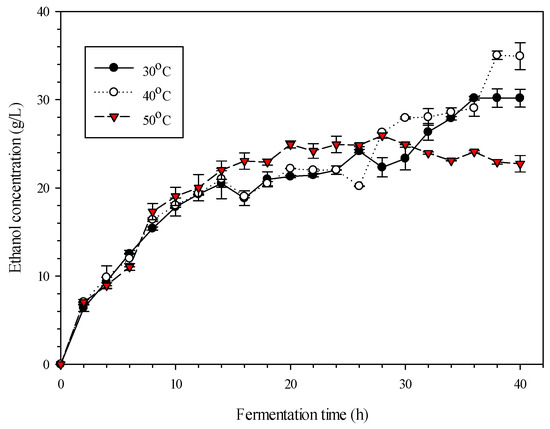
Figure 7.
Effect of temperature on fermentation of treated Napier grass using an eight-blade turbine impeller at a pH level of 5, an agitation speed of 70 rpm, and 2 wt % yeast.
In addition to the impeller type and fermentation temperature, the pH level was also varied to investigate its effect on bioethanol production from Napier grass. The pH level during fermentation is an important parameter because the pH level indicates the availability of protons in the system, which plays an important role in microbial activities [27]. An increase in the pH level from 4 to 5 resulted in a significant increase in bioethanol generation, as shown in Figure 8. When the pH level was increased further to 6, fermentation activity declined dramatically, producing biofuel with an ethanol concentration of only 18.9 g/L. These data align well with many other studies [28]. The amount of yeast added during fermentation does not affect the outcome of the fermentation process, as shown in Figure 9. However, an increase in yeast may affect power consumption because yeast increases the viscosity of the fermentation solution [29,30]. Additionally, yeast can created local dead spot inside the reactor with minimum heat transfer [31]. According to the results obtained from this experiment, it can be concluded that Napier grass can be used as second-generation feedstock for bioethanol production [32,33]. Comparisons with other studies on two-step ethanol production are shown in Table 1. According to Table 1, the bioethanol concentration of the fermentation product from Napier grass was found to be significantly higher than that of switchgrass.
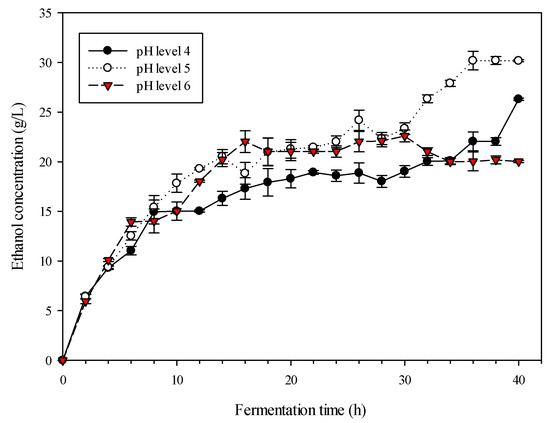
Figure 8.
Effect of pH level on the fermentation of treated Napier grass, using a four-blade turbine impeller at 30 °C, an agitation speed of 70 rpm, and 2 wt % yeast.
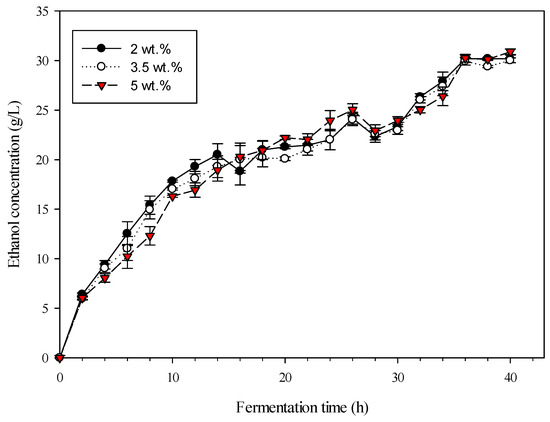
Figure 9.
Effect of yeast amount on the fermentation of treated Napier grass using a four-blade turbine impeller at 30 °C and an agitation speed of 70 rpm.

Table 1.
Comparison between Biomass Treatment and Bioethanol Production Technique.
A one-way analysis of variance (ANOVA) was conducted using Minitab 14.0 software (Minitab, Bangkok, Thailand) and data collected from the four types of impellers to statistically determine the significance of impeller geometry on bioethanol concentration. As illustrated in Table 2, the p-value is 0.0001, which is smaller than 0.05. Therefore, it was found that the type of impeller has a significant effect on the fermentation reaction. Additionally, the operating conditions were compared statistically using an ANOVA analysis of the regression model obtained by the Box–Behnken experimental design method. The temperature and pH level during fermentation were found to be statistically significant parameters. However, the amount of yeast added during fermentation was insignificant, as shown in Table 3.
Table 2.
Statistical results from ANOVA for different types of impeller based on bioethanol concentration.
Table 3.
Statistical results from ANOVA for different operating conditions based on bioethanol concentration.
5. Conclusions
The simulation of flow patterns produced from different types of impellers was performed in order to evaluate the microscopic velocity at a specific location in the radial direction of an agitation tank. Simulated results revealed the eight-blade impeller to provide the highest velocity (0.28 m/s) and the two-blade impeller to produce the lowest flow velocity (0.13 m/s). The flow velocity in the agitated area has a significant effect on the ethanol concentration of the produced biofuel. The two-step bioethanol production experiment revealed the effect of impeller type, fermentation temperature, pH level, and the amount of yeast on the ethanol concentration of the obtained biofuel. An ANOVA analysis revealed that the type of impeller, fermentation temperature, and pH level each have a significant effect on the bioethanol concentration in the product.
Author Contributions
Conceptualization and methodology, S.E.; project administration, S.E.; software and validation, S.E., H.C.O. and X.C.; data curation, S.E.; formal analysis, S.E. and X.C.; investigation, S.E. and H.C.O.; resources, S.E. and H.C.O.; writing—original draft preparation, S.E.; writing—review and editing, H.C.O. and X.C. All authors have read and agreed to the published version of the manuscript.
Funding
This research received no external funding.
Acknowledgments
This research was supported by the Faculty of Engineering, Thammasat University.
Conflicts of Interest
The authors declare no conflict of interest.
References
- Milano, J.; Ong, H.C.; Masjuki, H.; Silitonga, A.; Chen, W.-H.; Kusumo, F.; Dharma, S.; Sebayang, A. Optimization of biodiesel production by microwave irradiation-assisted transesterification for waste cooking oil-Calophyllum inophyllum oil via response surface methodology. Energy Convers. Manag. 2018, 158, 400–415. [Google Scholar] [CrossRef]
- Chia, S.R.; Ong, H.C.; Chew, K.W.; Show, P.-L.; Phang, S.-M.; Ling, T.C.; Nagarajan, D.; Lee, D.S.; Chang, J.-S. Sustainable approaches for algae utilisation in bioenergy production. Renew. Energy 2018, 129, 838–852. [Google Scholar] [CrossRef]
- Mo Energy. Alternative Energy Development Plan: AEDP2015; Mo Energy: Purkersdorf, Austrian, 2015; pp. 1–21.
- Morales, P.; Rojas, V.; Quirós, M.; Gonzalez, R. The impact of oxygen on the final alcohol content of wine fermented by a mixed starter culture. Appl. Microbiol. Biotechnol. 2015, 99, 3993–4003. [Google Scholar] [CrossRef] [PubMed]
- Rao, A.R.; Kumar, B.; Patel, A.K. Vortex behaviour of an unbaffled surface aerator. Sci. Asia 2009, 35, 183–188. [Google Scholar]
- Dickey, D.S. Tackling Difficult Mixing Problems; American Institute of Chemical Engineer: New York, NY, USA, 2015; Available online: https://www.aiche.org/resources/publications/cep/2015/august/tackling-difficult-mixing-problems (accessed on 1 October 2019).
- Cartland-Glover, G.; Fitzpatrick, J.J. Modelling vortex formation in an unbaffled stirred tank reactors. Chem. Eng. J. 2007, 127, 11–22. [Google Scholar] [CrossRef]
- Rajavathsavai, D.; Khapre, A.; Munshi, B. Numerical Study of Vortex Formation inside a Stirred Tank; World Academy of Science, Engineering and Technology: New Delhi, India, 2014; Volume 8, pp. 1437–1442. [Google Scholar]
- Madhania, S.; Muharam, Y.; Winardi, S.; Purwanto, W.W. Mechanism of molasses–water mixing behavior in bioethanol fermenter. Experiments and CFD modeling. Energy Rep. 2019, 5, 454–461. [Google Scholar] [CrossRef]
- Lin, S.-P.; Kuo, T.-C.; Wang, H.-T.; Ting, Y.; Hsieh, C.-W.; Chen, Y.-K.; Hsu, H.-Y.; Cheng, K.-C. Enhanced bioethanol production using atmospheric cold plasma-assisted detoxification of sugarcane bagasse hydrolysate. Bioresour. Technol. 2020, 313, 123704. [Google Scholar] [CrossRef]
- Song, Y.; Lee, Y.G.; Cho, E.J.; Bae, H.-J. Production of xylose, xylulose, xylitol, and bioethanol from waste bamboo using hydrogen peroxicde-acetic acid pretreatment. Fuel 2020, 278, 118247. [Google Scholar] [CrossRef]
- Abang Zaidel, D.N. Effect of Impeller Design on the Rate of Reaction of Hydrolysis in Batch Reactor. Chem. Eng. Trans. 2017, 56, 1423. [Google Scholar]
- Yang, Z.; Miao, H.; Ge, X.; Chen, X.; Zhang, R. Design and Performance of Helical Ribbon and Screw Impeller Aerobic Compost Bioreactor. Int. J. Environ. Sci. Dev. 2018, 9, 385–389. [Google Scholar]
- Ameur, H. Some modifications in the Scaba 6SRGT impeller to enhance the mixing characteristics of Hershel–Bulkley fluids. Food Bioprod. Process. 2019, 117, 302–309. [Google Scholar] [CrossRef]
- Rao, A.R.; Kumar, B. The use of circular surface aerators in wastewater treatment tanks. J. Chem. Technol. Biotechnol. 2006, 82, 101–107. [Google Scholar] [CrossRef]
- Khapre, A.; Munshi, B. Numerical Comparison of Rushton Turbine and CD-6 Impeller in Non-Newtonian Fluid Stirred Tank. Int. J. Chem. Mol. Nuclear Mater. Metall. Eng. 2014, 8, 1231–1232. [Google Scholar]
- Lu, W.-M.; Yang, B.-S. Effect of blade pitch on the structure of the trailing vortex around rushton turbine impellers. Can. J. Chem. Eng. 1998, 76, 556–562. [Google Scholar] [CrossRef]
- Grenville, R.; Giacomelli, J.; Brown, D.; Padron, G. Mixing: Impeller performance in stirred tanks. Chem. Eng. 2017, 124, 42. [Google Scholar]
- Zhao, X.; Wen, J.; Chen, H.; Liu, D. The fate of lignin during atmospheric acetic acid pretreatment of sugarcane bagasse and the impacts on cellulose enzymatic hydrolyzability for bioethanol production. Renew. Energy 2018, 128, 200–209. [Google Scholar] [CrossRef]
- Boonkanokwong, V.; Remy, B.; Khinast, J.G.; Glasser, B.J. The effect of the number of impeller blades on granular flow in a bladed mixer. Powder Technol. 2016, 302, 333–349. [Google Scholar] [CrossRef]
- Han, W.; Xu, X.; Gao, Y.; He, H.; Chen, L.; Tian, X.; Hou, P. Utilization of waste cake for fermentative ethanol production. Sci. Total. Environ. 2019, 673, 378–383. [Google Scholar] [CrossRef]
- Yu, J.; Xu, Z.; Liu, L.; Chen, S.; Wang, S.; Jin, M. Process integration for ethanol production from corn and corn stover as mixed substrates. Bioresour. Technol. 2019, 279, 10–16. [Google Scholar] [CrossRef]
- Sitepu, I.R.; Enriquez, L.L.; Nguyen, V.; Doyle, C.; Simmons, B.A.; Singer, S.W.; Fry, R.; Simmons, C.W.; Boundy-Mills, K.L. Ethanol production in switchgrass hydrolysate by ionic liquid-tolerant yeasts. Bioresour. Technol. Rep. 2019, 7, 100275. [Google Scholar] [CrossRef]
- Pornpukdeewattana, S.; Chalearmkit, P.; Iamsamang, P. Optimization of Fermentation Temperature for Very High Gravity Ethanol Production using Industrial Strain of Saccharomyces cerevisiae SC90. Sci. Technol. Asia 2014, 19, 21–37. [Google Scholar]
- Nuanpeng, S.; Thanonkeo, S.; Yamada, M.; Thanonkeo, P. Ethanol Production from Sweet Sorghum Juice at High Temperatures Using a Newly Isolated Thermotolerant Yeast Saccharomyces cerevisiae DBKKU Y-53. Energies 2016, 9, 253. [Google Scholar] [CrossRef]
- Techaparin, A.; Thanonkeo, P.; Klanrit, P. High-temperature ethanol production using thermotolerant yeast newly isolated from Greater Mekong Subregion. Braz. J. Microbiol. 2017, 48, 461–475. [Google Scholar] [CrossRef] [PubMed]
- Mohd-Zaki, Z.; Bastidas-Oyanedel, J.-R.; Lu, Y.; Hoelzle, R.; Pratt, S.; Slater, F.R.; Batstone, D.J. Influence of pH Regulation Mode in Glucose Fermentation on Product Selection and Process Stability. Microorganisms 2016, 4, 2. [Google Scholar] [CrossRef]
- Dung, N.T.P.; Nguyen, T.; Huynh, P. Study on Ethanol Fermentation Conditions from Molasses by Thermo-Tolerant Yeasts. Int. J. Bus. Appl. Sci. 2014, 1, 13–22. [Google Scholar]
- Adamiak, R.W.; Karcz, J. Effects of type and number of impellers and liquid viscosity on the power characteristics of mechanically agitated gas—liquid systems. Chem. Pap. 2007, 61, 16–23. [Google Scholar] [CrossRef]
- Reuß, M.; Josic, D.; Popovič, M.; Bronn, W.K. Viscosity of yeast suspensions. Appl. Microbiol. Biotechnol. 1979, 8, 167–175. [Google Scholar] [CrossRef]
- Mohammadi, M.; Shafiei, M.; Abdolmaleki, A.; Karimi, K.; Mikkola, J.-P.; Larsson, C. A morpholinium ionic liquid for rice straw pretreatment to enhance ethanol production. Ind. Crop. Prod. 2019, 139, 111494. [Google Scholar] [CrossRef]
- Louhichi, B.; Belgaib, J.; Benamor, H.; Hajji, N. Production of bio-ethanol from three varieties of dates. Renew. Energy 2013, 51, 170–174. [Google Scholar] [CrossRef]
- Tan, L.; Yu, Y.; Li, X.; Zhao, J.; Qu, Y.; Choo, Y.M.; Loh, S.K. Pretreatment of empty fruit bunch from oil palm for fuel ethanol production and proposed biorefinery process. Bioresour. Technol. 2013, 135, 275–282. [Google Scholar] [CrossRef]
Publisher’s Note: MDPI stays neutral with regard to jurisdictional claims in published maps and institutional affiliations. |
© 2020 by the authors. Licensee MDPI, Basel, Switzerland. This article is an open access article distributed under the terms and conditions of the Creative Commons Attribution (CC BY) license (http://creativecommons.org/licenses/by/4.0/).