Abstract
During water and polymer flooding for enhanced oil recovery, pore structures may vary because of the fluid–rock interactions, which can lead to variations in petrophysical properties and affect oil field production. To investigate the effects of fluid flooding on pore structures, six samples were subjected to brine water, dual-system, and alkaline–surfactant–polymer (ASP) polymer displacement experiments. Before and after experiments, samples were scanned by X-ray CT. Thin sections, X-ray diffraction, and high pressure mercury injection tests were also carried out to characterize mineralogy and fractal dimension of pore systems before experiments. Experiment results show that water flooding with low injection pore volume ratio (IPVR) can improve reservoir quality since total porosity and connected porosity of samples rise after the flooding and the proportion of large pores also increases and heterogeneity of pore structure decreases. However, water flooding with high IPVR has reverse effects on pore structures. Polymer flooding reduces the total porosity, connected porosity, the percentage of small pores and enhances the heterogeneity of pore structures. It can be found that pore structures will change in fluid flooding and appropriate water injection can improve reservoir quality while excessive water injection may destroy the reservoir. Meanwhile, injected polymer may block throats and destroy reservoirs. The experimental results can be used as the basis for oil field development.
1. Introduction
Certain physical properties of a rock, for instance, porosity and permeability, are a function of the pore system within the rock [1]. The analysis of pore structures for reservoir characterization is of great significance, since it can be used not only for evaluation of the heterogeneity of rocks and reservoir classification, but also for the prediction of rock properties and estimation of the resource potential [2]. Thus, a large number of studies have been made to characterize the pore structures of conventional and unconventional reservoirs [2,3,4,5,6,7,8,9,10,11,12,13,14,15,16]. The geometric, topological, and fractal characteristics of pore systems have been analyzed using various techniques, e.g., scanning electron microscopy (SEM), mercury injection capillary pressure (MICP), nuclear magnetic resonance spectroscopy (NMR), X-ray computed tomography (X-ray CT), small-angle neutron scattering (SANS), and gas (i.e., N2 and CO2) adsorption [17,18,19,20,21,22,23,24,25,26,27,28,29,30]. Apart from these parameters, multifractal features of pore structures have also been calculated to evaluate the heterogeneity of the rocks [31,32,33]. Generally, the singularity strength range in multifractal theory reflects the homogeneity degree of rocks. A large value indicates that the rock is more heterogeneous [32].
Most previous studies have focused on characterization of the static pore system of the rocks, and little attention has been paid to the analysis of “dynamic” pore systems of samples. For example, the pore systems are different before and after the water or polymer flooding, since the fluid–rock interaction, such as clay mineral expansion and moving of grains, will change the pore structures [34]. Changes in pore structure could lead to variations in the properties of the rocks and make the reservoir quality better or worse. For example, Wang et al., (2005) characterized the fractal property of the pore system of sandstone before and after water flooding based on MICP data. They showed that the water flooding increased the fractal dimension and the heterogeneity of the pore structure. Li et al., (2011) investigated the change in pore sizes, and fractal characteristics of pore structures, in sandstones and mudstones before and after water adsorption based on SEM images. They found that the porosity and fractal dimension rose. Gharbi et al., (2013) analyzed the effects of CO2 injection in carbonates on the pore structures and connectivity. They concluded that the pore and throat size became larger and the porosity and permeability increased after CO2 was injected into the rocks. Recently, Al-Khulaifi et al., (2019) demonstrated that dissolution in carbonates by CO2 saturated brine leads to changes in the pore structures using X-ray CT technique.
Previously published studies only investigated the impacts of water flooding on fractal dimension and pore size of pore systems. Moreover, the effects of polymer flooding on pore structures have hardly ever been investigated. This study presents a more comprehensive investigation of the effects of water and polymer flooding on the multifractal and geometric properties of pore systems, using sandstone from the mature Yangsanmu oil field, as a case study. This field has undergone 40 years of water injection. Although a high production yield is still maintained, the water cut is as high as 90% and production cost is rising because of the high cost of water injection development and wastewater treatment. In order to find an economic and effective scheme of improved oil recovery (IOR), field experiments involving different approaches will be carried out, including increased water injection, dual-system flooding, and alkaline–surfactant–polymer (ASP) flooding. Before large-scale field experiments commence, it is necessary to analyze the influence of different displacement media (water and polymer) on reservoir pore structure through experimental tests. Six sandstone samples from the Yangsanmu Field were therefore chosen for this purpose. This study is very meaningful for the Yangsanmu oil field, since the variation in the pore structures induced by water and polymer flooding has never been analyzed. Experimental results can be used as the basis for selecting displacement fluid types and parameters in oil field development.
In addition to commonly used petrophysics parameters, such as porosity and permeability, it should be noted that study of pore structures in this work focuses on two aspects: (1) data distribution of pore throat radius, (2) geometric features of pore throat based on image analysis. The former can be obtained from data and analysis of high-pressure mercury intrusion porosimetry (HPMI) curves, CT scanned images, and 3D digital core model based on CT scan data. The latter can be analyzed with images of thin sections and CT scan data. Statistical methods (e.g., cross-plot chart), fractal analysis, and multifractal analysis are employed in the data and images analysis mentioned above.
The paper is organized as follows: a brief introduction to the geological setting of the study area is presented in Section 2. The samples used in the work, the procedure of water and polymer flooding experiments, and fractal theory are described in Section 3. Next, Section 4 presents a comprehensive analysis of the lithofacies, mineral, and pore characteristics of the samples and the effects of fluid displacement on pore structures. Finally, Section 5 summarizes the findings of the study.
2. Geological Setting
Samples were selected from the Guantao Formation in Yangsanmu oil field, Huanghua Depression, Bohai Bay Basin. The Huanghua Depression is located in the center of the Bohai Bay Basin, eastern China, and is one of the four major oil-bearing depressions in the basin [35,36]. It is a long and narrow depression running southwest to northeast (Figure 1A). Yangsanmu Field lies between the Kongdian Uplift and Qinan Sag in the depression (Figure 1B) and has produced petroleum for about 50 years. The field is geologically located at a faulted-anticline whose long axis points runs southwest–northeast. The anticline is separated by a northeastern normal fault which is sealing (Figure 1B). In the past 40 years, there have been four wells drilled in the area and the latest, well Y11A, was drilled in October 2018 and is at the center of the anticline (Figure 1C). The well Y11A penetrated a braided bar sandstone reservoir, the size of which is approximately 0.5 × 1 km in area (Figure 1D) [37].
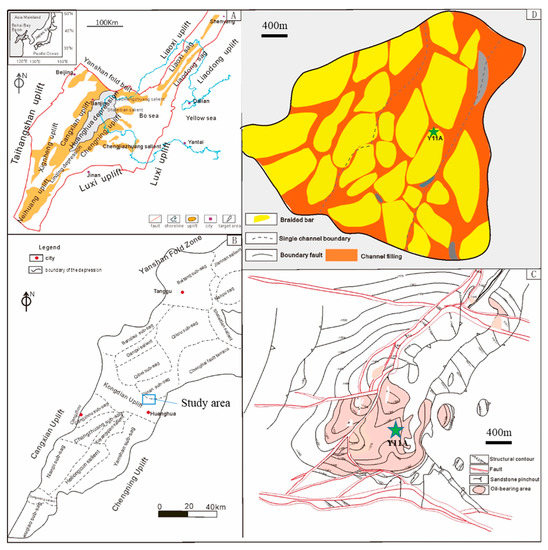
Figure 1.
Geological setting of the study area showing its location, structural features, and sedimentary facies. (A) Bohai Bay Basin and location of Huanghua Depression in the basin. (B) Structure of the Huanghua Depression. The study area, the Yangsanmu oil field, is located in the Kongdian Uplift in the depression. (C) Structure map of the Yangsanmu oil field. Core samples came from well Y11A, which is near the center of the faulted-trap. (D) Sedimentary facies map of the oil field. There is an oil-filled braided bar sandstone reservoir at the location of the well Y11A.
Above basement rocks, there are Paleogene, Neogene, and Quaternary sediments in the Huanghua Depression (see Figure 2). The Paleogene is subdivided into three formations including Kongdian (Ek), Shahejie (Es), and Dongying (Ed) while the Neogene includes the Guantao (Ng) and Minghuazhen (Nm) Formations. There is a regional unconformity between Dongying (Ed) and the Guantao Formation [37]. There are three members in Ng and the target reservoir for this study is the second member (Ng2) (Figure 2). During the Ng2 stage, the climate of the Bohai Bay Basin was mid-subtropical warm and humid and the basin was structurally at a stage of slow subsidence [37,38].
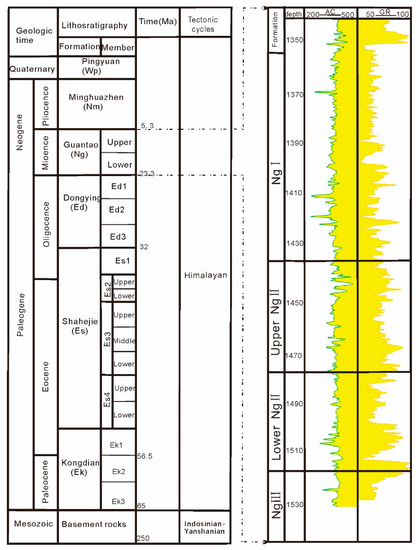
Figure 2.
Generalized Cenozoic-Quaternary sequence framework and stratigraphy of the Huanghua Depression, Bohai Bay Basin, eastern China. The well logs on the right are from the Well Y11A.
3. Samples, Experiments, and Methodology
3.1. Samples
The samples used in this study are from the well Y11A which was drilled in October 2018 in Yangsanmu oil field. Fifty-six meters of continuous core in the Ng Formation (including 30 m in the Ng2 Member) was recovered from the well. Six samples from three depth sections were collected as listing in Table 1. These samples can be divided into 3 groups based on their depths and samples whose depth difference is 1–2 cm belong to the same group. Samples within the same group have the same lithofacies, petrological characteristics, and similar porosity and permeability (see Table 1). The lithofacies of samples 6-003 and 7-008 are parallel bedded sandstones, while that of sample 10-010 is massive sandstone. For the investigation of the effects of both water and polymer flooding on rock properties, six experiments are carried out.

Table 1.
Sample information and plan of displacement experiment.
3.2. Water and Polymer Flooding Experiments
The multiphase flow experiments were carried out on six samples, three groups of two taken at adjacent depths, to study the influence of displacement by different fluid media on pore structures, which can improve our understanding of the advantages and disadvantages of water and polymer flooding approaches, and provide useful guidance for designing new protocols for enhanced oil recovery (EOR).
Types of the tested injection fluid including brine, polymer–surfactant dual-compound polymer/surfactant system, and triple-compound alkali/surfactant/polymer system (abbreviated as ASP). Components of the polymer, surfactant, and alkali are partially hydrolyzed polyacrylamide (HPAM), iodate surfactant, and sodium carbonate respectively, which are commonly used in EOR in the oil field (Table 2).
Table 2.
Component and content of displacement fluid in the experiment.
The experiment was carried out under 20 °C at test center of Energy Development Co., CNOOC. The injection pressure varied and is listed in Table 1. The schematic of the experiment process is presented in Figure 3 and the key processes in the experiments were as follows.
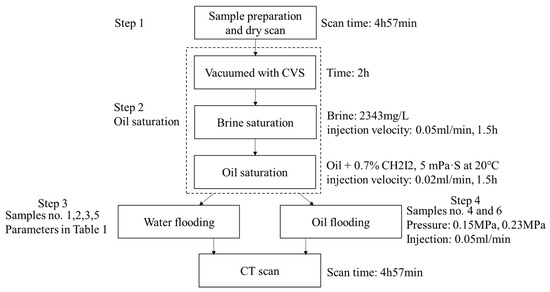
Figure 3.
Workflow of the experiments.
- (1)
- Step 1: sample preparation and dry scan. The six water-wetting core plug samples were packed into carbon fiber holders which are transparent to X rays. After that, each of the dry samples was scanned by X ray CT for 4 h and 57 min.
- (2)
- Step 2: oil-saturated sample preparation. All the samples were vacuumed for 2 h with Castable Vacuum System (CVS). After that, all the six samples were saturated with brine of 2343 mg/L in salinity which was the same as that of the formation water in the study area. The injection velocity of brine was 0.05 mL/min and saturation took 1.5 h. Then, oil was injected at a rate of 0.02 mL/min for 1.5 h at which time the samples were completely saturated with oil. Viscosity of the simulated oil was 5 mPa·S at 20 °C. In order to recognize oil in the CT images, 7 vol% Diiodomethane (CH2I2) was added to the oil as indicator to improve the response to X-rays in the CT scan after flooding.
- (3)
- Step 3: water flooding experiments. Experiment nos.1, 2, 3 and 5, were carried out according to the experimental plan in Table 1. After the experiments, each sample was scanned by X ray CT for 4 h and 57 min.
- (4)
- Step 4: multiphase flooding and scan. Dual-system polymer/surfactant (Experiment no. 4) and ASP (Experiment no. 6) were injected to displace the oil. The injection pressures were 0.15 MPa and 0.23 MPa, respectively. The injection velocity was 0.05 mL/min. Samples were scanned by X ray CT after the experiments, as described above.
In the experiment plan, the injected volume of fluids was measured with injection pore volume ratio (abbreviated as IPVR). It is the ratio of injected fluid volume to pore volume. In the study of displacement effect, this measurement method is more reasonable.
Before and after the displacement experiment, all the samples were scanned using X ray CT twice. Three-dimension digital images of these samples were built. Based on these digital rocks, the geometric and fractal properties were analyzed. For the processing of X ray CT data, a traditional workflow was implemented including 3D reconstruction, median filtering, and binarization process, pore-network extraction, and calculation of pore-throat diameter distributions statistics and analysis [17].
3.3. Analytical Methods
In this study, the 3D CT scan was carried out using a BRUKER Micro-CT SkyScan 1173. The main scan parameters and data reconstruction parameters are listed in Table 3. The image matrix of the scan result is 2240 × 2240 pixels. Scan resolution is 13.84 μm. The vertical interval of CT slices is 10 μm.
Table 3.
CT scan and data reconstruction parameters.
Porosity and permeability were measured using routine helium test methods. Size of the plunger sample was 2.5 cm in diameter and 3 cm in length. X-ray diffraction (XRD) of common minerals, clay minerals, and their relative contents were conducted using D/max-2500 X-ray diffractometer. The test condition was 25 °C and 40% of air humidity. Grain size was analyzed with laser particle sizer MS2000 manufactured by Malvern PANalytical. High-pressure mercury intrusion porosimetry (HPMI) for pore structure was performed under 20 °C using Autopore IV 9500 mercury intrusion tester. The test pore scale ranges from 0.003 to 1000 μm. Direct observation and multifractal analysis of images of thin section are performed to characterize pore structures. Oil-bearing conditions of the samples are analyzed with fluorescent thin sections.
3.4. Theory and Methodology of Fractal and Multifractal Analysis for Pore Structure Characterization
3.4.1. Fractal Analysis of HPMI Results
Fractal geometry dates from the 1970s. It is a useful tool in the description of irregularity and randomness of objects and can be used to characterize complex structures [20,27,39,40,41]. Distribution and geometrical structures of pores in rocks have fractal characteristics [27,32,42].
The cumulative volume of pores is the integral of pore radius distribution density function to pore radius [16,43]. The cumulative volume of pores whose radius is larger than () can be presented as follows:
where is the maximum radius of pores in μm; f(r) is the pore radius distribution density function; a is a constant and D is the fractal dimension of the pore structure. From Equation (1) and the sphere model of pores, the cumulative volume of pores () whose radius is smaller than r can be presented as follows:
where is the minimum radius of pores in μm and α is a scale factor constant related to pore structure. So, the volume proportion of pores () whose radius is smaller than r is:
where V is the total pore volume of the rock in m. For reservoirs with complex pore structures, the maximum pore radius is far greater than the minimum pore radius. Hence, Equation (3) can be simplified to:
In sandstones, the of rocks is commonly far greater than and meets the simplification condition of Formula (4) [44].
In capillary pressure analysis using the mercury intrusion method, the capillary pressure is inversely proportional to pore radius and the relationship is presented as:
where is capillary pressure in MPa; σ is interfacial tension and is wetting angle. In a mercury injection test, the pressure corresponding to , the maximum pore throat radius, is the initial capillary pressure (). From Equations (4) and (5), it can be deduced that
Furthermore,
In Formula (7), S can be calculated by injected mercury saturation and can be read from the mercury injection curve. The fractal dimension () of pore structures can be determined by linear regression analysis of the mercury injection curve.
3.4.2. Multifractal Analysis of CT and Thin Section Images
In the HPMI test, the result is a one-dimensional curve corresponding to the overall response of the pore structure of the sample with x-axis of mercury saturation and y-axis of displacement pressure. It can be treated as distribution of pores and throats which have different radiuses. Pore features reflected in the capillary pressure curve have one simple fractal dimension [44]. But in the X ray CT image, geometry of every pore and throat can be imaged. Heterogeneity of pore structures is more detailed, and multifractal analysis is used to describe the heterogeneity of pores [32].
Grassberger (1990) proposed the theory and an optimized box-assisted method of multi-fractal analysis [45]. Multifractal analysis has been used widely in image processing and can provide a continuous spectrum of fractal dimensions [40]. In this paper, an optimized box-assisted method is employed. According to multifractal theory,
where ε is a small measure scale; is the number of boxes in the subset; α is an index which reflects the singular degree of a small range and is related to its position in the image; is a singular spectrum and it presents density of parameter α with a continuous function. The density distribution function of can be further weighted summed as:
where is the partition function of q with scale ; is moment order of distribution; is mass exponent function, which is expressed as:
In the description of multi-fractal with q-Dq parameters, the generalized Renyi dimension Dq is given by:
Using the Legendre transformation, the above two descriptions of multi-fractal parameters can be correlated as [32]:
4. Results and Discussion
4.1. Mineral and Pore Features of the Samples
As mentioned above, the six samples used in the displacement experiment were collected from three depths. It means that there were two parallel samples whose features were more or less the same at each depth. Mineral components of the three groups of samples are listed in Table 4. The samples of the three groups had very similar contents of quartz, potash feldspar, plagioclase, calcite, dolomite, and total clay minerals. The microscopic oil-bearing condition and plane porosity of the three sample groups were similar (Figure 4).
Table 4.
Quantitative analysis of mineral components of rock and clay with X-ray diffraction.
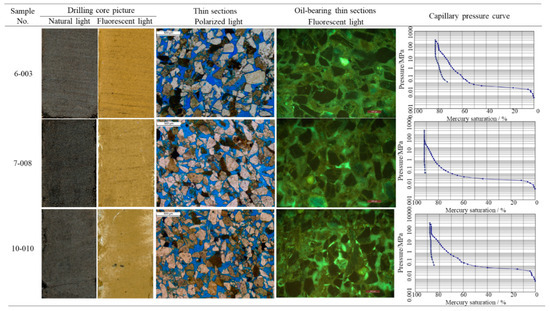
Figure 4.
Lithological features of the three sample groups.
Apart from the mineral characteristics of the samples, the geometric and fractal properties of pore structures of the samples were characterized using HPMI data. There is a wide “platform” in the mercury injection curve of each sample in Figure 4. The “platform” has a wide range of mercury saturation which indicates a wide range of pore and throat size. The injection pressure of the “platform” is low and this indicates that the pore and throat size of the “platform” is large. Stated thus, the geometry of capillary pressure curves of these samples indicate distribution of pores are relatively homogeneous (Figure 4). In addition, it can be also concluded that sample 7-008 has a more homogeneous pore distribution and larger total connected pore volume than the other two. This can be also verified quantitatively from the HPMI parameters, such as maximum mercury injection saturation of the samples (Table 5).
Table 5.
Capillary pressure curve parameters of the three sample groups.
The relationship of displacement pressure (Pc) and water saturation (Sw) has segmented characteristics and presents as four straight lines with the different gradients in the lgPc-lgSw scatter diagram (Figure 5). According to Formula (7), fractal geometry parameters are derived from Figure 5. The three samples have similar fractal parameters (Table 6). From the fractal geometry parameters listed in Table 6, four characteristics can be indicated:
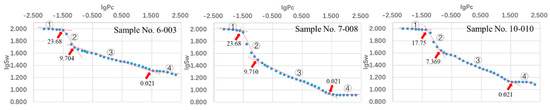
Figure 5.
The lgPc-lgSw scatter diagrams of different samples. The relationship between Pc and Sw has segmented characteristics. The data marked with red arrow are pore radius (μm) at the intersection points.
Table 6.
Fractal features of pores based on high-pressure mercury intrusion porosimetry (HPMI) data.
- (1)
- Since parameters Pc and Sw, which are derived from HPMI test, are a response to pore radius and its distribution, the heterogeneity of pore radius distribution has segmented characteristics in the study area.
- (2)
- Pores in the same radius range of the three samples have similar fractal dimension. Distribution of pores with a radius within the range of 9.704–23.68 μm, which have a lower fractal dimension, are more homogeneous than that of pores with a radius larger than 23.68 μm or smaller than 9.704 μm.
- (3)
- In Figure 5, the second part (segment ②) of the four segmented lines which has a high gradient has the smallest fractal dimension of HPMI curve (Table 6). It corresponds to the level part of capillary pressure curve whose mercury saturation ranges from about 10% to 60% (Figure 4). Pores in this range make up more than 45% pore volume in the samples (Figure 4 and Table 6).
- (4)
- Fractal dimension of pore radius distribution of large pores (with a radius larger than 23 μm and 17.75 μm for sample 10-010) and small pores (with a radius smaller than about 0.021 μm) is very high and larger than 2.9. It means pore radius distribution of large pores and small pores mentioned above are very heterogeneous (Table 6).
4.2. Effects of Fluid Displacement on Pore Structures
4.2.1. Geometric Characteristics
After water flooding at low water IPVR, the quality of relative good reservoirs, that have high porosity and relatively homogeneous pore radius distribution, can be further improved. For example, samples 6-003 and 7-008 have high porosity (>29%) and relatively homogeneous pore radius distribution as discussed in Section 4.1 of this paper. After 1.25 PV water flooding (Experiment no.2), porosity of sample 6-003G increased from 29.2% to 32.5%. Connected pores (connected porosity), as measured by 3D CT model, increased from 29.1% to 32.4% (Table 7) and the relative proportion of large pores whose radius was greater than 124.58 μm increased (Figure 6B). It means pore connectivity becomes better. The range of Δα, which is defined as the difference between the maximum and minimum value of α, decreased from 0.7574 to 0.7528 (Figure 7E). Since heterogeneity decrease with the range of Δα [32], the above decreasing of Δα range indicates the heterogeneity of reservoir pore structure is weakened. Similar changes happened for the sample 7-008F (Figure 8E, Table 7).
Table 7.
Porosity change of total pores, connected pores and isolated pores after displacement.
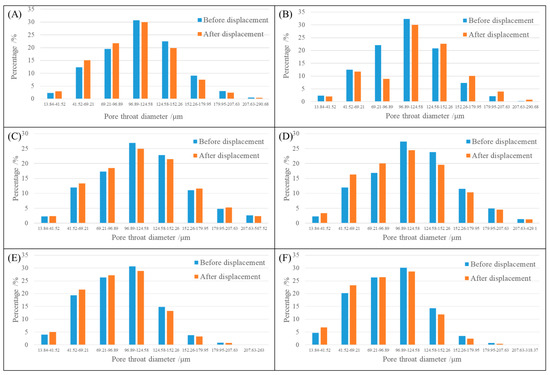
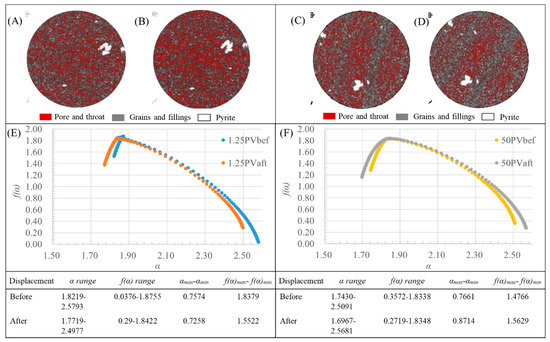
Figure 7.
Multifractal features of sample 6-003 before and after displacement experiments. The left figures and table, including (A,B,E) are results of Experiment no.2 in which 1.25 PV water is injected while the right is for Experiment no.1 in which 50 PV water is injected. (A,B) CT images of sample 6-003G before and after displacement, respectively. (C,D) CT images of sample 6-003F before and after displacement, respectively. (E,F) Multifractal features of these CT images. The sample petrophysical and experimental parameters are listed in Table 1 and Table 2.
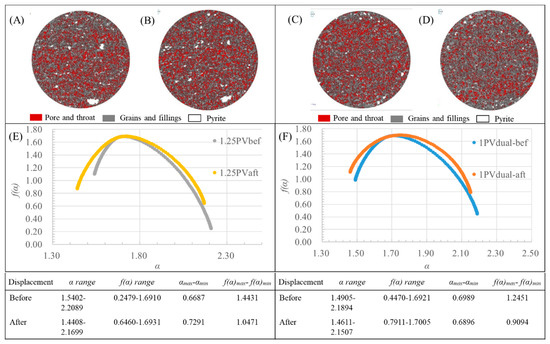
Figure 8.
Multifractal features of sample 7-008 before and after displacement experiments. The left figures and table, including (A,B,E) are results of Experiment no.3 in which 1.25 PV water is injected while the right is for Experiment no.4 in which 1 PV polymer–surfactant dual-compound system is injected. (A,B) CT images of sample 7-008F before and after displacement, respectively. (C,D) CT images of sample 7-008G before and after displacement, respectively. (E,F) Multifractal features of these CT images. The sample petrophysical and experimental parameters are listed in Table 1 and Table 2.
Water flooding at high water IPVR decreases both connected porosity and total porosity of reservoirs. In Experiment no.1, with sample 6-003F, connected porosity and total porosity decrease by 3.1% and 3.0%, respectively (Table 7). Statistics of pore radius distribution in Figure 6A show the increase in small pores and decrease in large pores with a pore diameter threshold of 96.89 μm. The increase in Δα from 0.7661 to 0.8714 indicates that distribution of pore radius becomes more heterogeneous after 50 PV flooding (Figure 7F). Water flooding of at high water IPVR may decrease the pore connectivity (Figure 8C,D). Comparing results of Experiment nos.1 and 2, it can be concluded that volume of injected water controls the influence of water flooding on pore structures. It is inferred that at the early stage of water flooding, matrix and small grains began to move and some of the fine-grained components were washed away. Large pores which are main channel of flooding water can expand and the average pore radius increase. Meanwhile, pore structures become more homogeneous than that before water flooding. As more and more water was injected into the pores, water injection pore volume ratios increased and the average radius of movable grains in flooding also increased. This means larger grains move with flooding water in the pore network. The possibility that small pores and throats are blocked by these moving particles will increase greatly. The connectivity of pores will decrease and pore radius distribution will become more heterogeneous.
Polymer–surfactant dual-compound system and the triple compound ASP system are commonly used displacement fluids in EOR. The influence of the two systems on pore structures was tested and the results were compared with that of water. Controlled Experiments nos.3 and 4 used water and the polymer–surfactant dual-compound system (abbreviated to dual-system). The dual-system caused the total porosity of sample 7-008G to decrease from 28.6% to 22.0% and connected porosity to decrease from 28.5% to 21.7%. Pore connectivity became poor and the relative proportion of isolated porosity increased to 3× the original (Table 7). The proportion of small pores whose diameters were under 96.89 μm increased while that of large pores decreased (Figure 6D).
In the controlled Experiment no.6, ASP injection caused total porosity to decrease significantly from 20.9% to 13.4%, and connected porosity decreased from 20.3% to 11.5%. The relative proportion of isolated porosity increased from 3.0% to 14.3% (Table 7). The proportion of pores with a diameter larger than 96.89 μm decreased while the proportion of small pores with a diameter under 69.21 μm increased (Figure 6F). In the multifractal analysis of the CT image, Δα increased from 0.7233 to 0.7615 and indicated that the distribution of pore radius became more heterogeneous after the ASP flooding (Figure 9F).
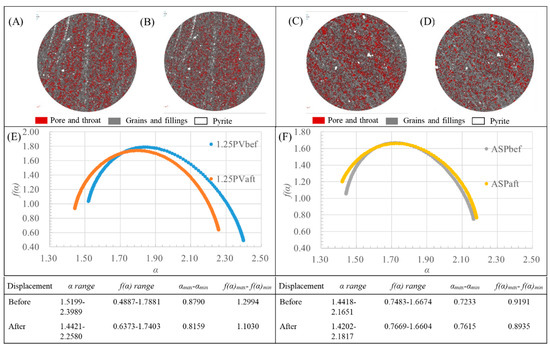
Figure 9.
Multifractal features of sample 10-010 before and after displacement experiments. The left figures and table, including (A,B,E) are results of Experiment no.5 in which 1.25 PV water is injected while the right is for Experiment no.6 in which 1 PV ASP is injected. (A,B) CT images of sample 10-010F before and after displacement, respectively. (C,D) CT images of sample 10-010G before and after displacement, respectively. (E,F) Multifractal features of these CT images. The sample petrophysical and experimental parameters are listed in Table 1 and Table 2.
Overall, chemical flooding decreased porosity and increased the heterogeneity of pore structures. In Figure 10A, the distribution of retained polymer in the space can be visualized in the digital core model. Some narrow “neck” connecting adjacent pores is blocked such as (a) in Figure 10C. Large pores can be partially filled and divided into small pores just like (b) in Figure 10B,C. Small pores around the large pore are wholly or partially filled as (c–e) in Figure 10B,C. It can be concluded that the mechanism of chemical flooding’s influence on pore structures is the blocking and filling of the residual polymer. Considering the above mechanism, choosing polymers that have suitable molecular size and structure is very important in EOR.
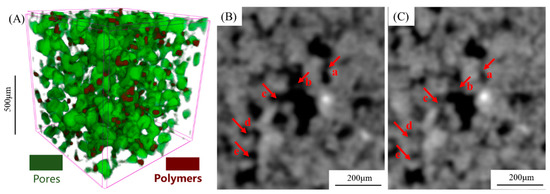
Figure 10.
Pore structure changes after the ASP displacement experiment. (A) The result of Experiment no.6. Pore distribution model after ASP flooding. The area in green is pores and that in brownish-red is polymesr retained in pores. Pictures in (B,C) are the same CT image before and after ASP flooding.
4.2.2. Multifractal Parameters before and after Multiphase Flooding
Multifractal analysis is used in 2D image analysis of both thin sections and CT images to describe microscopic heterogeneity of pores before and after multiphase flooding. The “heterogeneity of pores” we discussed with analysis of 2D pictures here is mainly the geometrical heterogeneity of pores and statistical heterogeneity of pore radius distribution.
Firstly, multifractal analysis of the 2D thin section image was made to describe the geometrical heterogeneity of pores before flooding. The f(α)-α crossplots and multifractal parameters in Figure 11 indicate the difference in pore structure heterogeneity of the reservoir sands. In f(α)-α crossplot, the geometry of f(α)-α curves of the samples 10-010 and 6-003 are similar while that of sample 7-008 is obviously different (Figure 11). Quantitatively, the width and height of the curves are different. The width of α (range of αmax−αmin) and maximum f(α) of the samples all decrease in the order of samples 10-010, 6-003, and 7-008 (Figure 11).
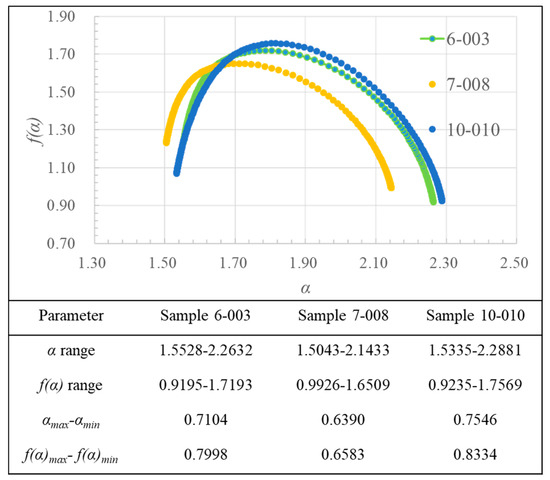
Figure 11.
Multifractal features of pore structures calculated from thin sections.
Furthermore, multifractal analysis was made on the CT images of the samples before and after displacement experiments based on the multifractal theory in Section 3.4.2. According to the ranges of Δα in Figure 11, heterogeneity of pore structures increase in the order of sample 7-008, 6-003 and 10-010. At the pore scale, multifractal features of CT images indicate heterogeneity of pore structures. The multifractal characteristics of six samples are demonstrated in Figure 7, Figure 8 and Figure 9. According to the data and curves from Figure 7 to Figure 9, average Δα of the three sample groups before displacement experiments are 0.76175, 0.6838, and 0.8011, respectively, in the order of sample 6-003, 7-008 and 10-010. So the pore structure of sample 7-008 is the most homogeneous while that of 10-010 is the most heterogeneous. From either fractal or multifractal features mentioned above, it can be observed that the original pore structure heterogeneity of the samples on a multi-scale increase in the sequence of 7-008, 6-003, and 10-010.
Multifractal parameters change after the displacement experiments. For Experiment no.2 with 1.25 PV water injection, although the geometry of curves and the maximum f(α) before and after the experiments are similar, the Δα decreases slightly after water flooding (Figure 7E). In Figure 7F, it can be observed the two curves coincide when α is in the range 1.80–2.30, and the curve before displacement is enclosed by that after displacement. It is obvious that Δα increases after the experiment. The geometry of curves in the Figure 7F, Figure 8E,F and Figure 9F are similar such that the f(α)-α curves of samples after displacement are gentler and wider.
5. Conclusions
This study presents an experimental investigation of the effects of water flooding and polymer flooding on the characteristics of pore systems including the distribution of pore radius and geometrical features of pores based on six high-porosity rocks. Firstly, the lithofacies and mineral components were described based on the drilling core observation and X-ray diffraction, which provides the basic geological information for the samples. Subsequently, the fractal dimension of pore structures of these samples was analyzed using the HMPI data, revealing the heterogeneity of the pore systems. Finally, the multifractal and geometric characteristics of pore structures of samples before and after the water and polymer flooding were calculated and compared to CT images. The findings of the study are as follows.
- (1)
- Although fractal analysis of HPMI, multifractal analysis of thin sections, and CT images are different in scale and information types, their results of heterogeneity analysis of pore structures are the same.
- (2)
- Water flooding changes petrophysics (e.g., porosity) and the distribution of the pore radius of reservoirs. For reservoirs with high porosity, water flooding of low water IPVR can improve reservoir quality slightly. Both total porosity and connected porosity increase somewhat after the flooding. The proportion of large pores increases and heterogeneity of pore radius distribution decreases. However, the water flooding of high water IPVR worsens the pore size and rock properties. The mechanism of the above phenomena in the study area is the change of matrix/grain moving during flooding.
- (3)
- On the other hand, polymer flooding has an adverse effect on the improvement of reservoir quality. First, total porosity and connected porosity decrease after the polymer flooding. Moreover, the relative proportion of small pores rises, and distribution of pore radius of reservoirs become more heterogeneous.
This study will help geologists understand the change in rock properties induced by water flooding and polymer flooding. Such a variation will affect the recovery rate from different IOR schemes.
Author Contributions
X.Z. designed the experiment, made fractal analysis, and write the original draft; C.L. validated the method and data; Y.W. processed the CT data; T.Z. made multifractal analysis; H.W. (Hongwei Wang) carried on the displacement experiment; H.W. (Hanwei Wang) and X.W. made thin section analysis; D.H. prepared the samples. All authors have read and agreed to the published version of the manuscript.
Funding
This work was supported by the National Natural Science Foundation of China (Grant No. 41672129 and 41772139) and Fundamental Research Funds for the Central Universities (Grant No. 19CX02001A).
Acknowledgments
Thanks to Dagang Oil Field, PetroChina for providing the samples and data.
Conflicts of Interest
The authors declare no conflict of interest.
References
- Blunt, M.J.; Bijeljic, B.; Dong, H.; Gharbi, O.; Iglauer, S.; Mostaghimi, P.; Paluszny, A.; Pentland, C. Pore-scale imaging and modelling. Adv. Water Resour. 2013, 51, 197–216. [Google Scholar] [CrossRef]
- Tian, W.; Lu, S.; Huang, W.; Wang, S.; Gao, Y.; Wang, W.; Li, J.; Xu, J.; Zhan, Z. Study on the Full-Range Pore Size Distribution and the Movable Oil Distribution in Glutenite. Energy Fuels 2019, 33, 7028–7042. [Google Scholar] [CrossRef]
- Hu, Q.; Zhang, Y.; Meng, X.; Li, Z.; Xie, Z.; Li, M. Characterization of micro-nano pore networks in shale oil reservoirs of Paleogene Shahejie Formation in Dongying Sag of Bohai Bay Basin, East China. Pet. Explor. Dev. 2017, 44, 720–730. [Google Scholar] [CrossRef]
- Wu, Y.; Tahmasebi, P.; Lin, C.; Jawad Munawar, M.; Cnudde, V. Effects of micropores on geometric, topological and transport properties of pore systems for low-permeability porous media. J. Hydrol. 2019, 575, 327–342. [Google Scholar] [CrossRef]
- Lai, J.; Wang, G.; Wang, Z.; Chen, J.; Pang, X.; Wang, S.; Zhou, Z.; He, Z.; Qin, Z.; Fan, X. A review on pore structure characterization in tight sandstones. Earth-Sci. Rev. 2018, 177, 436–457. [Google Scholar] [CrossRef]
- Xia, Y.; Cai, J.; Perfect, E.; Wei, W.; Zhang, Q.; Meng, Q. Fractal dimension, lacunarity and succolarity analyses on CT images of reservoir rocks for permeability prediction. J. Hydrol. 2019, 579, 124198. [Google Scholar] [CrossRef]
- Cai, J.; Lin, D.; Singh, H.; Wei, W.; Zhou, S. Shale gas transport model in 3D fractal porous media with variable pore sizes. Mar. Pet. Geol. 2018, 98, 437–447. [Google Scholar] [CrossRef]
- Tahmasebi, P.; Javadpour, F.; Sahimi, M. Stochastic shale permeability matching: Three-dimensional characterization and modeling. Int. J. Coal Geol. 2016, 165, 231–242. [Google Scholar] [CrossRef]
- Nelson, P.H. Pore-throat sizes in sandstones, tight sandstones, and shales. Am. Assoc. Pet. Geol. Bull. 2009, 93, 329–340. [Google Scholar] [CrossRef]
- Hemes, S.; Desbois, G.; Urai, J.L.; Schröppel, B.; Schwarz, J.O. Multi-scale characterization of porosity in Boom Clay (HADES-level, Mol, Belgium) using a combination of X-ray μ-CT, 2D BIB-SEM and FIB-SEM tomography. Microporous Mesoporous Mater. 2015, 208, 1–20. [Google Scholar] [CrossRef]
- Clarkson, C.R.; Solano, N.; Bustin, R.M.; Bustin, A.M.M.; Chalmers, G.R.L.; He, L.; Melnichenko, Y.B.; Radliński, A.P.; Blach, T.P. Pore structure characterization of North American shale gas reservoirs using USANS/SANS, gas adsorption, and mercury intrusion. Fuel 2013, 103, 606–616. [Google Scholar] [CrossRef]
- Okolo, G.N.; Everson, R.C.; Neomagus, H.W.J.P.; Roberts, M.J.; Sakurovs, R. Comparing the porosity and surface areas of coal as measured by gas adsorption, mercury intrusion and SAXS techniques. Fuel 2015, 141, 293–304. [Google Scholar] [CrossRef]
- Chalmers, G.R.; Bustin, R.M.; Power, I.M. Characterization of gas shale pore systems by porosimetry, pycnometry, surfacearea, andfield emission scanning electron microscopy/transmission electron microscopy image analyses: Examples from the Barnett, Woodford, Haynesville, Marcellus, and Doig units. Am. Assoc. Pet. Geol. Bull. 2012, 96, 1099–1119. [Google Scholar] [CrossRef]
- Klaver, J.; Hemes, S.; Houben, M.; Desbois, G.; Radi, Z.; Urai, J.L. The connectivity of pore space in mudstones: Insights from high-pressure Wood’s metal injection, BIB-SEM imaging, and mercury intrusion porosimetry. Geofluids 2015, 15, 577–591. [Google Scholar] [CrossRef]
- Romero, E.; Simms, P.H. Microstructure investigation in unsaturated soils: A review with special attention to contribution of mercury intrusion porosimetry and environmental scanning electron microscopy. Geotech. Geol. Eng. 2008, 26, 705–727. [Google Scholar] [CrossRef]
- Wu, Y.; Tahmasebi, P.; Lin, C.; Zahid, M.A.; Dong, C.; Golab, A.N.; Ren, L. A comprehensive study on geometric, topological and fractal characterizations of pore systems in low-permeability reservoirs based on SEM, MICP, NMR, and X-ray CT experiments. Mar. Pet. Geol. 2019, 103, 12–28. [Google Scholar] [CrossRef]
- Wu, Y.; Tahmasebi, P.; Yu, H.; Lin, C.; Wu, H.; Dong, C. Pore-scale 3D Dynamic Modeling and Characterization of Shale Samples: Considering the Effects of Thermal Maturation. J. Geophys. Res. Solid Earth 2020, 125, e2019JB01830. [Google Scholar] [CrossRef]
- Sun, M.; Yu, B.; Hu, Q.; Yang, R.; Zhang, Y.; Li, B.; Melnichenko, Y.B.; Cheng, G. Pore structure characterization of organic-rich Niutitang shale from China: Small angle neutron scattering (SANS) study. Int. J. Coal Geol. 2018, 186, 115–125. [Google Scholar] [CrossRef]
- Daigle, H.; Hayman, N.W.; Jiang, H.; Tian, X.; Jiang, C. Multiscale pore networks and their effect on deformation and transport property alteration associated with hydraulic fracturing. Energy Procedia 2017, 125, 71–79. [Google Scholar] [CrossRef]
- Daigle, H.; Johnson, A.; Thomas, B. Determining fractal dimension from nuclear magnetic resonance data in rocks with internal magnetic field gradients. Geophysics 2014, 79, D425–D431. [Google Scholar] [CrossRef]
- Li, Z.; Wu, S.; Xia, D.; He, S.; Zhang, X. An investigation into pore structure and petrophysical property in tight sandstones: A case of the Yanchang Formation in the southern Ordos Basin, China. Mar. Pet. Geol. 2018, 97, 390–406. [Google Scholar] [CrossRef]
- Dong, H.; Sun, J.; Zhu, J.; Liu, L.; Lin, Z.; Golsanami, N.; Cui, L.; Yan, W. Developing a new hydrate saturation calculation model for hydrate-bearing sediments. Fuel 2019, 248, 27–37. [Google Scholar] [CrossRef]
- Favvas, E.P.; Sapalidis, A.A.; Stefanopoulos, K.L.; Romanos, G.E.; Kanellopoulos, N.K.; Kargiotis, E.K.; Mitropoulos, A.C. Characterization of carbonate rocks by combination of scattering, porosimetry and permeability techniques. Microporous Mesoporous Mater. 2009, 120, 109–114. [Google Scholar] [CrossRef]
- Fink, R.; Amann-Hildenbrand, A.; Bertier, P.; Littke, R. Pore structure, gas storage and matrix transport characteristics of lacustrine Newark shale. Mar. Pet. Geol. 2018, 97, 525–539. [Google Scholar] [CrossRef]
- Sarkar, P.; Kumar, A.; Singh, K.H.; Ghosh, R.; Singh, T.N. Pore system, microstructure and porosity characterization of Gondwana shale of Eastern India using laboratory experiment and watershed image segmentation algorithm. Mar. Pet. Geol. 2018, 94, 246–260. [Google Scholar] [CrossRef]
- Li, J.; Yin, J.; Zhang, Y.; Lu, S.; Wang, W.; Li, J.; Chen, F.; Meng, Y. A comparison of experimental methods for describing shale pore features—A case study in the Bohai Bay Basin of eastern China. Int. J. Coal Geol. 2015, 152, 39–49. [Google Scholar] [CrossRef]
- Ge, X.; Fan, Y.; Deng, S.; Han, Y.; Liu, J. An improvement of the fractal theory and its application in pore structure evaluation and permeability estimation. J. Geophys. Res. Solid Earth 2016, 121, 6333–6345. [Google Scholar] [CrossRef]
- Desbois, G.; Urai, J.L.; Hemes, S.; Schröppel, B.; Schwarz, J.O.; Mac, M.; Weiel, D. Multi-scale analysis of porosity in diagenetically altered reservoir sandstone from the Permian Rotliegend (Germany). J. Pet. Sci. Eng. 2016, 140, 128–148. [Google Scholar] [CrossRef]
- Tahmasebi, P.; Javadpour, F.; Sahimi, M. Multiscale and multiresolution modeling of shales and their flow and morphological properties. Sci. Rep. 2015, 5, 1–11. [Google Scholar] [CrossRef]
- Tahmasebi, P. Nanoscale and multiresolution models for shale samples. Fuel 2018, 217, 218–225. [Google Scholar] [CrossRef]
- Karimpouli, S.; Tahmasebi, P. 3D Multifractal Analysis of Porous Media Using 3D Digital Images: Considerations for heterogeneity evaluation. Geophys. Prospect. 2019, 67, 1082–1093. [Google Scholar] [CrossRef]
- Zhao, P.; Wang, Z.; Sun, Z.; Cai, J.; Wang, L. Investigation on the pore structure and multifractal characteristics of tight oil reservoirs using NMR measurements: Permian Lucaogou Formation in Jimusaer Sag, Junggar Basin. Mar. Pet. Geol. 2017, 86, 1067–1081. [Google Scholar] [CrossRef]
- Zhao, P.; Wang, X.; Cai, J.; Luo, M.; Zhang, J.; Liu, Y.; Rabiei, M.; Li, C. Multifractal analysis of pore structure of Middle Bakken formation using low temperature N2 adsorption and NMR measurements. J. Pet. Sci. Eng. 2019, 176, 312–320. [Google Scholar] [CrossRef]
- Xiong, S.; Wang, X.; Zhang, S.; Zhao, T.; Pang, F.; Gao, L. Physical properties variation of WXS reservoir after long-term water flooding. Lithol. Reserv. 2019, 31, 120–129. [Google Scholar]
- Zhang, T.; Zhang, X.; Lin, C.; Yu, J.; Zhang, S. Seismic sedimentology interpretation method of meandering fluvial reservoir: From model to real data. J. Earth Sci. 2015. [Google Scholar] [CrossRef]
- Su, J.; Zhu, W.; Lu, H.; Xu, M.; Yang, W.; Zhang, Z. Geometry styles and quantification of inversion structures in the Jiyang depression, Bohai Bay Basin, eastern China. Mar. Pet. Geol. 2009, 26, 25–38. [Google Scholar] [CrossRef]
- Liu, H.; Lin, C.; Zhang, X.; Wang, H.; Fu, X. Sedimentological characteristics and controlling factors on fluvial styles of the Guantao Formation, Kongdian Oilfield, China. J. Earth Syst. Sci. 2019, 128, 37. [Google Scholar] [CrossRef]
- Zhang, X.; Zhang, T.; Lin, C.; Wu, X.; Huang, D.; Lutome, M.S.; Chen, D.; Liu, W. Reservoir architecture and evolution of meandering belt: A subsurface case in the Jiyang Depression, eastern China. J. Pet. Sci. Eng. 2020, 193, 107380. [Google Scholar] [CrossRef]
- Paz Ferreiro, J.; Vidal Vázquez, E. Multifractal analysis of Hg pore size distributions in soils with contrasting structural stability. Geoderma 2010, 160, 64–73. [Google Scholar] [CrossRef]
- Zhang, Z.; Weller, A. Fractal dimension of pore-space geometry of an eocene sandstone formation. Geophysics 2014, 79, D377–D387. [Google Scholar] [CrossRef]
- Cai, J.; Yu, B.; Zou, M.; Luo, L. Fractal characterization of spontaneous co-current imbibition in porous media. Energy Fuels 2010, 24, 1860–1867. [Google Scholar] [CrossRef]
- Pia, G.; Sanna, U. An intermingled fractal units model to evaluate pore size distribution influence on thermal conductivity values in porous materials. Appl. Therm. Eng. 2014, 65, 330–336. [Google Scholar] [CrossRef]
- Halsey, T.C.; Jensen, M.H.; Kadanoff, L.P.; Procaccia, I.; Shraiman, B.I. Fractal measures and their singularities: The characterization of strange sets. Nucl. Phys. B 1987, 2, 501–511. [Google Scholar] [CrossRef]
- Zhang, X.; Zhang, T.; Lin, C. Pore structure evaluation of low permeability reservoir based on pore fractal features. Lithol. Reserv. 2013, 25, 40–45. [Google Scholar]
- Grassberger, P. An optimized box-assisted algorithm for fractal dimensions. Phys. Lett. A 1990, 148, 63–68. [Google Scholar] [CrossRef]


© 2020 by the authors. Licensee MDPI, Basel, Switzerland. This article is an open access article distributed under the terms and conditions of the Creative Commons Attribution (CC BY) license (http://creativecommons.org/licenses/by/4.0/).