Abstract
The development of electric vehicles (EVs) has drawn considerable attention to the establishment of sustainable transport systems to enable improvements in energy optimization and air quality. EVs are now widely used by the public as one of the sustainable transportation measures. Nevertheless, battery charging for EVs create several challenges, for example, lack of charging facilities in urban areas and expensive battery maintenance. Among various components in EVs, the battery pack is one of the core consumables, which requires regular inspection and repair in terms of battery life cycle and stability. The charging efficiency is limited to the power provided by the facilities, and therefore the current business model for EVs is not sustainable. To further improve its sustainability, plug-in electric vehicle battery pack standardization (PEVBPS) is suggested to provide a uniform, standardized and mobile EV battery that is managed by centralized service providers for repair and maintenance tasks. In this paper, a fuzzy-based battery life-cycle prediction framework (FBLPF) is proposed to effectively manage the PEVBPS in the market, which integrates the multi-responses Taguchi method (MRTM) and the adaptive neuro-fuzzy inference system (ANFIS) as a whole for the decision-making process. MRTM is formulated based on selection of the most relevant and critical input variables from domain experts and professionals, while ANFIS takes part in time-series forecasting of the customized product life-cycle for demand and electricity consumption. With the aid of the FPLCPF, the revolution of the EV industry can be revolutionarily boosted towards total sustainable development, resulting in pro-active energy policies in the PEVBPS eco-system.
1. Introduction
In recent years, sustainable development in transportation has been dramatically advocated, in which it is believed that the use of electric vehicles (EVs) replacing existing gasoline-powered vehicles is relatively sustainable, without air pollution, and better energy consumption performance [1,2]. Also, the adoption of EVs can effectively facilitate the green energy economy approach in the automotive industry [3]. EVs have been widely used by the public as a sustainable and environmentally-friendly transport measure. Therefore, the operations management of typical EVs is well-established and sophisticated in the market. According to the report on the global EV outlook 2019 [4], the number of EVs increased rapidly with an increase of 63% in 2019 where more than five million EVs were recorded. Although there were about 5.2 million charging facilities globally in 2018, only 0.54 million facilities were publicly available, and the rest (4.66 million units) were private chargers. Thus, charging infrastructure and support are deemed to be the major obstacles in the current EV industry.
On the other hand, end users cannot manage the product life cycle of vehicle batteries, which gradually deteriorate along with the usage of EVs. Thus, EVs are disadvantaged in the second-hand market when being sold. Also, the repair and maintenance of the batteries should be conducted regularly, and are relatively expensive to end-users. Therefore, the current EV eco-system cannot be effectively sustainable in attracting more end-users to adopt EVs, particularly estimating the product life cycle for the batteries.
In view of the above issues, plug-in electric vehicle battery pack standardization (PEVBPS) is being actively researched and developed to further enhance the sustainability of the EV industry [5,6]. The PEVBPS, which can be the next revolution of the EV industry, provides high flexibility and ease of use in inserting and removing batteries in EVs, as shown in Figure 1. Also, a new energy policy for the EVs can be formulated by adopting PEVBPS in the market. EV battery management hub manages the PEVBPS produced from the battery manufacturers, including charging, recycling, maintenance, and service support. PEVBPS is then ready in the battery exchange stations for the replacement of the vehicle batteries by end-users. Since the research and development of PEVBPS are still at the preliminary stage and not ready to launch to market, product life-cycle management (PLM) for the PEVBPS is essential to determine the appropriate energy policy and to facilitate sustainable development. To effectively establish the PLM for the PEVBPS, a fuzzy-based battery life cycle prediction framework (FBLPF) is proposed in this paper for forecasting time-series demand and electricity consumption for the PEVBPS to support decision-making on inventory management and production planning. Although there are several studies related to product life cycle prediction, the selection of most critical input variables to minimize error and time used for the training forecasting engine is under-researched. Consequently, the multi-response Taguchi method (MRTM) is adopted to guide the training and operations of the adaptive neuro-fuzzy inference system (ANFIS) such that a minimal number of the input variables, forecasting errors and training times can be obtained to build the prediction engine. As multiple objectives are considered in the Taguchi method, the MRTM, which is one of the techniques for the design of experiments (DoE), is deemed to be promising to aggregate the quality characteristics from multiple objectives [7]. Therefore, the input variables and process settings can be determined to guide the deployment of ANFIS to forecast the time-series demand and electricity consumption for achieving the product life cycle prediction. Also, since the input variables to formulate the product life-cycle prediction are relatively subjective and vague, ANFIS is selected for time-series demand forecasting, which uses the advantages of artificial neural network and fuzzy inference system, for example, non-linear structure computation and rapid learning capability [8]. Overall, the MRTM-guided ANFIS approach is developed in this paper to achieve useful battery life cycle prediction for the PEVBPS in the EV industry.
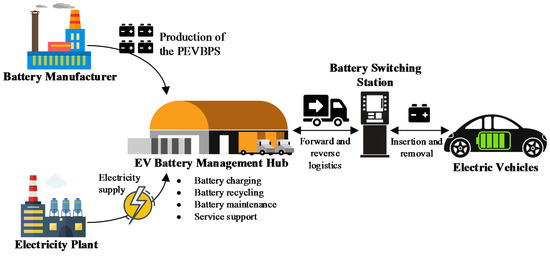
Figure 1.
Graphical illustration of the plug-in electric vehicle battery pack standardization (PEVBPS)-based electric vehicle (EV) industry.
The contributions of this research work are summarized in two aspects. First, this study presents a systematic development for the product life-cycle management for the novel product, namely PEVBPS, in the EV industry. The development of the PEVBPS is a sustainable measure in the EV industry so that effective product life-cycle management is essential to reduce the likelihood of failure in implementing such a new product. To structure the PLM of the PEVBPS, eight essential parameters; time sequence, fuel price, electricity price, project investment, market size, market competition, customer satisfaction, and policy support and subsidies, are considered for enriching the research domain of the EV. Second, in order to effectively forecast the time-series demand and electricity consumption, integration of MRTM and ANFIS is proposed, in which MRTM is functioned to obtain the optimal parameter settings in the ANFIS. Subsequently, the aim is to improve the forecasting accuracy and efficiency, and to obtain a scalable and adaptive forecasting approach for various application domains.
The remainder of this paper is organized as follows. Section 2 reviews research studies concerning electric vehicle management, product life cycle management, and artificial intelligence techniques, such that, the motivation and research gap can be formulated accordingly. Section 3 describes the methodology of the proposed FBLPF. Section 4 presents a case study of implementing the proposed framework in an EV management company to examine its feasibility and performance. Section 5 includes the results and discussion after the implementation of the proposed framework. Finally, the concluding remarks are drawn in Section 6.
2. Literature Review
In this section, a literature review is conducted on the aspects of (i) electric vehicle management, (ii) product life cycle management, and (iii) artificial intelligence techniques to support the research motivation.
The development of EVs in the community is regarded as a sustainable strategic measure in transport systems [2], leading to a sustainable society and a green economy. Differing to traditional vehicles, EVs have the advantages of zero-emission of greenhouse gases (GHGs), such as carbon dioxide, nitrogen oxide, and hydrocarbon, which arise due to the heat generated from the combustion engines. To sustain the community and improve environmental awareness, EVs were invented with higher engine efficiency and minimizing pollutants during driving [9]. For typical EVs, the electricity that is generated from electricity plants and renewable energy sources is stored in EVs’ batteries, fuel cells, and ultracapacitors. Typically, there are five types of EVs in the market in recent years, namely hybrid EV, battery-powered EV, plug-in hybrid EV, photovoltaic EV, and fuel cell EV [10,11]. The hybrid EV, battery-powered EV, plug-in hybrid EV are widely used in modern society, in which only the battery-powered EVs purely rely on rechargeable batteries to run the electric motors. For the battery charging on the battery-powered EVs, three classifications from levels 1 to 3 were developed, in which level-1 chargers are typically for charging at home; level-2 chargers are for charging at workplaces and public charging stations; level-3 chargers are dedicated charging stations by EV companies. Instead of considering the environmental incentives from EVs, industrial sustainability should be further considered, in which a profitable business model is required for the industry to sustain the development of EVs [12]. To classify the EVs, nine scenarios, namely type of power supply, technology, power, accessibility, payment, information flow, identification, roaming, and contents of charging service, are considered for managing EVs in society. However, the current EV business model is facing critical challenges related to charging infrastructures and battery management, which hinder the sustainable development of the EV industry. Bosshard and Kolar [13] presented technological barriers on further wide-spreading EV adoption, where the limited driving range and long battery charging time still exist in the market. Innovative solutions for battery charging are encouraged to mitigate the above existing challenges to boost the EV acceptance and the development of electric mobility. Also, Hannan et al. [14] summarized seven challenges in the current EV industry, (i) cell unbalancing, (ii) battery modelling, (iii) ageing, (iv) degradation, (v) monitoring battery health, (vi) estimation of maximum capacity, and (vii) communication method, which should be addressed in future research and development. Because of the number of challenges in the EV industry, some research focused on considering the development of battery packs for EVs, instead of charging EVs at a fixed station [15,16].
Therefore, one of the innovative solutions, i.e., PEVBPS, has been introduced to draw significant attention from the public and industry. The use of PEVBPS can mitigate the challenge of long charging times at the fixed stations, in which a self-service for battery insertion and removal is now made. The PEVBPS provides a standardized battery pack for various types of vehicles, such as private cars and trucks, and the time to be fully charged depends on the battery switching process. In addition to the efficient charging process, the most significant benefit from the PEVBPS is to share the risk and responsibility of battery repair and maintenance with the centralized service providers. Therefore, end users can drive their EVs in a safe and reliable condition. In Taiwan, a ridesharing platform has been launched by Gogoro, Yamaha, Aeon Motor, and PGO, where all scooters can exchange batteries in the battery switching stations [17]. Such a deployment can be further extended to other types of vehicles in the market to achieve better sustainability development. To launch the PEVBPS, effective product life cycle management should be formulated to estimate the average demand for battery packs in different periods, which is important for the infrastructure setup, inventory management, and service support.
Product life-cycle management (PLM) is generally referred to the business of managing a company’s products effectively across their life-cycles [18]. Effective PLM can maximize product revenue, the value of product portfolios, and customer values, while product-related costs can be reduced. Particular to new product development, the PLM plays an essential role in providing strategic support for assessing market opportunities, product design, and manufacturing prior to launching in the market. Orcik et al. [19] illustrated five significant stages to represent the generic product life-cycle, namely (i) research and development, (ii) introduction, (iii) growth, (iv) maturity, and (v) decline. A non-linear characteristic was used to express the relationship between sales and time during the above five stages. Subsequently, an overview of the performance of new products can be examined with the structured paradigm. In the EV industry, PLM has also been widely applied to formulate various strategic decision-making methods, which are essential to establish healthy and sustainable development [20]. The environmental burdens can also be assessed from the products, processes, and activities involved in the eco-system. Zwolinski and Tichkiewitch [21] defined a set of critical project life-cycle parameters in considering the environmental view, associated to the energy policy and material usage, contributing to maximizing the sustainability in the whole life-cycle. To further boost sustainability in the EV industry, the launch of the PEVBPS requires an in-depth evaluation of product life-cycle prediction. The adoption of machine learning and artificial intelligence in the PLM is an emerging research area to minimize obsolescence risk and prediction inconsistency [22]. Apart from the historical sales data, additional data related to technical characteristics and processes can be integrated to generate a ballpark estimate of the PLM.
With artificial intelligence (AI), industrial forecasting problems can be addressed adequately, where the artificial neural network (ANN) and the support vector machine (SVM) are well-known for handling non-linear forecasting problems [23,24]. Although ANN requires considerable training time and resources to build the neural network, the flexibility and adaptability in implementing ANN are relatively high in the various application domains. The principles of ANN and SVM are based on the empirical risk minimization and structural risk minimization, respectively. In [25], the ANN approach was adopted to simulate time-series demand forecasting in supply chain management, where only historical sales were considered. Also, ANN was applied to forecast electricity demand, which demonstrated the feasibility of the ANN in addressing the forecasting problems [26]. However, the typical ANN models cannot handle subjective and uncertain datasets during the decision-making process, and therefore the adaptive neuro-fuzzy inference system (ANFIS) was developed to integrate ANN and the Takagi–Sugeno fuzzy inference system as a whole [27,28]. By combining learning capability and relational structure, the practicality of ANFIS outperforms the typical ANN approach in solving many real-life problems. In addition, hybridization of the optimization method and ANFIS becomes an emerging trend in current research studies to determine the most appropriate architecture and input variables for problem domains. Jadidi et al. [29] integrated the non-dominated sorting genetic algorithm II (NSGA-II) and ANFIS to achieve the short-term electric power demand forecasting. Among several optimization methods, including particle swarm optimization, ant colony optimization, differential evolution, and imperialistic competitive algorithm, the combination of NSGA-II and ANFIS provided the most accurate forecasting results. Apart from optimization methods, design of experiment (DoE) techniques, such as the Taguchi method, are also able to optimize the quality characteristics by considering the responses from various experimental studies [30]. To further extend the capability of the Taguchi method, a multi-response Taguchi method was proposed to combine various responses for different objectives [31]. However, the research using DoE methods and ANFIS is limited, and needs to be investigated to improve the learning efficiency and forecasting accuracy.
After reviewing the above literature, it is summarized that the development of the PEVBPS is the emerging trend in the EV industry for strengthening the sustainability of EVs and the market. For launching the PEVBPS in the market effectively, the corresponding PLM is essential for estimating its time-series demand to support the evaluation of electricity consumption and amount of PEVBPS to be produced. To achieve the above objectives, the ANFIS is found to be promising in product life-cycle prediction, while the MRTM is adopted to guide the formulation of the ANFIS. Therefore, an integrated approach for the product life-cycle prediction for demand and electricity consumption can be established in our study.
3. Design of a Fuzzy-Based Battery Life Cycle Prediction Framework
In this section, the research methodology is presented through the design of the fuzzy-based battery life-cycle prediction framework (FBLPF), which consists of three main tiers, namely (i) data collection, (ii) an MRTM-guided ANFIS approach, and (iii) PLM for the PEVBPS. Figure 2 shows the modular framework of the FBLPF to illustrate the interactions among the three tiers to support the PLM and decision-making process for the PEVBPS.
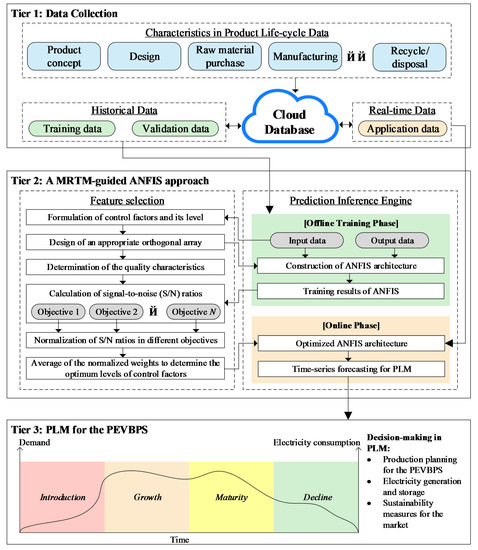
Figure 2.
The modular framework of the fuzzy-based battery life-cycle prediction framework (FBLPF). MRTM denotes multi-response Taguchi method; ANFIS denotes adaptive neuro-fuzzy inference system; PLM denote product lifecycle management.
3.1. Tier 1: Data Collection
This tier describes the selection and collection of data as the input in the MRTM-guided ANFIS approach to estimate the time-series demand and electricity consumption effectively. In regard to the PLM, Tao et al. [32] summarized the product life-cycle data in nine aspects, i.e., product concept, design, raw material purchase, manufacturing, transportation, sales, utilization, after-sale services, and recycling/disposal, which were extended from the basic product life-cycle model to be engineering-oriented. Among the stages of introduction, growth, maturity, and decline, the engineering activities can be specified such that various data can be collected during the entire product life-cycle in terms of the nine defined aspects. Since the PEVBPS is still at a preliminary development stage, merely the data in the product concept needs to be considered to construct the model, and the proposed framework can be further extended in the future to incorporate additional features of the product life-cycle. Therefore, a set of product life-cycle data D = {d1, d2, …, dt} can be formulated where t refers to maximum number of product life-cycle data, for example, historical demand, investment planning, and customer satisfaction, which may affect the prediction of future demand and electricity consumption. All the collected data are then centralized in the cloud database for effective evaluation and analytics. Among set D, the data are separated into input and output datasets; namely, I = [i1, i2, …, in] ⊂ D and O = [o1, o2, …, om] ⊂ D, where n and m refer to the maximum numbers of input and output. Regarding the input, the relevant parameters to achieve the battery life-cycle prediction are considered with the defined time interval. The output in this study is to focus on time-series demand and electricity consumption for the PEVBPS. From the cloud database, the historical dataset, which is used to train the ANFIS engine is partitioned into two sub-sets, namely training data and validation data. The training data is applied to facilitate the training process of the prediction engine, while the validation data is used to measure the errors between the observed and predicted values. On the other hand, the real-time data are used to predict the battery life-cycle through considering the application dataset through the novel MRTM-guided ANFIS approach.
3.2. Tier 2: A MRTM-Guided ANFIS Approach
Since the previous tier has defined the set of input and output parameters for the battery life-cycle prediction, the input variables and system settings are selected in this tier to construct an optimal ANFIS approach for the prediction purpose, as shown in Figure 3. Regardless of the input attributes, three control parameters are considered in this approach, namely (i) selection of input variables, (ii) type of membership functions, and (iii) epoch number for training. According to the independent variables X = [x1, x2, …, xp] set in the above three categories, the orthogonal array can be formulated for multiple factors X at two levels, where p refers to the maximum number of independent variables. The minimum number of experiments Nmin can be measured as in Equation (1), where Li refers to the specific factor level of each independent variable. Together with the balancing property of the orthogonal array, the specific size of the orthogonal array N can be selected accordingly.
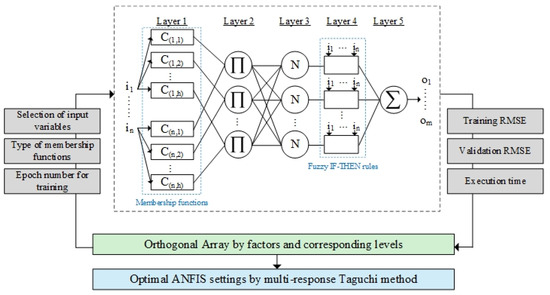
Figure 3.
Architecture of the MRTM-guided ANFIS.
For the selection of input variables, a binary number, i.e., 0 or 1, is set to each input variable randomly to construct its 2-level factor. Moreover, the number of membership functions (e.g., 2 and 4) and membership function types (e.g., triangular and trapezoid types) are designed to be 2-level factors. Subsequently, experimental studies following the orthogonal array can be conducted to examine the responses rj of (i) execution time and (ii) root mean squared errors for prediction, in which the entire experimental studies take place in the offline training phase of ANFIS. To express the structure of the ANFIS, there are five layers to illustrate the computations of model training, as shown in Figure 3. Layer 1 refers to the corresponding fuzzy class C(n,h), called the linguistic label, of the input variable I, where n is the maximum number of input variables and h is the maximum number of fuzzy classes for the specific input variable. Subsequently, the membership function Mk of the input variable I = {ik} can be defined, as in Equation (2). The value of the membership functions ranges between 0 and 1 with the specific membership shapes, such as triangular and trapezoid types.
In layer 2, the incoming signals from layer 1 are combined through multiplying the membership values to compute the firing strength of a rule wj, as in Equation (3). Subsequently, the firing strength of a fuzzy IF-THEN rule is then normalized by calculating the ratio between all the potential rules in layer 3, as in Equation (4). Therefore, the output of this layer is called the normalized firing strength.
In layer 4, a square node is considered with the node function as in Equation (5). The normalized firing strength is then multiplied with the output parameters of the ANFIS, where x0 is equal to 1. To compute the overall output of the ANFIS, the summation of all incoming signals from layer 4 is conducted, as in Equation (6). Overall, the training data is used to train the architecture of the ANFIS according to the above steps so that the total training time Ttraining can be measured. Also, making use of the validation data can, therefore, allow evaluation of the root mean squared error ε of the trained ANFIS.
Subsequently, the responses of experimental studies following the defined orthogonal array can be analyzed through the computation of the corresponding signal-to-noise ratios. When considering minimizing the training time and errors of the ANFIS approach, the quality characteristic “smaller-the-better” is applied to calculate the signal-to-noise ratio (η) as in Equation (7). To optimize the above two objectives, weight assignment and normalization are adopted in this paper for effectively aggregating the responses as a whole. Since the analyses of the responses are independently conducted, a min–max normalization is applied to the signal-to-noise ratios for every control parameter in order to generate a normalized weight ωijk, as in Equation (8), where i, j and k denote the factors, factor levels, and responses for the MRTM. Compared with other normalization techniques, such as z-score normalization, min-max normalization is found to be effective in confining different scales and ensuring that all features are on a common scale for further comparison and combination. Afterwards, the normalized weights from different responses are then combined as a whole, while the combination weight αk is applied such that the resultant weight ωij* = α1ωij1 + α2ωij2 + … + αkωijk. The best feature for the ANFIS in terms of input variables, number of membership functions and membership function types can be selected. Consequently, the MRTM guides the development of the ANFIS approach for achieving the PLM for the PEVBPS.
3.3. Tier 3: PLM for the PEVBPS
Based on the above MRTM-guided ANFIS approach, the application data can be inputted to formulate the prediction of the battery life-cycle in the aspects of time-series demand and time-series electricity consumption. Also, the above prediction results are utilized for the PLM according to the stages of introduction, growth, maturity, and decline [23]. With the predicted findings of demand and electricity consumption over time, decision-making support for the development of the PEVBPS can be achieved. First, the production planning for the PEVBPS modules can be estimated according to the forecasted demand so that any unnecessary waste during the production and inventory obsolescence can be eliminated. Second, the predicted electricity consumption supports the business negotiations with the electricity plant for facilitating the entire business model, which ensures that the electricity grid can adequately support the battery charging activities. Thirdly, instead of managing the EV battery issues by end-users themselves, the development of the PEVBPS boosts the sustainability development in the EV market through managing all the EV batteries in a centralized manner. Therefore, the appropriate PLM strategies can be formulated in this tier to support the development of the PEVBPS.
4. Case Study
To examine the feasibility of the proposed model in the EV industry, a pilot study was conducted to predict the product life-cycle of the PEVBPS in the market. A case company in Hong Kong who are operating the EV business and are eager to develop the PEVBPS in the market was selected, having the vision of being a leader in the EV market in providing sustainable measures for EV battery management. To introduce the PEVBPS in the market effectively, accurate PLM is crucial to determine the consumption of raw materials, production planning, as well as the electricity supply to fulfil customer demand. Without effective PLM for the PEVBPS, the supply chain for the new EV business model might be easily broken. In this section, implementation of the proposed model, i.e., FBLPF, is presented to predict the customer demand and electricity consumption along the entire battery life-cycle in the market.
4.1. Motivation of the Case Study
In the automotive industry, plug-in electric vehicles (PEVs) are the most common EV types in modern society, and has become an active research topic recently. Although the use of PEV tends to be more sustainable and environmentally-friendly than traditional vehicles using combustion engines, the current charging practice for the PEV is still facing several drawbacks in the market. First, the popularization of EVs solely relies on the amount of charging infrastructure in urban areas. In contrast, the installation of charging infrastructure is relatively difficult once the facilities have already been built. The arrangement of the power supply may need to be re-located to specific regions in the facilities. Second, for the PEVs, the batteries are pre-installed and fixed inside the vehicles, and are not removed by the end-users. Due to the phenomenon of battery depreciation and deterioration of PEVs, the batteries, which are the core power source of the vehicles, have to be repaired and maintained on a regular basis, and it is relatively expensive for end-users to maintain PEV batteries in good condition. Therefore, sales in the first-hand market and re-sales in the second-hand market are not competitive. Consequently, the development of the PEVBPS has started in recent years to enhance battery management and sustainability for the PEV. To launch a new product in the market, market analysis is crucial to understand the market niches. At the same time, the entire PLM needs to be established to support the control and monitoring of the business model. However, an effective model regarding the PLM of the PEVBPS is lacking, and has become the main barrier for EV companies to invest in the PEVBPS. Overall, the motivation for the case study can be summarized as follows:
- Selection of the most relevant factors for the development of the PEVBPS
- Establishment of the effective battery life-cycle prediction approach
4.2. Implementation of the FBLPF
To address the above industrial concerns in the EV industry, the proposed model, i.e., FBLPF, is implemented for the launch of PEVBPS in the market, while its PLM can be measured to support the business development. The implementation of the proposed model in the case company consists of five steps, namely (i) variable selection, (ii) formulation of the orthogonal array, (iii) experimental studies and analysis by the MRTM, (iv) formulation of the optimal ANFIS, and (v) establishment of the battery life-cycle management. The overall implementation roadmap is presented in Figure 4, which consists of the above five steps with the corresponding outputs. On the one hand, the evaluation by using MRTM is conducted in the Minitab 19 environment, where “Taguchi” under DOE is adopted to execute the single-objective Taguchi method. The results from the Minitab 19 are then aggregated to obtain the optimal parameter settings for the ANFIS formulation. On the other hand, the neuro-fuzzy designer and a set of functions, for example, anfis() and genfis(), in the MATLAB environment are used to build the Sugeno-type fuzzy inference system between the selected inputs and outputs. Therefore, the MRTM-guided ANFIS can be realized in the case study to obtain the optimal ANFIS design for forecasting time-series demand and electricity consumption.
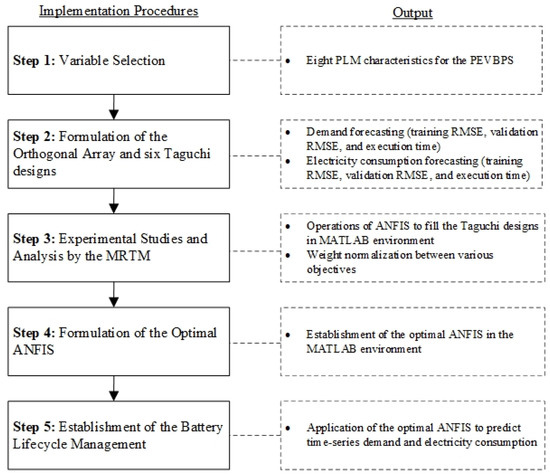
Figure 4.
Implementation roadmap of the fuzzy-based battery life-cycle prediction framework (FBLPF).
Moreover, the forecasting horizon was between 24th April, 2019 (epoch time: 1,556,064,000) and 9th April, 2020 (epoch time: 1,586,390,400), in which the data collection was collected once a week. Afterwards, the datasets were deployed in the MRTM-guided ANFIS so as to formulate the optimal design of the ANFIS, where the details of the method are given in Section 3.2. By making use of the MRTM, the features of input variables and parameter settings can be selected in a systematic manner, and therefore the optimal feature settings can be obtained for building the appropriate ANFIS.
4.2.1. Step 1: Variable Selection
First and the foremost, the product life-cycle data that may affect the demand and electricity consumption for the PEVBPS in the industry are considered at this product design stage. To be applied in the MRTM-guided ANFIS, there are eight input parameters and two output parameters that affect the PLM of the PEVBPS. The eight input parameters which can be changed along the time are expressed as follows.
- (i)
- Time sequence (V1, in hours): It refers to the timestamp for collecting the product life-cycle data for the PEVBPS project, while the time is measured in the Unix epoch time in hours. Therefore, the date can be standardized in the computation process throughout the entire dataset.
- (ii)
- Fuel price (V2, in HK$/Liter): It refers to the fuel price of gasoline for the use of traditional vehicles with combustion engines. The fuel price is one of the significant considerations that influence drivers’ behavior and EV market size.
- (iii)
- Electricity price (V3, in HK$/kWh): Similar to the fuel price, the electricity price is a core concern for EV users in continuously adopting EVs. If the electricity price is too high such that the cost-performance ratio for using EVs cannot be justified, the EV users may be switched to another type of vehicle.
- (iv)
- Project investment (V4, in HK$): It refers to the extent of company investment on the development of the PEVBPS. The investment planning influences the growth and sustainability of the product life-cycle in the market. Therefore, the amount of the project investment planning should be taken into consideration for the PLM.
- (v)
- Market size (V5, in unit): To introduce the new product, i.e., PEVBPS, in the EV industry, the number of existing EV users is an essential indicator to examine the market size and potential users for the PEVBPS. Thus, the number of regional EV users is used to quantify market size.
- (vi)
- Market competition (V6, in unit): Peer competition in the EV industry has to be considered in the PLM, while the launch of a new product may have to compete with peers in the market. Consequently, the number of EV companies who are actively engaging the development of the PEVBPS should be considered.
- (vii)
- Customer satisfaction (V7, in a rating of 0–100): It refers to the feedback from EV users, defined as customer satisfaction. The satisfaction level of the EV users to the current products and services of EVs can be reflected, which can determine the success of the PEVBPS.
- (viii)
- Policy support and subsidies (V8, in HK$): The incentives from the government to boost EV development is important to the EV industry. The extent of the policy support and subsidies can influence the adoption rates of new products in the EV market.
On the other hand, the two output parameters in this study are (i) demand of the PEVBPS (in units) and (ii) electricity consumption (in kWh). In this case study, the datasets were collected from the PEVBPS business and existing EV market to construct the battery life-cycle management. When the development of the PEVBPS goes into another stage of the PLM, additional input parameters are considered in the proposed model. Nevertheless, effective measures in selecting the most relevant parameters in the forecasting are lacking. Considering all the parameters in the forecasting approach may lead to energy- and cost-ineffectiveness in training the forecasting engine. At the same time, the training time and prediction errors cannot be optimized. Therefore, deployment of the proposed MRTM-guided ANFIS is illustrated in the following steps of the case study to verify the performance and feasibility in the battery life-cycle prediction.
4.2.2. Step 2: Formulation of the Orthogonal Array
To conduct the experimental studies for the eight input parameters, the factors and the corresponding levels are formulated in Table 1. For the input parameters, their factor levels are binary as 0 or 1, which denotes not preferable and preferable in the forecasting engine, respectively. Also, the process parameters, namely type of membership functions (Fm) and number of epoch numbers (Ne) for the parameters, are considered. For the factor Fm, triangular and trapezoid shapes, namely ‘trimf’ and ‘trapmf’, are considered, while the value Ne can be either 100 or 1000 for engine training in the ANFIS. It aims at optimizing the time and error for the forecasting of demand and electricity consumption, while the best combination of the ten factors is selected.

Table 1.
Factors and factor levels for the MRTM.
When applying Equation (1), the minimum number of experiments to be conducted is 11, and therefore the orthogonal design (L12) is selected by considering the balancing property. Due to the balancing property, the total number of experiments to be conducted are multiples of 2. Hence, the orthogonal design (L12) is deemed to be appropriate in the factor optimization. Instead of conducting the experiments for all combinations, i.e., 210 = 1024, only 12 experiments are conducted in the MRTM, which are relatively effective and efficient to optimize the selection of the input variables and characteristics of membership functions. Table 2 shows the orthogonal array (L12) regarding the experimental studies for examining the best combination of the factors in the PLM. After the experiments following the orthogonal array are conducted, the responses in training time and root mean squared errors (RMSE) for the forecasting can be collected. When the value of the input parameters is 0, the corresponding parameters opt out in the training and validation of the ANFIS. In the future, additional process parameters can be considered in the proposed MRTM method to build the optimal ANFIS for real-life applications.
Table 2.
Orthogonal array (L12) for the feature selection.
4.2.3. Step 3: Experimental Studies and Analysis by the MRTM
According to the above orthogonal array, the experimental studies to formulate the accurate and time-efficient ANFIS approach are conducted for the estimations of demand and electricity consumption. In this study, the size of the dataset is 40 in which each data row contains the input (V1 to V8) and output (demand and electricity consumption). Thirty out of forty datasets (i.e., 75%) are used to train the ANFIS, while the rest (25%) are adopted to validate the performance of the trained ANFIS approach. Also, the number of membership functions is fixed at 2, and the grid partition is selected for building the fuzzy inference engine. Considering either demand or electricity consumption, the ANFIS can be trained to measure (i) training time, (ii) RMSE for training, and (iii) RMSE for validation, as shown in Table 3. These experimental studies attempt to minimize the above three response measurements at the same time, and the best combination of input variables and process parameters can be formulated in return.
Table 3.
Response measurement to the orthogonal array.
For demand forecasting, the corresponding signal-to-noise ratios in the three responses can be measured concerning defined factors following the quality characteristic of “smaller-the-better”, as shown in Figure 5. The signal-to-noise ratios can then be normalized and combined as a whole, in which the combination weights for the (i) training time, (ii) RMSE for training, and (iii) RMSE for validation are expressed as α1 = 0.05, α2 = 0.45, α3 = 0.5, respectively. Table 4 summarizes the computational results on the normalization and aggregation process, and thus the resultant weights for 10 factors can be obtained.
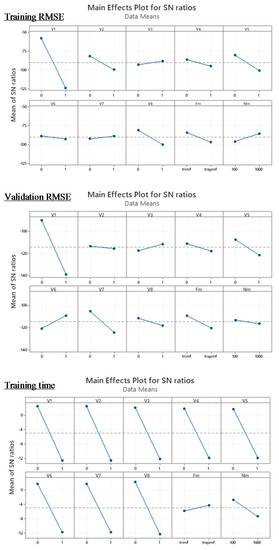
Figure 5.
Main effect plots for signal-to-noise ratios in demand forecasting.
Table 4.
Weight normalization and combination for demand forecasting.
According to Table 4, the variables 3 and 6, i.e., V3 and V6, are selected in the demand forecasting; the type of membership function is trapezoidal; the number of epoch number is 100. Consequently, the optimal ANFIS approach is formulated to estimate the demand in the market, in which small values in training time, training RMSE, and validation RMSE are preferred.
Similarly, for electricity consumption forecasting, the signal-to-noise ratios are calculated with the quality characteristic of “smaller-the-better”, and the same set of combination weights for the three responses are adopted. Figure 6 shows the main effect plots on the signal-to-noise ratios of the three measurement dimensions for the electricity consumption forecasting. Also, Table 5 summarizes the results of normalization and aggregation, and therefore the best combination of factors is obtained to build the ANFIS approach for electricity consumption forecasting. Consequently, the variables 3 and 6, i.e., V3 and V6, are selected in the electricity consumption forecasting; the type of membership functions should be trapezoidal; the number of epoch numbers is 1000. Following the results from the MRTM, the optimal ANFIS can be formulated for demand and electricity forecasting in the PLM.
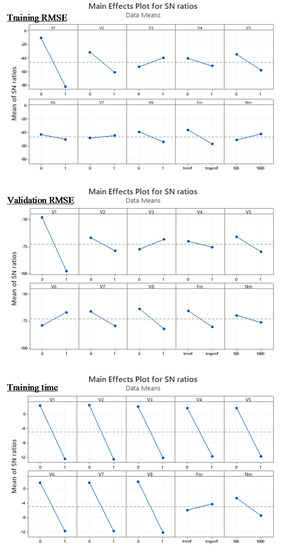
Figure 6.
Main effect plots for signal-to-noise ratios in electricity consumption forecasting.
Table 5.
Weight normalization and combination for electricity consumption forecasting.
4.2.4. Step 4: Formulation of the Optimal ANFIS
Based on the above resultant factor combination, the optimal ANFIS engines can be established for demand forecasting and electricity consumption forecasting. From the results of the MRTM, the electricity price and market competition are selected as the core variables for the forecasting of demand and electricity consumption. By using the same dataset (i.e., 75% for training and 25% for validation), the ANFIS for demand forecasting can be established in 0.1576 s with the minimal training RMSE of 4295.1883 and the minimal validation RMSE of 11195.9 at the epoch 100, as shown in Figure 7. Subsequently, Figure 8 show optimal membership functions for the ANFIS to forecasting time-series demand of the PEVBPS.
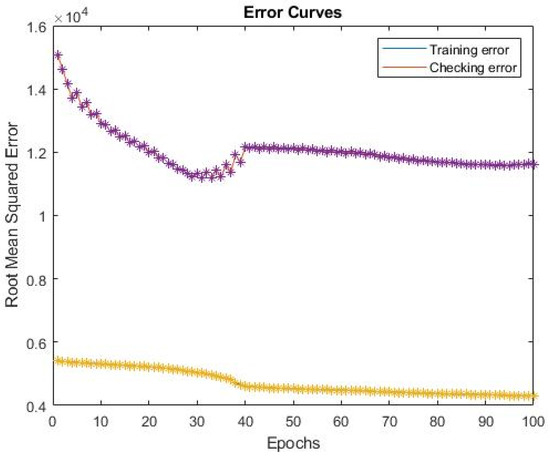
Figure 7.
Error measurement for training and validation for demand forecasting.
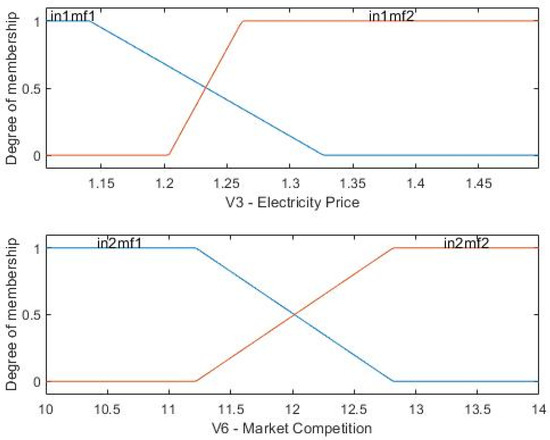
Figure 8.
Optimal membership functions of the ANFIS for demand forecasting.
Similarly, the ANFIS for electricity consumption forecasting can be built in 0.2310 s with the minimal training RMSE of 52.4142 and the minimal validation RMSE of 152.085 at the epoch 1000, as shown in Figure 9. Figure 10 shows the optimal membership functions for the ANFIS for the electricity consumption forecasting. Therefore, the Sugeno-type fuzzy inference system can be established to manage the PLM of the PEVBPS in the aspects of time-series demand and electricity consumption.
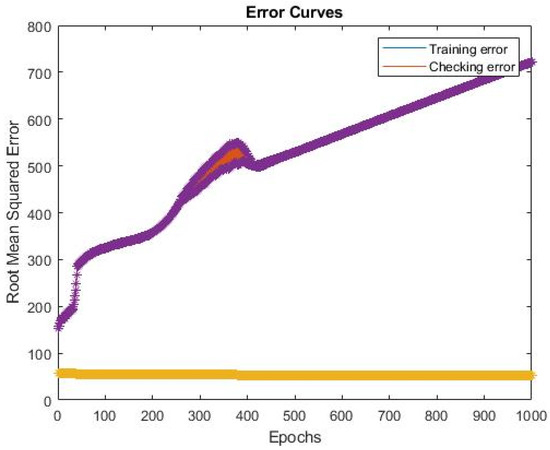
Figure 9.
Error measurement for training and validation for electricity consumption forecasting.
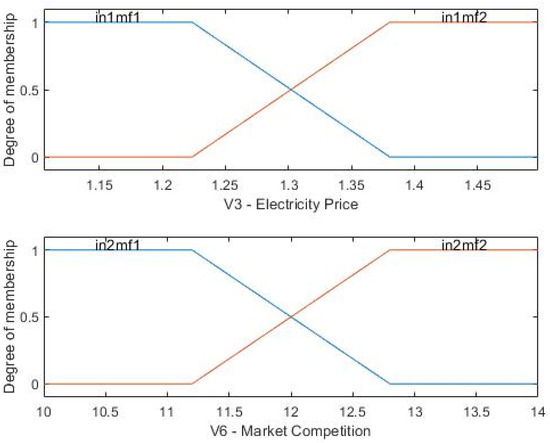
Figure 10.
Optimal membership functions of the ANFIS for electricity consumption forecasting.
4.2.5. Step 5: Establishment of the Battery Life-Cycle Management
With the use of the above optimal ANFIS designs, the battery life-cycle management can be formulated to estimate the future demand and electricity consumption of the PEVBPS. Instead of using the dataset for training and validation, another dataset with 20 data rows is considered to examine the forecasting performance. Figure 11 shows the battery life-cycle management of the PEVBPS in terms of demand and electricity consumption. On the one hand, the optimal ANFIS engines estimate the values of demand and electricity consumption along with the selected time duration, which reflects the accuracy of the proposed MRTM-guided ANFIS approach in the forecasting functionality. On the other hand, the proposed approach enables prediction of the future demand and electricity consumption. Therefore, the EV companies can formulate appropriate business plans and energy policies according to the predicted battery life-cycle of the PEVBPS.
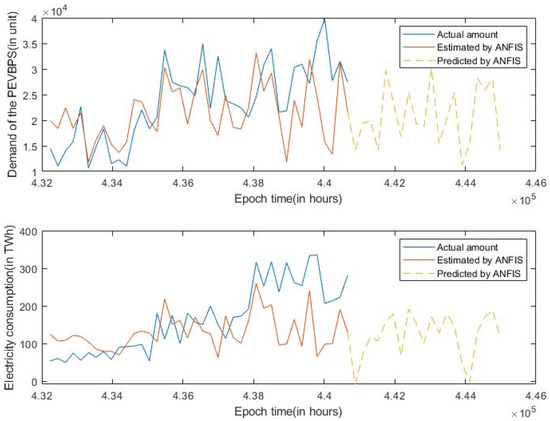
Figure 11.
Battery life-cycle management for the plug-in electric vehicle battery pack standardization (PEVBPS).
5. Results and Discussion
After the case study was conducted, the feasibility of the proposed framework has been verified such that the EV companies can adapt it to facilitate its new product development, particularly for the PEVBPS. To further examine the performance of the proposed framework, a comparative analysis between the MRTM-guided ANFIS, moving average and single exponential smoothing is conducted in this section. Also, the industrial and managerial implications for the proposed framework are illustrated to highlight the advantages of this study in the EV industry.
5.1. Comparative Analysis with the MRTM-Guided ANFIS
From the above analysis, it is revealed that a large number of input variables and epoch numbers cannot guarantee high forecasting accuracy for demand and electricity consumption. Referring to Table 3, considering all the input variables in the ANFIS makes a long training time compared with other settings, while the RMSEs for training and validation are relatively large. Therefore, the value of the feature selection in the ANFIS can be proven. Also, to highlight the effectiveness of the MRTM-guided ANFIS in the forecasting accuracy, another two forecasting techniques, i.e., moving average and single exponential smoothing, are considered. Table 6 summarizes the results of the comparative analysis in the aspects of mean squared error (MSE), mean relative error (MRE), and mean absolute error (MAE). It is found that the MRTM-guided ANFIS consistently provides better forecasting accuracy for the trial datasets, collected from the case company. Although the MSE value in predicting energy consumption by using the moving average is slightly lower than the adoption of the proposed framework, its MRE value is relatively higher than the proposed framework and the slight difference in MAR values can be neglected. Overall, the proposed method, namely MRTM-guided ANFIS, is generally better than the other existing prediction methods in the aspect of demand forecasting and electricity consumption prediction. Therefore, the proposed MRTM-guided ANFIS outperforms the existing forecasting methods, such that accurate forecasting results can be obtained. Eventually, the time-series demand and electricity consumption can be predicted effectively to support the battery life-cycle management.
Table 6.
Comparative analysis between MRTM-guided ANFIS and time-series forecasting methods.
Apart from the quantitative comparison for the proposed model, a qualitative comparison between this research work and other existing studies [23,33] is conducted, as shown in Table 7. This comparison consists of six aspects: objectives, methods, techniques, forecasting area, considered factors, and fuzziness.
Table 7.
Qualitative comparison of the FBLPF.
To the best of our knowledge, this study is the first attempt to utilize the DoE technique, namely the multi-response Taguchi method, to obtain the optimal design of ANFIS in order to address the forecasting issues in the product life-cycle management for the PEVBPS. Some similar studies attempted to adopt machine learning, data mining, and typical time-series forecasting methods to achieve their objectives in the PLM, while the selected products were not related to the EVs’ batteries such that this research study can enrich the new product development in the EV industry. In our study, the DoE-guided machine learning approach provides optimality in the design of machine learning techniques so that the establishment of the machine learning engine can be more effective and efficient. Apart from predicting the sales profile of new products, the electricity consumption can also be estimated to sustain the entire business of PEVBPS. In addition, the proposed framework considers the fuzziness of the considered factors, which can handle the uncertainties and vagueness for the variables in the real-life market situation. To summarize, this research study can boost sustainable development in the EV industry by minimizing the faults and failures in the new product development (NPD) process, particularly for the PEVBPS.
5.2. Sensitivity Analysis of the MRTM-Guided ANFIS
In order to examine the effectiveness of the proposed method, namely MRTM-guided ANFIS, a sensitivity analysis is conducted to evaluate the difference before and after embedding MRTM in the ANFIS. By doing so, the MRTM-guided ANFIS is compared with four scenarios, which consider all the defined input variables, but the type of membership functions and the number of epochs are different. Therefore, the training time and prediction accuracy regarding demand and electricity consumption are evaluated for (i) using MRTM-guided ANFIS (i.e., only V3 and V6 are considered in the ANFIS), (ii) ANFIS with using trimf and 100 epochs, (iii) ANFIS with using trimf and 1000 epochs, (iv) ANFIS with using trapmf and 100 epochs, and (v) ANFIS with using trapmf and 1000 epochs, as shown in Table 8. It is found that the proposed MRTM-guided AFNIS outperforms all other scenarios, which implies that considering all the relevant factors regarding PLM in the forecasting engine cannot guarantee high forecasting accuracy and computational efficiency. It is proven that the MRTM is well-functioning in selecting the optimal settings for the variable features and ANFIS parameters, such that the optimal ANFIS can be established for forecasting time-series demand and electricity consumption in the case study. When using the proposed MRTM-guided ANFIS, the training and validation errors can be minimized among all other scenarios, while the training times for forecasting time-series demand and electricity consumption are also the lowest.
Table 8.
Result summary of the sensitivity analysis in the MRTM-guided ANFIS.
5.3. Industrial and Managerial Implications
With the help of the FBLPF, it is found that the life-cycle prediction for the PEVBPS in terms of time-series demand and electricity consumption can be effectively established. To the EV companies, NPD is of the utmost importance in attracting the attention of the general public, and maintaining its competitive edge in the market. Risks of NPD failures, inventory obsolescence, and energy wastage should be mitigated when launching new products in the evolution of the EV industry. As the introduction of the PEVBPS is relatively new to the market, the obstacles to develop the hardware and service support in the market still exist even though there are several advantages in charging efficiency and battery management. This study provides the PLM for the PEVBPS not only in the aspect of demand but also electricity consumption. Industrial practitioners and staff at the management level can facilitate the execution of the business model and planning in the market, while the market trends and energy consumption can be estimated accurately.
Apart from the industrial contributions, the proposed model aligns with the paradigm of eco-innovation. The three core modules in the FBLPF can be extended or modified following the future development of the forecasting engine and product life-cycle data. On the one hand, additional product life-cycle data, rather than the eight input parameters, for various stages in PLM can be considered to enrich the data collection (Tier 1) of the proposed model. Subsequently, the proposed model can be more comprehensive and evolving concerning the business environment and systems. The MRTM-guided ANFIS is proposed as the core forecasting method for the PLM in this study. Although the improvements on the method (Tier 2) can be deployed in a flexible and resilient manner, only if the product life-cycle data can be analyzed in order to predict the key indicators, namely demand and energy consumption, for the PEVBPS. Overall, the adaptability of the proposed model ensures providing decision-making functionalities for the establishment of business planning and energy policies for the EV industry.
6. Concluding Remarks
This study addresses the uncertain decision-making method in the aspect of PLM for sustainable development, particularly in regard to the introduction of the PEVBPS in the EV industry. The development of the PEVBPS is regarded as one of the sustainable development measures for EVs, such that the infrastructure challenges for battery charging, charging efficiency, and battery management can be eliminated. Subsequently, the eco-system of the EV industry can be elevated into energy- and customer-oriented EV support. To introduce the PEVBPS in the market, the FBLPF is presented, combining MRTM and ANFIS as a whole to estimate the time-series demand and electricity consumption. The results on the PLM can facilitate improvements in the business planning and energy policies in the EV industry so as to mitigate the risks in introducing such a new product related to EVs in the market. The design of the proposed model follows the ontology of the eco-innovation such that the proposed model can be further modified within the defined scope and objectives with minimal wastage of materials and human resources. In this study, consideration of the product life-cycle data is limited to the product design stage, which can be further extended in future studies. Also, the MRTM can be further improved to summarize the normalized weights from various responses in order to make accurate decisions on feature selection for the forecasting engine, in which additional datasets can be considered to improve the forecasting accuracy. Overall, the sustainable development of fuzzy decision-making methods in the EV industry can be boosted through this study.
Author Contributions
Conceptualization, W.C.W.; methodology, W.C.W. and Y.P.T.; validation, W.C.W. and K.L.C.; resources, G.Q.H. and Y.H.K.; data curation, W.C.W.; investigation, Y.P.T. and C.H.W.; writing—original draft preparation, W.C.W. and Y.P.T.; writing—review and editing, C.H.W.; supervision, G.Q.H. and Y.H.K.; project administration, G.Q.H. and Y.H.K.; funding acquisition, C.H.W. and K.L.C. All authors have read and agreed to the published version of the manuscript.
Funding
This research received no external funding.
Acknowledgments
The authors would like to thank the University of Hong Kong and the Hong Kong Polytechnic University for supporting the research. Gratitude is extended to Big Data Intelligence Centre of The Hang Seng University of Hong Kong for supporting the research.
Conflicts of Interest
The authors declare no conflict of interest.
Nomenclature
| Acronym | Full Name |
| EV | Electric Vehicle |
| PEVBPS | Plug-In Electric Vehicle Battery Pack Standardization |
| ANFIS | Adaptive Neuro-Fuzzy Inference System |
| AI | Artificial Intelligence |
| DoE | Design of Experiment |
| FBLPF | Fuzzy-Based Battery Life-Cycle Prediction Framework |
| MAE | Mean Absolute Error |
| MRE | Mean Relative Error |
| MSE | Mean Squared Error |
| MRTM | Multi-Responses Taguchi Method |
| NPD | New Product Development |
| PEV | Plug-In Electric Vehicles |
| PLM | Product Life-Cycle Management |
| RF | Random Forest |
| RMSE | Root Mean Square Error |
| SVM | Support Vector Machine |
References
- Rezvani, Z.; Jansson, J.; Bengtsson, M. Consumer motivations for sustainable consumption: The interaction of gain, normative and hedonic motivations on electric vehicle adoption. Bus. Strategy Environ. 2018, 27, 1272–1283. [Google Scholar] [CrossRef]
- Borén, S.; Nurhadi, L.; Ny, H.; Robèrt, K.H.; Broman, G.; Trygg, L. A strategic approach to sustainable transport system development—Part 2: The case of a vision for electric vehicle systems in southeast Sweden. J. Clean. Prod. 2017, 140, 62–71. [Google Scholar] [CrossRef]
- Nilsson, M.; Nykvist, B. Governing the electric vehicle transition—Near term interventions to support a green energy economy. Appl. Energy 2016, 179, 1360–1371. [Google Scholar] [CrossRef]
- Iea. Global EV Outlook 2019—Analysis 2019. Available online: https://www.iea.org/reports/global-ev-outlook-2019 (accessed on 12 May 2020).
- Saw, L.H.; Ye, Y.; Tay, A.A. Integration issues of lithium-ion battery into electric vehicles battery pack. J. Clean. Prod. 2016, 113, 1032–1045. [Google Scholar] [CrossRef]
- Liu, H.; Chen, F.; Tong, Y.; Wang, Z.; Yu, X.; Huang, R. Impacts of Driving Conditions on EV Battery Pack Life Cycle. World Electr. Veh. J. 2020, 11, 17. [Google Scholar] [CrossRef]
- Keçeci, B.; Iç, Y.T.; Eraslan, E. Development of a Spreadsheet DSS for Multi-Response Taguchi Parameter Optimization Problems Using the TOPSIS, VIKOR, and GRA Methods. Int. J. Inf. Technol. Decis. Mak. 2019, 18, 1501–1531. [Google Scholar] [CrossRef]
- Raja, P.; Pahat, B. A review of training methods of ANFIS for applications in business and economics. Int. J. Ser. Sci. Techol. 2016, 9, 165–172. [Google Scholar]
- Abedinia, O.; Lu, M.; Bagheri, M. An improved multicriteria optimization method for solving the electric vehicles planning issue in smart grids via green energy sources. IEEE Access 2019, 8, 3465–3481. [Google Scholar] [CrossRef]
- Roda, V.; Carroquino, J.; Valiño, L.; Lozano, A.; Barreras, F. Remodeling of a commercial plug-in battery electric vehicle to a hybrid configuration with a PEM fuel cell. Int. J. Hydrog. Energy 2018, 43, 16959–16970. [Google Scholar] [CrossRef]
- Barré, A.; Suard, F.; Gérard, M.; Montaru, M.; Riu, D. Statistical analysis for understanding and predicting battery degradations in real-life electric vehicle use. J. Power Sources 2014, 245, 846–856. [Google Scholar] [CrossRef]
- Madina, C.; Zamora, I.; Zabala, E. Methodology for assessing electric vehicle charging infrastructure business models. Energy Policy 2016, 89, 284–293. [Google Scholar] [CrossRef]
- Bosshard, R.; Kolar, J.W. Inductive power transfer for electric vehicle charging: Technical challenges and tradeoffs. IEEE Power Electron. Mag. 2016, 3, 22–30. [Google Scholar] [CrossRef]
- Hannan, M.A.; Lipu, M.H.; Hussain, A.; Mohamed, A. A review of lithium-ion battery state of charge estimation and management system in electric vehicle applications: Challenges and recommendations. Renew. Sustain. Energy Rev. 2017, 78, 834–854. [Google Scholar] [CrossRef]
- Thomas, A.M.; Bhavana, V.; Gopika, S.; Karthika, K.; Salini, M. Advanced Electric Vehicle Charging Station (No. 2934), 2002, EasyChair. Available online: https://easychair.org/publications/preprint_download/1FRd (accessed on 27 May 2020).
- Mohamed, M.; Elleithy, K.M. Electrical Vehicle Battery Change System (EVBCS). 2018. Available online: https://scholarworks.bridgeport.edu/xmlui/handle/123456789/2214 (accessed on 27 May 2020).
- Shu, C. Gogoro Announces Yamaha, Aeon and PGO are the First Manufacturers That will Use Its Swappable Batteries in Their Own Scooters. 2019. Available online: https://techcrunch.com/2019/08/06/gogoro-announces-yamaha-aeon-and-pgo-are-the-first-manufacturers-that-will-use-its-swappable-batteries-in-their-own-scooters/ (accessed on 13 May 2020).
- Stark, J. Product Lifecycle Management (PLM). In Product Life—Cycle Management; Springer: Cham, Switzerland, 2020; Volume 1, pp. 1–33. [Google Scholar]
- Orcik, A.; Tekic, Z.; Anisic, Z. Customer co-creation throughout the product life cycle. Int. J. Ind. Eng. Manag. 2013, 4, 43–49. [Google Scholar]
- Thein, S.; Chang, Y.S. Decision making model for life-cycle assessment of lithium-ion battery for electric vehicle–A case study for smart electric bus project in Korea. J. Power Sources 2014, 249, 142–147. [Google Scholar] [CrossRef]
- Zwolinski, P.; Tichkiewitch, S. An agile model for the eco-design of electric vehicle Li-ion batteries. CIRP Ann. Manuf. Technol. 2019, 68, 161–164. [Google Scholar] [CrossRef]
- Jennings, C.; Wu, D.; Terpenny, J. Forecasting obsolescence risk and product life cycle with machine learning. IEEE Trans. Compon. Packag. Manuf. Technol. 2016, 6, 1428–1439. [Google Scholar] [CrossRef]
- Daut, M.A.M.; Hassan, M.Y.; Abdullah, H.; Rahman, H.A.; Abdullah, M.P.; Hussin, F. Building electrical energy consumption forecasting analysis using conventional and artificial intelligence methods: A review. Renew. Sustain. Energy Rev. 2017, 70, 1108–1118. [Google Scholar] [CrossRef]
- Duan, M.; Darvishan, A.; Mohammaditab, R.; Wakil, K.; Abedinia, O. A novel hybrid prediction model for aggregated loads of buildings by considering the electric vehicles. Sustain. Cities Soc. 2018, 41, 205–219. [Google Scholar] [CrossRef]
- Kochak, A.; Sharma, S. Demand forecasting using neural network for supply chain management. Int. J. Mech. Eng. Robot. Res. 2015, 4, 96–104. [Google Scholar]
- Kandananond, K. Forecasting electricity demand in Thailand with an artificial neural network approach. Energies 2011, 4, 1246–1257. [Google Scholar] [CrossRef]
- Karaboga, D.; Kaya, E. Adaptive network based fuzzy inference system (ANFIS) training approaches: A comprehensive survey. Artif. Intell. Rev. 2019, 52, 2263–2293. [Google Scholar]
- Modestus, O.; Olufemi, A. A comparative study of artificial neural network (ANN) and adaptive neuro-fuzzy inference system (ANFIS) models in distribution system with nondeterministic inputs. Int. J. Eng. Bus. Manag. 2018, 10, 1–17. [Google Scholar]
- Jadidi, A.; Menezes, R.; de Souza, N.; de Castro Lima, A.C. Short—Term Electric Power Demand Forecasting Using NSGA II-ANFIS Model. Energies 2019, 12, 1891. [Google Scholar] [CrossRef]
- Dhawane, S.H.; Kumar, T.; Halder, G. Biodiesel synthesis from Hevea brasiliensis oil employing carbon supported heterogeneous catalyst: Optimization by Taguchi method. Renew. Energy 2016, 89, 506–514. [Google Scholar] [CrossRef]
- Tsang, Y.P.; Choy, K.L.; Wu, C.H.; Ho, G.T.S. Multi-objective mapping method for 3D environmental sensor network deployment. IEEE Commun. Lett. 2019, 23, 1231–1235. [Google Scholar] [CrossRef]
- Tao, F.; Cheng, J.; Qi, Q.; Zhang, M.; Zhang, H.; Sui, F. Digital twin-driven product design, manufacturing and service with big data. Int. J. Adv. Manuf. Technol. 2018, 94, 3563–3576. [Google Scholar] [CrossRef]
- Afifi, A.A. Demand Forecasting of Short Life Cycle Products using Data Mining Techniques. In Proceedings of the IFIP International Conference on Artificial Intelligence Applications and Innovations, Neos Marmaras, Greece, 5–7 June 2020; Springer: Cham, Switzerland, 2020; pp. 151–162. [Google Scholar]
- Li, Z.; He, J.; Lai, X.; Huang, Y.; Zhou, T.; Vatankhah Barenji, A.; Wang, W.M. Evaluation of product recyclability at the product design phase: A time-series forecasting methodology. Int. J. Comput. Integr. Manuf. 2018, 31, 457–468. [Google Scholar] [CrossRef]


© 2020 by the authors. Licensee MDPI, Basel, Switzerland. This article is an open access article distributed under the terms and conditions of the Creative Commons Attribution (CC BY) license (http://creativecommons.org/licenses/by/4.0/).