Article

Preferences for Nuclear Power in Post-Fukushima Japan: Evidence from a Large Nationwide Household Survey

1
Faculty of Economics, Keio University, 2-15-45, Mita Minato-ku, Tokyo 108-8345, Japan
2
Graduate School of Arts and Sciences, University of Tokyo, Tokyo 153-8902, Japan
3
Kiel Institute for the World Economy, 24015 Kiel, Germany
4
Department of Economics, Kiel University, 24098 Kiel, Germany
5
SOEP at DIW Berlin and Freie Universitaet, 10177 Berlin, Germany
*
Author to whom correspondence should be addressed.
Energies 2020, 13(11), 2938; https://doi.org/10.3390/en13112938
Submission received: 6 May 2020 / Revised: 29 May 2020 / Accepted: 3 June 2020 / Published: 8 June 2020
(This article belongs to the Section C: Energy Economics and Policy)

Abstract

:
Utilizing the data of a large nationwide household survey conducted in 2014, we investigate public preferences on nuclear power in Japan after the Fukushima nuclear accident and the role of four sets of factors: (1) household/individual socioeconomic characteristics, (2) psychological status, (3) geographical aspects, and (4) Fukushima accident-related experiences. The preferred energy mix, according to the averaged responses from the survey, includes 0.59 for renewables, 0.29 for fossil fuels, and 0.12 for nuclear—much more skewed towards the renewables than the actual national share of renewables of less than 0.2. Male, older, unmarried, less educated, high-income people, and government party supporters have a preference towards a higher share of nuclear power, except if they live near nuclear power plants. The experience of blackout and aversion to nuclear power during the Great East Japan Earthquake of 2011 lowers the share of nuclear power in the preferred mix.

Graphical Abstract

1. Introduction

On 11 March 2011, the Great East Japan Earthquake was followed by a devastating tsunami, causing a series of accidents at the Fukushima Dai-ichi Nuclear Power Plant. After this disaster, there was a great controversy in Japan and elsewhere about the role of nuclear energy and the future energy mix [1]. For instance, the German Chancellor Angela Merkel reversed her energy policy and announced that all nuclear reactors would be closed by 2022. Subsequently, Switzerland, Belgium, and Taiwan decided to stop nuclear power generation by 2025. In Japan, the public opinion is mixed. Many people are afraid of large safety risks involved in nuclear power generation, and this concern is shared particularly by residents close to nuclear power plants [2]. People are also concerned about a high dependency on imported oil and gas for thermal power generation, and about the (presumed) high costs of renewable energy techniques [1,3,4]. The Liberal Democratic Party (LDP), the center-right governing party, has decided to restart nuclear power plants, although various problems of the Fukushima Daiichi accident have not yet been resolved.
This paper makes two contributions. First, we elicit public preferences in Japan—after the Fukushima accident—for three different fuels in the energy mix: renewables, fossil, and nuclear. The Keio Household Panel Survey (KHPS) and data on regional subsidies for energy development serve as our empirical basis. In particular, we make use of a novel question included in the KHPS’s energy module of the year 2014, which was conducted in January of that year. The question reads as follows: “Suppose you could decide about the fuel mix in Japan. What would the mix look like?”, and respondents reported their preferred shares of fossil, nuclear, and renewable fuels in the fuel mix of electricity generation. We use the responses to describe the optimal fuel mix. Second, we study how preferences vary along four sets of control variables: (a) individual/household characteristics, (b) individuals’ psychological status and social views (political stance and belief), (c) individuals’ past experiences related to the Great East Japan Earthquake of 2011, and (d) regional/geographical factors (locations of nuclear/thermal power plants).
Our study finds two main results. First, the preferred energy mix, according to the averaged responses from the survey, is very different from the actual mix of the Japanese power generation. The preferred mix, according to the average assessment of our respondents, includes 0.59 for renewables, 0.29 for fossil fuels, and 0.12 for nuclear. The actual mix in Japan entails 0.16 for renewables, 0.81 for fossil fuels, and 0.03 for nuclear in 2017 [5] (Agency for Natural Resources and Energy, 2018). Second, the preferred fuel mix varies with the set of control variables. Regarding the individual/household characteristics, we find that male, older, unmarried, less educated, and high-income people have a higher preference for nuclear power than the other social groups. Regarding the psychological status and the political stance, governing party supporters and those who prefer liberty to equality also have a higher preference for nuclear power. Finally, experiences of blackouts and aversion to nuclear power during the Great East Japan Earthquake in 2011 are carried over to people’s current negative feelings toward nuclear power, and those who live near nuclear power plants tend to show strong preferences for renewables over nuclear.

2. Literature Review

A number of studies have investigated public preferences on nuclear/renewable energy. First, public acceptance is determined by characteristics of individuals and their household, such as gender, age, income, and education. According to previous survey studies [6,7,8], male, older, and less educated people tend to have a positive attitude toward nuclear power generation. Furthermore, an individual’s psychological status and social views such as belief, and perspectives on liberty, equality, and trust also matter. Trust [9] and fairness [10] influence acceptance of nuclear power and renewables.
Second, past experiences matter. Nuclear power accidents have a tremendously negative social impact. The regions affected by the Chernobyl accident became largely negative about nuclear power [11], although this might only have been a short-term phenomenon [12].
Third, the geographical distance from nuclear power stations influences public acceptance. Proximity to a nuclear power station negatively influences public acceptance of nuclear power [13,14]. For example, after the Fukushima nuclear power plant accident, land prices close to the nuclear power stations fell substantially [15]. In contrast, when people live far away from a nuclear power station, they have less information about and knowledge of nuclear power and less fear; thus, they are more willing to accommodate nuclear power generation [16]. Meanwhile, regional subsidies from the government to compensate for the disadvantage of living near a nuclear power station would mitigate negative public sentiments and result in their acquiescence. In the case of Japan, local governments hosting nuclear power plants benefit from subsidy programs under the Three Power Source Development Laws [17], which will be discussed below.
Finally, the literature on the not-in-my-backyard (NIMBY) effect is relevant to our paper. The conventional view of NIMBY implies that people may generally be in favor of nuclear power but are opposed to nuclear power plants located in their own area [18]. Although our paper does not directly test the NIMBY effect in the siting of power plants, understanding why people close to nuclear power stations tend to prefer renewables might offer some insights on this question.
To our knowledge, no previous studies simultaneously tested all of the following four aspects, namely individual/household characteristics, people’s psychological status, regional aspects, and past disaster-related experiences. Japan has a centralized administrative system and is homogeneous in terms of institutions, education systems, and general economic situations. However, climate and topology vary across regions, which fosters heterogeneity in culture, lifestyle, and social views. In addition, the Great East Japan Earthquake seriously damaged the coastal areas of East Japan, but the damage was not nationwide. Since many factors would affect public preferences on energy, our paper investigates all four of these factors. Furthermore, most previous studies used simple, one-shot survey questions without collecting detailed information about individual background/characteristics/experience/belief and residential place. By contrast, our interest is to examine various aspects of the individual, household, and region comprehensively. The Keio Household Panel Survey (KHPS) enables us to estimate which of these factors affect people’s energy preferences. The data include individual characteristics (e.g., household location, income, gender, number of family members, financial assets), political stance, attitudes towards risk, behavior, experiences just after the Fukushima earthquake, and noncognitive aspects. The KHPS 2014 includes energy preferences.
Many researchers conducted empirical analyses on public preferences on energy sources worldwide. Most found that people tend to prefer renewable energy [19,20,21,22,23]. After the Fukushima nuclear accident, as some previous studies identified, the public’s view on the reliability of nuclear energy worsened, while it raised the profile of renewable energy, which drew the attention of the world [8,24,25,26,27]. In Japan, public support for and trust in nuclear power have visibly collapsed after the Fukushima accident [28,29]. Thus, renewable energy is considered the most favorable while nuclear energy is the least in Japan [30,31,32,33]. These previous studies mainly focus on the public’s overall energy preferences, and some of them conducted cross-country comparisons. In many studies, spatial variations within a country are not taken into account sufficiently. We note that Rehdanz et al. [34] exceptionally used information on the geographical distance from the Fukushima power plant. Since our household data include the locational information of households and our data on regional subsidies from the national government on electricity generation are at the municipality level, the data allow us to test the effect of location of power plants and regional factors. Our paper studies the factors relating to public preferences on energy sources—in particular, who prefers renewable energy, who accommodates nuclear power, and what factors affect their preference—by taking into account several aspects such as the geographical location of households, regional factors, and individual characteristics.

3. Background: Energy Mix and Energy Policies in Japan

Energy supply has always posed a dilemma for modern Japan. As in many other countries, the Japanese public has been anxious about the safety of nuclear power generation. The general awareness of limited domestic energy sources, however, yielded the majority view that while nuclear power is not desirable, it is necessary, e.g., [35]. Reflecting this public attitude, major opposition parties in Japanese politics that are challengers of the dominant Liberal Democratic Party (LDP) (which promotes nuclear power) did not take a stance of outright rejection of nuclear power, but one of cautious acceptance. The Atomic Energy Basic Law 1955, which determines the principle of use of nuclear technologies for civilian purposes, was proposed by Diet members including those of the Japan Socialist Party, whose offshoots constitute the main opposition parties to the governing LDP in Japanese politics.
During economic growth periods in the 1960s and 1970s, the Japanese government shifted more toward nuclear power. On the one hand, a high population density and intensive industrial activities imply a high energy demand. On the other hand, Japan’s resource base of fossil fuels is seriously limited. As the switching of fuel from expensive domestic coal to imported oil had taken place in the 1960s, the country had an increased dependence of energy supply on oil imports, but this resulted in a series of domestic energy shortages during the 1970s as a consequence of the global oil crises. Since then, the Japanese government has attempted to diversify energy sources, and the use of nuclear power has been promoted in that context.
Nuclear power plants have been constructed under the initiatives of private entities, and the role of the national government in promoting nuclear power has mostly been financial support for hosting local governments, particularly in the form of subsidies under the Three Power Source Development Laws established in 1974. Electricity is mostly supplied by 10 regional vertically integrated monopolies, which are private companies under governmental oversight based on the Electricity Business Act. For instance, the construction of the Fukushima Dai-ichi power plant was also in private hands, with the Tokyo Electric Power Company (TEPCO) as the owner and operator of the plant. In contrast, hosting by local government attracts a subsidy. The subsidy scheme is aimed at reducing high dependency on thermal power generation and is applied to local governments engaged in not only nuclear power generation but also any energy generation other than thermal power, as discussed below. Besides the subsidies, the hosting local municipalities also enjoy large amounts of corporate and property tax revenues, and the prospect of these financial incentives has been an easing factor for the siting of nuclear power plants, which are mostly located in remote areas without any strong industrial base (see e.g., [17]).
After the 2011 accident, public opinion about nuclear power has naturally shifted negatively. However, due to the unchanging dilemma of the Japanese energy supply, the policy stance on the energy mix after the accident is still ambiguous. On the one hand, the government has leaned toward renewable energies. The feed-in-tariff system was introduced in July 2012 and expansion of the share of renewable resources was put on the political agenda. On the other hand, the LDP has sought to operate nuclear power plants under the new safety standard. In July 2013, the Diet in fact passed legal amendments to restructure the regulatory system, now with significantly tighter safety standards for nuclear power plants [36].
Before the 2011 accident, there were 54 commercial nuclear power reactors in operation in the country [5]. In 2009, nuclear power energy accounted for 29.2% in total power generation. Japan had the third largest capacity for nuclear power generation in the world. While it was decided to decommission 24 nuclear reactors, the other existing reactors are planned to restart after safety reviews; nine of these are already in operation as of July 2019. As for the role of nuclear power in the long run, the Strategic Energy Plan approved by the Cabinet in 2018, which is a long-term governmental plan of energy policy being reviewed and updated about every three years, states “lower reliance on nuclear power as much as possible” [5], p. 47. More specifically, it sets the target for an energy mix of 20–22% of nuclear power and 22–24% of renewable resources in 2030.
Another feature characterizing the Japanese electricity market today is an ongoing process of liberalization, which will weaken the monopoly status of the ten regional companies. Since April 2016, the electricity retail market has become fully liberalized, and a breakup of the regional utilities into separate companies for power generation and transmission/distribution will take place in 2020 [5].

4. Data

Our main data are taken from KHPS. KHPS is a two-stage, stratified, random, representative household panel survey conducted by Keio University (see e.g., [37]). KHPS started from 2004 in the form of an annual panel survey, which is conducted in January of each year and covers around 4000 households. The location of households can be identified at the municipality level. The basic questions include those about the basic socioeconomic characteristics of the respondents or their households, such as gender, age, income, education, family members, expenses, saving, financial assets, occupation, job status, housing, as well as psychological status, and social views such as moral and social stances. In addition to the basic questions, KHPS includes some year-specific modules.
Most importantly for our purposes, the KHPS 2014 encompasses a module of energy-related questions (see [33] for more details). In particular, this module posed the following question to each household in terms of methods of electricity generation:
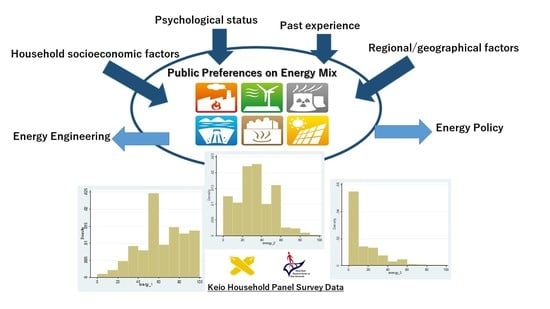
“Suppose you could decide about the fuel mix in Japan. What would the mix look like? ____% renewable; _____% fossil; _____% nuclear. Make sure that the percentages add up to 100.”
This question represents a person’s preference on the energy mix and is the focal variable in our estimations. We note that our main focus is the energy mix question in KHPS 2014 and thus our estimations are a cross-section dimension mainly using KHPS 2014. However, since KHPS is a panel format and allows us to track the same individuals, some variables in other years of KHPS are also used, as shown later (see Appendix A Table A1).
Table 1 reports the basic statistics on the preferred energy mix. Averaged over all the responses, the preferred energy mix includes 0.59 for renewables, 0.29 for fossil fuels, and 0.12 for nuclear. In nuclear, the median value is 0 and p90 is 0.4; thus, variation is larger than for other energies. Compared with the preferred energy mix, the actual energy mix in Japan in 2017 is much lower for renewables (0.16), much higher for fossil fuels (0.81), and lower for nuclear (0.03) [5].
Next, Figure 1 plots the extent of preference heterogeneity among respondents. The distribution is biased toward higher shares for renewables and toward lower shares for fossil fuels. For nuclear, the distribution is highly skewed toward zero. In Section 5, we investigate how much of this heterogeneity can be explained by the four sets of variables that we focus on.
Appendix ATable A1 reports further descriptive statistics and definitions of variables. Household annual income in our sample amounts to 6629 thousand yen (5760 thousand yen in median), whereas it is 5289 thousand yen (4150 thousand yen in median) according to the Comprehensive Survey of Living Conditions (Ministry of Health, Labour and Welfare, 2014). Total household saving amounts to 9010 thousand yen (10,315 thousand yen; Comprehensive Survey of Living Conditions, Ministry of Health, Labour and Welfare, 2016), and financial assets, defined as total security assets, amount to 2162 thousand yen. Household-level monthly energy expense in our sample amounts to 29,803 yen (20,129 yen; Household Survey, 2014), and the average house area is 116 square meters (94.42 square meters; Ministry of Land Infrastructure, 2013). The average family size is 3.16 persons per household (2.49 persons; Comprehensive Survey of Living Conditions, Ministry of Health, Labour and Welfare, 2014). Note that we omitted some observations due to missing information. Our working sample includes 4122 observations.

5. Estimation and Results

5.1. Estimation Strategy

The descriptive exercise has provided two insights. First, the preferred fuel mix, according to our respondents, is very different from the actual fuel mix in Japan. Particularly, the preferred mix contains a much larger share of renewables and a slightly higher share of nuclear. For fossil fuels, the preferred share is significantly lower than the actual share. Second, there is considerable heterogeneity in the respondents’ assessments. The aim of the subsequent regression exercise is to investigate if the reported preferred fuel shares are statistically associated with observable characteristics of our respondents. We consider a broad set of such characteristics: from household and individual characteristics, over personal social views and political stance, and regional characteristics, to Fukushima accident-related experiences in the past.
Our dependent variable is the reported optimal shares by the KHPS respondents. Each of the following equations are estimated by seemingly unrelated regressions (SUR):
E n e r g y _ R e n e w a b l e i = β R 0 + β R 1 X i + β R 2 P i + β R 3 R i + β R 4 P X i + F E p r e f , i + F E o c c u , i + ε i
E n e r g y _ N u c l e a r i = β N 1 + β N 1 X i + β N 2 P i + β N 3 R i + β N 4 P X i + F E p r e f , i + F E o c c u , i + ε i
E n e r g y _ F o s s i l i = β F 1 + β F 1 X i + β F 2 P i + β F 3 R i + β F 4 P X i + F E p r e f , i + F E o c c u , i + ε i
Importantly, since our energy mix variables are required to satisfy E n e r g y _ R e n e w a b l e i + E n e r g y _ F o s s i l i + E n e r g y _ N u c l e a r i = 1 , one of the three equations must be omitted due to collinearity. In our regression, we omitted Equation (3), Energy_Fossil.
Index i denotes respondents, X is a set of variables for the household and individual characteristics, P represents a set of variables on psychological status and some social views, and R is a set of variables for regional characteristics. PX is “past experience” just after the earthquake of 2011. The dependent variable, the preferred energy percentage for each energy source for the individual i, Energy_Renewable and Energy_Nuclear, takes from 0 to 1. FE_pref is a prefectural fixed-effect dummy and FE_occu is an occupation fixed-effect dummy. The occupation classifications are agriculture, fishery, mining, construction, manufacturing, wholesale and retail, restaurants and hotels, finance and insurance, real estate, transportation, information services, IT, electricity/gas/water/heat supply, medical services, education, public services/government, and others. There are 47 prefectures in Japan.
To allow an assessment of the robustness of the regressions, in the first set of regressions, our independent variables are the household and individual characteristics (“X”), which are taken from the KHPS 2014. The variables are of basic characteristics and economic factors such as gender, age, the number of family members, income, savings, financial assets, possession of a university degree, and the energy cost share. All of these independent variables are often included in social surveys on energy issues and are thought of as crucial factors for Japanese public energy preference (e.g., [1]).
The second set of regressions adds psychological status and some social views (“P”) such as risk attitude (time preference), preference on liberty or equality, and political stance. In the risk attitude, the survey asks, “Suppose that you receive 10,000 yen in one month, but instead of receiving 10,000 yen in one month, how much do you want to receive if it is in 13 months?”. Higher values indicate a higher time preference. In the variable of liberty or equality, the survey asks which is more important, liberty or equality (or neutral). The value takes −1 (equality), 0 (neutral), or 1 (liberty). Political stance stands for whether the respondent is a supporter of the LDP (the center-right governing party) or a supporter of one of the center-left or left-wing parties (the Democratic Party of Japan, the Social Democratic Party, or the Communist Party), which is taken from the KHPS 2013 (whose target households are basically identical with those of the KHPS 2014, due to the nature of a panel survey). We note that the question on political stance is not available in the KHPS 2014 and appears in the KHPS 2013. The left-leaning parties now unambiguously call for a termination of nuclear power generation.
The third set adds variables on past experience (“PX”). An individual’s preference on the energy mix might be affected by his/her past experience. In particular, the Great East Japan Earthquake might durably affect an individual’s current preference. For this reason, we use the data of a special survey of the KHPS, the Great East Japan Earthquake Special Survey (GEES). The GEES was conducted twice after the Great East Japan Earthquake, in June and October 2011. The household sample of the GEES is based on the KHPS. The first wave of the GEES covers 2138 households. The scope of the survey questions differs between the first and the second waves. We use some questions on earthquake experiences in the GEES in the first wave. The survey asks about the experiences after the earthquake as of June 2011, i.e., the experience of nonfunctional gas, water, and telephones, blackouts, opinions for and against nuclear power, and anxiety about future big earthquakes and about Fukushima nuclear accidents. First, the variable for nonfunctional public utilities is measured by counting the number of nonfunctional public services (gas, water supply, and telephones). Then, we make a blackout dummy, which takes a value of 1 if the individual experienced blackout in the 2011 earthquake. The GEES survey asks people’s opinions about nuclear power generation just after the earthquake, as of 2011 July. The individual chooses one answer from a list of answers to a multiple choice question: “we do not need nuclear and should reduce nuclear power generation (−1)”, “we do not need nuclear but I have no opinion on and I am neutral to whether we should reduce or increase nuclear power generation” (0), “we might not need nuclear but we should sustain the current level of nuclear power generation (+1)”, and “we need to increase nuclear power generation (+2)”. The value is higher if the respondent is positive about nuclear power generation. In terms of anxiety, the GEES survey asks about the respondent’s anxiety about 1) future big earthquakes and 2) the threat of a Fukushima nuclear accident. Higher values indicate greater anxiety. The values are scaled from 0 to 1.
Finally, we include regional characteristics (“R”). Japan has a large variety of regions. Power plants are located in specific municipalities, and residency in those municipalities might have particular effects on individuals’ preferences on nuclear power energy. Individuals living close to nuclear/thermal power plants might develop anxiety about them and hence may dislike them, but at the same time, municipalities hosting power plants receive regional subsidies, which might benefit the individuals as well. Considering these potential mechanisms, wee include dummy variables for the location of nuclear power plants and the location of thermal power plants at the city/municipality level. If a power plant is located in such a municipality, the dummy takes a value of 1. In the case of nuclear power plants, there are a small number of households in the municipalities with nuclear power stations. Thus, our location dummies for nuclear plants are used as municipalities with nuclear power stations as well as within 30 km of nuclear power stations. In 2012, municipalities within 30 km of nuclear power stations were set as the evacuation areas by the government in case of a nuclear power plant accident. The regional subsidy data are sourced from the Subsidies for Power Source Located Region Promotion (Dengen Ritti-chiiki Taisaku Kouhukin) under the Three Power Source Development Laws, as set down by the Ministry of Economy, Industry and Trade, Japan (METI). METI subsidizes municipalities that generate electricity. Our subsidy data are from 2012. We note that since the subsidy is granted for any kind of energy generation other than thermal power generation, the number of subsidized municipalities is much greater than the number of municipalities where nuclear power stations are located. Controlling for the population size of municipalities, we use the per capita subsidy in the estimation. Another variable on regional factors is the impact of TEPCO. Since electric power companies act as a regional monopoly as mentioned above, the service area of TEPCO might have more intense impacts on individuals’ energy preferences. We include a dummy for the service area of TEPCO. If a household is located in the service area of TEPCO, the dummy takes a value of 1, and otherwise zero. Then, we use the interaction terms for power plant location dummies and local subsidies.

5.2. Results

Table 2 reports the results, successively adding our sets of explanatory variables. Note that we compare the results with the omitted category Energy_Fossil (Equation (3) in Section 5.1). Further note that we focus on those results where differences between Energy_Fossil and Energy_Renewable and/or Energy_Nuclear are significant at least at the 5% level of statistical significance.
Reporting the results for the basic estimation including sociodemographic and household/individual characteristics (Column 1, Table 2), we find that male respondents prefer a higher (lower) nuclear (renewable) share than females. The difference amounts to about 4% points. The younger generation prefers both nuclear and renewables, whereas the older generation prefers fossil fuels. Then, larger families prefer renewables while small families or singles prefer nuclear. Higher income persons prefer nuclear, while individuals holding more financial assets prefer fossil fuels. If the energy expense share is higher, respondents prefer nuclear.
Column 2 of Table 2 reports the results of adding psychological status, social views, and political stance. Overall, the results for our first set of variables are robust in terms of size and significance to the inclusion of these variables. The risk variable is significantly positive for renewables, which indicates that people with a high time preference prefer renewables. Urban people prefer a higher nuclear share. The difference between urban and non-urban residents amounts to about 5% points. Those who prefer liberty to equality are significantly positive to nuclear. Furthermore, those who support the governing party (LDP) are positive for nuclear and negative to renewables, whereas those who support left-leaning parties are against nuclear. LDP supporters prefer a higher share of nuclear than non-LDP supporters, by 2% points.
Column 3 of Table 2 reports the results on the experiences of the Great East Japan Earthquake. Note that due to missing observations, the number of observations drops from initially 4122 to 2478. Some experiences have impacts on the individual’s preference. The blackout dummy, “Blackout”, is significantly negative in the nuclear equation. Variables for people’s anxiety and opinions on nuclear power generation still remain and are largely influenced by their current preference on energy mix. The opinion on nuclear power generation immediately after the Fukushima accident (“Fukushima_opinion”) is highly significant and positive in nuclear but significantly negative in renewables. This indicates that an individual’s opinion on nuclear just after the earthquake of 2011 still strongly remains over time and affects the current energy preferences. Turning to the anxiety variables, an individual’s anxiety about the threat of a Fukushima nuclear accident (“anxiety_nuclear”) is significantly negative in nuclear, while their anxiety about a future earthquake (“anxiety_eq”) is significantly positive.
In a nutshell, those who experienced blackouts were anxious about the nuclear accident immediately after the Fukushima accident and have retained these strongly negative feelings about nuclear power. Therefore, the effects of past experience and anxiety have continued long after the event and resulted in an ongoing negative attitude toward nuclear power.
Table 3 reports the estimation on regional characteristics. Column 1 of Table 3 reports the estimation result without interaction terms. All regional variables are not significant. However, once the regions operated by TEPCO are taken into account, the results change. Column 2 of Table 3 shows the effect of interaction with TEPCO. We use a TEPCO dummy and its interaction with power plant location dummies. The TEPCO dummy (“TEPCO”) in itself is not significant. The location dummies for nuclear power station (“NPS”) and neighborhood (municipalities within 30 km of a power plant, “NPS_30 km”) interacted with the TEPCO dummy and are significantly positive as regards to the renewable energy estimation. Thus, respondents living in municipalities where TEPCO operates nuclear plants prefer a higher share of renewables, by about 26% points, which is large. Respondents in municipalities within 30km of a power plant operated by TEPCO also prefer a higher share of renewables. It is interesting to note that the size is similar, amounting to about 25% points.
Finally, we make comparisons across estimations. In all model specifications of Table 2 and Table 3, the estimation including all sets of variables, Column 3 of Table 2, takes the highest values of F-statistics and R-square, implying the best model specification. Combining aspects of individual socioeconomic characteristics and past experience results in good explanatory power for the current energy mix.

6. Conclusions

We study individuals’ preferences on the energy mix in Japan, using the KHPS data and some regional data. Our contribution is to estimate the impact of several aspects simultaneously, i.e., an individual/household’s basic characteristics, psychological status, social views, their history of Fukushima accident-related experiences, and regional factors. As a result, many individual/household characteristics such as gender, age, income, financial assets, education, and energy costs largely affect an individual’s preference on the energy mix. In particular, high-income younger males with small families or who are single prefer nuclear to fossil fuel power generation. Furthermore, the psychological status and social views such as the social stance, the attitude toward risk, and the political stance matter. Urban people and those who prefer liberty to equality prefer nuclear power. Experience of the 2011 earthquake still affects the current opinion on the energy mix. People’s anxiety about the nuclear power accident and their opinion against nuclear power generation right after the 2011 earthquake largely affect their preferred energy mix as of 2014. In addition to individual characteristics, regional factors also affect an individual’s preference on energy, e.g., the location of power plants.
Our investigation uncovers the Japanese public preference on the energy mix. Overall, compared with the actual fuel mix, Japanese people prefer a slightly higher share of nuclear power, but a much higher share of renewables and much lower share of fossil fuels. The differences are of sizeable magnitudes: +8% points, +43% points, and −53% points, respectively.
As shown in our estimation results, female, educated, married people, and those who prefer equality to liberty and do not support the LDP prefer a higher share of renewable energy. Furthermore, people closer to nuclear power plants also prefer renewables. These results are consistent with results of previous social surveys in Japan [1] and other previous studies in other countries. For example, male, older, and less educated people tend to have a positive attitude toward nuclear power generation [6,7,8]. An individual’s psychological status and social views such as trust [9] and fairness [10] also affect acceptance of nuclear power and renewables. In this sense, our results are not surprising.
Our results imply that if the government takes into account public opinion, it would be impossible for the energy policy of high dependency on nuclear power such as before the Fukushima accident to survive. However, oil and gas for fossil fuel generation largely depend on imports while renewables are costly. In our survey, we asked about the preferred energy mix, and we did not include the costs of production. Considering these costs would most likely lead to a narrowing of the gap.
The further step will be the coordination of various interests to reflect energy policy. This institutional issue is beyond the scope of the paper and will be related to other research fields such as citizen engagement [38], risk perception [39], and public perception [40].

Author Contributions

Conceptualization, T.O., D.N., K.R. and C.S.; methodology, T.O. and C.S.; validation, T.O., D.N., K.R. and C.S.; formal analysis, T.O.; data curation, T.O.; writing—original draft preparation, T.O., D.N., K.R. and C.S.; writing—review and editing, T.O., D.N., K.R. and C.S.; visualization, T.O.; project administration, T.O.; funding acquisition, T.O. All authors have read and agreed to the published version of the manuscript.

Funding

This research was funded by the Asahi Glass Foundation and JSPS Kakenhi No. 19H01487.

Conflicts of Interest

The authors declare no conflicts of interest.

Appendix A

Table A1. Basic statistics.
VariablesStatsMeanNp50MinMaxData SourceDefinition
Energy preferenceEnergy_Renewables0.58981750280.601KHPS2014
Energy_Fossil0.288792850280.301KHPS2014
Energy_Nuclear0.11853225028001KHPS2014
Household and individual characteristicsmale0.5026 5008101KHPS2014One if respondent is male, zero otherwise
ln_age3.9493 50083.993.094.52KHPS2014Age of the respondent
family_num3.1577 50083110KHPS2014Number of family
ln_income6.2916 47126.3608.85KHPS2014Total income
saving_rate0.0154 50080.0100.44KHPS2014Share of saving in income
ln_house4.5733 44274.611.17.27KHPS2014Area of respondent’s house
ln_financial1.4732 5008009.9KHPS2014Total financial asset
university0.4157 5008001KHPS2014One if respondent has university degree
energy_cost0.1178 48710.1101.2KHPS2014Share of energy cost in total expense
Psychological status and social viewsrisk5.6824 4921618KHPS2014Risk variable for time preference
urban0.4980 5008001KHPS2014One if respondent lives in Greater Tokyo, Greater Osaka and Nagoya
liberty0.1480 49660-11KHPS20141(-1) if respondent prefers liberty (equality). Zero if neutral.
LDP_support0.3169 5008001KHPS2013One if respondent supports LDP, zero otherwise
Left_support0.0118 5008001KHPS2013One if respondent supports left-wing parties (Democratic Party, Social Democratic Party, Communist Party), zero otherwise
Thermal0.0683 5008001 One if respondent lives in municipalities that thermal power plants locate, zero otherwise
Regional characteristicsNPS0.0266 5008001 One if respondent lives in municipalities that nuclear power plants locate, zero otherwise
NPS_30km0.3562 5008001 One if respondent lives within 30km from nuclear power plants locate, zero otherwise
subsidy_pop0.9402 50080011.6METIPer-capita subsidy of energy development at municipality level
Past experienceblackout0.0639 5008001GEESOne if respondent experienced blackout in 2011 earthquake.
stop_infra0.2167 5008003GEESThe number of stopped infrastructures respondent experienced.
Fukushima opinion0.5583 30541-12GEESOpinion on nuclear power just after the 2011 earthquake
anxiety_eq0.5463 31680.601GEESAnxiety on future earthquake
anxiety_nuclear0.7689 31830.801GEESAnxiety on Fukushima nuclear power accident.

References

  1. Cabinet Office, Japan. Public Opinion Poll on Energy and Environment Choice (enerugi- kankyo no sentakushi ni kansuru toron-gata yoronchosa); Cabinet Office: Tokyo, Japan, 2012. [Google Scholar]
  2. Institute of Applied Energy. Enerugi- ni kansuru Koshu no Ishiki Chosa Houkokusyo (Report of Social Survey on Public Preference on Energy); Institute of Applied Energy: Tokyo, Japan, 2013 2014. [Google Scholar]
  3. Kitada, A. The pros and cons about restarting and awareness about nuclear power generation further findings from INSS’s analysis of the opinion survey answers. INSS J. 2015, 22, 27–46. [Google Scholar]
  4. NHK Bunken. Bosai to enerugi- ni kansuru yoronchosa 2015, (Social Survey on Disaster Prevention and Energy). 2016. Available online: https://www.nhk.or.jp/bunken/research/yoron/pdf/20160501_7.pdf (accessed on 20 December 2019).
  5. Agency for Natural Resources and Energy. Annual Report on Energy (Enerugi Hakusho); Agency for Natural Resources and Energy: Tokyo, Japan, 2010 2018.
  6. Eurobarometer. Europeans and Nuclear Safety. Special Eurobarometer 2010, 324. Available online: https://ec.europa.eu/commfrontoffice/publicopinion/archives/ebs/ebs_324_en.pdf (accessed on 23 January 2020).
  7. Corner, A.; Venables, D.; Spence, A.; Poortinga, W.; Demski, C.; Pidgeon, N. Nuclear power, climate change and energy security: exploring British public attitudes. Energy Policy 2011, 39, 4823–4833. [Google Scholar] [CrossRef]
  8. Kim, Y.; Kim, W.; Kim, M. An international comparative analysis of public acceptance of nuclear energy. Energy Policy 2014, 66, 475–483. [Google Scholar] [CrossRef]
  9. de Groot, J.I.; Steg, L. Morality and nuclear energy: Perceptions of risks and benefits, personal norms, and willingness to take action related to nuclear energy. Risk Anal. Int. J. 2010, 30, 1363–1373. [Google Scholar] [CrossRef]
  10. Visschers, V.H.; Siegrist, M. How a nuclear power plant accident influences acceptance of nuclear power: Results of a longitudinal study before and after the Fukushima disaster. Risk Anal. Int. J. 2013, 33, 333–347. [Google Scholar] [CrossRef]
  11. Drottz-Sjöberg, B.M.; Sjoberg, L. Risk perception and worries after the Chernobyl accident. J. Environ. Psychol. 1990, 10, 135–149. [Google Scholar] [CrossRef]
  12. Renn, O. Public responses to the Chernobyl accident. J. Environ. Psychol. 1990, 10, 151–167. [Google Scholar] [CrossRef] [Green Version]
  13. Wolsink, M. Wind power and the NIMBY-myth: institutional capacity and the limited significance of public support. Renew. Energy 2000, 21, 49–64. [Google Scholar] [CrossRef]
  14. Van der Horst, D. NIMBY or not? Exploring the relevance of location and the politics of voiced opinions in renewable energy siting controversies. Energy Policy 2007, 35, 2705–2714. [Google Scholar] [CrossRef] [Green Version]
  15. Kawaguchi, D.; Yukutake, N. Estimating the residential land damage of the Fukushima nuclear accident. J. Urban Econ. 2017, 99, 148–160. [Google Scholar] [CrossRef]
  16. Stoutenborough, J.W.; Sturgess, S.G.; Vedlitz, A. Knowledge, risk, and policy support: Public perceptions of nuclear power. Energy Policy 2013, 62, 176–184. [Google Scholar] [CrossRef]
  17. Lesbirel, S.H. NIMBY Politics in Japan: Energy Siting and the Management of Environmental Conflict; Cornell University Press: Ithaca, NY, US, 1998. [Google Scholar]
  18. Burningham, K.; Barnett, J.; Thrush, D. The limitations of the NIMBY concept for understanding public engagement with renewable energy technologies. In Energy Research Councils Programme Working Paper. 1-3; School of Environment and Development, University of Manchester: Manchester, UK, 2006. [Google Scholar]
  19. Wüstenhagen, R.; Wolsink, M.; Bürer, M.J. Social acceptance of renewable energy innovation: An introduction to the concept. Energy Policy 2007, 35, 2683–2691. [Google Scholar] [CrossRef] [Green Version]
  20. Komarek, T.M.; Lupi, F.; Kaplowitz, M.D. Valuing energy policy attributes for environmental management: Choice experiment evidence from a research institution. Energy Policy 2011, 39, 5105–5115. [Google Scholar] [CrossRef]
  21. Grösche, P.; Schröder, C. Eliciting public support for greening the electricity mix using random parameter techniques. Energy Econ. 2011, 33, 363–370. [Google Scholar] [CrossRef] [Green Version]
  22. Cicia, G.; Cembalo, L.; Del Giudice, T.; Palladino, A. Fossil energy versus nuclear, wind, solar and agricultural biomass: Insights from an Italian national survey. Energy Policy 2012, 42, 59–66. [Google Scholar] [CrossRef]
  23. Reiner, D.M. 2006 EPRG Public Opinion Survey on Energy Security: Policy Preferences and Personal Behaviour; Working Papers EPRG 0706; University of Cambridge: Cambridge, UK, 2007. [Google Scholar]
  24. Siegrist, M.; Visschers, V.H. Acceptance of nuclear power: The Fukushima effect. Energy Policy 2013, 59, 112–119. [Google Scholar] [CrossRef]
  25. Chen, W.M.; Kim, H.; Yamaguchi, H. Renewable energy in eastern Asia: Renewable energy policy review and comparative SWOT analysis for promoting renewable energy in Japan, South Korea, and Taiwan. Energy Policy 2014, 74, 319–329. [Google Scholar] [CrossRef]
  26. Bird, D.K.; Haynes, K.; van den Honert, R.; McAneney, J.; Poortinga, W. Nuclear power in Australia: A comparative analysis of public opinion regarding climate change and the Fukushima disaster. Energy Policy 2014, 65, 644–653. [Google Scholar] [CrossRef] [Green Version]
  27. Jacksohn, A.; Grösche, P.; Rehdanz, K.; Schröder, C. Drivers of renewable technology adoption in the household sector. Energy Econ. 2019, 81, 216–226. [Google Scholar] [CrossRef] [Green Version]
  28. Kato, T.; Takahara, S.; Nishikawa, M.; Homma, T. A case study of economic incentives and local citizens’ attitudes toward hosting a nuclear power plant in Japan: Impacts of the Fukushima accident. Energy Policy 2013, 59, 808–818. [Google Scholar] [CrossRef] [Green Version]
  29. Poortinga, W.; Aoyagi, M.; Pidgeon, N.F. Public perceptions of climate change and energy futures before and after the Fukushima accident: A comparison between Britain and Japan. Energy Policy 2013, 62, 1204–1211. [Google Scholar] [CrossRef]
  30. Itaoka, K.; Saito, A.; Krupnick, A.; Adamowicz, W.; Taniguchi, T. The effect of risk characteristics on the willingness to pay for mortality risk reductions from electric power generation. Environ. Resour. Econ. 2006, 33, 371–398. [Google Scholar] [CrossRef]
  31. Ida, T.; Takemura, K.; Sato, M. Inner conflict between nuclear power generation and electricity rates: A Japanese case study. Energy Econ. 2015, 48, 61–69. [Google Scholar] [CrossRef] [Green Version]
  32. Murakami, K.; Ida, T.; Tanaka, M.; Friedman, L. Consumers’ willingness to pay for renewable and nuclear energy: A comparative analysis between the US and Japan. Energy Econ. 2015, 50, 178–189. [Google Scholar] [CrossRef]
  33. Rehdanz, K.; Schröder, C.; Narita, D.; Okubo, T. Public preferences for alternative electricity mixes in post-Fukushima Japan. Energy Econ. 2017, 65, 262–270. [Google Scholar] [CrossRef] [Green Version]
  34. Rehdanz, K.; Welsch, H.; Narita, D.; Okubo, T. Well-being effects of a major natural disaster: The case of Fukushima. J. Econ. Behav. Organ. 2015, 116, 500–517. [Google Scholar] [CrossRef]
  35. Kitada, A. Public opinion on nuclear power generation measured in continuous polls changes after Fukushima Daiichi nuclear power plant accident over the past 30 years. Trans. At. Energy Soc. Jpn. 2013, 12, 177–196. [Google Scholar] [CrossRef] [Green Version]
  36. Nuclear Regulation Authority. Jituyo Hatsudenyo Genshiro ni kakawaru Shinkisei kijun ni tsuite (New Standard on Nuclear Reactors for Power Generation); Nuclear Regulation Authority: Tokyo, Japan, 2016; Available online: https://www.nsr.go.jp/data/000070101.pdf (accessed on 23 January 2020).
  37. Schröder, C.; Rehdanz, K.; Narita, D.; Okubo, T. The decline in average family size and its implications for the average benefits of within-household sharing. Oxf. Econ. Pap. 2015, 67, 760–780. [Google Scholar] [CrossRef] [Green Version]
  38. Powell, M.C.; Colin, M. Meaningful citizen engagement in science and technology. Sci. Commun. 2008, 30, 126–136. [Google Scholar] [CrossRef]
  39. Goodfellow, M.J.; Williams, H.R.; Azapagic, A. Nuclear renaissance, public perception and design criteria: an exploratory review. Energy Policy 2011, 39, 6199–6210. [Google Scholar] [CrossRef]
  40. Greenhalgh, A.; Azapagic, A. Review of drivers and barriers for nuclear power in the UK. Environ. Sci. Policy 2009, 12, 1052–1067. [Google Scholar] [CrossRef]
Figure 1. Histogram.
Energies 13 02938 g001
Table 1. Energy preference.
StatsRenewablesFossilNuclear
mean0.5923 0.2895 0.1182
N498249824982
p500.60.30
p100.300
p9010.50.4
min000
max111
Table 2. Estimation result 1.
Independent Variables123
RenewablesNuclearRenewablesNuclearRenewablesNuclear
male−0.0409 ***0.0440 ***−0.040 1***0.0437 ***−0.0359 ***0.0384 ***
(−5.24)(7.52)(−5.07)(7.39)(−3.62)(5.38)
ln_age−0.0540***−0.0305**−0.0505 ***−0.0322 ***−0.0771 ***−0.0053
(−3.37)(−2.54)(−3.08)(−2.63)(-3.55)(−0.34)
family_num0.0084***−0.0058 ***0.0084***−0.0057 **0.0044−0.0022
(2.86)(−2.65)(2.83)(−2.57)(1.16)(−0.81)
ln_income−0.00860.0126 ***−0.00910.0129 ***−0.00580.0079
(−1.40)(2.77)(−1.47)(2.79)(−0.78)(1.47)
saving_rate−0.03800.0724−0.02950.0629−0.03600.0414
(−0.28)(0.71)(−0.21)(0.59)(−0.23)(0.36)
ln_house−0.0069−0.0013−0.0074−0.00080.0030−0.0009
(−1.02)(−0.25)(−1.07)(−0.15)(0.34)(−0.14)
ln_financial−0.0030**0.0004−0.0025−0.0002−0.0042 **0.0005
(-2.04)(0.40)(−1.64)(−0.16)(−2.36)(0.40)
university0.0008−0.0117 *0.0029−0.0119 *0.0051−0.0127 *
(0.10)(−1.94)(0.35)(−1.96)(0.52)(−1.77)
energy_cost0.00100.1080**0.03220.0714−0.00020.0375
(0.02)(2.50)(0.53)(1.58)(−0.00)(0.70)
risk 0.0033 *−0.00030.0046 **0.0007
(1.91)(-0.24)(2.13)(0.42)
urban −0.01770.0527 ***0.01350.0289
(−0.74)(−2.94)(0.46)(1.36)
liberty −0.00500.0121***0.00040.0114 **
(-1.00)(3.22)(0.06)(2.53)
LDP_support -0.0164**0.0188***−0.01090.0148 **
(-1.99)(3.05)(−1.09)(2.05)
Left_support 0.0240−0.0456 *−0.0210−0.0209
(0.67)(−1.71)(−0.52)(−0.71)
blackout 0.0216−0.0326 **
(0.98)(−2.06)
stop_infra −0.01130.0130 *
(−1.11)(1.78)
Fukushima opinion −0.0313 ***0.0376 ***
(−9.19)(15.31)
anxiety_eq -0.02920.0302 **
(-1.49)(2.14)
anxiety_nuclear 0.0360−0.0359 **
(1.59)(−2.19)
N412241224053405324782478
R-sq0.04860.0480.05070.05370.10340.1624
F-value2.792.762.712.883.375.66
*: p < 0.1; **: p < 0.05; ***: p < 0.01.
Table 3. Estimation result 2.
Independent Variables12
RenewablesNuclearRenewablesNuclear
male−0.0356 ***0.0383 ***−0.0350 ***0.0380 ***
(−3.59)(5.37)(−3.53)(5.32)
ln_age−0.0763 ***−0.0055−0.0761***−0.0060
(−3.50)(−0.35)(−3.49)(−0.39)
family_num0.0045−0.00230.0044−0.0022
(1.17)(−0.84)(1.17)(−0.80)
ln_income−0.00580.0079−0.00590.0079
(−0.77)(1.47)(−0.79)(1.45)
saving_rate−0.03270.0388−0.04090.0431
(−0.21)(0.34)(−0.26)(0.37)
ln_house0.0033−0.00080.0038−0.0012
(0.37)(−0.13)(0.43)(−0.19)
ln_financial−0.0042 **0.0005−0.0043 **0.0006
(−2.38)(0.41)(−2.40)(0.43)
university0.0051−0.0128 *0.0048−0.0128 *
(0.51)(−1.78)(0.48)(−1.79)
energy_cost0.00230.03720.00870.0347
(0.03)(0.70)(0.12)(0.65)
risk0.0046 **0.00070.0045 **0.0007
(2.14)(0.44)(2.10)(0.45)
urban0.01300.03080.01160.0300
(0.43)(1.43)(0.39)(1.38)
liberty0.00040.0114 **0.00040.0115 **
(0.06)(2.54)(0.07)(2.56)
LDP_support−0.01080.0147**−0.01030.0145 **
(−1.07)(2.02)(−1.02)(2.00)
Left_support−0.0196−0.0211−0.0187−0.0206
(−0.48)(−0.72)(−0.46)(−0.70)
Thermal0.00570.0000−0.00570.0057
(0.29)(0.00)(−0.25)(0.36)
NPS−0.0493−0.0123−0.0992 **−0.0130
(−1.21)(−0.42)(−1.97)(−0.36)
NPS_30km0.00120.0091−0.01640.0123
(0.04)(0.44)(−0.52)(0.55)
subsidy_pop−0.00100.0011−0.00050.0000
(−0.27)(0.44)(−0.14)(0.03)
TEPCO−0.00540.0225−0.03710.0174
(−0.12)(0.73)(−0.79)(0.51)
NPS#TEPCO 0.2590 **−0.0582
(2.29)(−0.71)
NPS_30km#TEPCO 0.2450 **−0.0964
(2.20)(−1.20)
Thermal#TEPCO 0.0448−0.0302
(0.96)(−0.90)
TEPCO#subsidy_pop −0.01670.0117
(−1.49)(1.44)
blackout0.0226−0.0330 **0.0205−0.0328 **
(1.02)(−2.08)(0.93)(−2.06)
stop_infra−0.01090.0130*−0.01080.0131 *
(−1.07)(1.77)(−1.06)(1.78)
Fukushima opinion−0.0312 ***0.0376 ***−0.0310 ***0.0375 ***
(−9.14)(15.29)(−9.09)(15.25)
anxiety_eq−0.02950.0303 **−0.02870.0303 **
(−1.51)(2.15)(−1.47)(2.14)
anxiety_nuclear0.0364−0.0359 **0.0385 *−0.0374 **
(1.60)(−2.19)(1.69)(−2.28)
NoB2478247824782478
R-sq0.10430.16270.10720.1638
F3.25.343.155.14
*: p < 0.1; **: p < 0.05; ***: p < 0.01.

