Abstract
This paper presents an analyses of an Energy Storage System (ESS) for grid-tied photovoltaic (PV) systems, in order to harness the energy usually lost due to PV array oversizing. A real case of annual PV power generation analysis is presented to illustrate the existing problem and future solutions. Three PV modeling techniques have been applied to estimate non-measured non-harnessed PV power to provide an ESS energy and power sizing strategy. Moreover, a control strategy to store or release power from the DC-link, without modifying the Maximum Power Point Tracking (MPPT) strategy, is presented. The results show an estimation of the annual power loss caused by oversizing the PV array. The ESS sizing strategy gives insight into not only the energy requirements, but also the power requirements of the system. Simulation results show that the proposed ESS control strategy is capable of harnessing the extra power without modifying the existing power converter of the PV plant nor its control strategy.
1. Introduction
Perpetration of renewable energy in electric markets has reached an impressive , being wind, bio and solar power at the forefront of modern renewables development and integration to electric retail [1]. A crucial parameter when designing renewable energy plants is its load factor, also known as capacity factor or plant (load) factor, which corresponds to the ratio between the generated and rated energy of the plant during a certain amount of time. In UK, PV plants present annual load factors close to [2], which are calculated considering the rated power of the converter. A common practice is to increase annual plant factor by oversizing the power rating of the PV array, with respect to the converter [3]. The ratio between PV array rated power and the inter AC rated output power is known as Inverter Loading Ratio (ILR) [4]; in places with high irradiation variability such as UK, PV array power ILR oversizing can reach as much as , whereas, in places with lower irradiation variability, such as central Chile, oversizing is closer to . Moreover, the continuous drop on PV module prices have encouraged the increase of ILR in PV plants [3]; some authors have even proposed ILR oversizing up to [4].
When an oversized PV array reaches the power rating of the converter, the converter loses the ability to increase its current and therefore is unable to reduce the DC-link voltage and loses the ability to track the Maximum Power Point (MPP). This behavior is called clipping, and it forces the system to waste available PV power. Clipped power is the name assigned to this wasted power. Figure 1 presents a grid-tied central inverter PV plant with PV array oversizing, where the available PV power is truncated at the rating of the inverter (clipped), limiting the exported PV power. Both power curves were normalized to the inverter rating.
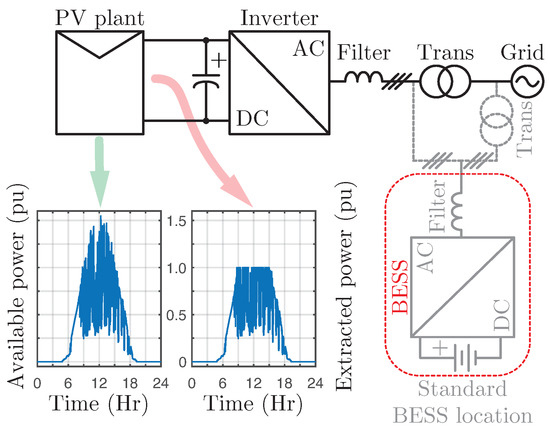
Figure 1.
Central inverter grid-tied PV plant with additional Battery Energy Storage System (BESS).
Generation–demand matching paradigm, where intermittency and high variability of renewable resources play a major role, can be achieved by relying on other systems connected to the electrical network and/or by the addition of an Energy Storage System (ESS). The first solution is not suitable for harnessing clipped power, since it requires the clipped power to be transferred to the electric network through the inverter, which is already operating at its rated power. The latter solution presents a more promising alternative to enhance existing PV plants, enabling them to harness clipped power. This solution has been widely researched as an alternative not only to deal with generation–demand mismatch, but also as means for renewables to provide complementary services, such as load shifting [5], global maximum power point tracking [6] and peak-shaving [7]. Note that the standard location for ESSs is, as shown in Figure 1, beside the transformer (before [8] or after [9]).
Sizing the ESS is a fundamental part of designing a tailored solution to handle clipped power. ESS sizing strategies for PV applications have been previously proposed in the literature: in [10,11], sizing strategies to comply maximum power ramp rate regulation were proposed; in [12], a sizing strategy to provide support for household PV applications; in [5], a sizing strategy to balance the peak and off-peak electricity consumption; and, in [13], a sizing strategy for smoothing power output and storing clipped power at PV plant level. This latter sizing strategy consists on averaging the PV power beyond a certain power limit (clipping level), hence hiding power dynamics to the sizing process. Additionally, the analysis is based on a single sunny day. It must be noted that the power limitation is imposed by contract with the grid operator. In addition, this sizing strategy aims at providing a concentrated solution for a full PV plant, where energy storage is connected at the point of common coupling and inverter ratings are not a limitation for the power exceeding PV plant.
A much wider variety of ESS sizing can be found in the literature related to wind power applications. In [14], a sizing strategy to maximize service-hours per BESS unit cost is presented. The strategy forecasts power generation based in long term historic data and statistical noise; this prediction is then low pass filtered, allowing to obtain an ESS power reference curve, which is later processed by a cost function obtaining the ESS energy rating. Nevertheless, low pass filtering generates phase delay depending on frequency, consequently reshaping the power curve and leading to over or under sizing of the ESS. A sizing strategy to minimize penalties caused by not complying day-ahead power bidding is presented in [15]. The strategy generates 25 initial ESS power references by subtracting bid power from 43-hour-power generation forecasts. The initial references are then presented in a histogram, together with a compliance level, which can be used to generate the ESS sizing. The power generation forecast and bidding strategy are not described in the paper. Moreover, this method considers a 43-hour horizon, which is not ideal for PV systems’ daily cycles. A hybrid ESS sizing strategy to comply with maximum power ramp rate regulation is presented in [16]. For this purpose, wind forecast and uncertain load behavior are subtracted, generating a power reference which is later transformed into frequency-domain by Discrete Fourier Transform (DFT). The result is later separated into low, medium and high frequencies, corresponding to the desired power output, the power reference for BESS and the power reference for Supercapacitors, respectively. However, DFT strategy decomposes the full signal into periodic sinusoids losing information regarding the time location of frequencies, therefore leading to a wrong sizing of the ESS. Another strategy to size a hybrid ESS while complying with maximum power ramp rate is proposed in [9]. Here, several historical datasets are filtered by wavelet discrete transform, generating a maximum power ramp rate compliant power curve. ESS power reference curve is obtained by averaging the differences between all original curves and their filtered version. The result is later filtered selecting high and low frequencies as supercapacitors and BESS power references, respectively. The strategy relies on averaging the results, hence masking some dynamic behaviors.
This document presents an analysis of the annual power generated by a PV plant. An analytical model was applied to estimate annual clipping losses. An ESS sizing strategy, based in historic data, was proposed; this strategy considers efficiency of the technology (energy storage technology and power electronics) and provides ESS energy and power sizing, required to recover a certain percentage of the annual clipped power. Additionally, configuration and control strategies were proposed to retrofit an existing PV plant, in order to handle clipped power without modifying the existing MPPT strategy. To validate, at power converter level, the technical feasibility of performing the clipping energy storage service, real PV system and power converters models including control strategies were simulated. The simulations shows specifically that existing central inverter based PV plants can be retrofitted to perform this service (without modifications to the central inverter topology and control). Moreover, the study provides an insight into the daily and seasonal behavior of PV power generation, hence suggesting the advantage of additional usage of ESS, as ancillary services, during idle hours.
To the best knowledge of the authors, the estimation of clipped power, the ESS sizing strategy, the proposed ESS configuration enabling fully usage of a Battery ESS (BESS) and the proposal of a control strategy to harness such power, are novel.
The document is arranged as follows: Section 2 presents a brief description of problem. Section 3 describes the PV model applied to estimate available MPP and a comparison between predicted power and empiric power measurements. Section 4 section presents the ESS sizing strategy. The selection of an Energy Storing Technologies (ESTs), capable of handling clipped power, is presented in Section 5. The control strategy, configuration and simulation of the ESS connected to the PV plant is presented in Section 6.
2. Problem Description
To emphasize the consequences of oversizing the PV array and highlight the effects of clipping, data from a PV plant located in UK with PV array oversizing is presented in Figure 2. This PV plant has an empiric annual plant factor of ; if oversizing was neglected a yearly plant factor of would have been obtained instead. A year of PV power generation from a central inverter grid-tied PV plant is shown in Figure 2a, where the installed capacity of the PV array is 2 MW, while the DC rating of inverter is MW. Power measurements were taken at the DC side of the inverter once per minute during a full year, from 1 October 2016 to 30 September 2017. These measurements have been normalized with respect to the inverter rating. The surface presented in Figure 2b (lateral view of Figure 2a) is equivalent to overlapping all daily DC power generation curves, showing the power limitation, hereafter power clipping, caused by the power-oversized PV array reaching the power rating of the inverter. Seasonal behavior is shown in Figure 2c,d, where yearlong dawn, dusk and daily maximum power generation are presented. These characteristics were exploited to propose alternatives to obtain further usage and revenue from the ESS. Autumnal (Autumn) Equinox, Summer Solstice, Vernal (Spring) Equinox and Winter Solstice are identified in Figure 2c,d with the abbreviations AE, SS, VE and WS, respectively.
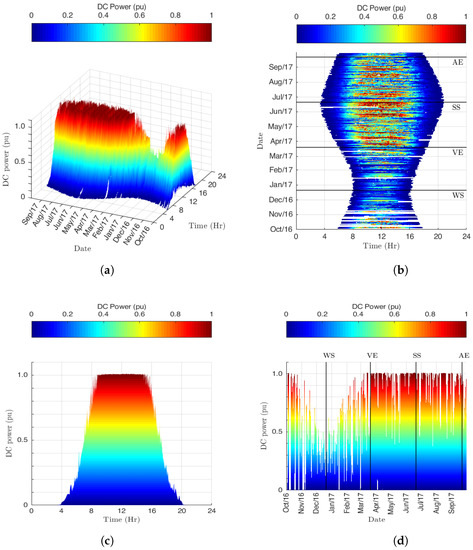
Figure 2.
PV plant power generation at the DC-side of a central inverter configuration, annual measurements taken every minute (1 October 2016 to 30 September 2017): (a) per day and per minute power generation; (b) daily power generation and dawn to dusk daily daylight (top view of Figure 2a); (c) overlapping of daily power generation (lateral view of Figure 2a); and (d) daily maximum generated power (lateral view of Figure 2a).
Irradiance, temperature and DC power measurements are the only data available for the PV plant located in UK. Since the power limitation applied to the system is imposed by the converter rating, power losses caused by clipping are neither estimated nor accounted for. Estimating those losses would result in a mandatory effort to assess clipping effects.
Proposed Sizing Strategy
The following steps correspond to the ESS sizing strategy applied to enable harnessing the PV plant clipped power.
- PV modeling selection: Select a model to estimate clipped power. For this purpose, an analytical model depending on irradiance, module temperature and PV module parameters was chosen. The model predicts the MPP, which is later limited (clipped) at the rating of the converter (clipping level) and compared to the DC power measurements from the PV plant. Four error metrics and additional features were considered to show the accuracy of the model.
- Clipped power estimation: Subtract the measured DC power from the selected model predicted DC power (not clipped) to estimate the clipped energy resulting from clipping the power curve. These calculations generate annual clipped power and energy curves with one minute spanning.
- ESS sizing: Analyze annual clipped power and energy curves. For this purpose, a statistical analysis of daily clipped power and power-limited daily clipped energy is presented. Power and energy sizing are performed by setting a recovery ratio of the annual clipped energy; from here, ESS energy and power ratings are obtained.
3. PV Plant Model
There are several modeling techniques that can be used to estimate maximum power generation from a PV plant, such as single diode circuital model [17], double diode circuital model [18], artificial neural networks [19] and analytic model [20]. An analytical modeling method was considered to estimate power loss due to clipping in a grid-tied PV plant.
To validate the model, one year of data (Figure 2) were compared to the power predicted by the model. Clipped DC power in kW, irradiance in , module temperature in measurements and PV module data sheet parameters were available. Uniform irradiance and temperature conditions among PV modules were considered to estimate the output power. A description of the analytical modeling method and a quantitative comparison, with the empiric data, is given below.
3.1. Analytical Model
This mathematical model predicts the MPP ( in W) as a function of the irradiance (G in ) and the module temperature (T in ).
where , , A, , , and are, respectively, the temperature coefficient of in [21] (or maximum power correction factor for temperature [20]), module temperature difference between the module temperature T and the STC module temperature in (), area covered by PV cells in , STC module efficiency, MPPT efficiency [22], number of modules in series in each string and number of strings in parallel. A similar alternative is presented in [20] where is replaced by .
3.2. Model Validation
The analytical model used to predict the clipped power was chosen, since it presents a low modeling error below clipping, presents a low model error compared data sheet stated STC, presents a low computational cost, does not require an optimization stage (neither parameter identification nor training) and is conceptually simple. The model prediction was clipped at the DC power rating of the converter to match the maximum DC power level (clipping level), and then the error between the clipped prediction and the measured DC power was calculated. The technical details applied to model the PV plant are presented in Table 1. PV modules correspond to the Jinko model JKM260-PP.

Table 1.
PV plant and PV modules parameters.
Figure 3 shows the irradiance, module temperature, DC power model predictions (clipped) and DC power measurements on four different days (18 March 2017, 3 June 2017, 10 August 2017 and 20 September 2017). The top plots in Figure 3a–d show the daily irradiance and temperature measurements, while the lower plots show the DC power (clipped) and measured DC power. The analytical model display an adequate tracking of the measured DC power; to present a complete analysis, some error metrics and other characteristics of the models were considered.
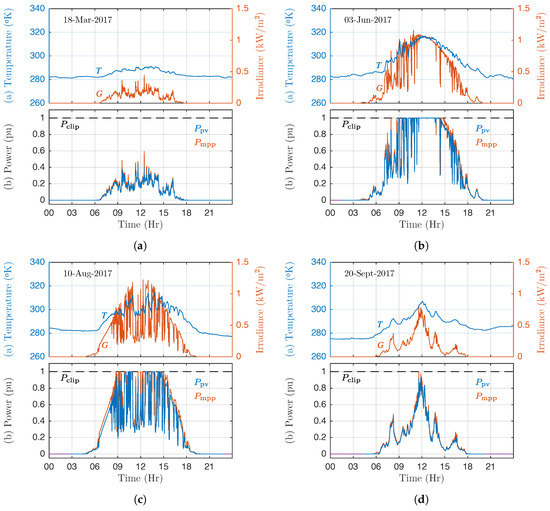
Figure 3.
Daily analysis of measured DC power versus models, top plot module temperature and irradiance daily measurements, bottom plot clipping level (), measured DC power () and analytical model estimated power (): (a) 18 March 2017; (b) 3 June 2017; (c) 10 August 2017; and (d) 20 September 2017.
The error metrics applied to validate the PV plant model were Normalized Root Mean Squared Error (), Normalized Mean Absolute Error (), Pearson linear correlation factor () and Normalized Root Mean Squared Error Fitness (). For the first two error metrics, and , the optimal value is , while, in the second pair of error metrics, and , the optimum is . Equations (2)–(5) correspond to the mathematical description of the metrics applied to analyze the error between the DC power measurement () and the clipped DC output power predicted by each model (). Variables , , and in Equation (4) correspond, respectively, to the mean of and , and the standard deviation of and . N corresponds to the number of samples. Normalized metrics were measured respect to the clipping power level ().
Table 2 summarizes the error metrics applied to the model. The analytical model presents a low calculation time, a simple approach and small errors metrics. Therefore, this method was chosen to predict PV clipped power. It is also useful for predicting the clipped power in real time.
Table 2.
Modeling error metrics.
Aging and soiling effects were not considered in the previously described analytical model, nonetheless the model enables a straight forward update by fitting the STC efficiency term () in Equation (1).
4. ESS Sizing
ESS are composed by a bidirectional power converter and an EST, such as batteries, super capacitors, flywheels, CAES, HPS, among others [23]. Energy restrictions are imposed by EST, while charging and discharging power ratings depend on both EST and the bidirectional converter. Some ESTs, such as batteries, usually present different charge vs discharge power ratings. In this application, ESS charge power rating is limited by the clipped power.
PV power generation is strongly dependant on solar irradiance and the module temperature. The PV module temperature behaves as a low pass filter of the incident irradiance, with an equivalent time constant of a few minutes depending on the wind speed [24]. In addition, according to Vernica et al. [25], the PV plant output power can be modeled as a low-pass filtered version of the solar irradiance, where the cut-off frequency of the equivalent filter is determined by the area of the PV plant. Specifically, for the PV plant being analyzed in this work, the cut-off frequency of the equivalent filter is Hz. Additionally, most grid code requirements related to power fluctuation (maximum power Ramp Rate) regulate power fluctuations per minute [26]. Moreover, standard PV plant available data range in sampling times between 1 and 30 min. Therefore, a data sampling rate of 1 min was selected to calculate the clipped energy and the ESS sizing strategy presented in this work.
Clipped power () is calculated according to Equation (6), where and are, respectively, the predicted PV power generation from Equation (1) and measured PV power, both in kW. The clipped energy in kWh is estimated according to Equation (7), where corresponds to the sampling time in min (1 min).
ESS for clipping in PV plants are designed for a daily use cycle (dawn to dusk), which means there is no need to store energy for more than one day, and therefore the stored energy is completely depleted before a new day cycle.
The following efficiencies were considered in the sizing of the ESS: a single stage DC-DC converter with efficiency [27] ( round-trip efficiency), new commercially available batteries present a round-trip efficiency of [28,29] and DC/AC inverter has a nominal efficiency of . Therefore, the energy passing through the ESS (PV to ESS and ESS to Grid) would experience an efficiency of .
Figure 4a shows a histogram of the maximum recoverable daily-energy-loss () due to clipping per amount of days of occurrence during a year, and two overlapped curves showing the accumulated annual energy loss (due to clipping) and the total recoverable annual energy (including efficiency of the PV-ESS-grid system of ). Both curves are function of the maximum recoverable daily-energy-loss and were normalized respect to the annual energy loss (33 MWh).
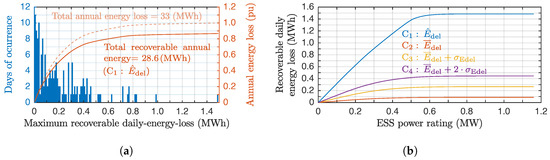
Figure 4.
PV plant ESS energy and power sizing analysis: (a) daily-energy-loss histogram, accumulated annual energy loss and total recoverable annual energy (considering the efficiency of the PV-ESS-grid system); and (b) power-limited recoverable daily energy considering the efficiency of the DC/DC power converter.
The power rating analysis is shown in Figure 4b, for the case where four ESS power rating design criteria are depicted as a function of the recoverable-daily-energy-loss. All criteria include a efficiency of the DC/DC power converter. The criteria to correspond respectively to maximum recoverable-daily-energy-loss in MWh (), average recoverable daily-energy-loss in MWh (), mean plus standard deviation of recoverable daily-energy-loss in MWh () and mean plus two times the standard deviation of recoverable daily-energy-loss in MWh ().
5. Energy Storage Technology Selection
ESS are formed by an EST and its power converter. This section focuses on selecting a suitable EST alternative to store clipped energy. According to the type of energy conversion and the nature of the stored energy, ESTs may be classified as electric, chemical, mechanical and thermal [30], as shown in Figure 5. The main characteristics of ESTs, relevant for clipping, are summarized in Table 3 [31,32,33]. For a detailws description of each ESTs from Figure 5, please refer to [33,34].
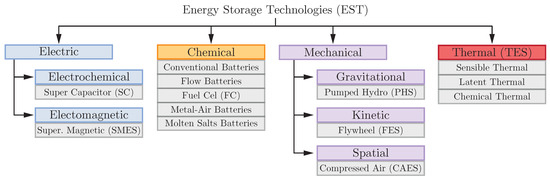
Figure 5.
Energy storage technologies classification.
Table 3.
Energy storage technologies specifications [31,32,33].
Based on round-trip efficiency and maturity level, the best EST alternatives for handling clipped power are SC, LiIon batteries and FES. Nonetheless, energy cost of FES doubles the energy cost of SC and LiIon batteries. Moreover, installation costs are not included in the table, although they depend on the weight of the equipment that needs to be transported. In addition, considering energy density, we have have concluded that LiIon batteries are an adequate EST technology to be applied to handle clipped power. The following section shows a simulation of a LiIon BESS applied to a PV system, for validation of the sizing methodology.
6. Simulation Results
This section presents the control strategy, configuration and simulation of the ESS connected to the PV plant. BESS was selected as EST to be emulated during the simulation, though the previously described sizing strategy is valid for any EST. BESS was selected due to its modularity, which allows retrofiting each PV inverter at their DC side, and because BESS combine both energy and power density required for this application.
6.1. Configuration
The original PV system consists on a central inverter grid-tied PV plant, connected to the grid through a standard two level voltage source inverter (2LVSI). The addition of the ESS, formed by a battery pack and a single-stage DC/DC converter as in [35], merged to the DC-link of the PV system, enables clipped energy to be stored and released according to the system requirements and limitations. Figure 6 shows a simplified version of the full configuration; colored arrows illustrate the possible power paths. The grey arrow corresponds to a continuous power flow (from PV to the grid), while the green (PV to ESS) and purple (ESS to the grid) arrows correspond to excluding and non necessarily continuous power flows.
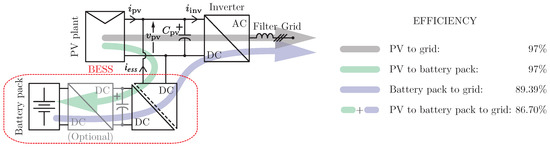
Figure 6.
Central inverter grid-tied PV configuration with additional single or double DC/DC stage ESS showing power flow paths and corresponding data sheet efficiency.
This configuration has a single stage DC/DC converter. However, as shown in Figure 6, the system can be implemented with a seconds DC/DC stage (marked as Optional). The difference between both alternatives lies in the percentage utilization of the capacity of the battery pack. A single DC/DC converter performing a standard battery charging strategy applies constant current (CC) charging mode until reaching a certain State of Charge (SoC), usually around . The addition of a second DC/DC stage allows the control of the output voltage of the converter, hence enabling to transition into constant voltage (CV) charging mode, and therefore allowing full charging of the battery. Storing clipped power requires withdrawing power from the DC-link, since the MPP tracking voltage is imposed by the inverter, thus clipped-storable power must be controlled through current.
The simulation results are focused on the control strategy that enables performing power extraction and injection to the DC-link, without modifying the existing control strategy of the inverter. This strategy depends on the SoC of the battery pack, which was estimated through standard Coulomb counting method [36]. This estimation is independent of the battery model applied since it relies in the output current of the battery pack, enabling the utilization of an ideal circuital model [37], to emulate the behavior of the EST.
6.2. Control Schemes
The central inverter was considered to be controlled through a standard voltage oriented control strategy with MPPT reference, as depicted in the control scheme in Figure 7 [38]. Since the objective is to retrofit an existing PV system, the addition of the ESS is performed at the DC-side of the inverter and does not consider modifying the PV system or its control strategy. It must be noted that the addition of an ESS at the point of common coupling would not allow harnessing the power loss caused by power clipping, since the inverter power limitation would remain an issue, which is not the situation in other similar cases that can benefit from the same ESS sizing strategy, such as power curtailment, where the power limit is imposed by the control strategy and not by the rating of the converter.
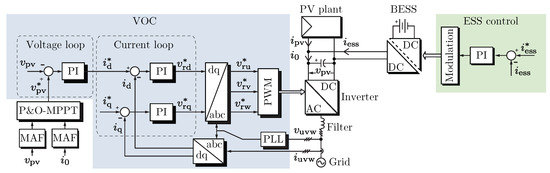
Figure 7.
Configuration control schemes: (left) Perturb and Observe MPPT and Voltage Oriented Control (VOC) scheme applied to the central inverter; and (right) CC charging mode controller scheme applied to the ESS.
Retrofitting forces the ESS control strategy to extract or inject power to the DC link without modifying the existing MPPT strategy of the PV inverter. For this purpose, a tailored ESS control strategy, shown in the flow chart in Figure 8, was designed. , , , , and correspond, respectively, to PV plant output power (), inverter input power (), ESS power (), estimated MPP according to Equation (1), clipping level, and pre-clipping level. This latter parameter is used as margin to perform power injection or subtraction to/from the DC link (). and correspond to the minimum and maximum ESS power. Cases I–V match those in Figure 9. This control strategy can be adapted to handle any EST. For this purpose, estimation of the ESS SoC value () in the control scheme of Figure 8 must be replaced by an estimation of the available energy in the applied EST.
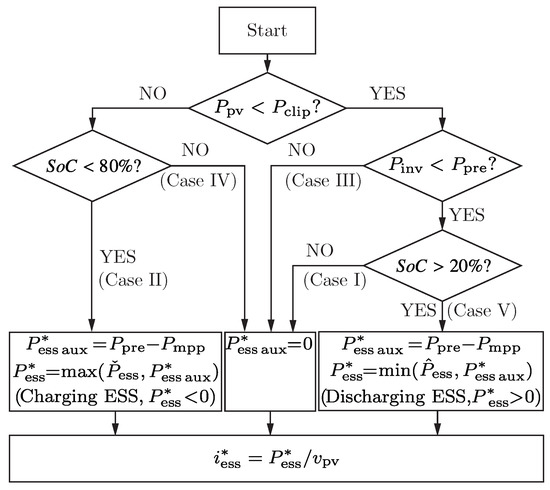
Figure 8.
ESS control strategy to enable storing and releasing of PV clipped power.
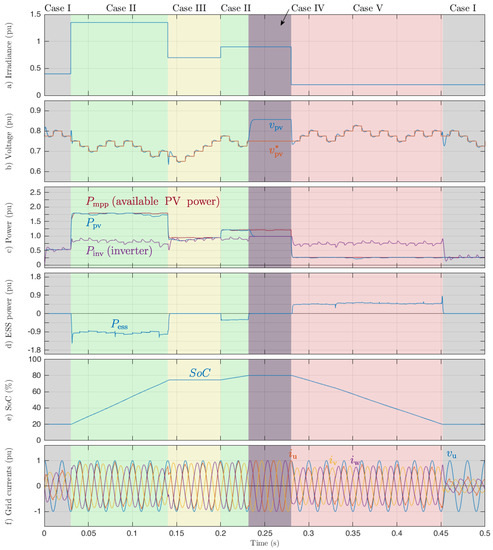
Figure 9.
PV plant with ESS connected at the DC-link simulation results: (a) irradiance in ; (b) DC-link voltage and reference; (c) generated PV power (), available PV power without considering clipping limitation ( (available PV power)) and inverter power ( (inverter)); (d) ESS power (); (e) ESS SoC (); and (f) grid currents (, and ) and phase u voltage ().
The ESS output current reference () is provided to a standard PI controller, generating the modulation index and switching pattern according to the power flow direction (storing or releasing energy). The SoC estimation was performed through standard Coulomb counting method [39].
6.3. Simulation
A simulation of the full system, formed by a 2LVSI operating as central inverter grid-tied PV system, and ESS formed by a Battery ESS (BESS) and an Isolated Bidirectional Boost Converter [35], is shown in Figure 9. The control strategies previously described in Section 6.2 were applied. It must be noted that the ESS was undersized to allow its control system to be tested in all possible scenarios and display those results in a single figure; this was performed considering the dynamics of the systems and an ESS operating range of 20– of the SoC. Several irradiance conditions were tested in the simulations, all with PV cell temperature of .
The PV plant parameters correspond to those presented in Table 1, while Table 4 presents the parameters of the converters and ESS. To calculate per-unit values in Figure 9, the following base values were considered: , kW, kA and V.
Table 4.
Simulation parameters.
From 0 to s (Case I), the system is operating at a power rating below (1540 kW) and the ESS is at a SoC level of , hence ESS power reference is zero. From to s (Case II), a step in solar irradiance causes the PV power () to reach , since , power reference is set to (and ), which reduces power flowing through the inverter () enabling MPP tracking. From to s (Case III), a step down in solar irradiance causes the PV power () to be lower than , but, since , the ESS power reference () is set to zero. From to s (Case II), a second step up in irradiance generates for the PV power to surpass , the system behaves exactly as from to s. Once the ESS reaches of the SoC, the ESS stops drawing power and the inverter losses momentarily the capability to track the MPP (Case IV from to s). Note that the ESS was undersized, to show the behavior of the system when reaching its maximum and minimum permitted SoC. From to 42 s (Case V), a step down in solar irradiance causes the PV power to be below pre clipping level (), and the ESS releases power towards the DC-link () and through the inverter into the grid. From to s, the ESS reaches of the SoC, hence power flow from ESS towards the DC-link is stopped and the system goes back to operating in Case I; in this part, grid currents show high harmonic content due the comparison of power flowing to the grid and power required to generate voltage steps to perform MPPT. In a real case, the MPPT period is longer, hence harmonic content would be lower.
7. Conclusions
The work described in this paper focused on the effects clipping, caused by oversizing a PV array with respect to the power rating of its converter. An insight into the benefits and drawbacks in terms of annual plant factor and energy losses of this commercial practice is presented. An analytical model was used to predict the annual power loss due to clipping; the validation of the model was performed by comparing the predicted power, limited at the clipping level, with real data over a time horizon of one year sampled every minute. An ESS sizing strategy based on recovering annual clipping losses is proposed. The strategy uses a power and energy approach, which considers statistical data to select the best fitting ESS ratings. For the analyzed PV plant, the sizing method determined that a ESS of 600 kWh per central inverter enables the retention of of energy that would be lost due to clipping. From a power perspective, each central inverter, rated at 1.4 MW, requires being retrofitted with a 200 kW DC-DC converter for the ESS to enable the aforementioned clipped energy storage. In relation to the EST, LiIon based BESS was selected to perform a validation of the ESS and control system due to comparison of several criteria (LiIon have 10 times higher energy density than FC, about half the cost of FES among other values). Simulation results at power electronics level of the ESS, the central inverter, the grid connection, and their control show that the selected ESS can be retrofitted to existing central inverters, and provide clipping energy storage while still performing properly (perform MPPT, store/deliver energy, retain a controlled DC link and inject energy to the grid with high power quality).
The proposed methodology and analysis can be applied to determine, depending on their plant measurements and parameters, the size of a ESS to retrofit their PV plant for clipping energy storage. This information is necessary to perform an economic assessment, and how it can impact the levelized cost of energy (LCOE), and assist in the decision-making process. In addition, the sizing methodology can be adapted to perform new analysis on other ESS applications such as: load shifting, power curtailment, frequency and voltage regulation, base load generation, capacity firming, etc., providing further value for the ESS to the retrofitting of a PV plant. Furthermore, provided the proper model and data, it can also be extended to other renewable energy sources, such as wind energy and ocean energy.
Author Contributions
N.M. conceived, designed and applied the sizing methodology, and wrote the original draft; S.K. provided insight, resources, and supervision and reviewed the manuscript; P.Z. provided insight, resources, supervision and analysis; P.W. provided relevant key theoretical and technical suggestions and reviewed the manuscript; G.B. contributed with mathematical modeling tools and insight; and F.G. provided experimental data, problem conceptualization and practical insight.
Funding
The authors gratefully acknowledge the financial support provided by FONDECYT 1191532, AC3E (CONICYT/BASAL/FB0008), SERC Chile (CONICYT/FONDAP/15110019), CONICYT-PCHA/Doctorado Nacional/2014-21141092, and PIIC of UTFSM.
Conflicts of Interest
The authors declare no conflict of interest.
Abbreviations
The following abbreviations are used in this manuscript:
| AC | Alternating Current |
| ANN | Artificial Neural Network |
| BESS | Battery Energy Storage System |
| CAES | Compressed Air Energy Storage |
| CC | Constant Current |
| CV | Constant Voltage |
| DC | Direct Current |
| DFT | Discrete Fourier Transform |
| ESS | Energy Storage System |
| EST | Energy Storage Technology |
| FES | Flywheel Energy Storage |
| ILR | Inverter Loading Ratio |
| LiIon | Lithium Ion Battery |
| MAF | Moving Average Filter |
| MPP | Maximum Power Point |
| MPPT | Maximum Power Point Tracking |
| NaS | Sodium-Sulphur Battery |
| NiCd | Nickel Cadmium Battery |
| NOCT | Normal Operating Cell Temperature |
| PbA | Lead Acid Battery |
| PHS | Pumped Hydro Energy Storage |
| P&O | Perturb and Observe |
| PV | Photovoltaic |
| SC | Super Capacitor |
| SMES | Super Conducting Magnetic Energy Storage |
| SoC | State of Charge |
| STC | Standard Test Condition |
| TES | Thermal Energy Storage |
| UK | United Kingdom |
| VOC | Voltage Oriented Control |
| VRB | Vanadium Redox Battery |
| ZBB | Zinc Bromine Battery |
| 2LVSI | Two Level Voltage Source Inverter |
References
- Hales, D. REN21. Renewables 2018-Global Status Report. Available online: http://www.ren21.net/gsr-2018/ (accessed on 2 May 2019).
- BEIS. Digest of United Kingdom Energy Statistics 2018; Department for Business, Energy & Industrial Strategy: London, UK, 2018; p. 260. [CrossRef]
- Serdio Fernández, F.; Muñoz-García, M.A.; Saminger-Platz, S. Detecting clipping in photovoltaic solar plants using fuzzy systems on the feature space. Sol. Energy 2016, 132, 345–356. [Google Scholar] [CrossRef]
- Good, J.; Johnson, J.X. Impact of inverter loading ratio on solar photovoltaic system performance. Appl. Energy 2016, 177, 475–486. [Google Scholar] [CrossRef]
- Ke, B.R.; Ku, T.T.; Ke, Y.L.; Chung, C.Y.; Chen, H.Z. Sizing the Battery Energy Storage System on a University CampusWith Prediction of Load and Photovoltaic Generation. IEEE Trans. Ind. Appl. 2016, 52, 1136–1147. [Google Scholar] [CrossRef]
- Muller, N.; Kouro, S.; Renaudineau, H.; Wheeler, P. Energy storage system for global maximum power point tracking on central inverter PV plants. In Proceedings of the 2016 IEEE 2nd Annual Southern Power Electronics Conference (SPEC 2016), Auckland, New Zealand, 5–8 December 2016. [Google Scholar]
- Dong, J.; Gao, F.; Guan, X.; Zhai, Q.; Wu, J. Storage Sizing With Peak-Shaving Policy for Wind Farm Based on Cyclic Markov Chain Model. IEEE Trans. Sustain. Energy 2017, 8, 978–989. [Google Scholar] [CrossRef]
- Luo, F.; Meng, K.; Dong, Z.Y.; Zheng, Y.; Chen, Y.; Wong, K.P. Coordinated operational planning for wind farm with battery energy storage system. IEEE Trans. Sustain. Energy 2015, 6, 253–262. [Google Scholar] [CrossRef]
- Jiang, Q.; Hong, H. Wavelet-Based Capacity Configuration and Coordinated Control of Hybrid Energy Storage System for Smoothing Out Wind Power Fluctuations. IEEE Trans. Power Syst. 2013, 28, 1363–1372. [Google Scholar] [CrossRef]
- Zhao, Q.; Wu, K.; Khambadkone, A.M. Optimal sizing of energy storage for PV power ramp rate regulation. In Proceedings of the 2016 IEEE Energy Conversion Congress and Exposition (ECCE), Milwaukee, WI, USA, 18–22 September 2016; pp. 1–6. [Google Scholar] [CrossRef]
- Galtieri, J.; Krein, P. Solar Variability Reduction Using Off-Maximum Power Tracking and Battery Storage. In Proceedings of the 2017 IEEE 44th Photovoltaic Specialist Conference (PVSC), Washington, DC, USA, 25–30 June 2017; pp. 1–4. [Google Scholar] [CrossRef]
- Aichhorn, A.; Greenleaf, M.; Li, H.; Zheng, J. A cost effective battery sizing strategy based on a detailed battery lifetime model and an economic energy management strategy. In Proceedings of the 2012 IEEE Power and Energy Society General Meeting, San Diego, CA, USA, 22–26 July 2012; pp. 1–8. [Google Scholar] [CrossRef]
- Rallabandi, V.; Akeyo, O.M.; Jewell, N.; Ionel, D.M. Incorporating battery energy storage systems into multi-MW grid connected PV systems. IEEE Trans. Ind. Appl. 2019, 55, 638–647. [Google Scholar] [CrossRef]
- Li, Q.; Choi, S.S.; Yuan, Y.; Yao, D.L. On the determination of battery energy storage capacity and short-term power dispatch of a wind farm. IEEE Trans. Sustain. Energy 2011, 2, 148–158. [Google Scholar] [CrossRef]
- Pinson, P.; Papaefthymiou, G.; Klöckl, B.; Verboomen, J. Dynamic sizing of energy storage for hedging wind power forecast uncertainty. In Proceedings of the 2009 IEEE Power & Energy Society General Meeting, Calgary, AB, Canada, 26–30 July 2009; pp. 1–8. [Google Scholar] [CrossRef]
- Makarov, Y.V.; Du, P.; Kintner-Meyer, M.C.W.; Jin, C.; Illian, H.F. Sizing energy storage to accommodate high penetration of variable energy resources. IEEE Trans. Sustain. Energy 2012, 3, 34–40. [Google Scholar] [CrossRef]
- Ding, K.; Bian, X.; Liu, H.; Peng, T. A MATLAB-simulink-based PV module model and its application under conditions of nonuniform irradiance. IEEE Trans. Energy Convers. 2012, 27, 864–872. [Google Scholar] [CrossRef]
- Masmoudi, F.; Ben Salem, F.; Derbel, N. Single and double diode models for conventional mono-crystalline solar cell with extraction of internal parameters. In Proceedings of the 13th International Multi-Conference on Systems, Signals & Devices (SSD 2016), Leipzig, Germany, 21–24 March 2016; pp. 720–728. [Google Scholar] [CrossRef]
- Lopez-Guede, J.M.; Ramos-Hernanz, J.A.; Zulueta, E.; Fernadez-Gamiz, U.; Oterino, F. Systematic modeling of photovoltaic modules based on artificial neural networks. Int. J. Hydrogen Energy 2016, 41, 12672–12687. [Google Scholar] [CrossRef]
- Mellit, A.; Saglam, S.; Kalogirou, S. Artificial neural network-based model for estimating the produced power of a photovoltaic module. Renew. Energy 2013, 60, 71–78. [Google Scholar] [CrossRef]
- JinkoSolar. PV Module JKM260PP Datasheet. Available online: https://www.jinkosolar.com/ (accessed on 2 May 2019).
- Pakkiraiah, B.; Sukumar, G.D. Research Survey on Various MPPT Performance Issues to Improve the Solar PV System Efficiency. J. Sol. Energy 2016, 2016, 1–20. [Google Scholar] [CrossRef]
- Díaz-González, F.; Sumper, A.; Gomis-Bellmunt, O.; Villafáfila-Robles, R. A review of energy storage technologies for wind power applications. Renew. Sustain. Energy Rev. 2012, 16, 2154–2171. [Google Scholar] [CrossRef]
- Armstrong, S.; Hurley, W.G. A thermal model for photovoltaic panels under varying atmospheric conditions. Appl. Therm. Eng. 2010, 30, 1488–1495. [Google Scholar] [CrossRef]
- Vernica, I.; Wang, H.; Blaabjerg, F. Impact of Long-Term Mission Profile Sampling Rate on the Reliability Evaluation of Power Electronics in Photovoltaic Applications. In Proceedings of the 2018 IEEE Energy Conversion Congress and Exposition (ECCE 2018), Portland, OR, USA, 23–27 September 2018; pp. 4078–4085. [Google Scholar] [CrossRef]
- Martins, J.; Spataru, S.; Sera, D.; Stroe, D.I.; Lashab, A. Comparative Study of Ramp-Rate Control Algorithms for PV with Energy Storage Systems. Energies 2019, 12, 1342. [Google Scholar] [CrossRef]
- Tame Power. Smart DC/DC Converter Reversible COMET productline—Liquid Cooled Version. Available online: https://www.tame-power.com/sites/tame-power.com (accessed on 2 May 2019).
- LG Chem. Resu Data Sheet. Available online: https://www.europe-solarstore.com/storage-and-system-solutions/solar-storage-batteries/lg-chem/lg-chem-resu-10h-400v-lithium-ion-storage-battery.html (accessed on 2 May 2019).
- BYD. New Energy. Available online: http://www.byd.com/en/NewEnergy.html (accessed on 2 May 2019).
- Luo, X.; Wang, J.; Dooner, M.; Clarke, J. Overview of current development in electrical energy storage technologies and the application potential in power system operation. Appl. Energy 2015, 137, 511–536. [Google Scholar] [CrossRef]
- Khodadoost Arani, A.A.; Gharehpetian, G.B.; Abedi, M. Review on Energy Storage Systems Control Methods in Microgrids. Int. J. Electr. Power Energy Syst. 2019, 107, 745–757. [Google Scholar] [CrossRef]
- Wong, L.A.; Ramachandaramurthy, V.K.; Taylor, P.; Ekanayake, J.B.; Walker, S.L.; Padmanaban, S. Review on the optimal placement, sizing and control of an energy storage system in the distribution network. J. Energy Storage 2019, 21, 489–504. [Google Scholar] [CrossRef]
- Nadeem, F.; Hussain, S.M.; Tiwari, P.K.; Goswami, A.K.; Ustun, T.S. Comparative review of energy storage systems, their roles, and impacts on future power systems. IEEE Access 2019, 7, 4555–4585. [Google Scholar] [CrossRef]
- Chen, H.; Cong, T.N.; Yang, W.; Tan, C.; Li, Y.; Ding, Y. Progress in electrical energy storage system: A critical review. Prog. Nat. Sci. 2009, 19, 291–312. [Google Scholar] [CrossRef]
- Muller, N.; Renaudineau, H.; Flores-Bahamonde, F.; Kouro, S.; Wheeler, P. Ultracapacitor storage enabled global MPPT for photovoltaic central inverters. In Proceedings of the 2017 IEEE 26th International Symposium on Industrial Electronics (ISIE), Edinburgh, UK, 19–21 June 2017; pp. 1046–1051. [Google Scholar] [CrossRef]
- Nayak, A.; Kasturi, K.; Nayak, M.R. Cycle-charging dispatch strategy based performance analysis for standalone PV system with DG & BESS. In Proceedings of the 2018 Technologies for Smart-City Energy Security and Power (ICSESP), Bhubaneswar, India, 28–30 March 2018; pp. 1–5. [Google Scholar] [CrossRef]
- Sparacino, A.R.; Reed, G.F.; Kerestes, R.J.; Grainger, B.M.; Smith, Z.T. Survey of battery energy storage systems and modeling techniques. In Proceedings of the 2012 IEEE Power and Energy Society General Meeting, San Diego, CA, USA, 22–26 July 2012; pp. 1–8. [Google Scholar] [CrossRef]
- Muller, N.; Kouro, S.; Zanchetta, P.; Wheeler, P. Bidirectional partial power converter interface for energy storage systems to provide peak shaving in grid-tied PV plants. In Proceedings of the 2018 IEEE International Conference on Industrial Technology (ICIT), Lyon, France, 20–22 February 2018. [Google Scholar] [CrossRef]
- Chang, W.Y. The State of Charge Estimating Methods for Battery: A Review. ISRN Appl. Math. 2013, 2013, 1–7. [Google Scholar] [CrossRef]
© 2019 by the authors. Licensee MDPI, Basel, Switzerland. This article is an open access article distributed under the terms and conditions of the Creative Commons Attribution (CC BY) license (http://creativecommons.org/licenses/by/4.0/).