Abstract
Little is known about how renewable energy cooperatives (REScoops) try to influence energy conservation among households and the resulting impact. In this article the main research question is: What is the predictive value of renewable energy cooperatives on intention to save energy, engagement in energy-saving actions, and self-reported energy conservation by households? A survey was conducted to answer this question. Data analysis involved multivariate and binary logistic regression on data from two cooperatives: Ecopower (Belgium; N = 1000) and Enercoop (France; N = 8290). Results show that in addition to psychological and socio-demographic variables, REScoop items modestly contribute to the explained variation in engagement in energy-saving actions and reported energy conservation. At Enercoop 18.2% of the respondents indicated that their cooperative contributed to household energy savings; for Ecopower this figure was 36.9%. Moreover, at Enercoop, 38.7% of the respondents reported consuming less energy since obtaining cooperative membership; at Ecopower this was 64.7%. The article concludes with suggestions for future research.
1. Introduction
In light of economies facing the energy trilemma and increased global warming, decreasing energy demand has become ever more urgent. As the residential sector comprises 27% of global energy consumption and 17% of total CO2 emissions, it is important for policy makers to target this sector using effective interventions to drastically conserve vast amounts of energy and mitigate climate change [1]. In an article published in Nature Energy, Stern et al. [2] argue that direct fossil fuel consumption by US households can be reduced by up to 20% in a decade with conventional technology, assuming that the most effective, proven, and non-regulatory interventions are implemented [3]. A similar potential may apply to other high-income countries [4]. Achieving such reductions depends on, to a great extent, the implementation of certain interventions. Interventions have, however, been implemented with varying degrees of success. Energy consumption reductions are typically well below 20%, and there often are only short-term effects. Although policy makers are giving much attention to interventions that target lowering of household energy consumption, numerous academic studies have shown that this remains challenging (e.g., [5,6,7]).
In recent years, energy markets have witnessed the emergence of citizen-led low-carbon energy initiatives [8,9,10,11,12,13,14]. These energy initiatives consist of citizens who jointly seek to produce and consume sustainable energy locally, and many emerge in cohesive social communities with high trust levels [15]. Most of these initiatives reject the use of centralized fossil fuel and nuclear energy productions, and they embrace local egalitarian values [8,16]. A growing number of scholars argue that community energy initiatives are increasingly important players in sustainable energy generation and energy-saving efforts [11,17,18,19]. They are particularly important in light of raising awareness among local communities and attracting public support for low-carbon energy and energy savings [20].
Community energy numbers have been steadily increasing over the last years. In 2016 REScoop.eu, the federation of renewable energy cooperatives in Europe, accounted for 1500 cooperatives across Europe, which included membership of over 1 million citizens [21]. In the Netherlands, there were 392 local cooperatives in 2017, with a total membership of over 60,000 citizens (an increase from 332 and 50,000, respectively, in 2016) [22]. And in France and Belgium, there are very large-sized cooperatives (i.e., Ecopower, Belgium: 48,883 members; Enercoop, France: 42,000 members [23]. Both of them have also become professional energy suppliers.
Rather than profit-seeking firms, citizen-led low-carbon initiatives are grounded in local and collective values and structures. Their resources entail voluntary input, grant funding, and reciprocal relations [20]. Most citizen-led low-carbon initiatives organize themselves in what is also referred to as ‘renewable energy cooperatives’ (REScoops). REScoop.eu, the federation of European renewable energy cooperatives, defines renewable energy cooperatives as “groups of citizens who organize themselves to collectively take action to foster the use of renewable energy and increase energy efficiency standards” [21]. In their quest to increase energy efficiency standards they also engage in other activities, like persuading their members to conserve energy (e.g., [8,24,25,26]). However, when compared to supplying renewable energy, cooperatives targeting energy conservation have attracted considerably less academic attention. For instance, there are no quantitative studies that have yet addressed to what extent members of renewable energy cooperatives succeed in conserving energy since obtaining membership. And neither are there studies addressing whether actual energy savings result from interventions by these cooperatives.
Moreover, there is only a limited number of academic articles addressing community energy or renewable energy cooperatives using a quantitative research design. Within the few articles published, there are basically two types of quantitative studies. The first type concerns surveys among community energy initiatives, in which community energy organizations are the units of observation. In these studies, general information on initiatives is collected and reported, providing information on renewable energy projects, size of membership, activities undertaken, and the meaning and contextual characteristics in which these initiatives find themselves [27,28,29]. The second type of studies concern surveys in which the units of observation are householders, and data is collected on motivations for membership, membership characteristics, and social involvement and participation in community energy. The dependent variable in these studies is typically participation in community energy projects [18,30,31,32,33]. From the two types of quantitative research on community energy, only the first one addresses energy conservation, but merely as actions undertaken by cooperatives at the organizational level. In both types of research there is no attention to the impact of actions and interventions implemented by cooperatives on energy conservation among their members.
This article taps into this knowledge gap. It addresses the extent to which members of renewable energy cooperatives have the intention to save energy, engage in energy-saving action, and report energy savings. By conducting a quantitative analysis, we seek to examine the extent to which the three are influenced by renewable energy cooperatives. Therefore, the main research question of this article is: What is the predictive value of renewable energy cooperatives on intention to save energy, engagement in energy-saving actions, and self-reported energy conservation by their members?
This article is structured as follows: in Section 2, an overview is presented of factors that influence householders’ energy consumption and conservation. Section 3 presents research design and methodology. In Section 4, the results of the statistical analyses are presented. Next, in Section 5 the results of the survey are discussed. Finally, in Section 6 conclusions and suggestions for further research are presented.
2. Household Energy Consumption and Renewable Energy Cooperatives
2.1. General Predictors of Energy Consumption and Conservation in Households
Households use energy in direct and indirect ways [34]. Academic studies mostly focus on direct energy use. Households use energy for different purposes. Moreover, household activities vary widely in the amount of energy they use [35]. For households, energy conservation can be viewed as the effort made to reduce the consumption of energy. This can be achieved by using energy more efficiently or by reducing energy demand (i.e., lowering services and actions that require the use of energy). Behaviors related to energy conservation can be categorized into curtailment behavior and efficiency behavior. The former concerns ongoing day-to-day actions to reduce consumption, such as setting thermostats or switching off lights when leaving home. The latter concerns one-time actions to save energy, such as investing in home improvements like thermal insulation or energy-efficient appliances [7,34].
Frederiks et al. [7] discern two broad categories of variables that generally explain variation in energy consumption patterns and energy conservation: (i) socio-demographic and (ii) psychological factors. Socio-demographic predictors entail individual factors like income, gender, and education, but they also entail home-related characteristics like home ownership, size, and type of dwelling. For example, gender might influence energy efficiency behavior because women might have different views from men; therefore, they behave and decide differently [36]. Financially, women tend to be more risk-averse than men [37]; therefore, they are less willing to engage in adoption of energy equipment that requires high upfront investment. Another indicator of relevance of gender and energy is the underrepresentation of women in organizations within the energy sector [38]. Psychological factors concern items like beliefs and attitudes, subjective norms, intentions, perceived behavioral control, and social norms. Generally speaking, they adhere to the main concepts of the Theory of Planned Behavior [39], which theorizes that behavior can be predicted by personal attitudes, subjective norms, perceived behavioral control, and behavioral intention. According to the theory, one first sets an intention to save a certain amount of energy, and then engages in energy-saving behaviors to achieve the intentional energy saving goal(s) set.
Empirical studies, however, reveal that household energy consumption appears to be related to socio-demographic variables (e.g., income, household size, age), while attitudinal variables and self-transcendence values (like tradition, security and power, and achievement) are also important. Notwithstanding, intention to reduce household energy use is positively related to perceived behavioral control and attitudes toward energy conservation [40].
Frederiks et al. [7] argue that empirical evidence in support of hypotheses based on socio-demographic and psychological factors are hardly consistent, and they are inconclusive. Next to socio-demographic and psychological factors, there are situational factors that should not be disregarded such as policies, regulations, technology, pricing, information, culture, and social practices. Situational factors may influence individual motivations and facilitate or constrain energy conservation [35]. Studies have revealed that laws, regulations, neighborhood factors, geographical locations, and personal comfort are significantly related to household energy consumption [7]. Other important factors that might influence energy consumption or conservation concern culture and lifestyle [41,42,43]. Renewable energy cooperatives, and the social environment and practices they create, can arguably also be perceived as situational factors.
For interventions targeting behavioral change in household energy use, a taxonomy was developed by Abrahamse et al. [5], which discerns antecedent from consequence strategies. Interventions adhering to antecedent strategy try to influence one or more behavioral determinants prior to the performance of energy-saving behavior. Examples are goal setting, commitment, information provision, and modelling (i.e., using role models). Interventions adhering to consequence strategy try to influence behavioral determinants after the occurrence of the energy-saving behavior by providing feedback on consequence outcomes after the occurrence of the behavior. Examples are electronic billing, using online client accounts, and smart metering. Consequence strategies—i.e., offering rewards, or providing feedback—are based on the assumption that the presence of positive or negative consequences will influence behavior because it will make energy saving more attractive.
Studies that analyzed the effect of feedback about the price difference between on- and off-peak hours—using variable tariffs—found this to result in shifts in consumption to off-peak hours, but no difference in overall consumption was found or reported [5,44,45]. Monetary incentives to promote reductions in household fossil-energy use are only seldom implemented on their own. They are usually implemented as part of a package of supplementary strategies [46]. Whereas they are often successful in changing behavior in the short term, there are also downsides; (i) they may lead to rebound effects, (ii) the incentive is not worth the effort, and (iii) incentives may crowd out intrinsic motivations. To cope with these downsides, [46] points to the usage of other interventions like home energy audits, social rewards and social norms feedback. A study by [47] reviewed the influence of non-price interventions—i.e., four nudge-like interventions referred to as social comparison, commitment devices, goal setting, and labelling—and found that all had the potential to significantly reduce energy consumption of private households, yet, the effect size varied.
Feedback is a necessary element in learning how to control energy use more effectively over a long period of time. Instantaneous, direct feedback in combination with frequent, accurate billing (a form of indirect feedback) is needed as a basis for sustained demand reduction [48]. Feedback about individual performance, relative to the performance of others, may be helpful in encouraging energy conservation. By providing household members with feedback on how they are doing as a group, social norms in favor of a certain pro-environmental behaviors may become salient. Similarly, by giving comparative feedback about how a group of individuals is doing relative to other groups may evoke feelings of social comparison [35]. Savings from indirect feedback (e.g., billing) range between 0%–10% [48]. Results of studies using feedback seem to suggest that the more frequent the feedback is given, the more effective it is [40]. Relevant features of feedback that may determine its effectiveness are frequency, duration, content, breakdown, medium and way of presentation, comparisons, and combination with other instruments [49].
When concerning feedback via metering and direct displays, energy savings are in the range of 5%–15% [48]. Most research on direct feedback addresses the engagement of householders with in-home displays (IHDs) on which they can view their energy consumption and can get direct feedback. Ideally, feedback is given immediately after the behavior occurs, because households need to understand the relationship between the feedback and their behavior. IHDs can support energy consumption reduction, but engagement with IHDs can be limited to men and is often short-term. However, results show that community action support and long-term engagement with energy consumption feedback, including engagement by women, can support behavioral change [50]. In-home displays are promising for encouraging energy conservation, but careful consideration should be given to the way the feedback is framed [51]. When concerning direct feedback from smart energy monitors, context factors are fundamental in understanding the extent to which change effects will be negotiated and realized [52]. Gupta et al. [53] studied visual energy feedback techniques (carbon mapping, thermal imaging) at different scales, alongside traditional methods (web-based energy and environmental visualization platform, home energy reports) delivered through community workshops, home visits, and the internet, across six low-carbon communities. They found that most of the feedback approaches were able to engage and raise awareness amongst the individual householders. Thermal imaging was successful in engaging individual local residents, especially when home reports were included. However, data-driven, web-based platforms had limited uptake because there was an online log-in requirement and information overload [53].
In general, interventions are more effective when they are tailored to the target population [5]. This applies when interventions complementing each other are combined into integrated approaches. Combinations of interventions are generally more effective than single interventions. It makes sense to the extent that different people may have different barriers to change [54]. A combination of antecedent (e.g., information) and consequence strategies (e.g., feedback) is generally required. Moreover, informational and structural strategies complement each other [35].
2.2. Ways in which REScoops Influence Their Members to Conserve Energy
Using a cooperative model, renewable energy cooperatives offer a democratic and locally organized alternative to conventional energy suppliers and energy service suppliers. As compared to other actors in the energy value chain, they have certain benefits when offering energy services to householders, particularly because of their embeddedness in social structures [8,10,55]. This gives them the opportunity to use social ties to persuade local householders to join their renewable energy cooperatives, to participate in their activities, and persuade them to either lower their energy consumption or adopt renewable energy (e.g., by having solar panels installed on the rooftops of the homes they occupy) [56]. The way and degree in which REScoops are able to use their social ties also depends on the community they are part of. For instance, ‘communities of place’ (i.e., social relationships embedded in a particular geographical context) are quite different from ‘communities of interest’ (social relations extend beyond specifically place-based networks), and henceforth require different engagement approaches [31].
To link household energy conservation behavior to the assumed influence of REScoop actions, we discern specified from unspecified measures in relation to the respondents’ behavior. Unspecified measures entail the general presumed influence of being a member and (indirectly) being exposed to REScoop actions and information. On the other hand, specific measures entail interventions to which cooperative members are more directly exposed (as a target group), often using a tailored approach.
We presume that the mechanism of REScoop influencing their members to attain certain goals (like saving energy) works as follows. REScoop membership potentially influences energy conservation for a number of reasons. Becoming a REScoop member (and/or customer) can be seen as making an informed choice; in other words, one chooses deliberately to engage in using green energy. The reason to become a REScoop member can be motivated by attitudes related to environmental or social (localized) concerns or by pragmatic financial or technical reasons, like the expectation to receive better service provision or more comfort. A survey conducted by Naus et al. [57] showed that householders praised community energy initiatives for not having a profit-orientation and for generating innovative ideas. Furthermore, social and spatial proximity seem to make local initiatives attractive to targeting householders with energy efficiency measures (Ibid). This shows that it is not only environmentally motivated aspects that appeal to households, but also social and spatial aspects are appealing as well [32].
If one becomes a REScoop member, one receives information on the importance and ways to save energy. This could mean that the information level of REScoop members on the importance of renewable energy and possibilities to save energy increases after becoming a member, which could lead to a higher knowledge level (on renewable energy and energy-saving options). However, more information or awareness does not automatically mean that one also engages in actions to attain a certain goal (like saving a certain amount of energy). These actions, pertaining to REScoop membership, can be seen as a rather general way in which REScoop influences their members. However, there are also more specific actions that seek direct influence. Examples of specific actions undertaken by REScoop are awareness-raising campaigns, personal audits, IT platforms in which energy consumption is monitored and feedback is given to households, information workshops, installation of energy-efficient technology like smart meters, and programs REScoop members can participate in, offering both antecedent and consequence strategies. REScoop members participating in these actions can arguably be seen as deliberately choosing to become exposed to these measures.
An inventory of renewable energy cooperatives targeting household energy conservation revealed that REScoops mostly use antecedent strategies. Information tools used by REScoops were found to be rather similar to what other energy suppliers or governments and NGOs use. Consequence strategy interventions are used less frequently. They vary in providing direct and indirect feedback, and they are increasingly supported by online platforms and smart technology. Interventions deployed by cooperatives were also found to target multiple goals, e.g., awareness-raising, setting intentions to attain energy conservation goals, investment in RES projects, training householders in using energy equipment, professionalization, attracting new REScoop members, and increasing a householder’s experience of using energy-efficient technology [26,58]. In other words, cooperatives use multiple strategies in social environments that indirectly influence householders to conserve energy by targeting psychological drivers that influence energy-saving behaviors. In this sense, it is fair to state that next to using ways to directly influence their members, cooperatives also ‘nudge’ (i.e., indirectly; [59]) their members to set energy-saving intentions and engage in energy conservation behaviors.
Studies that show actual results of energy-saving actions by community energy initiatives (in terms of outcome) are limited. A study that does, however, was performed by Magnani and Osti [60] addressing the use of an economic incentive. The study revealed that as a result of an incentive rate for renewable energy production, a cooperative managed to ensure an average of 90–100 euros per year to shareholders, which resulted in energy savings of 25% on yearly electricity bills. Moreover, the study revealed the success of an economic incentive to which the members were subjected. In the event that a shareholder consumed less than the kW he or she had invested in, the cooperative would buy the non-consumed energy and sell it to the best buyer on the market. Therefore, the individual shareholder could regain some of the money invested (tax-free), and the cooperative could improve its economic surplus. In the end, 70% of its members consumed less than 3000 kWh. On average, a member of the cooperative managed to repay his or her electricity bills and earn about 10% of the invested capital per year [60].
2.3. REScoop Membership Factors Favouring Household Engagement with Energy Conservation Behaviours
Whether a REScoop succeeds in influencing its members to set energy-saving intentions, to engage in energy-saving actions, and to realize actual energy savings may depend on factors related to the cooperative itself and to factors related to membership of the cooperative. Factors related to REScoops concern the way members are engaged with REScoops as an organization. Are members, for instance, satisfied with the services provided by a REScoop? This assumes that the REScoops that enjoy a high reputation among their members are perceived as more capable of reaching and persuading their members than cooperatives with a low reputation or service delivery satisfaction rate (like customers do, in general regarding service delivery by an organization, while taking certain predispositions towards it into account; [61]). Another factor concerns the social environment created by the cooperative. Here, it might matter to members whether they experience a high trust level, assuming that cooperatives with high interpersonal trust levels are more capable to reach out to their members and persuade them to conserve energy. Walker et al. [27] even argue that trust has a necessary part to play in the contingencies and dynamics of community projects and in the outcomes they achieve. A study by Kalkbrenner and Roosen [32] showed that amongst other predictors (i.e., social norms, environmental concern, and community identity), trust is an important determinant of the willingness to participate in community energy.
In addition, if one’s peers are also cooperative members, one might be well-embedded in the social environment of the cooperative, and, hence, be more exposed to actions directly or indirectly targeting energy conservation by the cooperative. One way a REScoop can do this is by raising awareness and increasing the knowledge cooperative members have on energy consumption and behaviors related to lowering ones’ energy consumption. After all, education, training, and information is free to members of cooperatives [18]. Another factor that might be important for households to engage in energy conservation is whether they have friends and family who are (also) REScoop members. This might be for the reason that they pursue to conform to the behavior of others and gain acceptance and recognition [61]. Finally, length of membership may indicate how well one is engaged and embedded in a cooperative, pertaining to its social structure and institutions. The longer one is member of a cooperative the more familiar one is with its social environment, social practices, service provision, the activities it undertakes, the projects it develops, the investments it makes, and decision-making practices. Moreover, given that REScoops attract different types of members, which differ per ‘generation’, one can argue that members with long memberships (‘early generation members’) are the ones with high environmental concerns heavily engaged with production of (renewable) energy and living in ‘communities of place’, while members with short memberships (‘late generation members’) may also be driven by short-term financial motives and form ‘communities of interest’ [18,31].
3. Research Design and Methodology
3.1. Research Approach
In this study, a multi-national survey was conducted among members of multiple REScoops across Europe (N = 10,585). This survey was conducted among federations partaking in the REScoop Plus project (see Table 1), asking cooperative members about how they experience their REScoop trying to persuade them to conserve household energy (addressing both curtailment and efficiency behaviors).

Table 1.
Names of cooperatives participating in the REScoop Plus project (2017 survey).
3.2. Operationalisaton and Measurement
There are three sets of independent variables: (i) socio-demographic factors; (ii) psychological factors (in line with Frederiks et al., [7]); and (iii) factors related to REScoops. The latter was of main theoretical interest to the study presented in this article and indirectly covered the use of interventions by REScoop. The dependent variable was self-reported energy conservation by householders, differentiated into intention to save energy, engagement in energy-saving actions, and reported energy savings. Figure 1 presents a graphical depiction of the research model. Based on this research model we expected that, in addition to psychological and socio-demographic variables, variables related to REScoops contributed to explaining household energy conservation (i.e., to all three indicators: intention, energy-saving actions, and reported energy savings).
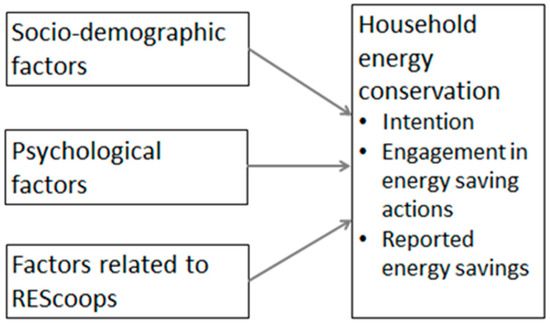
Figure 1.
Graphical depiction of the research model.
Table 2 presents an overview of the measurement of variables. For the scales, constructed information of the number of items used and Tau-equivalent reliability (also known as Cronbach’s alpha reliability) tests are presented (See also Appendix A for more details on the scale items). For the latter, 0.5 was used as a minimal threshold value. Items belonging to the ‘REScoop-related factors’ block pertained to the factors addressed in Section 2.3.
Table 2.
Measurement of variables.
3.3. Case Selection
From the survey, two REScoops were selected. Enercoop (France) and Ecopower (Belgium) represented the REScoops in the dataset with the highest response and the highest membership numbers (Enercoop: 42,000; Ecopower: 48,883). An additional reason for selecting these two REScoops was that they fairly differed from each other in terms of organization, business model, and orientation [23]. Moreover, both comprised both ‘communities of place’ and ‘communities of interest’, although Enercoop had relatively more ‘early generation’ cooperation members with pro-environmental, activist, and anti-nuclear attitudes. Ecopower, on the other hand, also was comprised of ‘late generation’ members whose main interest was financially motivated. This cannot be said of Enercoop, though, which members did not mind paying fairly higher than conventional electricity rates, on the condition that the supplied electricity stemmed from renewable sources.
Both Enercoop and Ecopower are federations of local and regional energy cooperatives, and both are also suppliers of green power. Next to having members, Enercoop and Ecopower also have customers. Ecopower is located in Flanders, in the northern part of Belgium. Enercoop is located in France. Ecopower and Enercoop are the largest, nation-wide, REScoop in Europe. Both have a large member and customers base. Both cooperatives implement a wide set of actions to encourage their members to conserve energy, ranging from antecedent to consequence interventions, and package approaches covering multiple interventions. Customer and member bases differ between Ecopower and Enercoop. Ecopower exists longer and includes three ‘waves’ of members with varying profile types [18]. Enercoop, on the other hand, was founded more than a decade later, has less members and customers, and therefore is likely to have the same member profile. Enercoop also covers a more dispersed and larger geographical domain (across different regions in France, all the way to the French Alps and the Pyrenees), than Ecopower members, who are confined to the smaller Flanders region in Belgium. More detailed information on the two cooperatives can be found below.
3.3.1. Ecopower
Ecopower is a renewable energy producer and supplier cooperative, based in Flanders (Belgium), that was founded in 1991 as a cooperative under Belgian law. By 2016, Ecopower consisted of 48,883 cooperative members (currently over 50,000), with 194,830 shares and 41,302 customers. All the financial resources from cooperative members (shareholders) are invested in renewable energy projects. By 2015, 82% of energy supplied by Ecopower was covered by installations of its own. By 2017 this was even 100% [23,58]. Forty-seven percent of Ecopower members are prosumers, generating electricity de-centrally, often using solar PV panels of their own [62].
Interventions by Ecopower
Ecopower supports their members to lower electricity consumption, and does so by implementing a set of different interventions: the ‘EnergieID’ energy consumption platform, personal advice, a newsletter, and a brochure. ‘EnergieID’ uses a SaaS-platform (software as a service), helping families and organizations to manage their energy and water consumption as well as their transport kilometers and renewable energy production. Users can create an account for free, compare their consumption with similar user profiles, and share their data with the service providers of their choice. Meter readings can be entered manually or automatically by compatible smart energy devices. By sharing the platform, ‘EnergieID’ can gather relevant data more quickly to compare and analyze. Since March 2016 more than 13,000 users were active on the platform. The platform is also useful for Ecopower to help customers when they have questions about their energy bill or electricity consumption because they can get personal, tailored advice. Ecopower pays special attention to large-scale electricity users. Along with their energy bill, Ecopower sends users with an annual consumption higher than 6000 kWh/year a leaflet to inform them about their above-average consumption. It resembles a manual with suggestions to users encouraging them to critically assess their electricity consumption and informing them on how to reduce it [23]. In addition to directly targeting energy efficiency, Ecopower stimulates adoption of home solar panel systems amongst its members. Once installed, electricity generated by the solar panels can be consumed by households, lowering electricity consumption from the conventional electricity grid.
In sum, Ecopower hosts a broad set of interventions, including both antecedent strategies (i.e., information) and consequence strategies (covering both direct and indirect feedback; i.e., billing, personal tailored advice, and an online digital platform providing direct household feedback on energy consumption).
3.3.2. Enercoop
Launched in 2005 by French ecological and ethical business organizations, Enercoop is a 100% cooperative green electricity supplier. Next to having 42,000 cooperative members, Enercoop has 22,000 customers (2015). In addition to selling green electricity, one of the main objectives of Enercoop was to decentralize energy production so as to give every citizen the opportunity to get involved in the energy transition. By supporting the emergence of new local energy cooperatives since 2009, Enercoop has been fostering a network of cooperatives, within which every citizen can invest and participate [23]. Although Enercoop started as one single cooperative, it has recently become a network of nine local and regional cooperatives that allow citizens to reconnect with the challenges of the energy transition on the regional level [26].
Interventions by Enercoop
Enercoop supports their members to lower electricity consumption, and does so by implementing a set of different interventions: ‘TupperWatt’ meetings, ‘Dr. Watt’ self-diagnosis instrument, and the ‘Energie Partagée’ citizen investment fund. ‘TupperWatt’ meetings are arranged and led by a member of Enercoop where they will introduce Enercoop’s values and topics revolving around the energy transition to interested persons, including household energy conservation. ‘Dr. Watt’ is a training course to help consumers make a self-diagnosis of their specific electricity consumption. The aim is to help individual consumers to reduce their energy consumption by providing the tools to measure their consumption and understand it, and by reducing energy consumption while maintaining the same comfort level via tailor-made advice offered through software (also entitled ‘Dr. Watt’). It involves training sessions, in-home metering of electrical devices, support by a software platform, and user meetings. Before each meeting, participants are subjected to awareness-raising by Enercoop (in which multiple media are used: e.g., newsletters, social media). By 2016, ‘Dr. Watt’ had been tested successfully in three local cooperatives (with a reported energy-saving potential of 40%), and was expended to the broader Enercoop cooperatives’ network in 2017. Moreover, 20 training sessions were delivered since. It can be seen as an approach using a broad scope of both antecedent and consequence strategies. ‘Energie Partagée’ concerns a fund that was created to promote the development of local renewable energy and energy efficiency projects, controlled and financed by citizens. It involves an association of experts from different fields and a fund to invest in developed projects and partially finance project development. By 2016, the investment fund had 4312 subscribers and raised over 11 million euros. Next to these measures, Enercoop also issues newsletters and provides personal advice to users [23].
In sum, Enercoop employs a broad set of interventions, including an integrated approach (‘Dr. Watt’) that covers multiple antecedent strategies (information, modelling, workshop, audit) and consequence strategies (both direct and indirect feedback, including workshop sessions in groups with feedback on in-home energy consumption, and tailored advice on how to improve). When compared to interventions by Ecopower, Enercoop employs a set of interventions that are more localized and tailored, using an integrated longitudinal approach, including more antecedent strategies. However, whereas Ecopower already implements interventions at a large scale, Enercoop is still testing promising interventions at a smaller, experimental scale, and is currently in the phase of scaling them to their larger member base.
3.4. Data Collection
Data collection was performed through online surveys, using the survey software ‘LimeSurvey’ [63]. With the help of contact persons at the renewable REScoop federations partners, the original English basic questionnaire was translated into native languages: Dutch for Ecopower in Belgium (Flanders); French for Enercoop in France. In the translation process, questions and answer items were tailored to country-specific conditions and circumstances. To make sure consistency with the original questionnaire was maintained, each REScoop partner translated each questionnaire item to its native language. Moreover, central management of the international data collection was conducted by the University of Twente, where the survey central database was located. Inconsistencies in translations (both questions and answer items), were discussed in detail between the central research team and representatives of the international cooperatives.
Respondents were either members or non-members of cooperatives. Non-members concerned households who were customers (but not members of cooperatives) or people who were neither member nor customer (for instance, sympathizers of the cooperative movement). Members concerned households who were both a member and customer, or households that were only a member (but no customer). At Enercoop, both respondent groups were represented. At Ecopower, all respondents in the survey were cooperative members.
At that start of data collection, the respondents received a web link from the REScoops they were either members or clients of in order to enter the online survey. No tokens or other ways to reveal the identities of the respondents were used (for legal, privacy reasons). The online survey links were unique for all of the participating REScoops. Following considerations of face and item validity, it was decided that the respondents could choose between either completing the questionnaire in their native language or in English (the latter concerns the language in which the questionnaire was originally conceived by the researchers). The survey samples were established in close collaboration with contact persons at the different participating REScoops. Either a customer database with e-mail accounts was used or a database containing anyone who received a newsletter from a REScoop (which meant that respondents did not have to be cooperative members or customers). This difference in approach was related to the business model used by the respective cooperatives. For Enercoop, the use of the broader community (i.e., the ‘newsletter group’) enabled the research team to also collect data among non-members, as most REScoops also possessed a database of ‘interested citizens’. Next, survey links were also sent to their members and the pool of ‘interested citizens’.
The newsletters and e-mails explained the purpose of the survey, the research project, and the ‘REScoop Plus’ project at large. In addition, the online survey link was coupled to the newsletters and the website on which the online survey was located. To raise the response rate, follow-up announcements were made using social media and websites. Following a pilot survey among members of a REScoop in The Netherlands (i.e., ‘LochemEnergie’) in June 2016, survey data were collected in the period of May–July 2017. For Ecopower, the total response was 1111. After data cleaning, 1000 remained. The low response rate was related to the fact that no e-mail addresses of Ecopower members and customers could be used for data (so that they only could be approached via the cooperative’s newsletter), and the fact that potential respondents might have suffered from ‘fatigue’ as they were surveyed two years before (i.e., the dataset collected for the study by [18]). For Enercoop the total response was 8805, and after data cleaning, 8290. Table 3 provides an overview of survey responses for Enercoop and Ecopower.
Table 3.
Response survey for both Enercoop and Ecopower.
For legal reasons, data on energy consumption and conservation, objectively observed by third parties, could not be used. Proxies had to be used instead. This concerned self-reported data by respondents on (i) reported energy conservation since acquiring a membership from a REScoop, and (ii) self-reported data on the sum of individual energy-saving measures respondents engaged in. Using self-reported data instead of actually measured energy conservation data can arguably be viewed as a methodological drawback. Self-reported behaviors may be influenced by social desirability [5,64], and there might be a discrepancy between householders’ self-reported information on values, intentions and attitudes, and observable behaviors [7]. On the other hand, several studies have showed that no great error was reported in findings by researchers that used self-reporting of householders’ energy consumption [65,66]. Moreover, use of self-reports ensures higher response in data collection. Others hold that self-reports allow for valid reporting of information of current behaviors, especially when using tailored interventions. Moreover, meter readings do not provide all types of information that are necessary for all types of household energy consumption research [67]. In addition to self-reported proxies for household energy conservation, we also searched for opportunities to compare data between members and non-members of REScoops (see for the results Section 4.5).
3.5. Data Analysis
Data were analyzed using the Statistical Package for the Social Sciences (SPSS), version 23. Firstly, data were prepared for analysis. This process concerned transformation, recoding variables, and dichotomization of ordinal variables. In addition, scales had to be reconstructed adhering to covariance of items and statistical reliability tests, using factor analysis and Tau-equivalent reliability tests. Key descriptive statistics are presented in Appendix B.
For legal and practical reasons, it was not possible to organize trials to test effects or effectiveness of interventions by cooperatives. To test the statistical relationships between the items mentioned in Section 3.2 and household energy conservation, multivariate regression analysis was performed to identify those predictors most strongly associated with household energy conservation. Because energy conservation was operationalized in three ways (i.e., as (i) intention to save energy; (ii) sum of individual energy-saving measures; and as (iii) indicated energy savings since obtaining membership) different multivariate analyses were conducted.
For the dependent variables ‘intention to save energy’ and ‘sum of individual energy-saving measures taken’, multivariate regression analyses were conducted. This was preferred to alternatives, such as structural equation modelling. The reason was that the main interest in this study would be to test theoretically predicted statistical relationships between selected independent variables and one dependent variable (instead of analyzing independent variable inter-relationships without a sound theoretical basis). Binary logistic regression was used to analyze the influence of selected items concerning psychological, socio-demographic, and contextual variables on the dependent variable ‘perceived energy conservation since obtaining membership’ (operationalized as a dichotomous variable). As it was not possible for organizational, financial, and legal reasons to create a (quasi-) experimental research setting, no research could be conducted to test causal relations or effectiveness pertaining to single or combinations of interventions.
After checking and correcting for multicollinearity, models were constructed. For both the multivariate regression analysis and the binary logistic regression analysis, a 95% confidence interval was used, and three blocks of independent variables were entered hierarchically in regression models. In the first step, variables belonging to the socio-demographics block were entered into the model, i.e., income, education, home size, home ownership, and change in number of household members over the last two years. The second step concerned entering the variables belonging to the psychological variables block to the model (already containing items from the socio-demographics block), i.e., ecological motivation, decentralization motivation, behavioral intention, perceived behavioral control, subjective norms, social pressure, knowledge, and importance. Finally, in the third step, variables regarding influence exercised by REScoops, i.e., length of membership, age of the cooperative, satisfaction with the cooperative’s services, having peers among cooperative’s members, interpersonal trust within the cooperative, and the cooperative’s contribution to higher knowledge level, were added to the already existing model. Before entering variables to the regression models, checks for inter-item correlation were carried out to avoid multicollinearity problems, resulting in the exclusion of a few items (e.g., household size in terms of members, presence of kids of 18 years of age or younger).
Using the ‘entry’ method was preferred to using stepwise regression methods. This was because an order based on sound theoretical predictions and academic literature studies was preferred to using computed algorithms to determine which variables were used as inputs in regression models. Stepwise methods (e.g., ‘backward’ entry) are more generally preferred in exploratory regression models (Field, 2005), whereas, we preferred using predictive regression models.
To assess the binary logistic model fit, two tests were used. First, a model chi-square was used, in which a p-value of less than 0.05 showed that the model fitted the data better than when those variables were excluded. Second, a Hosmer & Lemeshow goodness-of-fit was used to test statistically significant differences between the observed and the predicted probabilities in the model. One can deduce that the model fitted the data when the chi-square value of this test was small and the p-value was greater than 0.05. Both Cox & Snell R-square and Nagelkerke R-square were analyzed to check the predictive values of the independent variables, in which 0 represented no predictive value and 1 presented a perfect prediction. The multivariate regression analysis was conducted in subsets of the total dataset. For Enercoop, this number was 3137, and for Ecopower this was 458. For the binary logistic regression analysis this was 2614 for Enercoop and 421 for Ecopower.
In addition to the multivariate analyses, triangulation was performed by conducting a t-test. The t-test was performed on Enercoop data, comparing between members and non-members (the latter pertaining to customers and other non-members like sympathizers). This was not possible for Ecopower, though, because all respondents were cooperative members.
4. Results
4.1. Frequencies on Items Related to Cooperatives and Energy Conservation
Table 4 presents relative frequencies of items that are relevant to energy conservation and actions by renewable energy cooperatives. In terms of number of energy savings actions, respondents engaged in Enercoop and Ecopower were nearly even (respectively engaging in 7.68 and 7.66 out of a total of 9). Of the respondents at Enercoop, 29.7% attributed energy conservation actions they engaged in to interventions by their cooperatives; this was 32.7% for the Ecopower respondents. Regarding reported lowering of energy consumption, 38.7% of respondents at Enercoop reported to consume less energy since joining the cooperative; at Ecopower this was 64.7%. And 18.2% of respondents of Enercoop indicated that their cooperative contributed to energy conservation; for Ecopower this figure was 36.9%. Table 4 also reveals that respondents were relatively satisfied with their cooperatives, but that only few had friends or family who were (also) cooperative members.
Table 4.
Relative frequencies of cooperatives and energy conservation for Enercoop and Ecopower.
Except for the number of individual energy savings actions respondents engage in, Table 4 shows that Ecopower respondents present higher relative frequencies on items than Enercoop respondents. Sizable differences between Enercoop and Ecopower can be found on items regarding respondents indicating to use less energy since obtaining cooperative membership, and respondents stating that their cooperative had contributed to energy savings in one’s households. Possible reasons may be that Ecopower has been longer into existence, and has been focusing longer on energy conservation than Enercoop. The latter focusing more on green power. Only recently Enercoop started to engage more in actions on energy conservation among their members and customers. In Table 4 figures are fairly even between Enercoop and Ecopower on items regarding cooperatives contributing to an increased knowledge level on (renewable) energy issues, energy savings actions attributed to cooperatives, and having friends or family members who are (also) cooperative members.
4.2. Bivariate Correlations
Analysis on inter-item correlation between indicators of the dependent variable—i.e., intention to save energy, engagement in energy-saving actions, and reported energy savings since joining a cooperative—showed significant results between these items (See Appendix D).
Furthermore, bivariate correlations between predictors and dependent variables were analyzed. Table 5 presents the results for intention to save energy. In line with the Theory of Planned Behavior [68], results show that psychological variables correlated most and strongly (in terms of correlation coefficient) to intention to save energy. Most items from the REScoop-related items block are significant as well, but show weaker correlations than psychological variables. Only few items in the socio-demographics block correlate significantly, and they only show relatively weak correlation values.
Table 5.
Correlations for selected predictors and intention to save energy by REScoop members.
Table 6 presents the results for the sum of energy conservation actions respondents engaged in. Results resemble those presented on intention to save energy, and show that psychological variables correlated most and strongly (in terms of correlation coefficient) to the sum of energy actions one engaged in. Most items from the REScoop-related items block are significant as well, but showed weaker correlation coefficients than psychological variables. Regarding the items in the socio-demographics block, there is a striking difference between Enercoop—with all items significant except for one, and home size and home ownership having particularly high coefficients—and Ecopower, with no significant items.
Table 6.
Correlations for selected predictors and the sum of energy-saving actions REScoop members engaged in.
Table 7 shows the results for perceived energy savings since joining a cooperative. The results resembled those of the correlations presented in Table 5 (on intention to save energy), showing the most and significant items in the psychological variables block (with intention having the strongest value), and the least in the socio-demographics block. Most items in the REScoop-related items block were significant, and ‘number of years membership’ even showed the highest correlation coefficient value amongst items measured among respondents of Enercoop.
Table 7.
Correlations for selected predictors and reported energy savings.
For Enercoop, items that were significantly and positively correlated with respondents claiming to have saved energy since obtaining membership of the cooperative can be found among most psychological factors (i.e., personal motivations, behavioral, and social factors). This applied less to items belonging to socio-demographic factors (including household characteristics). Relative strong correlations were found among items related to the cooperative, i.e., length of membership and obtaining a high knowledge level related to actions by the cooperative. For Ecopower, roughly the same significant correlations were found. However, for Ecopower there are more significant socio-demographic items, four of them having a negative sign (e.g., income, education, and household size).
4.3. Multiple Regression Analysis of the Sum of Individual Energy Measures Taken
Table 8 presents the results of multivariate regression analyses on the sum of individual energy actions taken for analyses conducted for Enercoop and Ecopower.
Table 8.
Results of multivariate regression analyses on intention to save energy.
Both models showed fairly high levels of explained variance (R-square), ranging between 0.435 (Enercoop) and 0.456 (Enercoop). The models revealed, foremost, significant predictors in the psychological predictors block. Motivational attitudes toward decentralism, capability to act, subjective norms, and importance were strong predictors. The block with REScoop-related predictors added little to the variance on intention to save energy, 0.2% for both Enercoop and Ecopower. Within the Enercoop analysis, one REScoop-related predictor was significant: REScoops increasing knowledge. The latter might indicate that Enercoop only relatively recently started advocating energy conservation amongst its members. The shorter respondents had joined Enercoop, and the more they obtained knowledge on energy issues from their cooperative the more they had the intention to save energy.
Table 9 presents the results of the regression analyses on sum of individual energy actions taken. Both models showed relatively low levels of explained variance (R-square), ranging between 0.162 (Ecopower) and 0.197 (Enercoop). The models revealed different sets of significant predictors. The most significant predictors were found in the block concerning psychological variables (especially behavioral intention and behavioral control). This accounted for most of the explained variation in both models. In the two models the block with variables relating to cooperative (REScoop) actions added, respectively, 1.3% (Enercoop) and 2.2% (Ecopower) to the explained variation, which was significant, but not particularly much. In the REScoop predictors block, a significant predictor in both models was having peers (family, friends) who are REScoop members. However, from the explanatory variables in the model the best predictors were psychological factors, in particular, behavioral intention and capability to act. Although the cooperative’s block was significant as well, it added relatively little to explaining the variation of the model. When comparing the results between Enercoop and Ecopower, one notices that the Enercoop model showed higher explained variance, and that more predictors were significant. Next to three predictors from the socio-demographics block, ‘length of REScoop membership’ (from the REScoop’s block) also turned out to be a significant predictor for Enercoop.
Table 9.
Results of multivariate regression analyses on the sum of individual energy actions taken.
4.4. Binary Logistic Regression Analysis on Energy Savings Since Obtaining Membership
Table 10 presents the results of binary logistic regression analyses conducted for Enercoop and Ecopower on perceived energy savings by =REScoop members since they obtained membership.
Table 10.
Results of binary logistic regression analyses on self-reported energy savings since REScoop membership.
Both the Enercoop and Ecopower models showed sufficient degrees of model fit. Model chi-square values were all significant, and the Hosmer & Lemeshow tests revealed non-significant p-values, indicating sufficient model fit. Both models showed a reasonable to good fit, ranging between 0.201 (Enercoop) and 0.212 (Ecopower) for the Cox & Snell R-square, and between 0.272 (Enercoop) and 0.314 (Ecopower) for the Nagelkerke R-square. Both models were also found to be reasonably accurate, as correct predictions ranged between 71.5% (Enercoop) and 79.3% (Ecopower). When looking to explain the variation added to the models (based on Nagelkerke R-square), the REScoop block contributed between 4.6% (Ecopower) and 6.6% (Enercoop) to the models already covering blocks 1 and 2 (socio-demographics and psychological predictors). Thus, not only did REScoop-related predictors contribute significantly to the explained variation of these models, they also explained a sizeable variance. For both Enercoop and Ecopower, significant predictors were mostly found in the block concerning psychological predictors, i.e., behavioral intention, capability to act, and importance. For the REScoop block, in both models, length or membership was found to be a significant predictor. Interestingly, it also turned out to be the most significant predictor. There were also differences between the two models in terms of significant predictors. In the Enercoop model, increasing one’s knowledge level and change in household size were significant, but they were not significant in the Ecopower model. In the Ecopower model, however, social pressure was significant.
4.5. Independent Sample T-test (Enercoop)
For Enercoop, data were also collected among non-members. An independent sample t-test was performed to analyze whether a significant difference in variation existed between members (N = 3360) and non-members (N = 3549) on engagement in individual energy-saving measures. The results showed a significant difference—t (6899.856) = −7.723; p = 0.000—in which members had higher means (mean = 7.801; SE = 0.02060) than non-members (mean = 7.569; SE = 0.02187). This showed that there was a difference between Enercoop engaging in energy-saving behaviors (both efficiency and curtailment) between members and non-members. Members appeared to engage more in these behaviors than non-members. For Ecopower, a t-test could not be performed because no data among non-members could be collected.
5. Discussion
Results reveal that members of two REScoops engage in energy-saving actions (and more than non-members), report energy savings, and use less energy after joining a cooperative. Moreover, the study shows that REScoops moderately contribute to engagement in energy-saving actions and self-reported energy conservation of their members. When reflecting on actual energy use, a study by Akasiadis et al. (2017) on electricity consumption among 10,653 Ecopower members revealed an average reduction of 29.5% per household when comparing annual kWh electricity consumption before and after joining the cooperative (from 3146.38 kWh to 2219 kWh) [69]. Longitudinal data analysis of electricity consumption between 2012 and 2016 registered an average reduction of 29.3% per household [62]. For these reasons, it is fair to state that there is modest evidence that REScoops do not limit themselves to activities and services pertaining to ‘renewable energy’ (production and supply), but also ‘energy conservation’, and have succeeded in convincing a proportion of their members to engage in energy-saving behaviors. As such, REScoops can be seen as civil organizations that contribute to energy transition in multiple ways.
The results of our study support claims by environmental psychologist scholars on the importance of psychological predictors as they explained the largest portion of the variation on (self-reported) household energy conservation. As such, they strongly resemble the importance of hypotheses pertaining to Theory of Planned Behavior [39]. In particular, the analysis on intention to save energy revealed the importance of psychological predictors like motivational attitudes, subjective norms, and self-efficacy (i.e., capability to act). This is in line with a results found in a study by Abrahamse and Steg [40] showing that intention to reduce household energy use is positively related to perceived behavioral control and attitudes toward energy conservation. The results of the multivariate analyses in the present study, however, also showed that socio-demographic and situational predictors (in this case, REScoop-related predictors) contribute to explained variation as well, although modestly. This underlines the theoretical elaboration of theorists like Frederiks et al., who seek to explain more variation using more comprehensive research models [7]. In this sense, the present study shows that REScoops can be perceived as a ‘situational factor’ (amongst others), and when used in relevant empirical studies, may contribute to increased variation when compared to models only focusing on psychological and socio-demographic predictors.
The results also showed that although a number of REScoop-related predictors were found to correlate positively and significantly with intention to save energy, they did not perform well when confronted with psychological variables in a multivariate model. There is reason to believe that this is related to a methodological issue. Perhaps REScoop-related items influence intention to save energy only indirectly, having more direct influence on its predictors (i.e., subjective norms, capability to act, and motivational attitudes). This would make sense when assuming that REScoop membership and the social environment it creates fosters influencing and learning among members, increasing certain motivation levels and predispositions, sharing subjective norms, and stimulating each other to increase one’s capability to act. A closer look into statistical relationships between REScoop-related items and psychological predictors indicates many positive and significant correlations (See Appendix C). To test the influence of these REScoop-related items on intention to save energy via these psychological predictors, other research methods (e.g., structural equation modelling) would need to be considered than those used in the study presented in this article (multiple regression and binary logistic regression).
The results revealed that predictors related to REScoops have a stronger impact on reported energy savings than on engagement in energy conservation measures. A plausible reason might be alternative energy conservation measures that householders engage in, particularly those in which a cooperative might offer a service to conserve energy (i.e., installing smart meters or providing feedback via an online energy consumption monitoring platform) or advocate and support installing of solar panels on rooftops of dwellings, which indirectly leads to lowering of their electricity consumption bills (as shown in the Ecopower case) [62]. The study also revealed empirical evidence in support of the claim that personal norms significantly affect engagement of REScoop members [18]. In this study, personal norms were significant predictors for the intention to save energy. However, next to personal norms, subjective norms were also found to significantly predict engagement in energy-saving actions and intention to save energy. This is in line with studies that found social norms and social environment to be significant predictors for persons participating in community energy action [32,33]. Regarding claims concerning energy and gender [38,70], the results of the Enercoop survey show significant results pertaining to women having the intention to save energy and engaging in energy-saving behaviors. However, in contrast it is men, and not women, who report the energy savings.
Arguably, the significant differences between members and non-members of Enercoop in engaging in energy-saving measures can be seen as an argument in support of the effectiveness of the intervention package used by this cooperative, which was a combination of tailored antecedent and consequence strategies. If this is correct it would support the claim that interventions are more effective when tailored to the target population [5] and when combining informational and structural strategies with antecedent and consequence strategies [35,54]. However, in order to find support for this claim, more fine-grained research using experimental designs is needed.
6. Conclusions
This article set out with the following research question: What is the predictive value of renewable energy cooperatives on intention to save energy, engagement in energy-saving actions, and self-reported energy conservation by their members? Survey data from two renewable energy cooperatives were analyzed to answer this question. Energy savings by renewable energy cooperative members was operationalized in three ways: (i) as intention to save energy; (ii) as perceived energy savings since joining a renewable energy cooperative; and (iii) in terms of number of individual energy-saving actions one engages in.
6.1. Main Conclusions
Data analysis among two REScoops (one in Flanders, one in France) showed that, respectively, 38.7% and 64.7% of the respondents indicated saving more energy since joining a cooperative, and that, respectively, 18% and 37% of respondents attributed energy savings to actions by their REScoop. Respondents indicated engaging in 85% of total energy-saving actions, as presented in the survey (on average 7.7 out of 9). The study also revealed that members of REScoops engage more in energy-saving measures than non-members. Multivariate analyses showed that a number of the REScoop-related predictors contributed positively and significantly to self-reported energy conservation and individual energy-saving actions. However, in terms of explained variation, REScoop related predictors were found to contribute more to the former than to the latter (perhaps members were already engaged in energy-saving measures prior to obtaining REScoop membership). The majority of the explained variation for both reported energy savings and engaged energy-saving actions, however, stems from psychological predictors, and to a lesser extent, to REScoop-related and socio-demographic predictors. This reveals the importance of psychological predictors, which can potentially be targeted by cooperatives in their strategies to persuade their members to conserve energy. From the REScoop predictors, length of membership and members having many peers who are (also) members are positive, significant predictors. As such, this finding stresses the importance of the social environment that REScoops offer to their members.
6.2. Limitations
A key limitation of the study presented in this article pertained to the impossibility to collect data on actual (revealed) energy consumption. This had to do with EU privacy law demands that results should not be traceable to any local individual household. Therefore, the decision was made to operationalize energy conservation in terms of behavioral intention to save energy, self-reported energy savings, and sum of measures taken to conserve energy. A second limitation concerned not using randomized sampling (for privacy and organizational reasons). Therefore some of the results may be explained by the fact that only the more motivated members participated in the survey. A third limitation concerned the fact that effects of individual (and combinations of) interventions could not be studied in-depth because a (quasi-) experimental setting with independent experiments and control groups could not be created. Fourth, the impact of REScoop predictors on drivers for behavioral intention could not be studied because only regression models were used in this study.
6.3. Suggestions for Future Research
When taking the results of the study presented in this article into perspective, we have the following suggestions for future research. First, future studies should address the question whether household energy use actually decreases and if it is related to actual behaviors. Second, we suggest that research should be undertaken that evaluates the implementation of individual interventions by REScoops. In this article, exposure to interventions by REScoops was considered part of REScoop membership, which also includes belonging to a social group in terms of being a special citizen who prefers to use energy in a sustainable way. Third, we suggest research on how REScoops may impact motivational and psychological determinants of their members (e.g., motivational attitudes, behavioral control, subjective norms, knowledge, importance, and behavioral intention). Fourth, we suggest fine-grained comparative research between mature and immature REScoops to reveal the causal mechanisms related to interventions REScoops use to persuade their members to conserve energy. In addition, we suggest further research within Ecopower, to assess in more detail how it manages to successfully engage and persuade their members to conserve energy. Fifth, we suggest conducting quasi-experimental trials, using actual household energy consumption data, to assess the impact of interventions by REScoops. Sixth, we suggest comparative research between households who are consumers of energy supplied by REScoops and households who have their energy supplied by others. We would like to find out whether REScoops offer better energy services, whether their members lower their energy consumption, whether they use less energy, and to assess whether interventions used by both are used more effectively by REScoops. Finally, we suggest that more research should focus on how lifestyles, culture, and REScoop membership interact and influence household energy consumption and conservation.
Author Contributions
T.H. and F.C. conceived and designed the study; F.C. and T.H. collected the data; T.H. and M.B. analyzed the data; T.H., F.C., and M.B. wrote the paper.
Funding
This research was funded by Horizon 2020 Framework Programme: 696084.
Acknowledgments
The results presented in this article are part of the H2020—REScoop Plus Project. This project has received funding from the European Union’s Horizon-2020 research and innovation program under grant agreement No. 696084. Together with a number of decentralized energy cooperatives, the REScoop Plus project measures overall energy savings of the renewable energy cooperative members and seeks to identify best practices (in terms of projects and incentives with high leverage, and hence impact). The overall objective of REScoop Plus is to further develop energy savings as an activity for European REScoops. The REScoop Plus project partners are members of the federation of European REScoops, entitled REScoop.eu.
Conflicts of Interest
The authors declare no conflict of interest.
Appendix A. Scale Items
Items scale on ‘decentralization motivation’ (tau-equivalent reliability Enercoop = 0.552; tau-equivalent reliability Ecopower = 0.575):
- To reach societal goals we can organize ourselves best in local communities.
- I distrust large-scale traditional energy companies.
- National government policy mainly supports traditional (centralized) energy systems.
Items scale on ‘behavioral intention’ (tau-equivalent reliability Enercoop = 0.632; tau-equivalent reliability Ecopower = 0.713):
- I have the intention to lower my energy consumption patterns intensively.
- I have the intention to only use energy that has been produced locally.
- I have the intention to continually improve the energy efficiency level of my household.
Items scale on ‘perceived behavioral control’ (capability to act) (tau-equivalent reliability Enercoop = 0.679; tau-equivalent reliability Ecopower = 0.547):
- I view myself capable of actually realizing intended energy saving targets.
- I view myself capable of realizing challenging targets I set (e.g., sports targets or diet targets).
- When I am challenged to save energy, I commit myself easily.
Items scale on ‘subjective norms’ (tau-equivalent reliability Enercoop = 0.770; tau-equivalent reliability Ecopower = 0.756):
- I like to identify myself with a green energy supplier.
- I like to be seen as a person who saves energy.
- I like to be seen as a person who uses renewable energy.
- I like to be seen as a person who uses an electrical vehicle instead of a traditional fossil fuel vehicle.
- Saving energy is considered an important value among my friends and family.
- Generating one’s own energy locally is considered important among my friends and family.
Items scale on ‘importance’ (tau-equivalent reliability Enercoop = 0.643; tau-equivalent reliability Ecopower = 0.651):
- After having joined a REScoop, energy savings have become more important to me.
- After having joined a REScoop local production of renewable energy has become more important to me.
Appendix B. Descriptive Statistics
Table A1.
(a) Socio-demographics of Enercoop. (b) Socio-demographics of Ecopower.
Table A1.
(a) Socio-demographics of Enercoop. (b) Socio-demographics of Ecopower.
| (a) | |||||
| Household size (no. of household members) | |||||
| Frequency | Percent | Valid Percent | Cumulative Percent | ||
| Valid | 1 | 2096 | 25.3 | 25.5 | 25.5 |
| 2 | 3270 | 39.4 | 39.8 | 65.3 | |
| 3 | 1145 | 13.8 | 13.9 | 79.2 | |
| 4 | 1194 | 14.4 | 14.5 | 93.7 | |
| 5 | 407 | 4.9 | 5.0 | 98.7 | |
| 6 | 86 | 1.0 | 1.0 | 99.7 | |
| 7 | 15 | 0.2 | 0.2 | 99.9 | |
| 8 | 6 | 0.1 | 0.1 | 100.0 | |
| Total | 8219 | 99.1 | 100.0 | ||
| Missing | 999 | 71 | 0.9 | ||
| Total | 8290 | 100.0 | |||
| Change in no. of household members | |||||
| Frequency | Percent | Valid Percent | Cumulative Percent | ||
| Valid | Decrease | 854 | 10.3 | 10.5 | 10.5 |
| No change | 6290 | 75.9 | 77.4 | 88.0 | |
| Increase | 978 | 11.8 | 12.0 | 100.0 | |
| Total | 8122 | 98.0 | 100.0 | ||
| Missing | 999 | 168 | 2.0 | ||
| Total | 8290 | 100.0 | |||
| Annual household income | |||||
| Frequency | Percent | Valid Percent | Cumulative Percent | ||
| Valid | 0–20k euros | 1673 | 20.2 | 21.6 | 21.6 |
| 20k–30k euros | 1814 | 21.9 | 23.5 | 45.1 | |
| 30k–40k euros | 1579 | 19.0 | 20.4 | 65.5 | |
| 50k–60k euros | 1121 | 13.5 | 14.5 | 80.0 | |
| 60k–70k euros | 693 | 8.4 | 9.0 | 89.0 | |
| 70k–80k euros | 516 | 6.2 | 6.7 | 95.7 | |
| 80k euros or more | 335 | 4.0 | 4.3 | 100.0 | |
| Total | 7731 | 93.3 | 100.0 | ||
| Missing | 999 | 559 | 6.7 | ||
| Total | 8290 | 100.0 | |||
| Education | |||||
| Frequency | Percent | Valid Percent | Cumulative Percent | ||
| Valid | No school | 8 | 0.1 | 0.1 | 0.1 |
| Elementary school | 16 | 0.2 | 0.2 | 0.3 | |
| High school | 200 | 2.4 | 2.6 | 2.9 | |
| Secondary vocational education | 419 | 5.1 | 5.4 | 8.2 | |
| University of applied sciences | 917 | 11.1 | 11.8 | 20.0 | |
| University Bachelor’s level | 1538 | 18.6 | 19.7 | 39.7 | |
| University Master’s level | 3816 | 46.0 | 48.9 | 88.6 | |
| Postdoctoral level | 889 | 10.7 | 11.4 | 100.0 | |
| Total | 7803 | 94.1 | 100.0 | ||
| Missing | 999 | 487 | 5.9 | ||
| Total | 8290 | 100.0 | |||
| Size of home (sqm.) | |||||
| Frequency | Percent | Valid Percent | Cumulative Percent | ||
| Valid | 30 m2 or less | 247 | 3.0 | 3.2 | 3.2 |
| 30–50 m2 | 941 | 11.4 | 12.0 | 15.2 | |
| 40–70 m2 | 1246 | 15.0 | 15.9 | 31.1 | |
| 70–90 m2 | 1377 | 16.6 | 17.6 | 48.7 | |
| 90–110 m2 | 1258 | 15.2 | 16.1 | 64.8 | |
| 110–130 m2 | 1359 | 16.4 | 17.4 | 82.2 | |
| more than 130 m2 | 1390 | 16.8 | 17.8 | 100.0 | |
| Total | 7818 | 94.3 | 100.0 | ||
| Missing | 999 | 472 | 5.7 | ||
| Total | 8290 | 100.0 | |||
| Type of house | |||||
| Frequency | Percent | Valid Percent | Cumulative Percent | ||
| Valid | 469 | 5.7 | 5.7 | 5.7 | |
| Detached house | 3572 | 43.1 | 43.1 | 48.7 | |
| Semi-detached | 560 | 6.8 | 6.8 | 55.5 | |
| Other | 140 | 1.7 | 1.7 | 57.2 | |
| Apartment | 2728 | 32.9 | 32.9 | 90.1 | |
| Maisonette | 301 | 3.6 | 3.6 | 93.7 | |
| Row home | 520 | 6.3 | 6.3 | 100.0 | |
| Total | 8290 | 100.0 | 100.0 | ||
| Home ownership | |||||
| Frequency | Percent | Valid Percent | Cumulative Percent | ||
| Valid | Does not own home | 2296 | 27.7 | 29.5 | 29.5 |
| Owns home | 5498 | 66.3 | 70.5 | 100.0 | |
| Total | 7794 | 94.0 | 100.0 | ||
| Missing | 999 | 496 | 6.0 | ||
| Total | 8290 | 100.0 | |||
| Gender division of household | |||||
| Frequency | Percent | Valid Percent | Cumulative Percent | ||
| Valid | female majority | 2963 | 35.7 | 35.9 | 35.9 |
| no majority | 3753 | 45.3 | 45.5 | 81.3 | |
| male majority | 1540 | 18.6 | 18.7 | 100.0 | |
| Total | 8256 | 99.6 | 100.0 | ||
| Missing | System | 34 | 0.4 | ||
| Total | 8290 | 100.0 | |||
| (b) | |||||
| Household size (no. of household members) | |||||
| Frequency | Percent | Valid Percent | Cumulative Percent | ||
| Valid | 1 | 160 | 16.0 | 16.1 | 16.1 |
| 2 | 422 | 42.2 | 42.5 | 58.6 | |
| 3 | 125 | 12.5 | 12.6 | 71.2 | |
| 4 | 193 | 19.3 | 19.4 | 90.6 | |
| 5 | 79 | 7.9 | 8.0 | 98.6 | |
| 6 | 10 | 1.0 | 1.0 | 99.6 | |
| 7 | 1 | 0.1 | 0.1 | 99.7 | |
| 8 | 3 | 0.3 | 0.3 | 100.0 | |
| Total | 993 | 99.3 | 100.0 | ||
| Missing | 999 | 7 | 0.7 | ||
| Total | 1000 | 100.0 | |||
| Change in no. of household members over last three years | |||||
| Frequency | Percent | Valid Percent | Cumulative Percent | ||
| Valid | Decrease | 92 | 9.2 | 9.5 | 9.5 |
| No change | 822 | 82.2 | 84.5 | 93.9 | |
| Increase | 59 | 5.9 | 6.1 | 100.0 | |
| Total | 973 | 97.3 | 100.0 | ||
| Missing | 999 | 27 | 2.7 | ||
| Total | 1000 | 100.0 | |||
| Income | |||||
| Frequency | Percent | Valid Percent | Cumulative Percent | ||
| Valid | 0–20k euros | 83 | 8.3 | 9.8 | 9.8 |
| 20k–30k euros | 191 | 19.1 | 22.4 | 32.2 | |
| 30k–40k euros | 246 | 24.6 | 28.9 | 61.1 | |
| 40k–50k euros | 16 | 1.6 | 1.9 | 63.0 | |
| 50k–60k euros | 173 | 17.3 | 20.3 | 83.3 | |
| 60k–70k euros | 67 | 6.7 | 7.9 | 91.2 | |
| 70k–80k euros | 32 | 3.2 | 3.8 | 94.9 | |
| 80k euros or more | 43 | 4.3 | 5.1 | 100.0 | |
| Total | 851 | 85.1 | 100.0 | ||
| Missing | 999 | 149 | 14.9 | ||
| Total | 1000 | 100.0 | |||
| Education | |||||
| Frequency | Percent | Valid Percent | Cumulative Percent | ||
| Valid | Elementary school | 14 | 1.4 | 1.6 | 1.6 |
| High school | 146 | 14.6 | 16.2 | 17.7 | |
| Secondary vocational school | 41 | 4.1 | 4.5 | 22.3 | |
| University of applied sciences | 168 | 16.8 | 18.6 | 40.9 | |
| University Bachelor’s level | 205 | 20.5 | 22.7 | 63.6 | |
| University Master’s level | 298 | 29.8 | 33.0 | 96.7 | |
| Postdoctoral level | 30 | 3.0 | 3.3 | 100.0 | |
| Total | 902 | 90.2 | 100.0 | ||
| Missing | 999 | 98 | 9.8 | ||
| Total | 1000 | 100.0 | |||
| Home ownership | |||||
| Frequency | Percent | Valid Percent | Cumulative Percent | ||
| Valid | does not own home | 55 | 5.5 | 5.9 | 5.9 |
| owns home | 871 | 87.1 | 94.1 | 100.0 | |
| Total | 926 | 92.6 | 100.0 | ||
| Missing | System | 74 | 7.4 | ||
| Total | 1000 | 100.0 | |||
| Gender division of household | |||||
| Frequency | Percent | Valid Percent | Cumulative Percent | ||
| Valid | female majority | 210 | 21.0 | 21.1 | 21.1 |
| no gender majority | 681 | 68.1 | 68.5 | 89.6 | |
| male majority | 103 | 10.3 | 10.4 | 100.0 | |
| Total | 994 | 99.4 | 100.0 | ||
| Missing | System | 6 | 0.6 | ||
| Total | 1000 | 100.0 | |||
Table A2.
Descriptive statistics of Enercoop.
Table A2.
Descriptive statistics of Enercoop.
| N | Mean | Median | Mode | Std. Deviation | ||
|---|---|---|---|---|---|---|
| Valid | Missing | |||||
| Motivation | ||||||
| Production of renewable energy is important | 8265 | 25 | 4.97 | 5.00 | 5 | 0.240 |
| For me return on investment is important when buying appliances that produce or use energy | 8236 | 54 | 3.91 | 4.00 | 4 | 0.997 |
| A lower energy price is more important to me than if it is sustainable energy | 8276 | 14 | 1.52 | 1.00 | 1 | 0.670 |
| Transparent pricing of energy is important to me | 8262 | 28 | 4.74 | 5.00 | 5 | 0.518 |
| Environmental issues matter to me | 8240 | 50 | 4.95 | 5.00 | 5 | 0.239 |
| I do not like the use of nuclear energy | 8257 | 33 | 4.68 | 5.00 | 5 | 0.660 |
| Global climate change is important. It needs to be prevented. | 8252 | 38 | 4.92 | 5.00 | 5 | 0.318 |
| To reach societal goals we can organize ourselves best in local communities | 8255 | 35 | 4.33 | 5.00 | 5 | 0.797 |
| I distrust large-scale traditional energy companies | 8259 | 31 | 4.36 | 5.00 | 5 | 0.813 |
| National government policy mainly supports traditional (centralized) energy systems | 8253 | 37 | 4.35 | 4.00 | 5 | 0.731 |
| Climate change is not a problem at all. | 8273 | 17 | 1.11 | 1.00 | 1 | 0.462 |
| Social environment | ||||||
| I experience a high level of interpersonal trust between members of Enercoop | 8190 | 100 | 4.25 | 4.00 | 4 | 0.639 |
| I like to identify myself with a green energy supplier | 8154 | 136 | 4.28 | 4.00 | 4 | 0.708 |
| I like to be seen as a person who uses an electrical vehicle instead of a traditional fossil fuel vehicle | 8163 | 127 | 4.31 | 4.00 | 5 | 0.714 |
| I like to be seen as a person who uses renewable energy | 8164 | 126 | 4.31 | 4.00 | 5 | 0.733 |
| I like to be seen as a person who saves energy | 8166 | 124 | 4.26 | 4.00 | 4 | 0.731 |
| Saving energy is considered an important value among my friends and family | 8162 | 128 | 3.75 | 4.00 | 4 | 0.834 |
| Generating one’s own energy locally is considered important among my friends and family | 8160 | 130 | 3.31 | 3.00 | 3 | 0.948 |
| I don’t want to be the last one in my social network who adopts new technological gadgets | 8153 | 137 | 2.16 | 2.00 | 1 | 1.117 |
| I like to be the first one among my friends who adopts a technological innovation | 8156 | 134 | 2.22 | 2.00 | 1 | 1.059 |
| Many of my friends and/or family members are members of an energy cooperative | 8165 | 125 | 2.36 | 2.00 | 2 | 0.975 |
| I experience social pressure to save energy (reduce energy use) | 8179 | 111 | 2.41 | 2.00 | 2 | 1.028 |
| Self-efficacy and intention | ||||||
| I view myself capable of actually realizing intended energy saving targets | 8085 | 205 | 4.09 | 4.00 | 4 | 0.692 |
| I have the intention to lower my energy consumption patterns intensively | 8073 | 217 | 3.72 | 4.00 | 4 | 0.837 |
| I have the intention to only use energy that has been produced locally | 8071 | 219 | 3.82 | 4.00 | 4 | 0.850 |
| I view myself capable of realizing challenging targets I set (e.g., sports targets or diet targets). | 8073 | 217 | 3.68 | 4.00 | 4 | 0.850 |
| When I am challenged to save energy, I commit myself easily | 8055 | 235 | 3.79 | 4.00 | 4 | 0.789 |
| I have the intention to continually improve the energy efficiency level of my household. | 8088 | 202 | 4.06 | 4.00 | 4 | 0.690 |
| Energy-saving actions | ||||||
| I lower the house temperature (the thermostat) when I leave my house | 7757 | 533 | 0.87 | 1.00 | 1 | 0.338 |
| I adjust the thermostat to a lower temperature when I open the window, turn of the lights when I leave rooms | 7762 | 528 | 0.99 | 1.00 | 1 | 0.075 |
| My thermostats are adjusted in the same way. | 7742 | 548 | 0.90 | 1.00 | 1 | 0.296 |
| When buying a washing machine, refrigerator, freezer I select the one with a high energy efficiency level | 7746 | 544 | 0.94 | 1.00 | 1 | 0.239 |
| I adjust the thermostat to a lower temperature (e.g., 1 or more degrees lower) (dich.) | 7721 | 569 | 0.85 | 1.00 | 1 | 0.356 |
| I’m taking shorter showers | 7747 | 543 | 0.87 | 1.00 | 1 | 0.333 |
| I put electrical home appliances out of standby-mode (e.g., by using a ‘standby-killer’) | 7754 | 536 | 0.80 | 1.00 | 1 | 0.403 |
| I installed thermal insulation in my home. | 7692 | 598 | 0.58 | 1.00 | 1 | 0.493 |
| I changed incandescent lighting to highly energy efficient lightning (e.g., LED lighting) | 7761 | 529 | 0.87 | 1.00 | 1 | 0.333 |
| Dependent variables | ||||||
| Intention | 8042 | 248 | 11.60 | 12.00 | 12 | 1.813 |
| Sum of energy conservation measures taken (out of 9 possible actions). | 7492 | 798 | 7.68 | 8.00 | 8 | 1.259 |
| Do you consume less energy since you are a member of Enercoop? (yes/no) | 2928 | 5362 | 0.39 | 0.00 | 0 | 0.487 |
Table A3.
Descriptive statistics of Ecopower.
Table A3.
Descriptive statistics of Ecopower.
| N | Mean | Median | Mode | SD | ||
|---|---|---|---|---|---|---|
| Valid | Missing | |||||
| Motivations | ||||||
| Production of renewable energy is important | 994 | 6 | 4.73 | 5.00 | 5 | 0.839 |
| For me return on investment is important when buying appliances that produce or use energy | 989 | 11 | 3.93 | 4.00 | 4 | 0.930 |
| A lower energy price is more important to me than if it is sustainable energy | 995 | 5 | 2.33 | 2.00 | 2 | 0.992 |
| Transparent pricing of energy is important to me | 989 | 11 | 4.25 | 4.00 | 4 | 0.774 |
| Environmental issues matter to me | 990 | 10 | 4.59 | 5.00 | 5 | 0.677 |
| I do not like the use of nuclear energy | 989 | 11 | 4.02 | 4.00 | 5 | 1.128 |
| Global climate change is important. It needs to be prevented. | 993 | 7 | 4.67 | 5.00 | 5 | 0.649 |
| To reach societal goals we can organize ourselves best in local communities | 992 | 8 | 3.82 | 4.00 | 4 | 0.926 |
| I distrust large-scale traditional energy companies | 990 | 10 | 4.03 | 4.00 | 4 | 0.925 |
| National government policy mainly supports traditional (centralized) energy systems | 967 | 33 | 4.21 | 4.00 | 4 | 0.791 |
| Climate change is not a problem at all. | 996 | 4 | 1.34 | 1.00 | 1 | 0.751 |
| Social environment | ||||||
| I experience a high level of interpersonal trust between members of Ecopower | 940 | 60 | 3.80 | 4.00 | 4 | 0.759 |
| I like to identify myself with a green energy supplier | 969 | 31 | 4.22 | 4.00 | 4 | 0.758 |
| I like to be seen as a person who uses an electrical vehicle instead of a traditional fossil fuel vehicle | 764 | 236 | 3.36 | 3.00 | 3 | 0.945 |
| I like to be seen as a person who uses renewable energy | 962 | 38 | 4.22 | 4.00 | 4 | 0.730 |
| I like to be seen as a person who saves energy | 969 | 31 | 4.35 | 4.00 | 5 | 0.704 |
| Saving energy is considered an important value among my friends and family | 968 | 32 | 3.74 | 4.00 | 4 | 0.772 |
| Generating one’s own energy locally is considered important among my friends and family | 937 | 63 | 3.44 | 3.00 | 3 | 0.876 |
| I don’t want to be the last one in my social network who adopts new technological gadgets | 930 | 70 | 2.66 | 3.00 | 3 | 1.124 |
| I like to be the first one among my friends who adopts a technological innovation | 944 | 56 | 2.61 | 3.00 | 3 | 1.011 |
| Many of my friends and/or family members are members of an energy cooperative | 912 | 88 | 2.76 | 3.00 | 3 | 0.868 |
| I experience social pressure to save energy (reduce energy use) | 959 | 41 | 2.52 | 2.00 | 2 | 0.928 |
| Self-efficacy and intention | ||||||
| I view myself capable of actually realizing intended energy saving targets | 932 | 68 | 3.99 | 4.00 | 4 | 0.672 |
| I have the intention to lower my energy consumption patterns intensively | 918 | 82 | 3.44 | 4.00 | 4 | 0.928 |
| I have the intention to only use energy that has been produced locally | 936 | 64 | 3.41 | 3.00 | 3 | 0.968 |
| I view myself capable of realizing challenging targets I set (e.g., sports targets or diet targets). | 938 | 62 | 3.64 | 4.00 | 4 | 0.794 |
| When I am challenged to save energy, I commit myself easily | 933 | 67 | 3.60 | 4.00 | 4 | 0.847 |
| I have the intention to continually improve the energy efficiency level of my household. | 948 | 52 | 3.71 | 4.00 | 4 | 0.830 |
| Energy-saving actions | ||||||
| I lower the house temperature (the thermostat) when I leave my house | 883 | 117 | 0.90 | 1.00 | 1 | 0.300 |
| I adjust the thermostat to a lower temperature when I open the windows, and turn of the lights when I leave rooms | 917 | 83 | 0.99 | 1.00 | 1 | 0.074 |
| My thermostats are adjusted in the same way. | 865 | 135 | 0.78 | 1.00 | 1 | 0.413 |
| When buying a washing machine, refrigerator, freezer I select the one with a high energy efficiency level | 904 | 96 | 0.99 | 1.00 | 1 | 0.110 |
| I adjust the thermostat to a lower temperature | 872 | 128 | 0.77 | 1.00 | 1 | 0.421 |
| I’m taking shorter showers | 877 | 123 | 0.63 | 1.00 | 1 | 0.483 |
| I put electrical home appliances out of standby-mode (e.g., by using a ‘standby-killer’) (dich.) | 896 | 104 | 0.73 | 1.00 | 1 | 0.447 |
| I installed thermal insulation in my home. (dich.) | 847 | 153 | 0.92 | 1.00 | 1 | 0.272 |
| I changed incandescent lighting to highly energy efficient lightning (e.g., LED lighting) | 910 | 90 | 0.95 | 1.00 | 1 | 0.221 |
| Sum of energy saving measures taken (out of a total of 9). | 719 | 281 | 7.66 | 8.00 | 9 | 1.311 |
| Do you consume less energy since you are a member of Ecopower? | 814 | 186 | 0.73 | 1.00 | 1 | 0.444 |
| Dependent variables | ||||||
| Intention | 893 | 107 | 10.55 | 11.00 | 12 | 2.176 |
| Are you a member Ecopower? (Yes/No) | 955 | 45 | 0.98 | 1.00 | 1 | 0.140 |
| How long have you been a member of Ecopower? | 933 | 67 | 4.71 | 5.00 | 5 | 0.818 |
Appendix C. Correlations between REScoop-Related Items and Psychological Items
Table A4.
(a) Enercoop. (b) Ecopower.
Table A4.
(a) Enercoop. (b) Ecopower.
| (a) | ||||||||
| Environmental issues matter to me | Distrust of centralism | Subjective norms | Intention | Capability to act | Importance | I experience social pressure to save energy | ||
| Are you a member of a REScoop? | Pearson Correlation | −0.005 | 0.037 ** | 0.064 ** | 0.032 ** | 0.020 * | 0.070 ** | 0.023 * |
| Sig. (one-tailed) | 0.333 | 0.001 | 0.000 | 0.003 | 0.043 | 0.000 | 0.027 | |
| N | 7281 | 7257 | 7163 | 7265 | 7251 | 7182 | 7307 | |
| How long have you been a member of a REScoop (in number of years)? | Pearson Correlation | 0.008 | 0.128 ** | 0.108 ** | 0.029 * | 0.032 * | 0.089 ** | −0.006 |
| Sig. (one-tailed) | 0.328 | 0.000 | 0.000 | 0.041 | 0.030 | 0.000 | 0.364 | |
| N | 3521 | 3503 | 3462 | 3508 | 3499 | 3460 | 3530 | |
| I am completely satisfied with the energy services the REScoop offers me | Pearson Correlation | 0.074 ** | 0.115 ** | 0.188 ** | 0.130 ** | 0.140 ** | 0.112 ** | −0.024 * |
| Sig. (one-tailed) | 0.000 | 0.000 | 0.000 | 0.000 | 0.000 | 0.000 | 0.018 | |
| N | 7753 | 7727 | 7636 | 7741 | 7727 | 7755 | 7779 | |
| My REScoop has contributed to an increased knowledge on renewable energy among our household members. | Pearson Correlation | 0.019 * | 0.091 ** | 0.206 ** | 0.181 ** | 0.145 ** | 0.519 ** | 0.149 ** |
| Sig. (one-tailed) | 0.048 | 0.000 | 0.000 | 0.000 | 0.000 | 0.000 | 0.000 | |
| N | 7752 | 7728 | 7635 | 7738 | 7724 | 7756 | 7779 | |
| Many of my friends and/or family members are members of an energy cooperative | Pearson Correlation | 0.002 | 0.090 ** | 0.238 ** | 0.081 ** | 0.067 ** | 0.081 ** | 0.220 ** |
| Sig. (one-tailed) | 0.428 | 0.000 | 0.000 | 0.000 | 0.000 | 0.000 | 0.000 | |
| N | 8122 | 8099 | 7999 | 8021 | 8003 | 7764 | 8156 | |
| I experience a high level of interpersonal trust between members of Enercoop | Pearson Correlation | 0.097 ** | 0.191 ** | 0.391 ** | 0.196 ** | 0.198 ** | 0.201 ** | 0.052 ** |
| Sig. (one-tailed) | 0.000 | 0.000 | 0.000 | 0.000 | 0.000 | 0.000 | 0.000 | |
| N | 8147 | 8123 | 8012 | 8034 | 8018 | 7777 | 8171 | |
| (b) | ||||||||
| Environmental issues matter to me | Distrust of centralism | Subjective norms | Intention | Capability to act | Importance | I experience social pressure to save energy | ||
| How long have you been a member of a REScoop? | Pearson Correlation | 0.019 | 0.064 * | −0.008 | 0.045 | 0.065 * | 0.066 * | 0.012 |
| Sig. (one-tailed) | 0.280 | 0.028 | 0.420 | 0.094 | 0.027 | 0.024 | 0.361 | |
| N | 926 | 897 | 696 | 868 | 871 | 889 | 917 | |
| I am completely satisfied with the energy services the REScoop offers me | Pearson Correlation | 0.093 ** | 0.216 ** | 0.216 ** | 0.187 ** | 0.158 ** | 0.219 ** | 0.001 |
| Sig. (one-tailed) | 0.003 | 0.000 | 0.000 | 0.000 | 0.000 | 0.000 | 0.485 | |
| N | 899 | 871 | 679 | 845 | 846 | 876 | 891 | |
| My REScoop has contributed to an increased knowledge on renewable energy among our household members. | Pearson Correlation | 0.073 * | 0.211 ** | 0.296 ** | 0.264 ** | 0.161 ** | 0.471 ** | 0.223 ** |
| Sig. (one-tailed) | 0.017 | 0.000 | 0.000 | 0.000 | 0.000 | 0.000 | 0.000 | |
| N | 852 | 826 | 649 | 807 | 810 | 838 | 849 | |
| Many of my friends and/or family members are members of an energy cooperative | Pearson Correlation | 0.010 | 0.126 ** | 0.266 ** | 0.267 ** | 0.215 ** | 0.148 ** | 0.281 ** |
| Sig. (one-tailed) | 0.387 | 0.000 | 0.000 | 0.000 | 0.000 | 0.000 | 0.000 | |
| N | 905 | 881 | 695 | 848 | 853 | 840 | 903 | |
| I experience a high level of interpersonal trust between members of Ecopower | Pearson Correlation | 0.175 ** | 0.193 ** | 0.399 ** | 0.288 ** | 0.233 ** | 0.304 ** | 0.075 * |
| Sig. (one-tailed) | 0.000 | 0.000 | 0.000 | 0.000 | 0.000 | 0.000 | 0.011 | |
| N | 931 | 907 | 703 | 859 | 861 | 857 | 922 | |
*. Correlation is significant at the 0.05 level (1-tailed). **. Correlation is significant at the 0.01 level (1-tailed).
Appendix D. Trivariate Correlations between Intention, Engagement in Energy Saving Actions, Reported Energy Savings
Table A5.
(a) Enercoop. (b) Ecopower.
Table A5.
(a) Enercoop. (b) Ecopower.
| (a) | ||||
| Intention to save energy | Sum of energy saving measures taken | Reported energy savings since joining REScoop | ||
| Intention to save energy | Pearson Correlation | 1 | 0.253 ** | 0.251 ** |
| Sig. (one-tailed) | 0.000 | 0.000 | ||
| N | 8042 | 7451 | 2908 | |
| Sum of energy saving measures taken. | Pearson Correlation | 0.253 ** | 1 | 0.163 ** |
| Sig. (one-tailed) | 0.000 | 0.000 | ||
| N | 7451 | 7492 | 2782 | |
| Reported energy savings since joining REScoop | Pearson Correlation | 0.251 ** | 0.163 ** | 1 |
| Sig. (one-tailed) | 0.000 | 0.000 | ||
| N | 2908 | 2782 | 2928 | |
| (b) | ||||
| Intention to save energy | Sum of energy saving measures taken | Reported energy savings since joining REScoop | ||
| Intention to save energy | Pearson Correlation | 1 | 0.348 ** | 0.366 ** |
| Sig. (1-tailed) | 0.000 | 0.000 | ||
| N | 893 | 676 | 767 | |
| Sum of energy saving measures taken | Pearson Correlation | 0.348 ** | 1 | 0.210 ** |
| Sig. (1-tailed) | 0.000 | 0.000 | ||
| N | 676 | 719 | 635 | |
| Reported energy savings since joining REScoop | Pearson Correlation | 0.366 ** | 0.210 ** | 1 |
| Sig. (1-tailed) | 0.000 | 0.000 | ||
| N | 767 | 635 | 814 | |
** Correlation is significant at the 0.01 level (1-tailed).
References
- Nejat, P.; Jomehzadeh, F.; Taheri, M.M.; Gohari, M.; Majid, M.Z.A. A global review of energy consumption, CO2 emissions and policy in the residential sector (with an overview of the top ten CO2 emitting countries). Renew. Sustain. Energy Rev. 2015, 43, 843–862. [Google Scholar] [CrossRef]
- Stern, P.C.; Janda, K.B.; Brown, M.A.; Steg, L.; Vine, E.L.; Lutzenhiser, L. Opportunities and insights for reducing fossil fuel consumption by households and organizations. Nat. Energy 2016, 1, 16043. [Google Scholar] [CrossRef]
- Dietz, T.; Gardner, G.T.; Gilligan, J.; Stern, P.C.; Vandenbergh, M.P. Household actions can provide a behavioral wedge to rapidly reduce US carbon emissions. Proc. Natl. Acad. Sci. USA 2009, 106, 18452–18456. [Google Scholar] [CrossRef]
- Intergovernmental Panel on Climate Change. Climate Change 2014: Mitigation of Climate Change; Cambridge University Press: Cambridge, UK, 2015; Volume 3. [Google Scholar]
- Abrahamse, W.; Steg, L.; Vlek, G.; Rothengatter, T. A review of intervention studies aimed at household energy conservation. J. Environ. Psychol. 2005, 25, 273–291. [Google Scholar] [CrossRef]
- Steg, L.; Dreijerink, L.; Abrahamse, W. Why are energy policies acceptable and effective? Environ. Behav. 2006, 38, 92–111. [Google Scholar] [CrossRef]
- Frederiks, E.R.; Stenner, K.; Hobman, E.V. The socio-demographic and psychological predictors of residential energy consumption: A comprehensive review. Energies 2015, 8, 573–609. [Google Scholar] [CrossRef]
- Oteman, M.; Wiering, M.; Helderman, J.-K. The institutional space of community initiatives for renewable energy: A comparative case study of the Netherlands, Germany and Denmark. Energy Sustain. Soc. 2014, 4, 11. [Google Scholar] [CrossRef]
- Arentsen, M.J.; Bellekom, A.A. Power to the people: Local energy initiatives as seedbeds of innovation? Energy Sustain. Soc. 2014, 4, 2. [Google Scholar] [CrossRef]
- Seyfang, G.; Haxeltine, A. Growing grassroots innovations: Exploring the role of community-based initiatives in governing sustainable energy transitions. Environ. Plan. C Gov. Policy 2012, 30, 381–400. [Google Scholar] [CrossRef]
- Seyfang, G.; Hielscher, S.; Hargreaves, T.; Martiskainen, M.; Smith, A. A grassroots sustainable energy niche? Reflections on community energy in the UK. Environ. Innov. Soc. Transit. 2014, 13, 21–44. [Google Scholar] [CrossRef]
- Hoffman, S.M.; High-Pippert, A. From private lives to collective action: Recruitment and participation incentives for a community energy program. Energ Policy 2010, 38, 7567–7574. [Google Scholar] [CrossRef]
- Oteman, M.; Kooij, H.-J.; Wiering, M.A. Pioneering renewable energy in an economic energy policy system: The history and development of Dutch grassroots initiatives. Sustainability 2017, 9, 550. [Google Scholar] [CrossRef]
- Hufen, J.; Koppenjan, J. Local renewable energy cooperatives: Revolution in disguise? Energy Sustain. Soc. 2015, 5, 18. [Google Scholar] [CrossRef]
- Dóci, G.; Vasileiadou, E. “Let’s do it ourselves” Individual motivations for investing in renewables at community level. Renew. Sustain. Energy Rev. 2015, 49, 41–50. [Google Scholar] [CrossRef]
- Hoppe, T.; Graf, A.; Warbroek, B.; Lammers, I.; Lepping, I. Local governments supporting local energy initiatives; Lessons from the best practices of Saerbeck (Germany) and Lochem (The Netherlands). Sustainability 2015, 7, 1900–1931. [Google Scholar] [CrossRef]
- Doci, G.; Vasileiadou, E.; Petersen, A.C. Exploring the transition potential of renewable energy communities. Futures 2015, 66, 85–95. [Google Scholar] [CrossRef]
- Bauwens, T. Explaining the diversity of motivations behind community renewable energy. Energy Policy 2016, 93, 278–290. [Google Scholar] [CrossRef]
- Bauwens, T.; Gotchev, B.; Holstenkamp, L. What drives the development of community energy in Europe? The case of wind power cooperatives. Energy Res. Soc. Sci. 2016, 13, 136–147. [Google Scholar] [CrossRef]
- Warbroek, B.; Hoppe, T. Modes of governing and policy of local and regional governments supporting local low-carbon energy initiatives; exploring the cases of the Dutch regions of Overijssel and Fryslân. Sustainability 2017, 9, 75. [Google Scholar] [CrossRef]
- REScoop.eu. Available online: https://rescoop.eu/ (accessed on 22 November 2016).
- Schwencke, A.M. Lokale Energiemonitor 2017; HIER Opgewekt: Utrecht, The Netherlands, 2017; pp. 1–131. [Google Scholar]
- University of Twente (TUN). D3.1 Report on Specific Tools of Supplying REScoops in Europe; University of Twente/TU Delft: Enschede, The Netherlands; Delft, The Netherlands, 2016; pp. 1–82. [Google Scholar]
- Van Der Schoor, T.; Scholtens, B. Power to the people: Local community initiatives and the transition to sustainable energy. Renew. Sustain. Energy Rev. 2015, 43, 666–675. [Google Scholar] [CrossRef]
- Hoppe, T.; Van der Vegt, A.; Stegmaier, P. Presenting a Framework to Analyze Local Climate Policy and Action in Small and Medium-Sized Cities. Sustainability 2016, 8, 847. [Google Scholar] [CrossRef]
- Coenen, F.H.; Hoppe, T.; Chalkiadakis, G.; Tsoutsos, T.; Akasiadis, C. Exploring energy saving policy measures by renewable energy supplying cooperatives (REScoops). In Proceedings of the ECEEE 2017 Summer Study on Energy Efficiency: Consumption, Efficiency and Limits, Hyeres, France, 29 May–3 June 2017. [Google Scholar]
- Walker, G.; Devine-Wright, P.; Hunter, S.; High, H.; Evans, B. Trust and community: Exploring the meanings, contexts and dynamics of community renewable energy. Energy Policy 2010, 38, 2655–2663. [Google Scholar] [CrossRef]
- Seyfang, G.; Park, J.J.; Smith, A. A thousand flowers blooming? An examination of community energy in the UK. Energy Policy 2013, 61, 977–989. [Google Scholar] [CrossRef]
- Debor, S. Multiplying Mighty Davids? The Influence of Energy Cooperatives on Germany’s Energy Transition; Springer: Berlin, Germany, 2018. [Google Scholar]
- Bauwens, T.; Eyre, N. Exploring the links between community-based governance and sustainable energy use: Quantitative evidence from Flanders. Ecol. Econ. 2017, 137, 163–172. [Google Scholar] [CrossRef]
- Bauwens, T.; Devine-Wright, P. Positive energies? An empirical study of community energy participation and attitudes to renewable energy. Energ Policy 2018, 118, 612–625. [Google Scholar] [CrossRef]
- Kalkbrenner, B.J.; Roosen, J. Citizens’ willingness to participate in local renewable energy projects: The role of community and trust in Germany. Energy Res. Soc. Sci. 2016, 13, 60–70. [Google Scholar] [CrossRef]
- Koirala, B.P.; Araghi, Y.; Kroesen, M.; Ghorbani, A.; Hakvoort, R.A.; Herder, P.M. Trust, awareness, and independence: Insights from a socio-psychological factor analysis of citizen knowledge and participation in community energy systems. Energy Res. Soc. Sci. 2018, 38, 33–40. [Google Scholar] [CrossRef]
- Vringer, K.; Blok, K. The direct and indirect energy requirements of households in the Netherlands. Energy Policy 1995, 23, 893–910. [Google Scholar] [CrossRef]
- Steg, L.; Abrahamse, W. How to promote energy savings among households: Theoretical and practical approaches. In Psychological Approaches to Sustainability: Worldwide Current Trends in Research; Nova Science Publisher: New York, NY, USA, 2010; pp. 10–32. [Google Scholar]
- Jha, C.K.; Sarangi, S. Women and corruption: What positions must they hold to make a difference? J. Econ. Behav. Organ. 2018, 151, 219–233. [Google Scholar] [CrossRef]
- Charness, G.; Gneezy, U. Strong evidence for gender differences in risk taking. J. Econ. Behav. Organ. 2012, 83, 50–58. [Google Scholar] [CrossRef]
- Clancy, J.S. Late developers: Gender mainstreaming in the energy sector. In Proceedings of the UKDSA Annual Conference, Colerain, UK, 2–4 September 2009. [Google Scholar]
- Ajzen, I. The theory of planned behavior. Organ. Behav. Hum. Decis. Process. 1991, 50, 179–211. [Google Scholar] [CrossRef]
- Abrahamse, W.; Steg, L. Factors related to household energy use and intention to reduce it: The role of psychological and socio-demographic variables. Hum. Ecol. Rev. 2011, 18, 30–40. [Google Scholar]
- Lutzenhiser, L. A cultural model of household energy consumption. Energy 1992, 17, 47–60. [Google Scholar] [CrossRef]
- Shove, E.; Warde, A. Inconspicuous consumption: The sociology of consumption, lifestyles and the environment. Sociol. Theory Environ. 2002, 230, 51. [Google Scholar]
- Spaargaren, G.; Van Vliet, B. Lifestyles, consumption and the environment: The ecological modernization of domestic consumption. Environ. Politics 2000, 9, 50–76. [Google Scholar] [CrossRef]
- Heberlein, T.A.; Warriner, G.K. The influence of price and attitude on shifting residential electricity consumption from on-to off-peak periods. J. Econ. Psychol. 1983, 4, 107–130. [Google Scholar] [CrossRef]
- Sexton, R.J.; Johnson, N.B.; Konakayama, A. Consumer response to continuous-display electricity-use monitors in a time-of-use pricing experiment. J. Consum. Res. 1987, 14, 55–62. [Google Scholar] [CrossRef]
- Van der Werff, E.; Thogersen, J.; de Bruin, W.B. Changing Household Energy Usage: The Downsides of Incentives and How to Overcome Them. IEEE Power Energy Mag. 2018, 16, 42–48. [Google Scholar] [CrossRef]
- Andor, M.A.; Fels, K.M. Behavioral Economics and Energy Conservation–A Systematic Review of Non-price Interventions and Their Causal Effects. Ecol. Econ. 2018, 148, 178–210. [Google Scholar] [CrossRef]
- Darby, S. The effectiveness of feedback on energy consumption. In A Review for DEFRA of the Literature on Metering, Billing and Direct Displays; University of Oxford: Oxford, UK, 2006; Volume 486, p. 2006. [Google Scholar]
- Fischer, C. Feedback on household electricity consumption: A tool for saving energy? Energy Effic. 2008, 1, 79–104. [Google Scholar] [CrossRef]
- Burchell, K.; Rettie, R.; Roberts, T.C. Householder engagement with energy consumption feedback: The role of community action and communications. Energy Policy 2016, 88, 178–186. [Google Scholar] [CrossRef]
- Schultz, P.W.; Estrada, M.; Schmitt, J.; Sokoloski, R.; Silva-Send, N. Using in-home displays to provide smart meter feedback about household electricity consumption: A randomized control trial comparing kilowatts, cost, and social norms. Energy 2015, 90, 351–358. [Google Scholar] [CrossRef]
- Hargreaves, T.; Nye, M.; Burgess, J. Making energy visible: A qualitative field study of how householders interact with feedback from smart energy monitors. Energy Policy 2010, 38, 6111–6119. [Google Scholar] [CrossRef]
- Gupta, R.; Barnfield, L.; Gregg, M. Exploring innovative community and household energy feedback approaches. Build. Res. Inf. 2018, 46, 284–299. [Google Scholar] [CrossRef]
- Gardner, G.T.; Stern, P.C. Environmental Problems and Human Behavior; Allyn & Bacon: Boston, MA, USA, 1996. [Google Scholar]
- Hoppe, T.; Arentsen, M.; Sanders, M.; Heldeweg, M.; Kroeze, K. Wetenschappelijke Rapportage ‘Governance by Commitment; Co-Production in Transitional Change’; Universiteit Twente: Enschede, The Netherlands, 2014. [Google Scholar]
- REScoop.eu. REScoop 20-20-20 Best Practices Report 1; REScoop.eu: Liege, Belgium, 2014; pp. 1–63. [Google Scholar]
- Naus, J.; van Vliet, B.J.; Hendriksen, A. Households as change agents in a Dutch smart energy transition: On power, privacy and participation. Energy Res. Soc. Sci. 2015, 9, 125–136. [Google Scholar] [CrossRef]
- Costa, D.L.; Kahn, M.E. Energy conservation “nudges” and environmentalist ideology: Evidence from a randomized residential electricity field experiment. J. Eur. Econ. Assoc. 2013, 11, 680–702. [Google Scholar] [CrossRef]
- Magnani, N.; Osti, G. Does civil society matter? Challenges and strategies of grassroots initiatives in Italy’s energy transition. Energy Res. Soc. Sci. 2016, 13, 148–157. [Google Scholar] [CrossRef]
- Kampen, J.K.; De Walle, S.V.; Bouckaert, G. Assessing the relation between satisfaction with public service delivery and trust in Government. The impact of the predisposition of citizens toward Government on evalutations of its performance. Public Perform. Manag. Rev. 2006, 29, 387–404. [Google Scholar]
- Bergek, A.; Mignon, I.; Sundberg, G. Who invests in renewable electricity production? Empirical evidence and suggestions for further research. Energ Policy 2013, 56, 568–581. [Google Scholar] [CrossRef]
- Sifakis, N.; Savvakis, N.; Daras, T.; Tsoutsos, T. D2.4—Final Data Statistical Analysis; Technical University of Crete: Chania, Greece, 2018; pp. 1–61. [Google Scholar]
- Schmitz, C. LimeSurvey: An Open Source Survey Tool; LimeSurvey Project: Hamburg, Germany, 2012. [Google Scholar]
- Luyben, P.D. Prompting thermostat setting behavior: Public response to a presidential appeal for conservation. Environ. Behav. 1982, 14, 113–128. [Google Scholar] [CrossRef]
- Warriner, G.K.; McDougall, G.H.; Claxton, J.D. Any data or none at all? Living with inaccuracies in self-reports of residential energy consumption. Environ. Behav. 1984, 16, 503–526. [Google Scholar] [CrossRef]
- Kormos, C.; Gifford, R. The validity of self-report measures of proenvironmental behavior: A meta-analytic review. J. Environ. Psychol. 2014, 40, 359–371. [Google Scholar] [CrossRef]
- Abrahamse, W.; Steg, L.; Vlek, C.; Rothengatter, T. The effect of tailored information, goal setting, and tailored feedback on household energy use, energy-related behaviors, and behavioral antecedents. J. Environ. Psychol. 2007, 27, 265–276. [Google Scholar] [CrossRef]
- Ajzen, I. From intentions to actions: A theory of planned behavior. In Action Control; Springer: Berlin, Germany, 1985; pp. 11–39. [Google Scholar]
- Akasiadis, C.; Mamakos, M.; Savvakis, N.; Chalkiadakis, G.; Tsoutsos, T. D2.3—Data Analysis Report; Technical University of Crete: Chania, Greece, 2017; pp. 1–82. [Google Scholar]
- Clancy, J.S. Household Energy and Gender: The Global Context; Universiteit Twente: Enschede, The Netherlands, 2003. [Google Scholar]
© 2019 by the authors. Licensee MDPI, Basel, Switzerland. This article is an open access article distributed under the terms and conditions of the Creative Commons Attribution (CC BY) license (http://creativecommons.org/licenses/by/4.0/).