Article

Experimental Study of Profile Control with Foam Stabilized by Clay Particle and Surfactant

1
College of Petroleum Engineering, China University of Petroleum (East China), Qingdao 266580, China
2
China Aviation Oil and Petrochemical Pipeline Company Limited, Beijing 101300, China
3
School of Petroleum Engineering, Changzhou University, Changzhou 213164, China
*
Authors to whom correspondence should be addressed.
Energies 2019, 12(5), 781; https://doi.org/10.3390/en12050781
Submission received: 22 January 2019 / Revised: 21 February 2019 / Accepted: 22 February 2019 / Published: 26 February 2019
(This article belongs to the Special Issue Enhanced Oil Recovery 2019)

Abstract

:
Foam is a kind of ideal fluid for profile control in petroleum engineering, which has attracted intense interests of scholars globally in recent years. In this study, a foam system stabilized with anionic surfactants and clay particles was proposed for profile control in reservoirs, and the formulation was optimized experimentally. Moreover, flooding experiments in visible porous media models and in sandpacks were conducted to test the plugging effect of the foam system on reservoirs, and the effects of different factors such as gas–liquid ratio, temperature and permeability on profile control were also evaluated. According to the experimental results, the clay-HY-2 system was elected for its satisfactory foamability, stability, and salinity resistance, and the optimum concentrations of HY-2 and clay particle are 0.6 wt% and 5.0 wt%, respectively. Compared with traditional foam fluids, the clay-HY-2 system can form denser and smaller bubbles in high- and middle-permeable layers, enhancing the plugging effect there, while there are less bubbles in low-permeable layers, i.e., the restriction on the flow in narrow structures is slight. The clay-HY-2 foam can perform the efficient and uniform profile control effect on sandpacks when the foam quality is around 50%. The resistance factor of the foam decrease gradually with the increasing temperature, however, the resistance factor remains higher than 350.0 when the temperature reaches 80.0 °C. When the permeability exceeds 1502.0 mD, the clay-HY-2 foam can perform deep profile control in reservoirs, and the resistance factor are not sensitive to the change of permeability when it exceeds 3038.0 mD. Besides, the site application case shows that the clay-HY-2 foam do have good profile control effect on reservoirs, i.e., improving oil production and declining water cut.

1. Introduction

In the process of oilfield development, the occurrences of fluid channeling from injection wells to production wells, bottom water coning, and viscous fingering are common challenges. Most old oilfields suffer the high water cut period, which causes the inefficient water flooding and the low oil recovery. With the presence of dominant channels of water flooding, advanced technologies that can enhance the effect of water flooding are in urgent need [1].
Foam fluid can be used as an efficient flooding agent in oilfields. Foam fluid flooding technology can be traced back to the 1950s, and it has been put into practice as pilot exploration for many times around the world [2,3,4,5]. After more than half a century of laboratory experimental research and on-site operations, the effect of foam fluid flooding on the development of oilfield has been fully recognized by the petroleum industry due to its unique characteristics in the reservoir [6,7,8,9,10]. Firstly, the foam fluid has much higher viscosity in the reservoir compared with water, which reduces the mobility ratio and contributes to the uniformity of flooding. Secondly, the presence of Jamin’s effect allows the foam fluid the selective capability of layers with different permeabilities, and the high resistance factor in the formation with the injection of foam can conduct profile control effectively. Besides, the foam fluid can rupture in the formation with high oil saturation and keep stable in the formation with high water saturation. For above characteristics, the foam fluid becomes the right choice for reservoirs with severe heterogeneity and high water cut.
The key of foam flooding technology lies in the properties of foam, and a foam formulation with good foamability and stability can promote the effect of foam flooding efficiently. The performance of foam is usually evaluated by two factors: the foaming volume and the half-life of foam liquid [11]. At present, there are several ways to improve the foam properties. The first way is to synthesize new types of surfactants, which are usually called foaming agents. Although the foam prepared with good foaming agents can reach the satisfactory volume, the stability of the foam is poor. The second way is to add polyacrylamide, polysaccharide and other polymers into the foaming agent solution, which can increase the viscosity of the foam liquid film, reduce the drainage rate of the film and the restrict diffusion of gas among the bubbles [12,13]. However, the polymers do not generally have surface activity, and can decrease foaming ability. Moreover, polymers can decompose in the formations with high salinity or high temperature. Even greater foam stability can be achieved by gelling the external phase of foam. Chemical bulk gels such as polyacrylamide, xanthan gum, and silica gel have been widely used in oil and gas fields [14,15,16]. Foamed gels are currently used for a wide variety of aspects including injection profile control, water shutoff, fracturing, and sand control. The third way to improve foam stability is to prepare three phase foam by adding solid particles, including nanoparticles and microparticles, which also have the capability to stabilize the oil–water emulsion [17,18]. With the presence of inorganic particles that match with the foaming agent and ions in the system, the synergistic effect of solid particles and the foaming agent occurs and greatly improves the foam properties. The particles with proper hydrophobicity can slow down the diffusion of gas and increase bubble strength by absorbing on the liquid films, as well as enhance the viscosity of external phase and weaken the gravitational drainage by constructing space grid structures in the bulk phase [19,20,21]. However, the high-performance inorganic particles, especially nanoparticles, do increase the cost of the foam fluid.
To date, studies on stabilizing foams with inorganic particles have mainly concentrated on nanoparticles, and less attention has been paid to microparticles, especially the clay particle. Experimental results pertaining to the foams stabilized by clay particles are limited [22]. Compared with nanoparticles, clay particles are less expensive and disperse better in water. In this study, a clay enhanced foam system was proposed for profile control in high-permeable reservoirs. HY-2 was selected from four surfactants experimentally for its good foamability, stability and salinity resistance. As for the clay-HY-2 foam system, the concentrations of clay particle and surfactant were optimized, respectively. The visible model flooding and sandpack flooding experiments were performed in the study to investigate the plugging effect of the foam in porous media. Besides, a site test was conducted to test the profile control effect of the clay-HY-2 foam. The results are meaningful for the application of foam flooding for EOR.

2. Experimental Section

2.1. Apparatus

The clay-surfactant dispersion was prepared with an ultrasonic dispersion instrument (TJS-3000, Hangzhou Ultrasonic Co., Ltd, Hangzhou, China). A high speed agitator (GJ-3S, Qingdao Senxin Co., Ltd, Qingdao, China) was used to evaluate the foamability and stability of foam fluids. A laser particle size analyzer (NKT6100-A, Shandong NKT Co., Ltd, Jinan, China) was employed to measure the diameters of clay particles in the dispersion systems. The stainless iron tubes with two evenly distributed pressure test points were employed in this work to make sandpacks, whose inner diameter and length are 2.54 cm and 60.00 cm, respectively. Pressure sensors (DG1300-BZ-B-2-20, Senex, Guangzhou, China) were used to monitor and record the pressure during the flooding experiments.

2.2. Materials

Four kinds of anionic surfactants were tested in this work to find the optimal foam system for profile controlling, which embrace Sodium lauryl sulfate (Aladdin, Shanghai, China), HY-2, ZY-A and ZY-L (the last three surfactants were purchased in Shandong Hengye Co., Ltd, Dongying, China). NaCl (analytical reagent, Aladdin, Shanghai, China) was used to prepare artificial brine. Clay particles with 1000 mesh number were used to prepare the clay-surfactant dispersion system. N2 (purity > 99.9%, Tianyuan Gas Co., Ltd, shanghai, China) was used as gas phase to prepare foam fluid. Ultrapure water whose resistivity is higher than 18.2 MΩ∙cm was employed to prepare solutions in all experiments.

2.3. Experimental Procedures

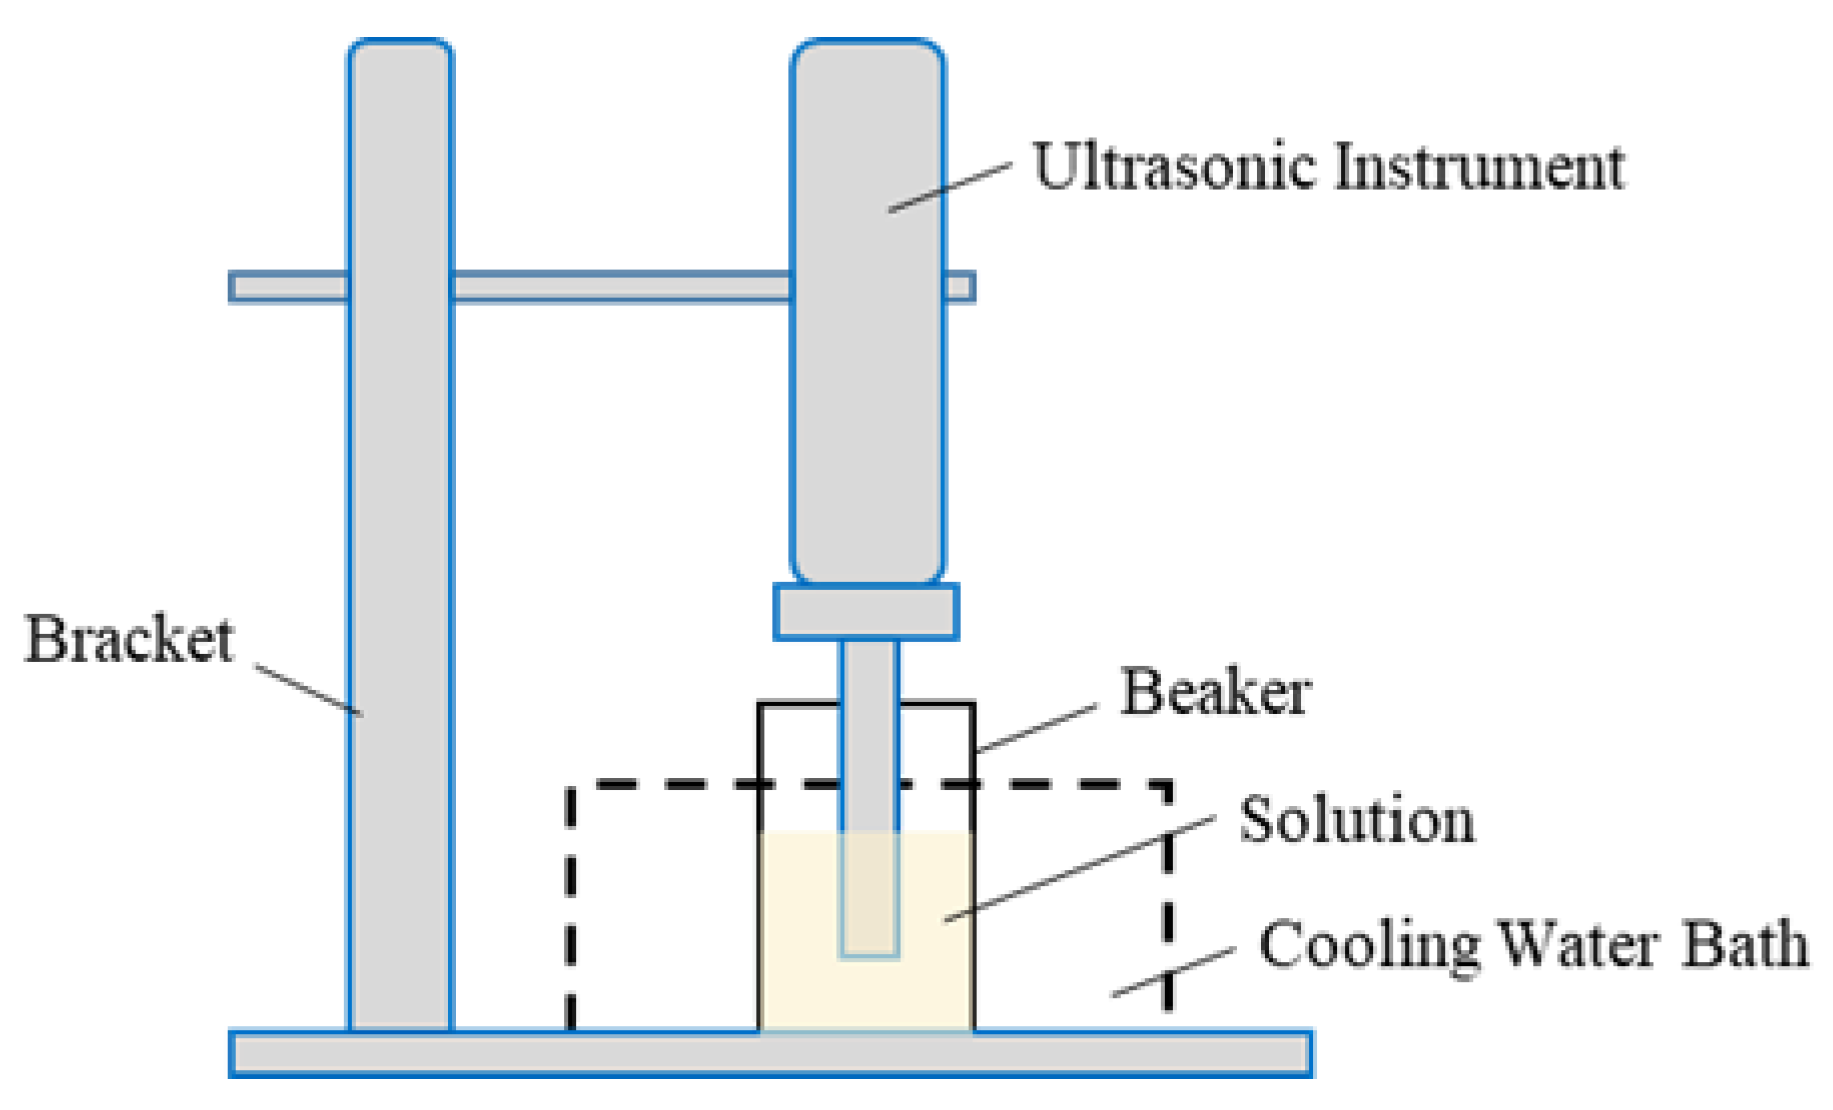
2.3.1. Preparing Clay-Surfactant Dispersion

First, we dispersed clay particles in artificial brine with specific salinity or ultrapure water using an ultrasonic dispersion instrument with full power (2.2 kW) for 10.0 min. Second, we added certain amount of surfactant into above dispersion and processed the system with the ultrasonic dispersion instrument for 3.0 min. Third, we set the dispersion statically for 72.0 h to reach the complete hydration of clay particles and the absorption equilibrium of surfactant on particles. During the dispersing process, a cooling water bath was employed to control the temperature of the solution. The diagram of the ultrasonic instrument is shown in Figure 1.

2.3.2. Optimizing the Foam System

The foam fluids stabilized with surfactant only or clay-surfactant were evaluated with Waring–Blender method to find the optimal one, and detailed processes have been elaborated in our previous work [11,23].

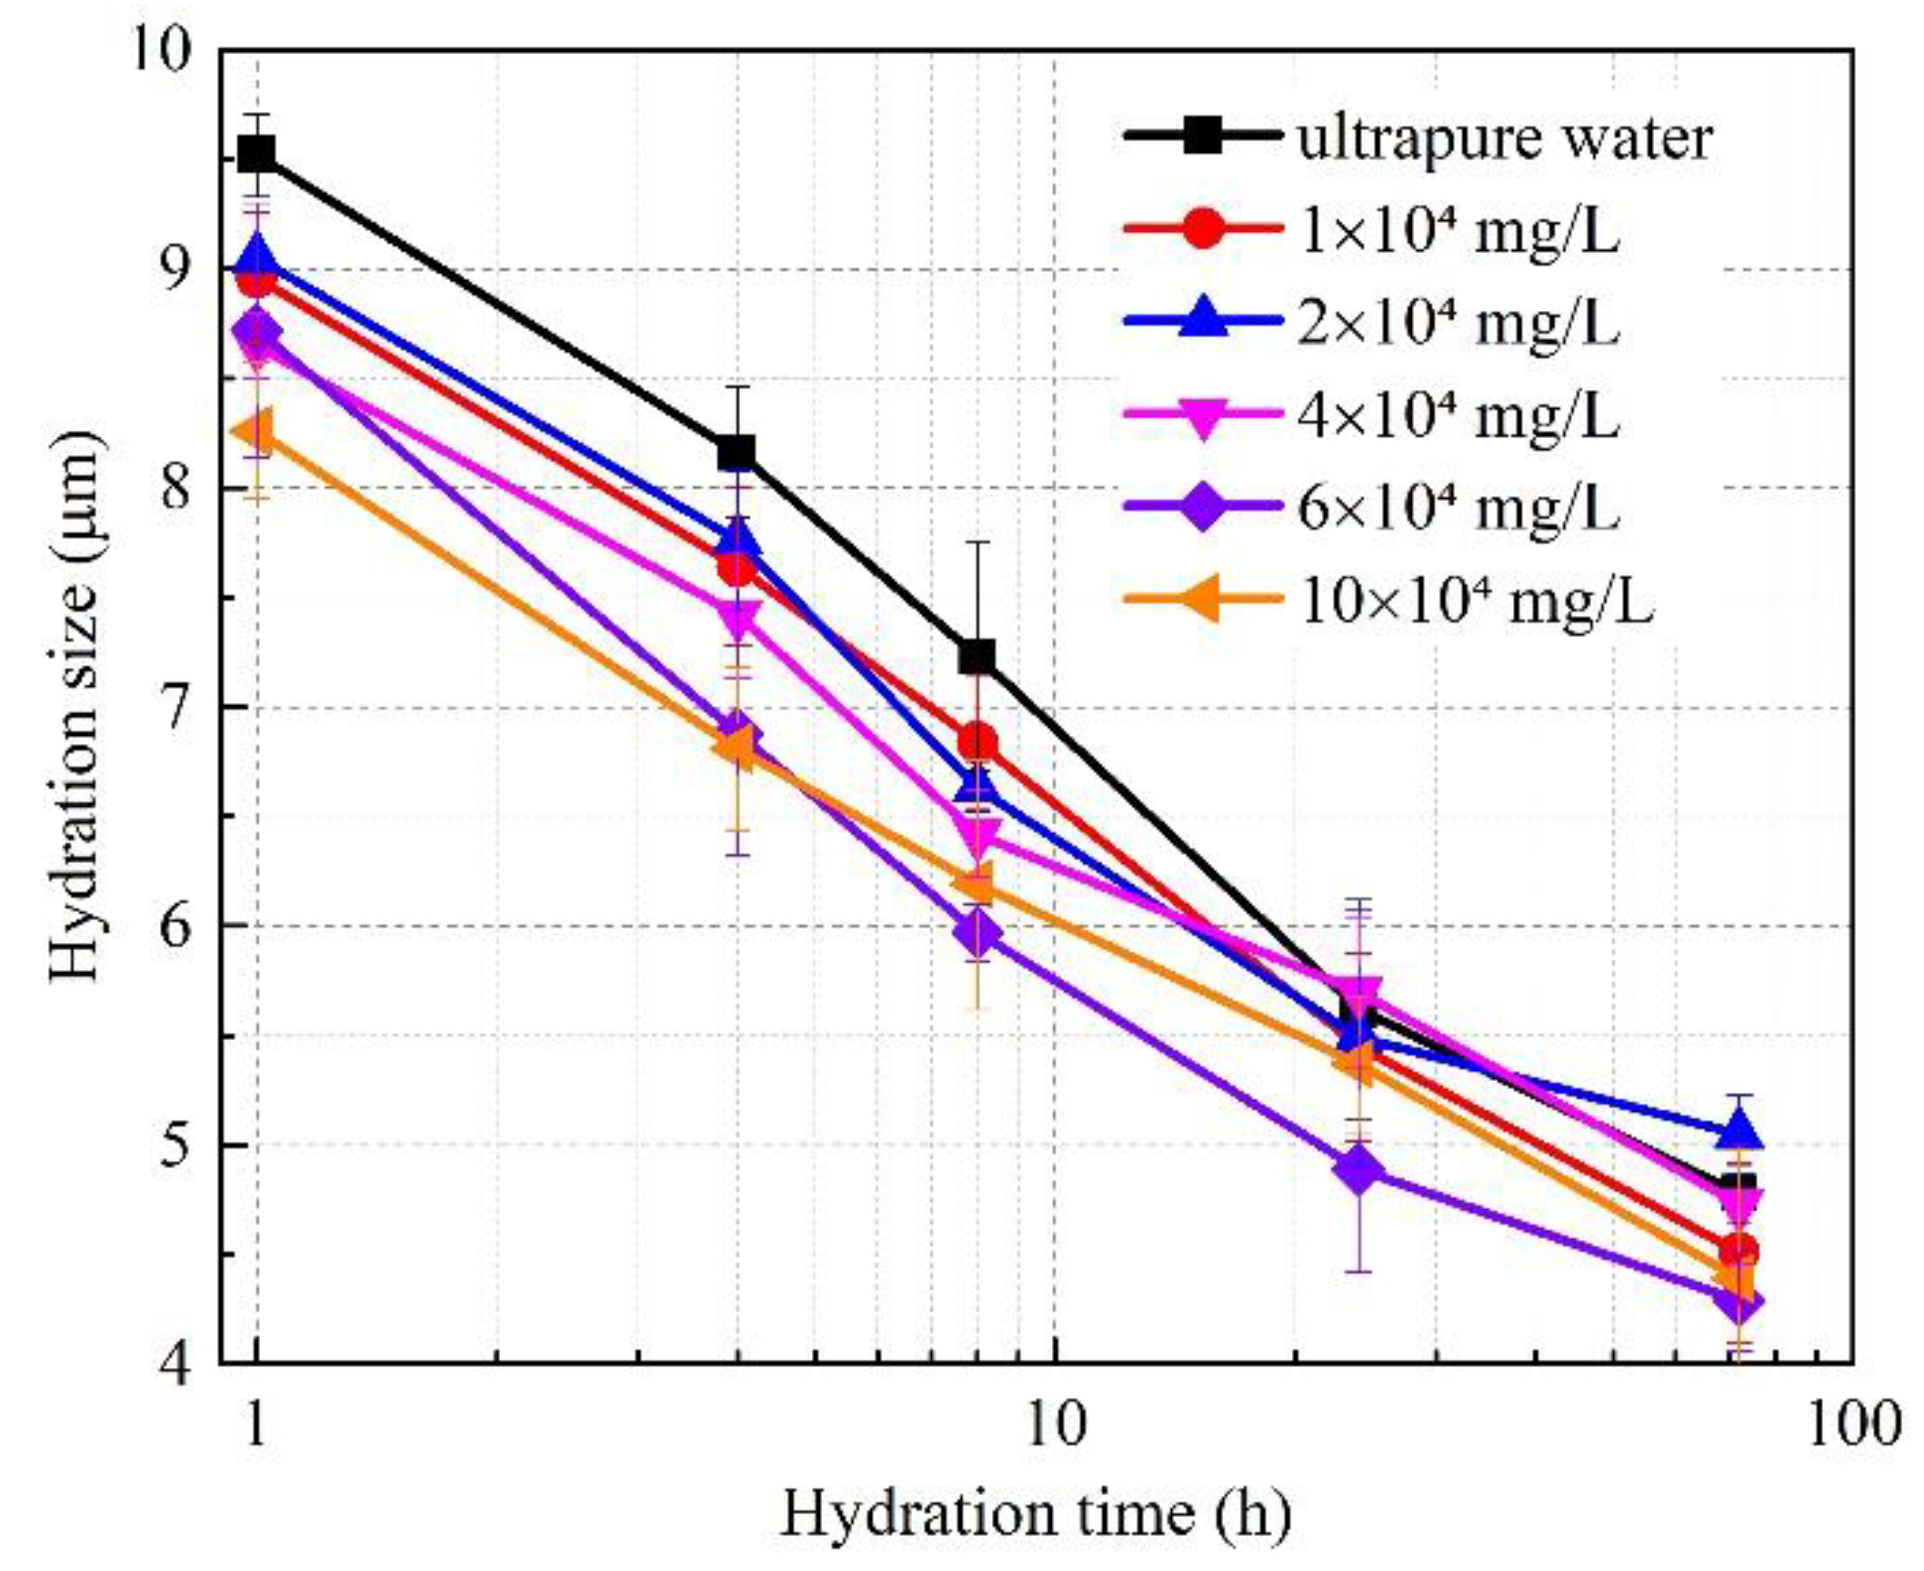
2.3.3. Particle Size Distribution in Dispersion System

First, we extracted the supernatant of clay-surfactant dispersion. Second, we injected the supernatant into the sample cell, and determined the particle size distribution of the sample with the laser particle size analyzer.

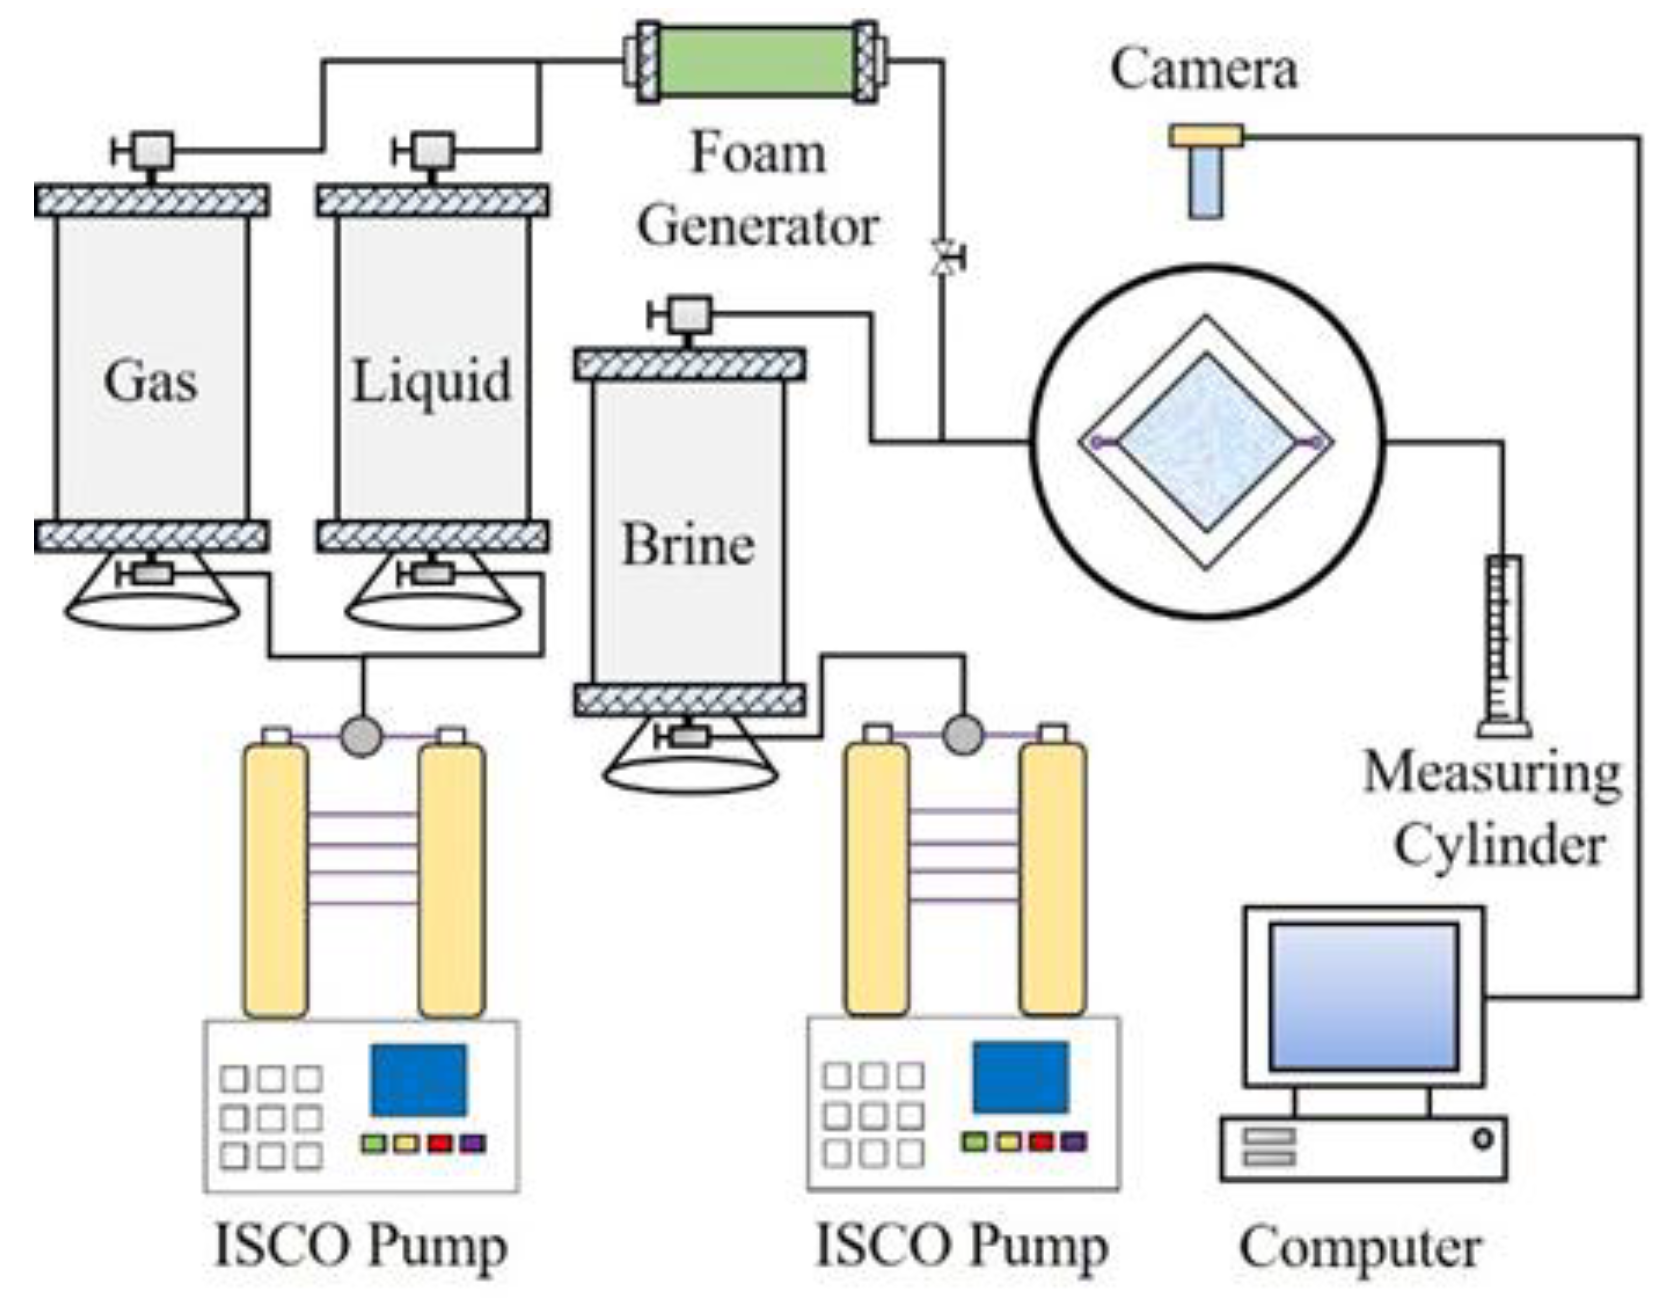
2.3.4. Foam States under Static and Flow Station

The shape and state of foams under static and flow station in porous media were observed with the visible microscopic models, and the diagram of the apparatus is depicted in Figure 2. The visible porous media models were made of glass. First, the structure of porous media was scanned from the core slice. Second, the recorded structure was etched on a piece of glass with laser. Finally, two pieces of glass were stuck together under high temperature. In this study, three kinds of visible models with various permeabilities were used to investigate the state of foam in porous media. The dimensions of the visible model were 40 × 40 mm, and the depths of channels were 60 μm. The width of channel is the key parameter to determine the properties of the model, and the widths of channels of high-, moderate-, and low-permeable models were 80 μm, 40 μm, and 10 μm, respectively.
The detailed procedures are listed below. First, the visible model was saturated with ultrapure water. Second, N2 and surfactant solution or clay-surfactant dispersion were pumped through the foam generator simultaneously to get the foam fluid, and the ratio of gas to liquid was 1:1. Third, the foam fluid was injected into the visible model, and the state of foam under static and flow station was observed and recorded with a camera.

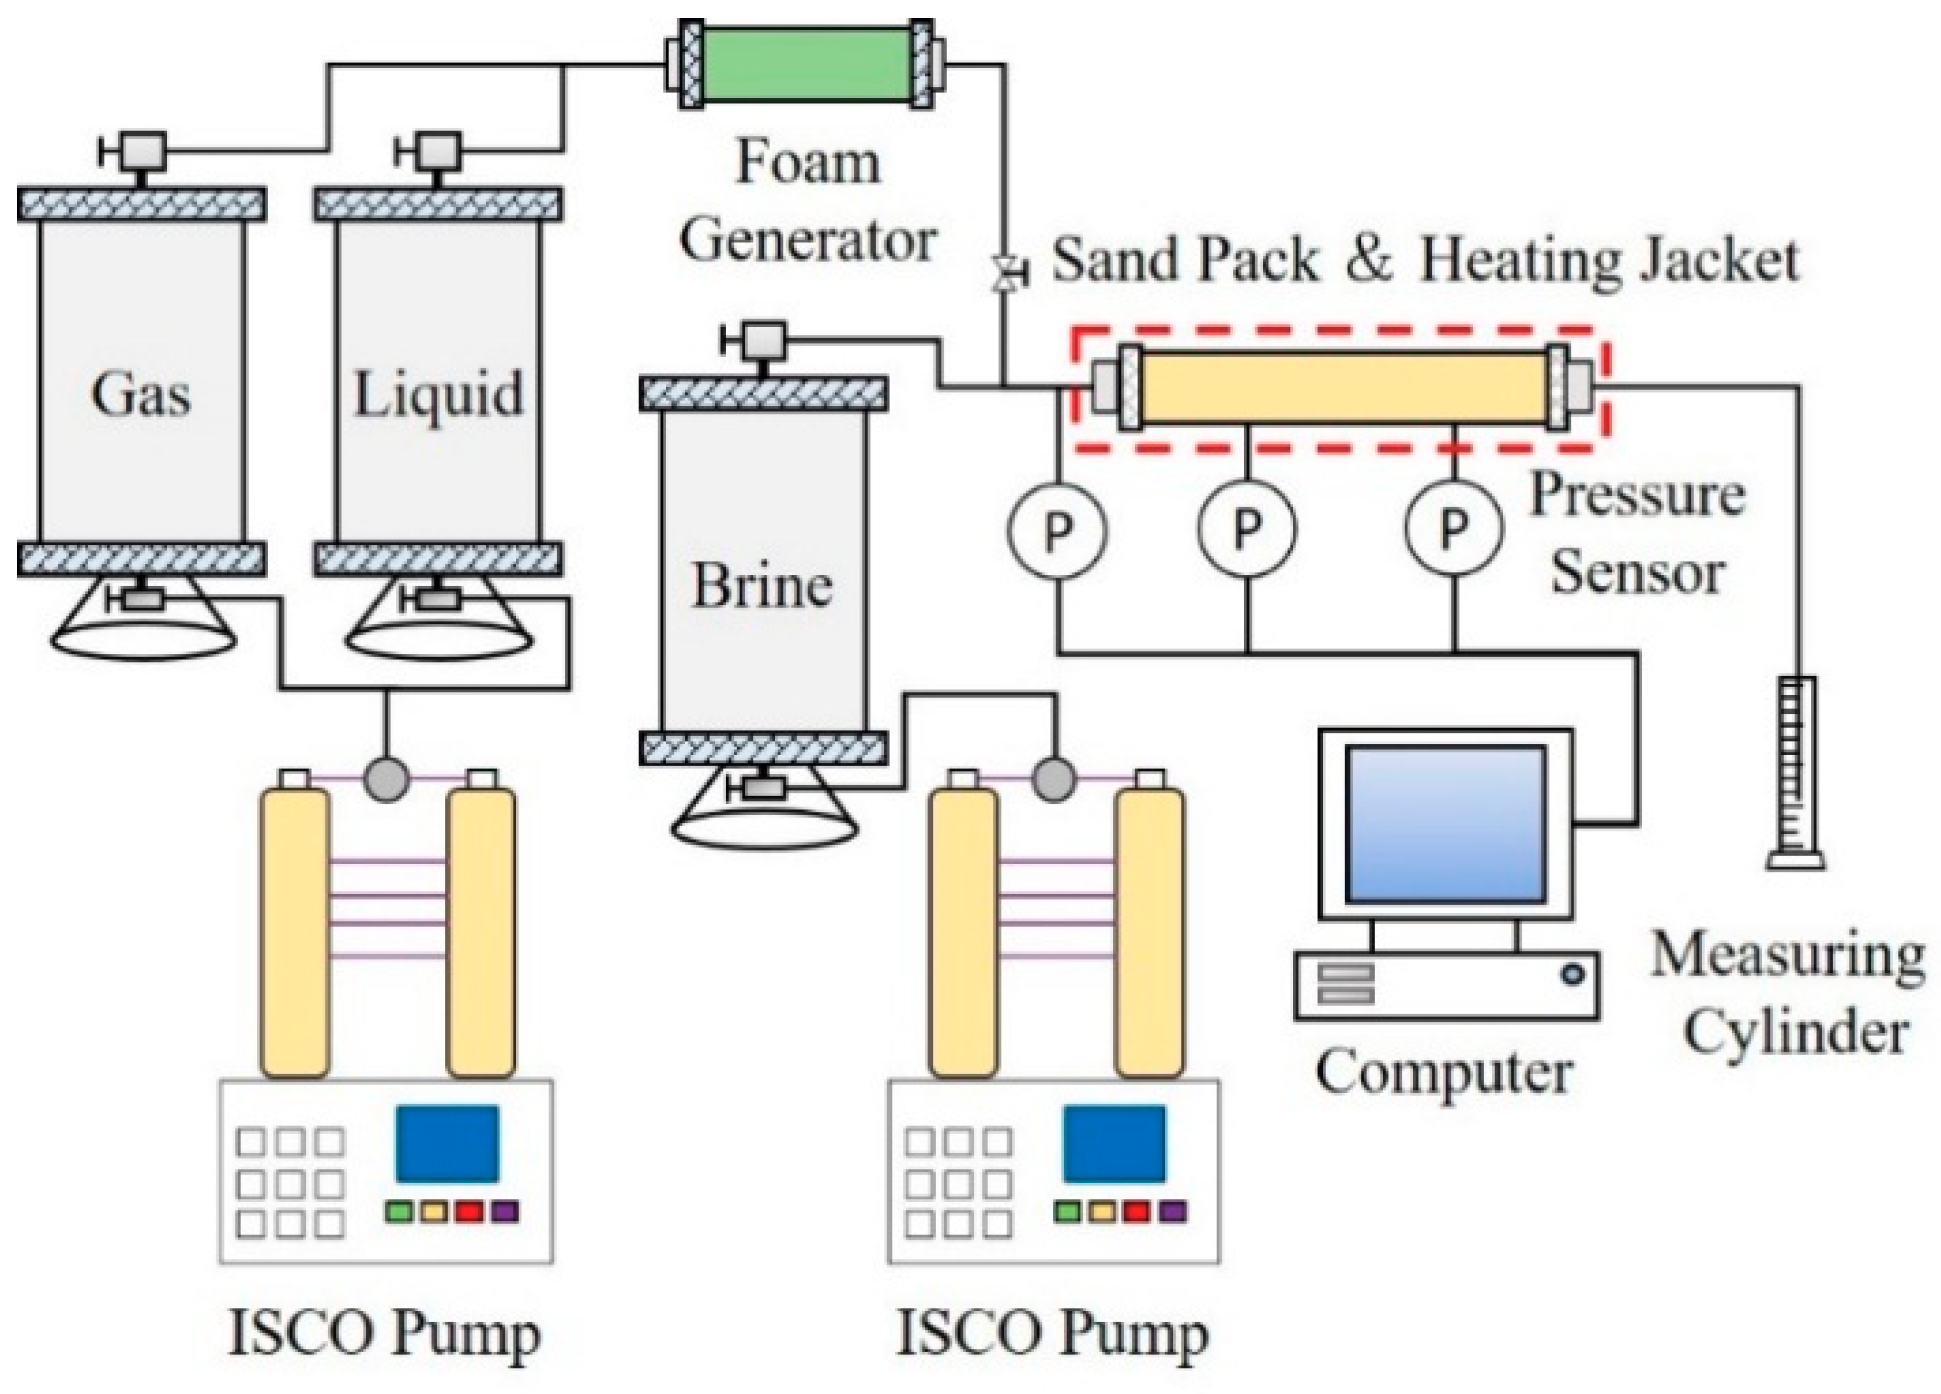
2.3.5. Foam Flooding in Sandpacks

There were 11 groups of flooding experiments conducted to study the effects of different factors on profile control of the clay-surfactant foam. The diagram of the apparatus used in flooding experiments is shown in Figure 3, and the experimental conditions of all experiments are tabulated in Table 1. The experimental details are given as follows. First, the sandpack was saturated with brine after being evacuated for 4.0 h, and the properties of the sandpack, such as porosity and permeability, were determined during the saturating process. Second, we set the temperature of heating jacket at the target value and kept it for 2.0 h to reach the equilibrium state in the sandpack. Third, the gas and liquid were pumped into the foam generator synchronously according to the specific ratio of gas to liquid and the injection rate, and the foam fluid was injected into the sandpack. Moreover, pressures of the front, mid and rear parts of the sandpack were recorded during all experiments to evaluate the profile control effect.
The segmental resistance factor is defined in this work to evaluate the plugging effect of the clay-surfactant foam under different experimental conditions. The segmental resistance factor can be determined with Equation (1).
{ R f = p 1 p 2 p s 1 p s 2 R m = p 2 p 3 p s 2 p s 3 R r = p 3 p a p s 1 p a
where R f , R m and R r are resistance factors of the front, mid and rear parts of the sandpack, respectively; p 1 , p 2 and p 3 are pressures of the front, mid and rear test points during the flooding process, respectively, in MPa; p s 1 , p s 2 and p s 3 are pressures at the front, mid and rear test points during the saturating process, respectively, MPa; p a is the atmosphere pressure, in MPa.

3. Results and Discussion

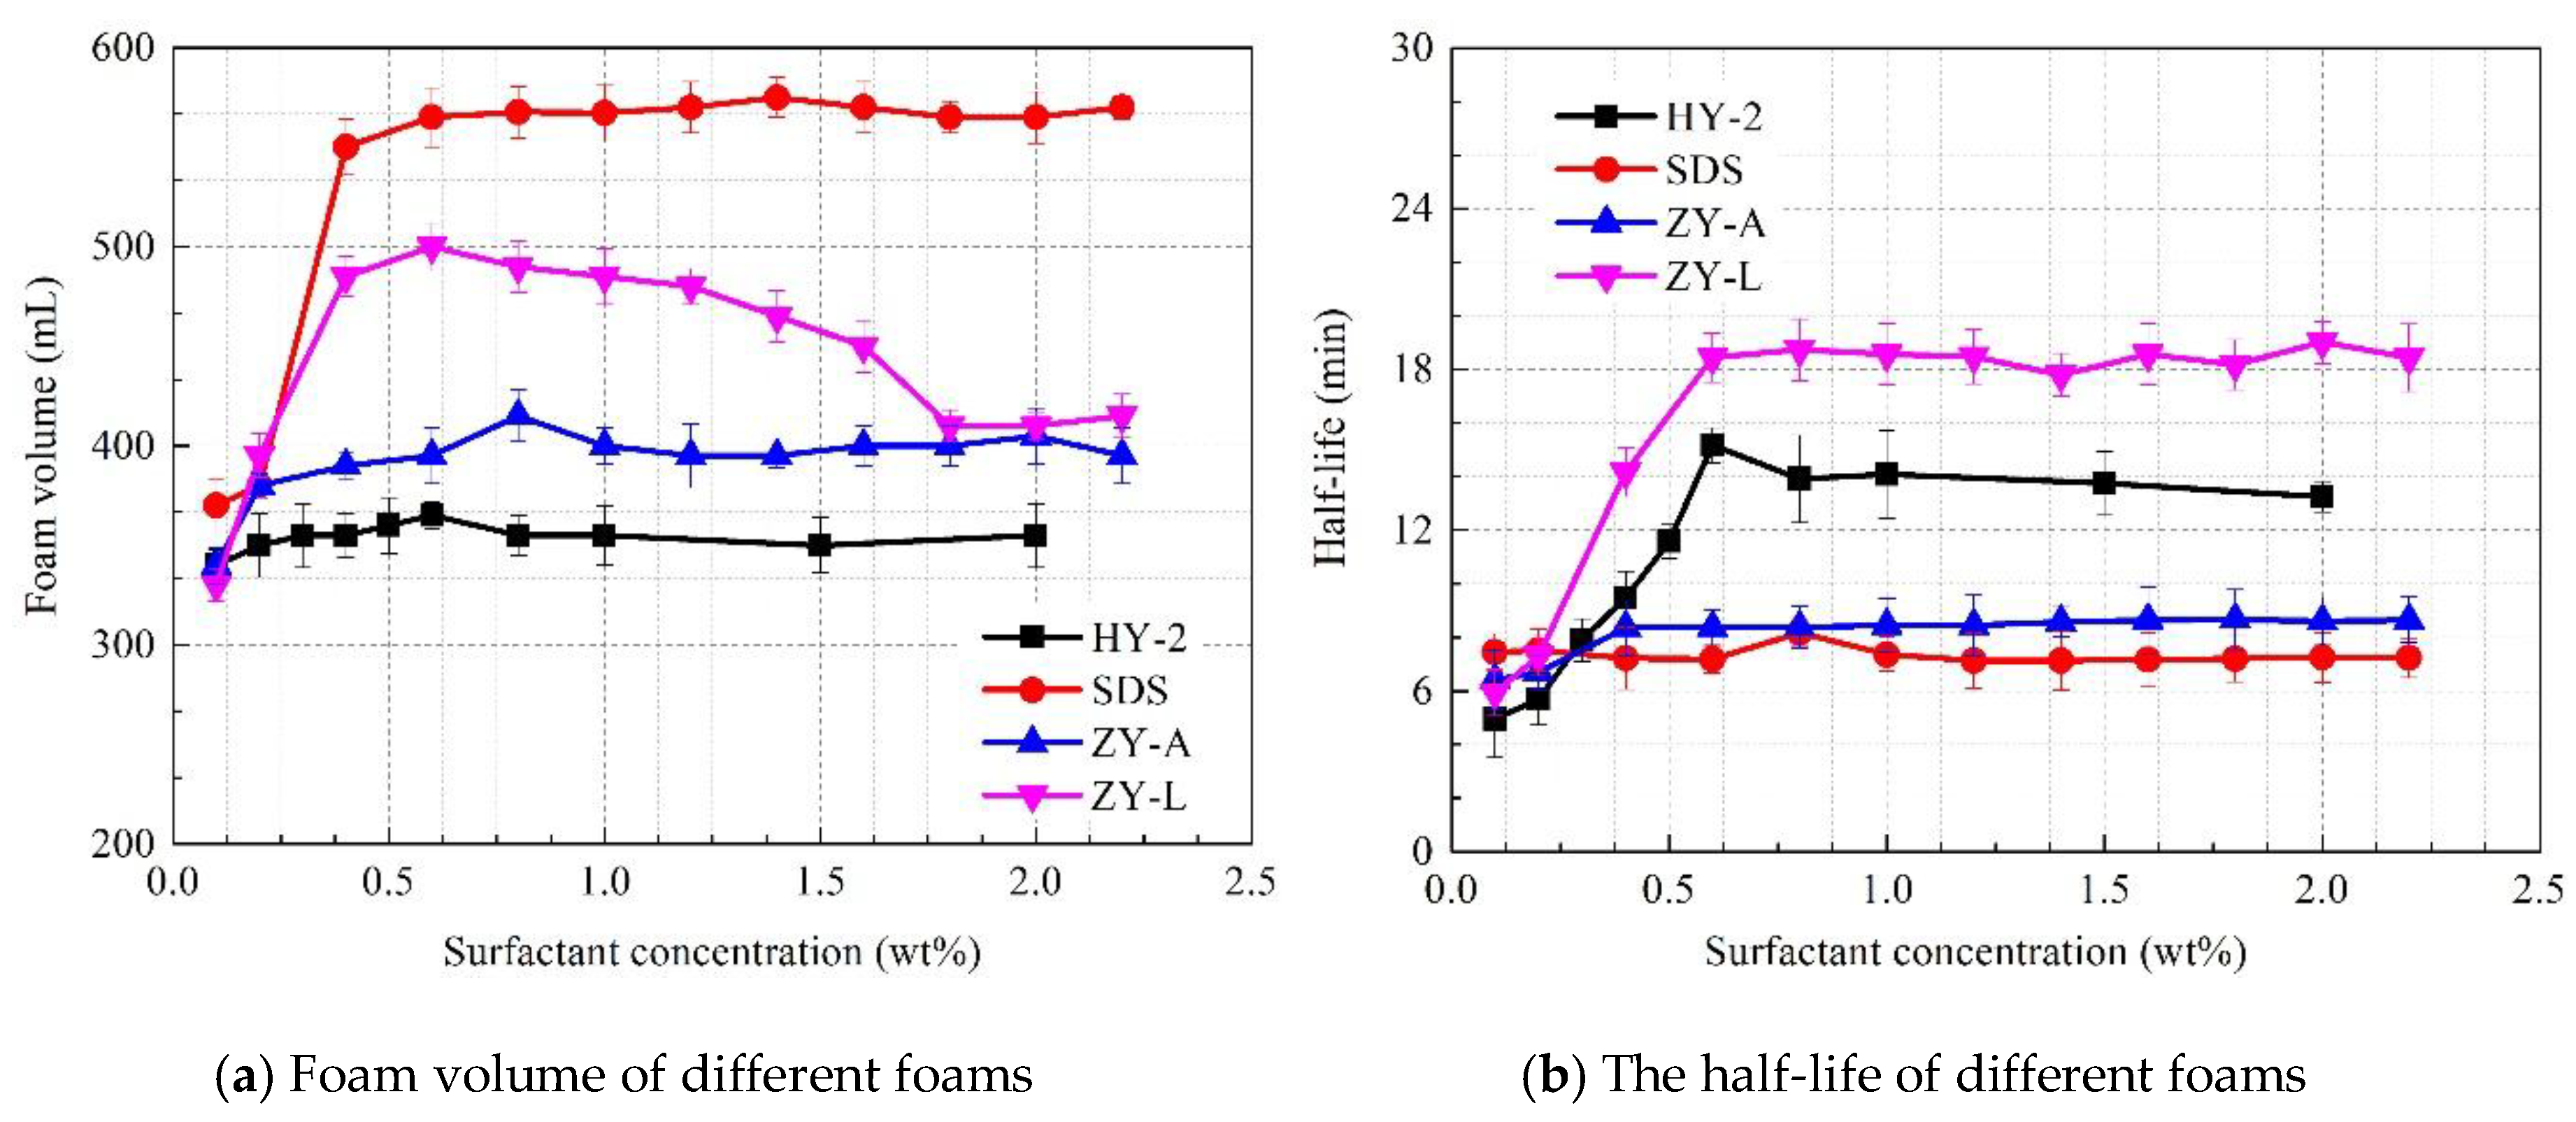
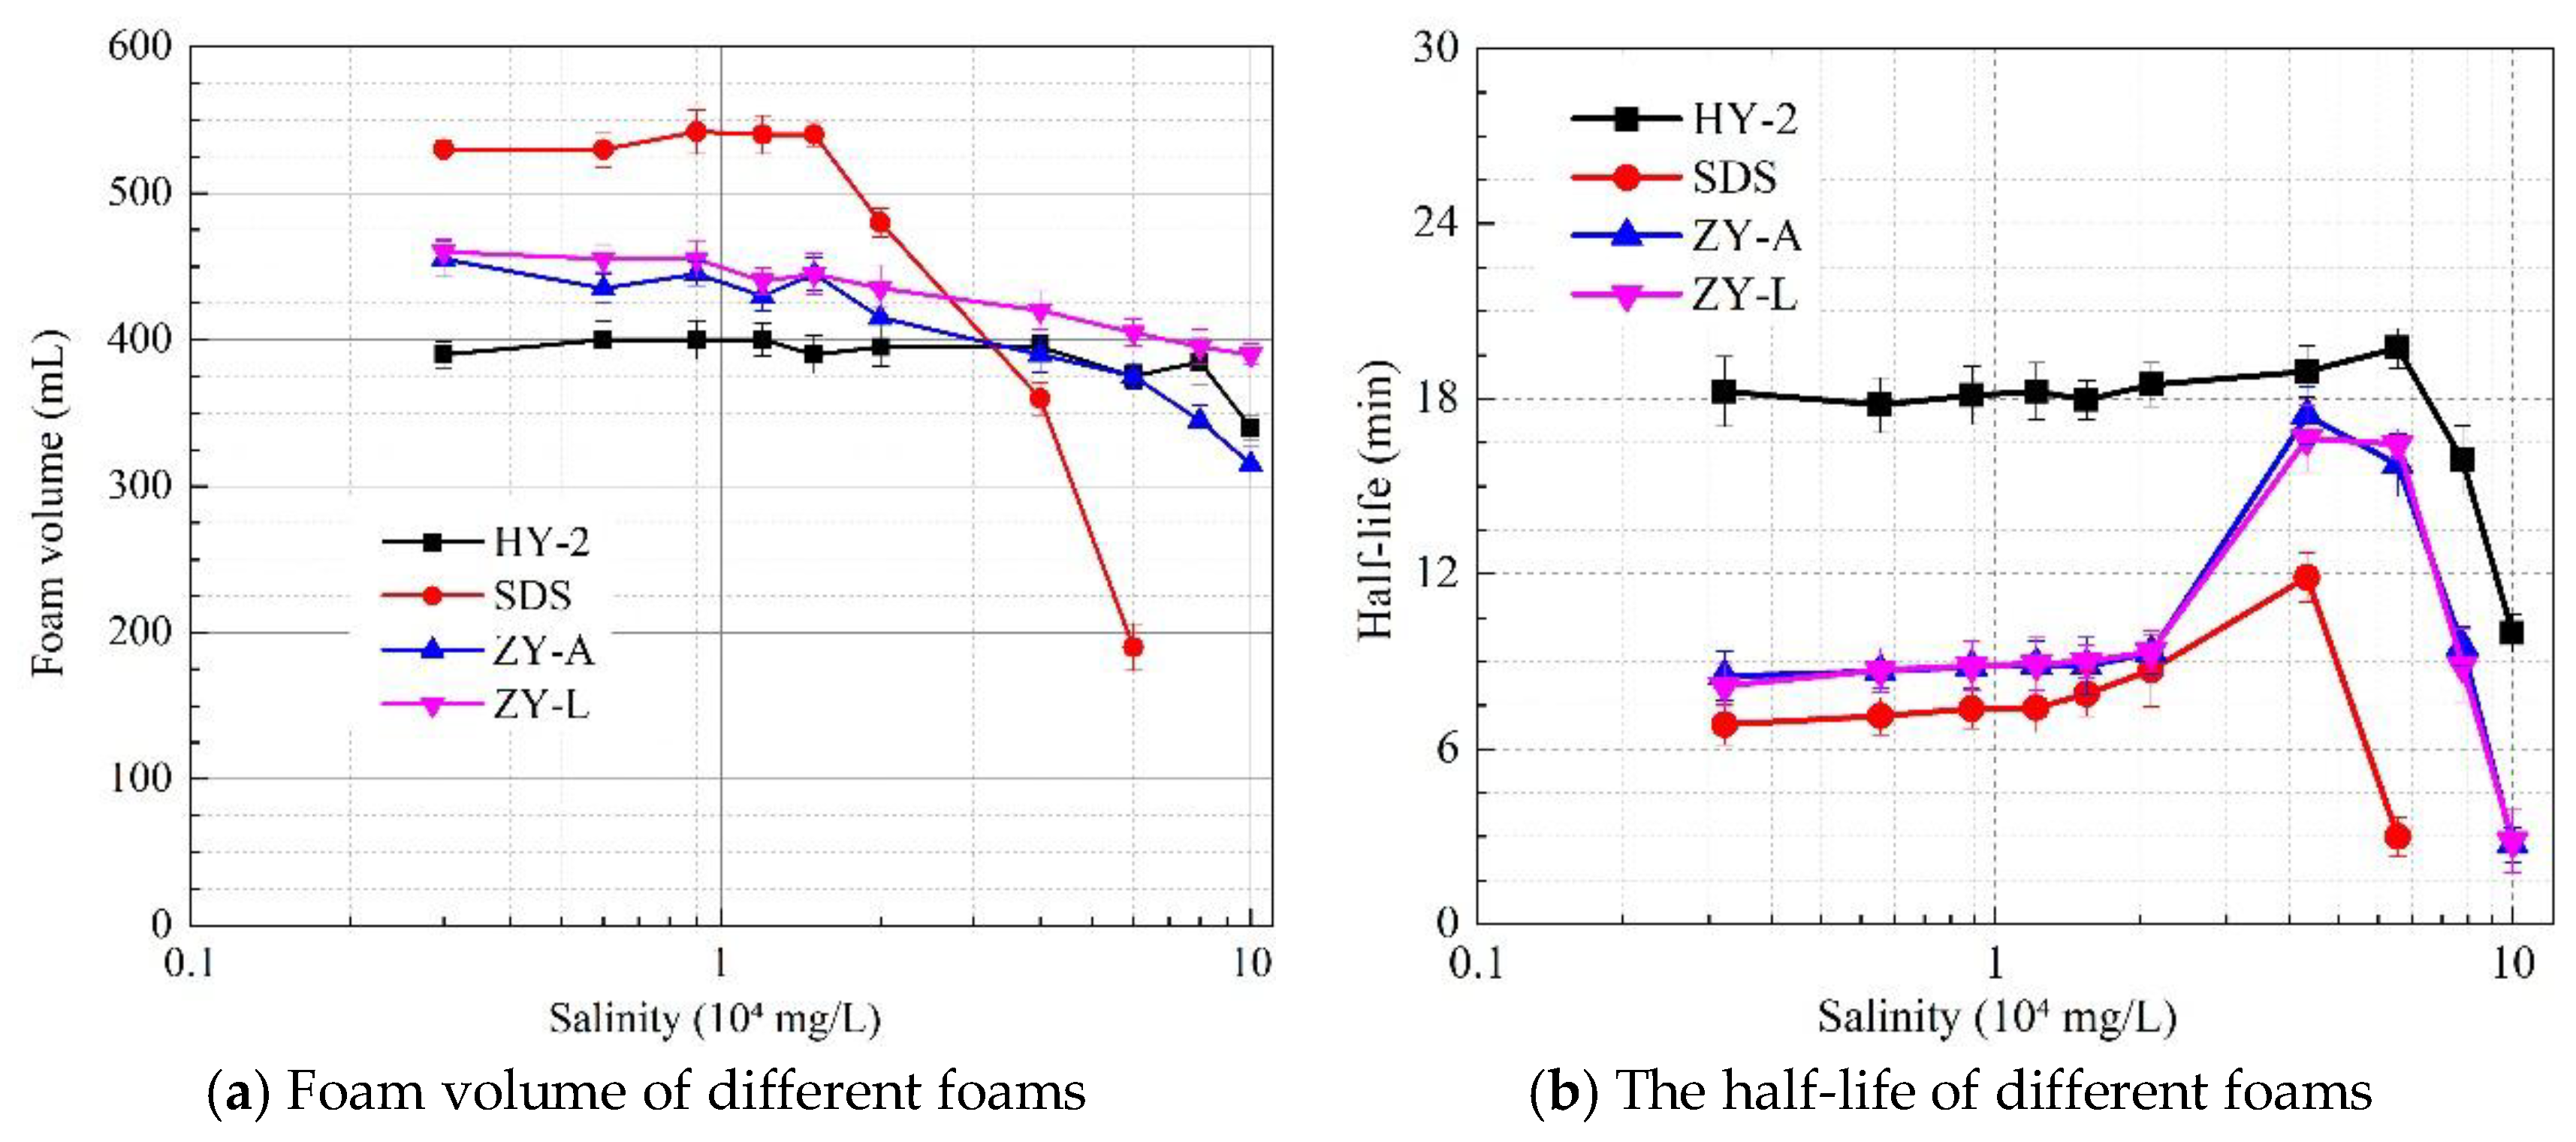
3.1. Surfactant Optimization

The properties of ultrapure water foams stabilized by different surfactants are illustrated in Figure 4. According to Figure 4a, the foam volumes stabilized by ZY-A and HY-2 increase slightly as the increasing surfactant concentration, and then the foam volumes reach a plateau. Generally, the changes of these two curves are not obvious. The foam volume stabilized by SDS skyrocketed to 560 mL before the concentration reached 0.4 wt%, and then the increase of concentration had no obvious effect on foam volume. As for foam stabilized with ZY-L, the volume increased rapidly until the ZY-A concentration exceeded 0.4 wt%, while the foam volume decreased gradually with the increase of ZY-A concentration until it reached 420 mL. In addition, the volumes of all foams were higher than 350 mL, which shows that all of four surfactants have satisfactory foamability to meet the requirement of site application [24,25].
The stabilities of foams are shown in Figure 4b. For the foams stabilized with SDS and ZY-A, the effect of the increasing concentration was negligible, and the half-life of these two foams was around 8 min in the tested concentration region. As for the foams prepared with HY-2 and ZY-L, the stabilities increased rapidly until the concentration reached 0.6 wt%, then the half-life of these foams remained stable with the increasing surfactant concentration. Moreover, the stabilities of foams prepared with HY-2 and ZY-L were relatively better in four kinds of foams.
The properties of brine foams with various salinities stabilized by different surfactants are depicted in Figure 5. According to the Figure 5a, the volumes of brine foams stabilized with ZY-A and ZY-L decreased gradually with the increasing salinity, while the volumes were always higher than 300 mL. The foam prepared with HY-2 was not sensitive to the increase of salinity in the tested region, and the foam volume was around 400 mL. Furthermore, the presence of salt enhanced the foamability of HY-2 generally (compare black line in Figure 4a and Figure 5a). As for the brine foam stabilized with SDS, there was a plateau before the salinity exceeded 2.0 × 10⁴ mg/L, and then the volume dropped rapidly to 200 mL. In Figure 5b, half-lives of different foams are given. For foams stabilized with SDS, ZY-A and ZY-L, the half-lives were stable until the salinity surpassed 2.0 × 10⁴ mg/L, and then the stabilities of foams increased till the salinity reaches 4.0 × 10⁴ mg/L. After that, the half-lives of these three foams declined rapidly to 3 min. The half-life of the foam prepared with HY-2 was relatively stable in the salinity range of 0.2–6.0 × 10⁴ mg/L, and then it decreased with the increasing salinity. In general, the foam stabilized with HY-2 had the best stability with the presence of salt in four kinds of foams, and the salt even improved the stability of HY-2 foam when the salinity was less than 6.0 × 10⁴ mg/L (compare the blank line in Figure 4b and Figure 5b).
According to data in Figure 4 and Figure 5, HY-2 was selected as the optimum surfactant to prepare the clay-surfactant system, whose foamability, foam stability and salt resistance were satisfactory. The optimum concentration of HY-2 was 0.6 wt%, which was employed in preparing the clay-HY-2 dispersion and other experiments.

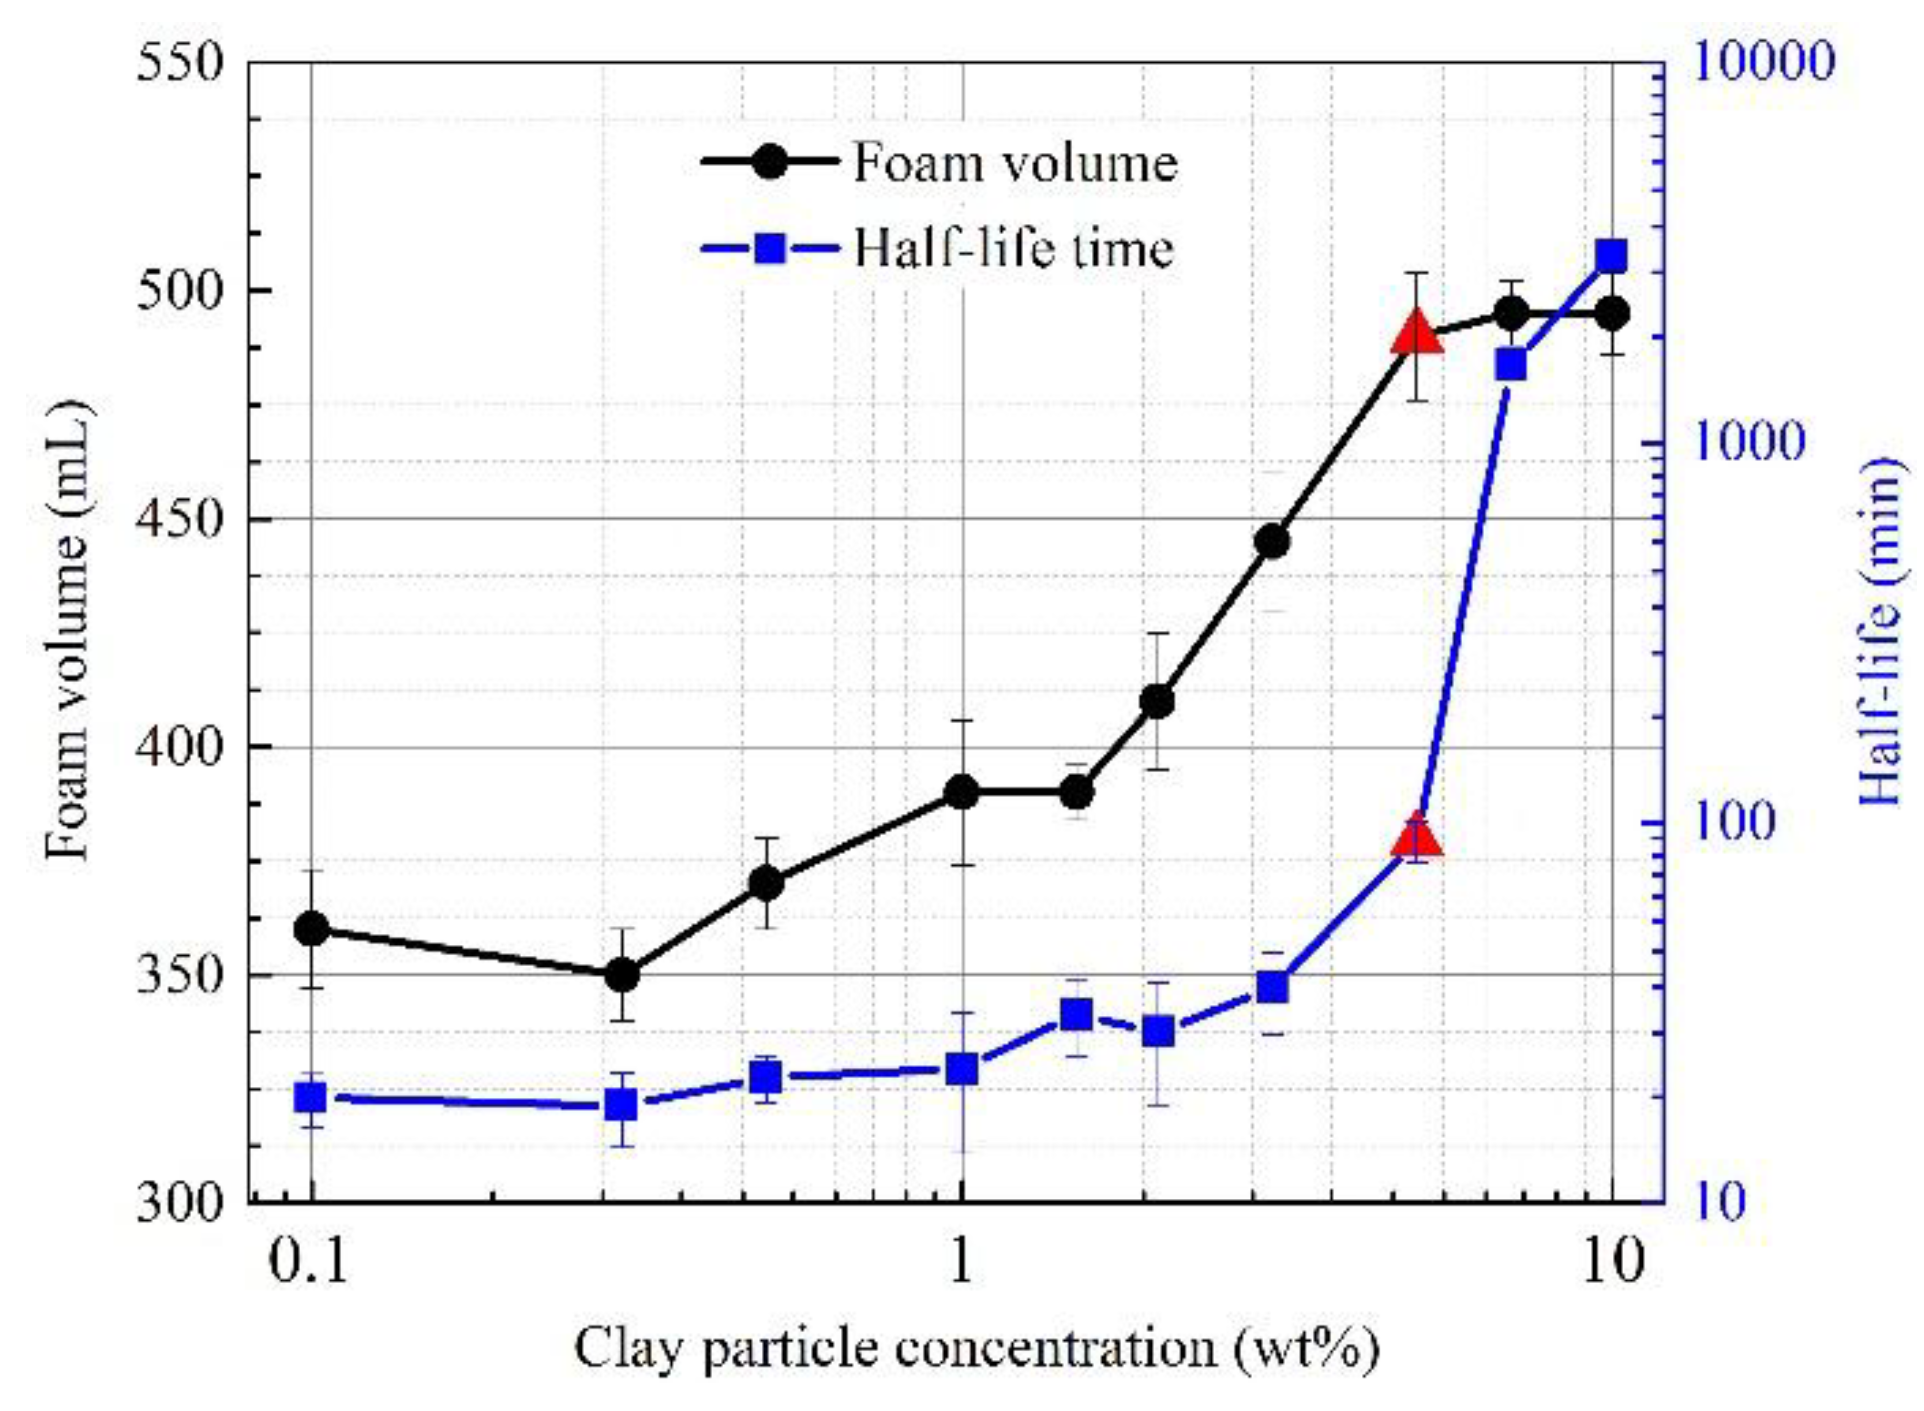
3.2. Clay-HY-2 Foam Evaluation

The properties of clay-HY-2 foam with different clay particle concentrations are depicted in Figure 6. The foam volume increased gradually with the clay concentration, while the increase rate got greater at the clay concentration range of 1.5–5.0 wt%. Then the volume stabilized at 490 mL. The figure also shows that the half-life of the clay enhanced foam increased slightly until the clay concentration reached 3.0 × 10⁴ mg/L, and then it skyrocketed and reached 3000 min. Thus, the optimum clay concentration of the clay-HY-2 system was determined as 5.0 wt%, which can make sure the foamability and foam stability of the dispersion.
The sizes of particles in the clay-HY-2 dispersions with different salinities are illustrated in Figure 7. As is shown in the figure, there was no distinguished difference among particle sizes of clay-HY-2 dispersions with and without salt, i.e., the salinity had no obvious influence on the hydration size of particles in clay-HY-2 dispersion. Therefore, the presence of salt did not restrict the dispersity and foam stability of the dispersion system.

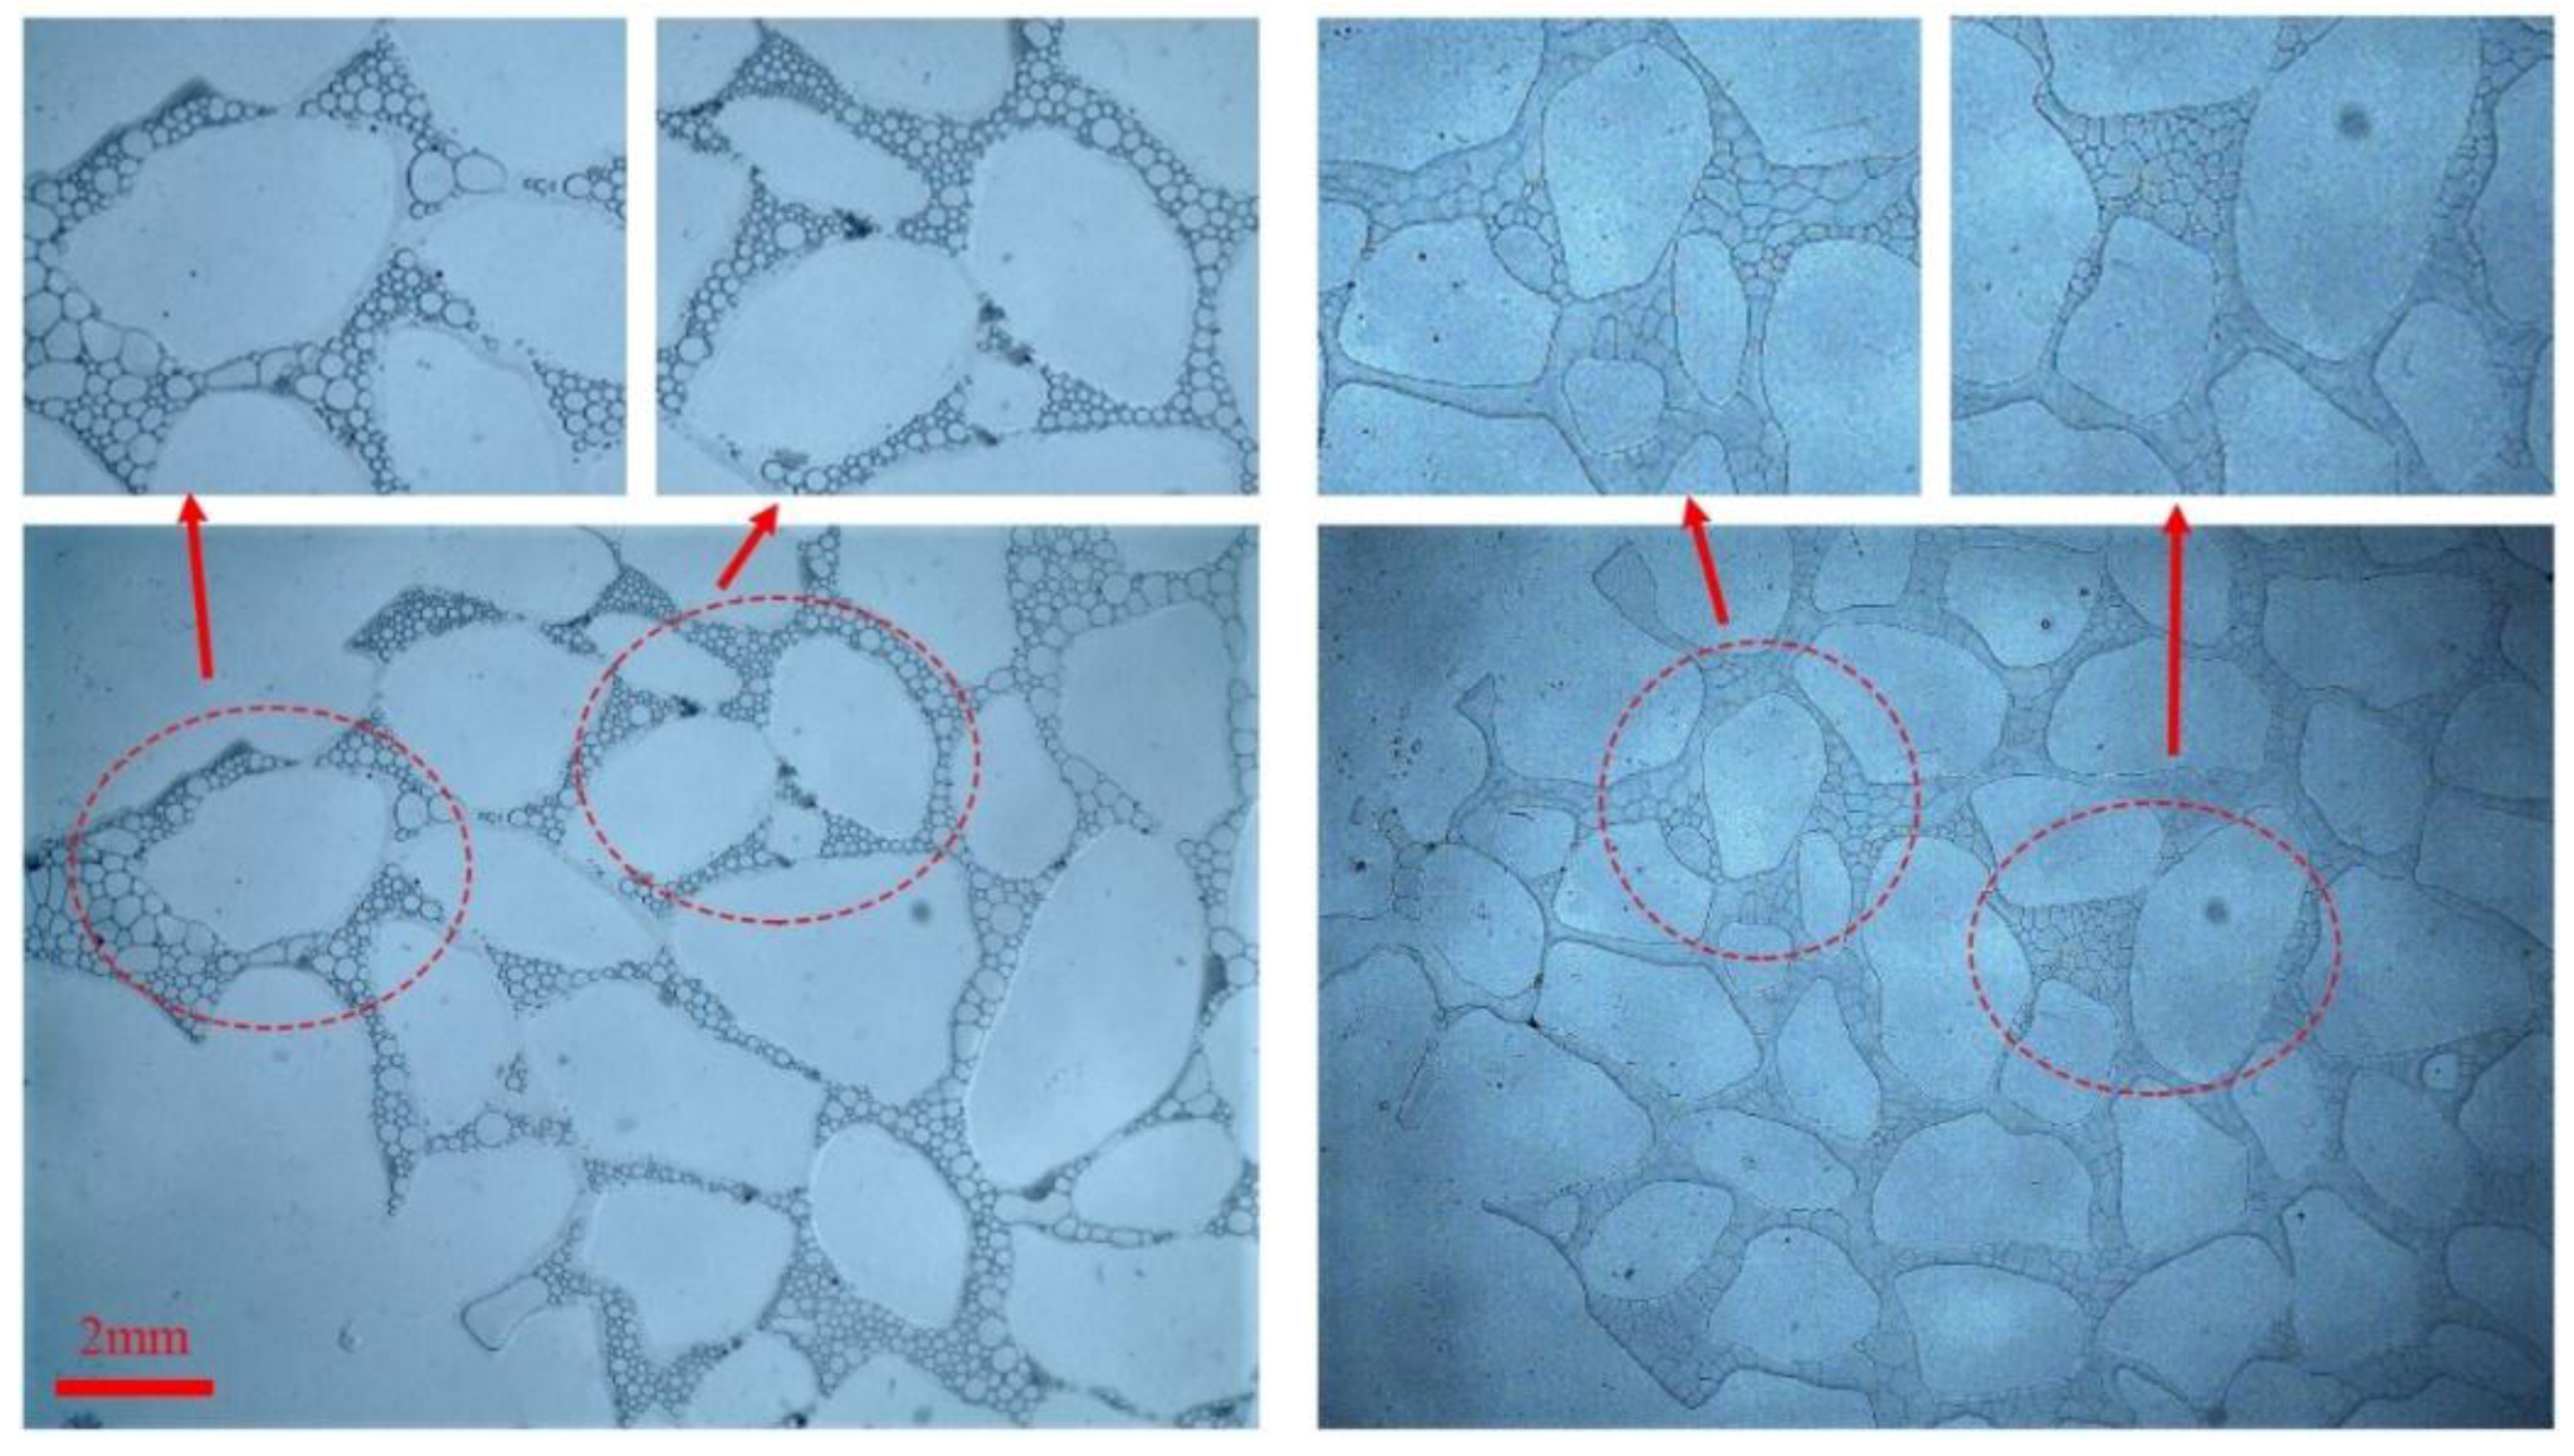
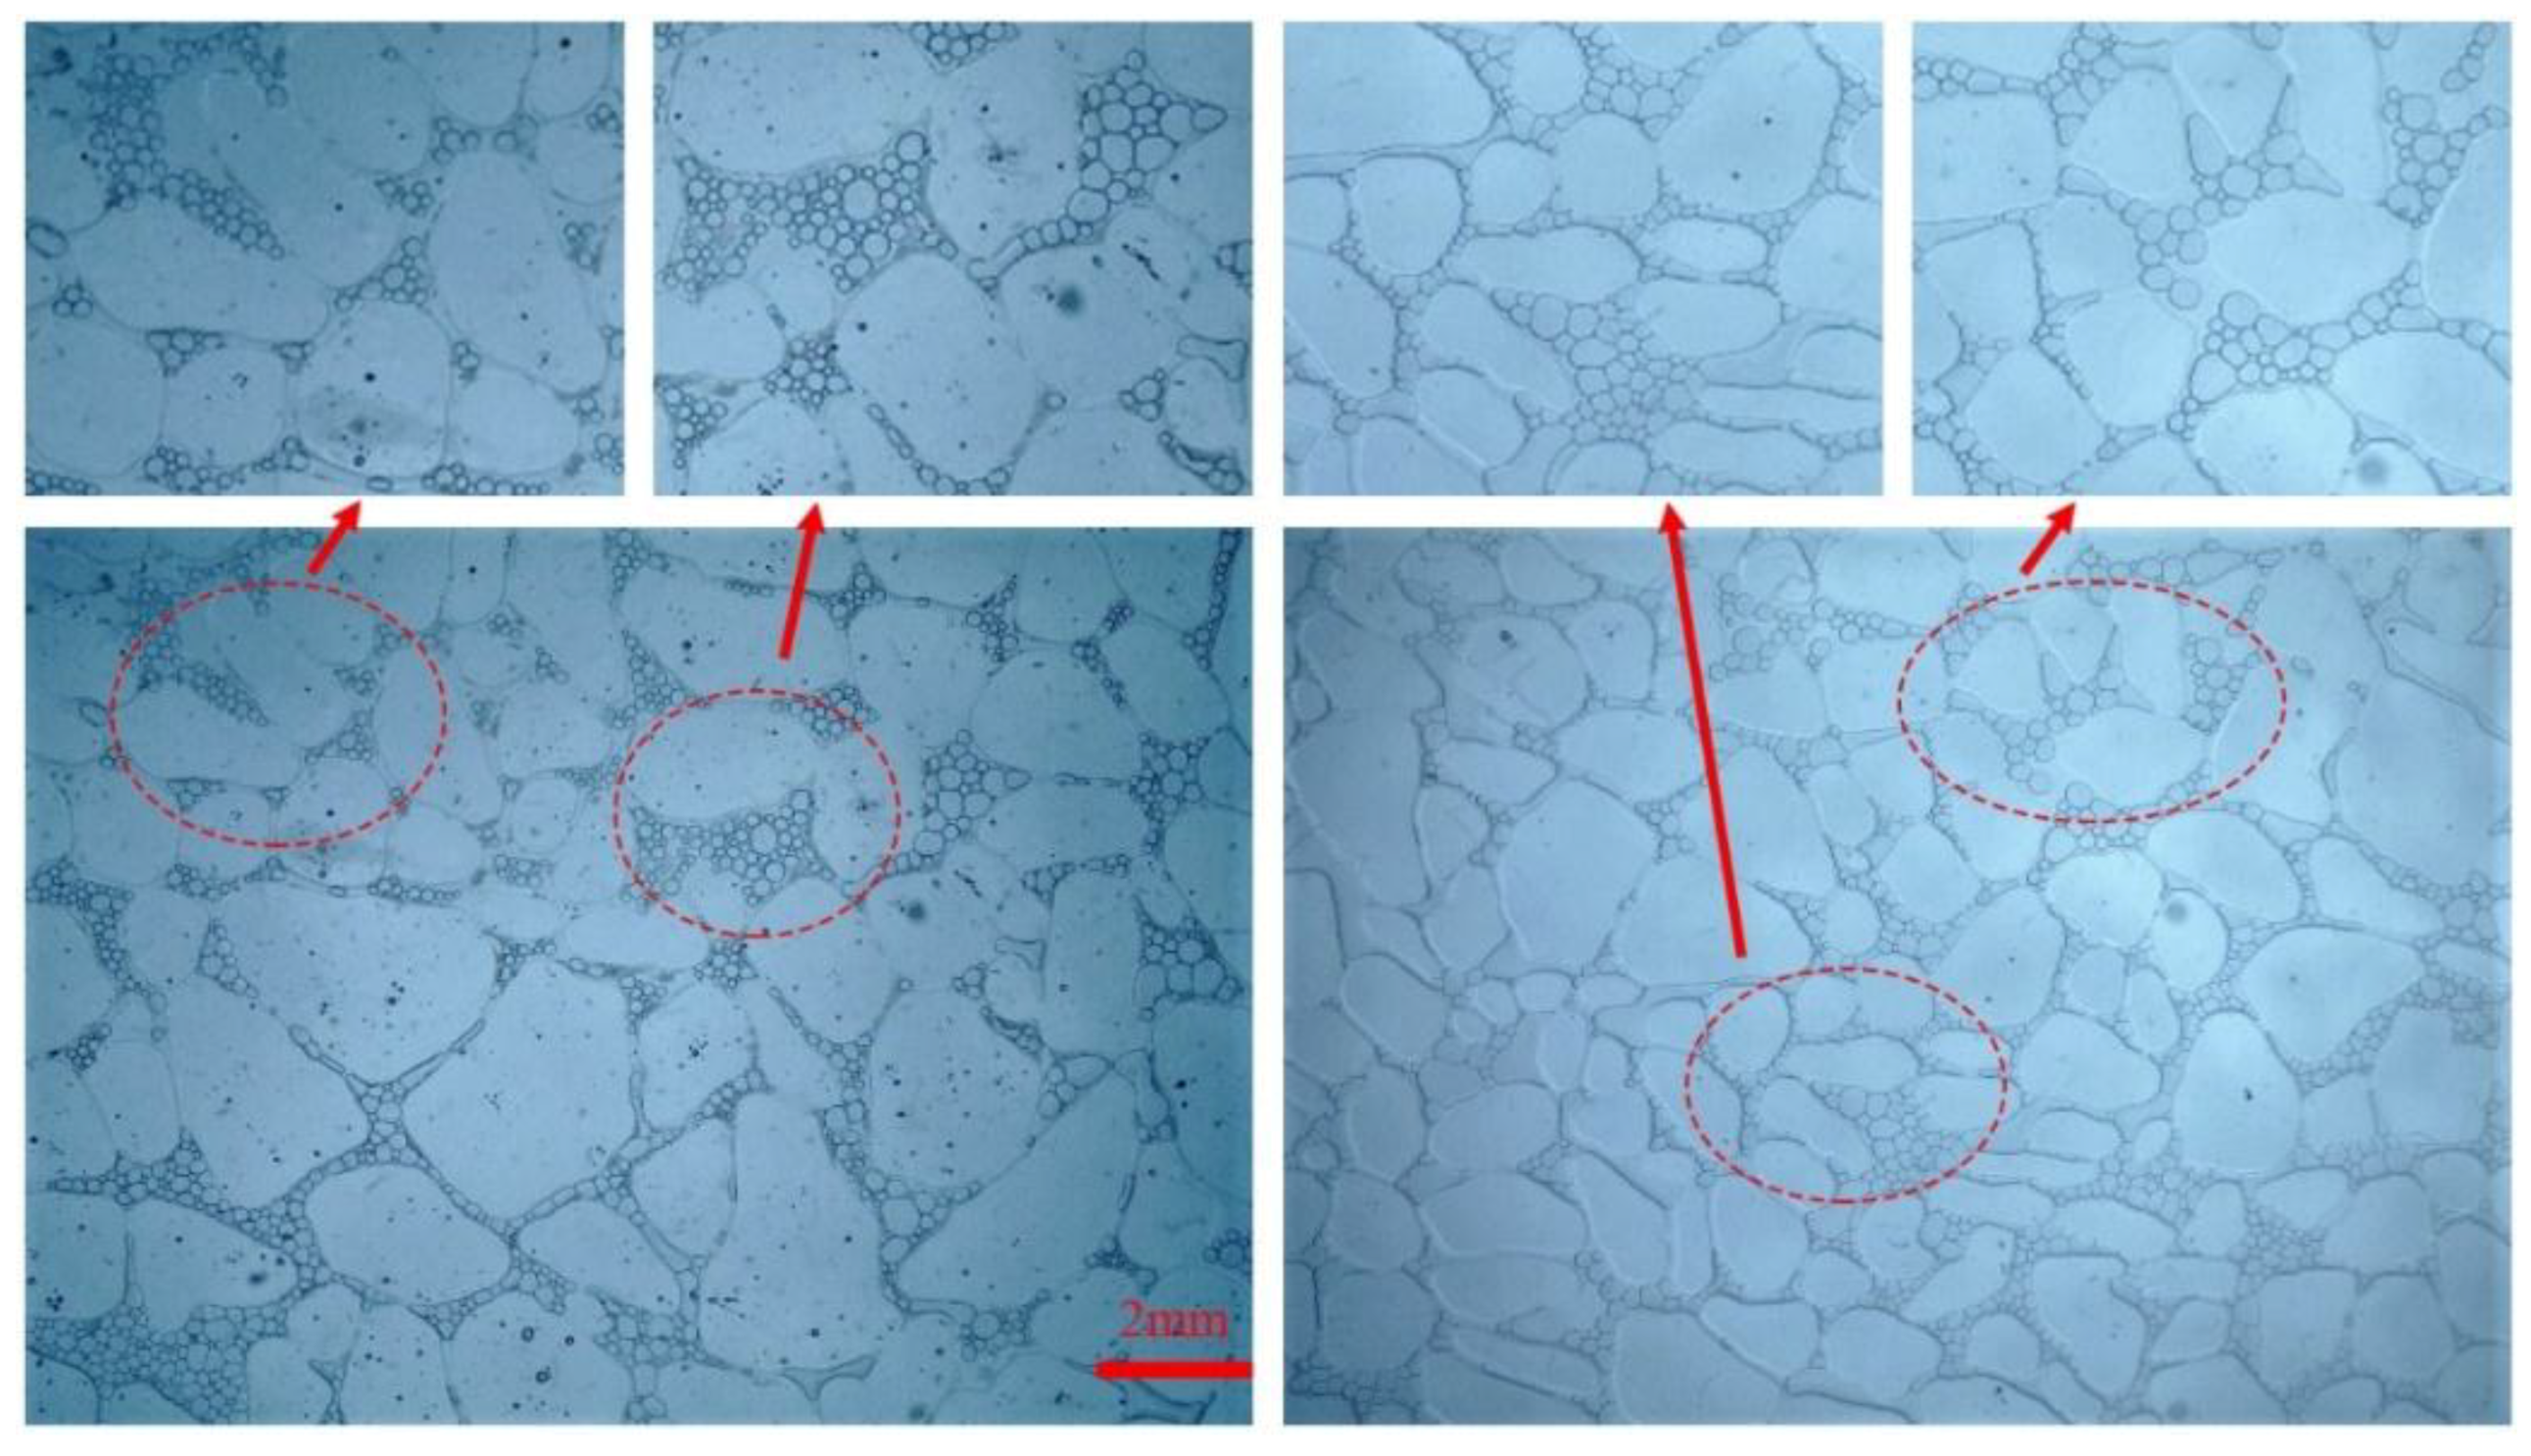
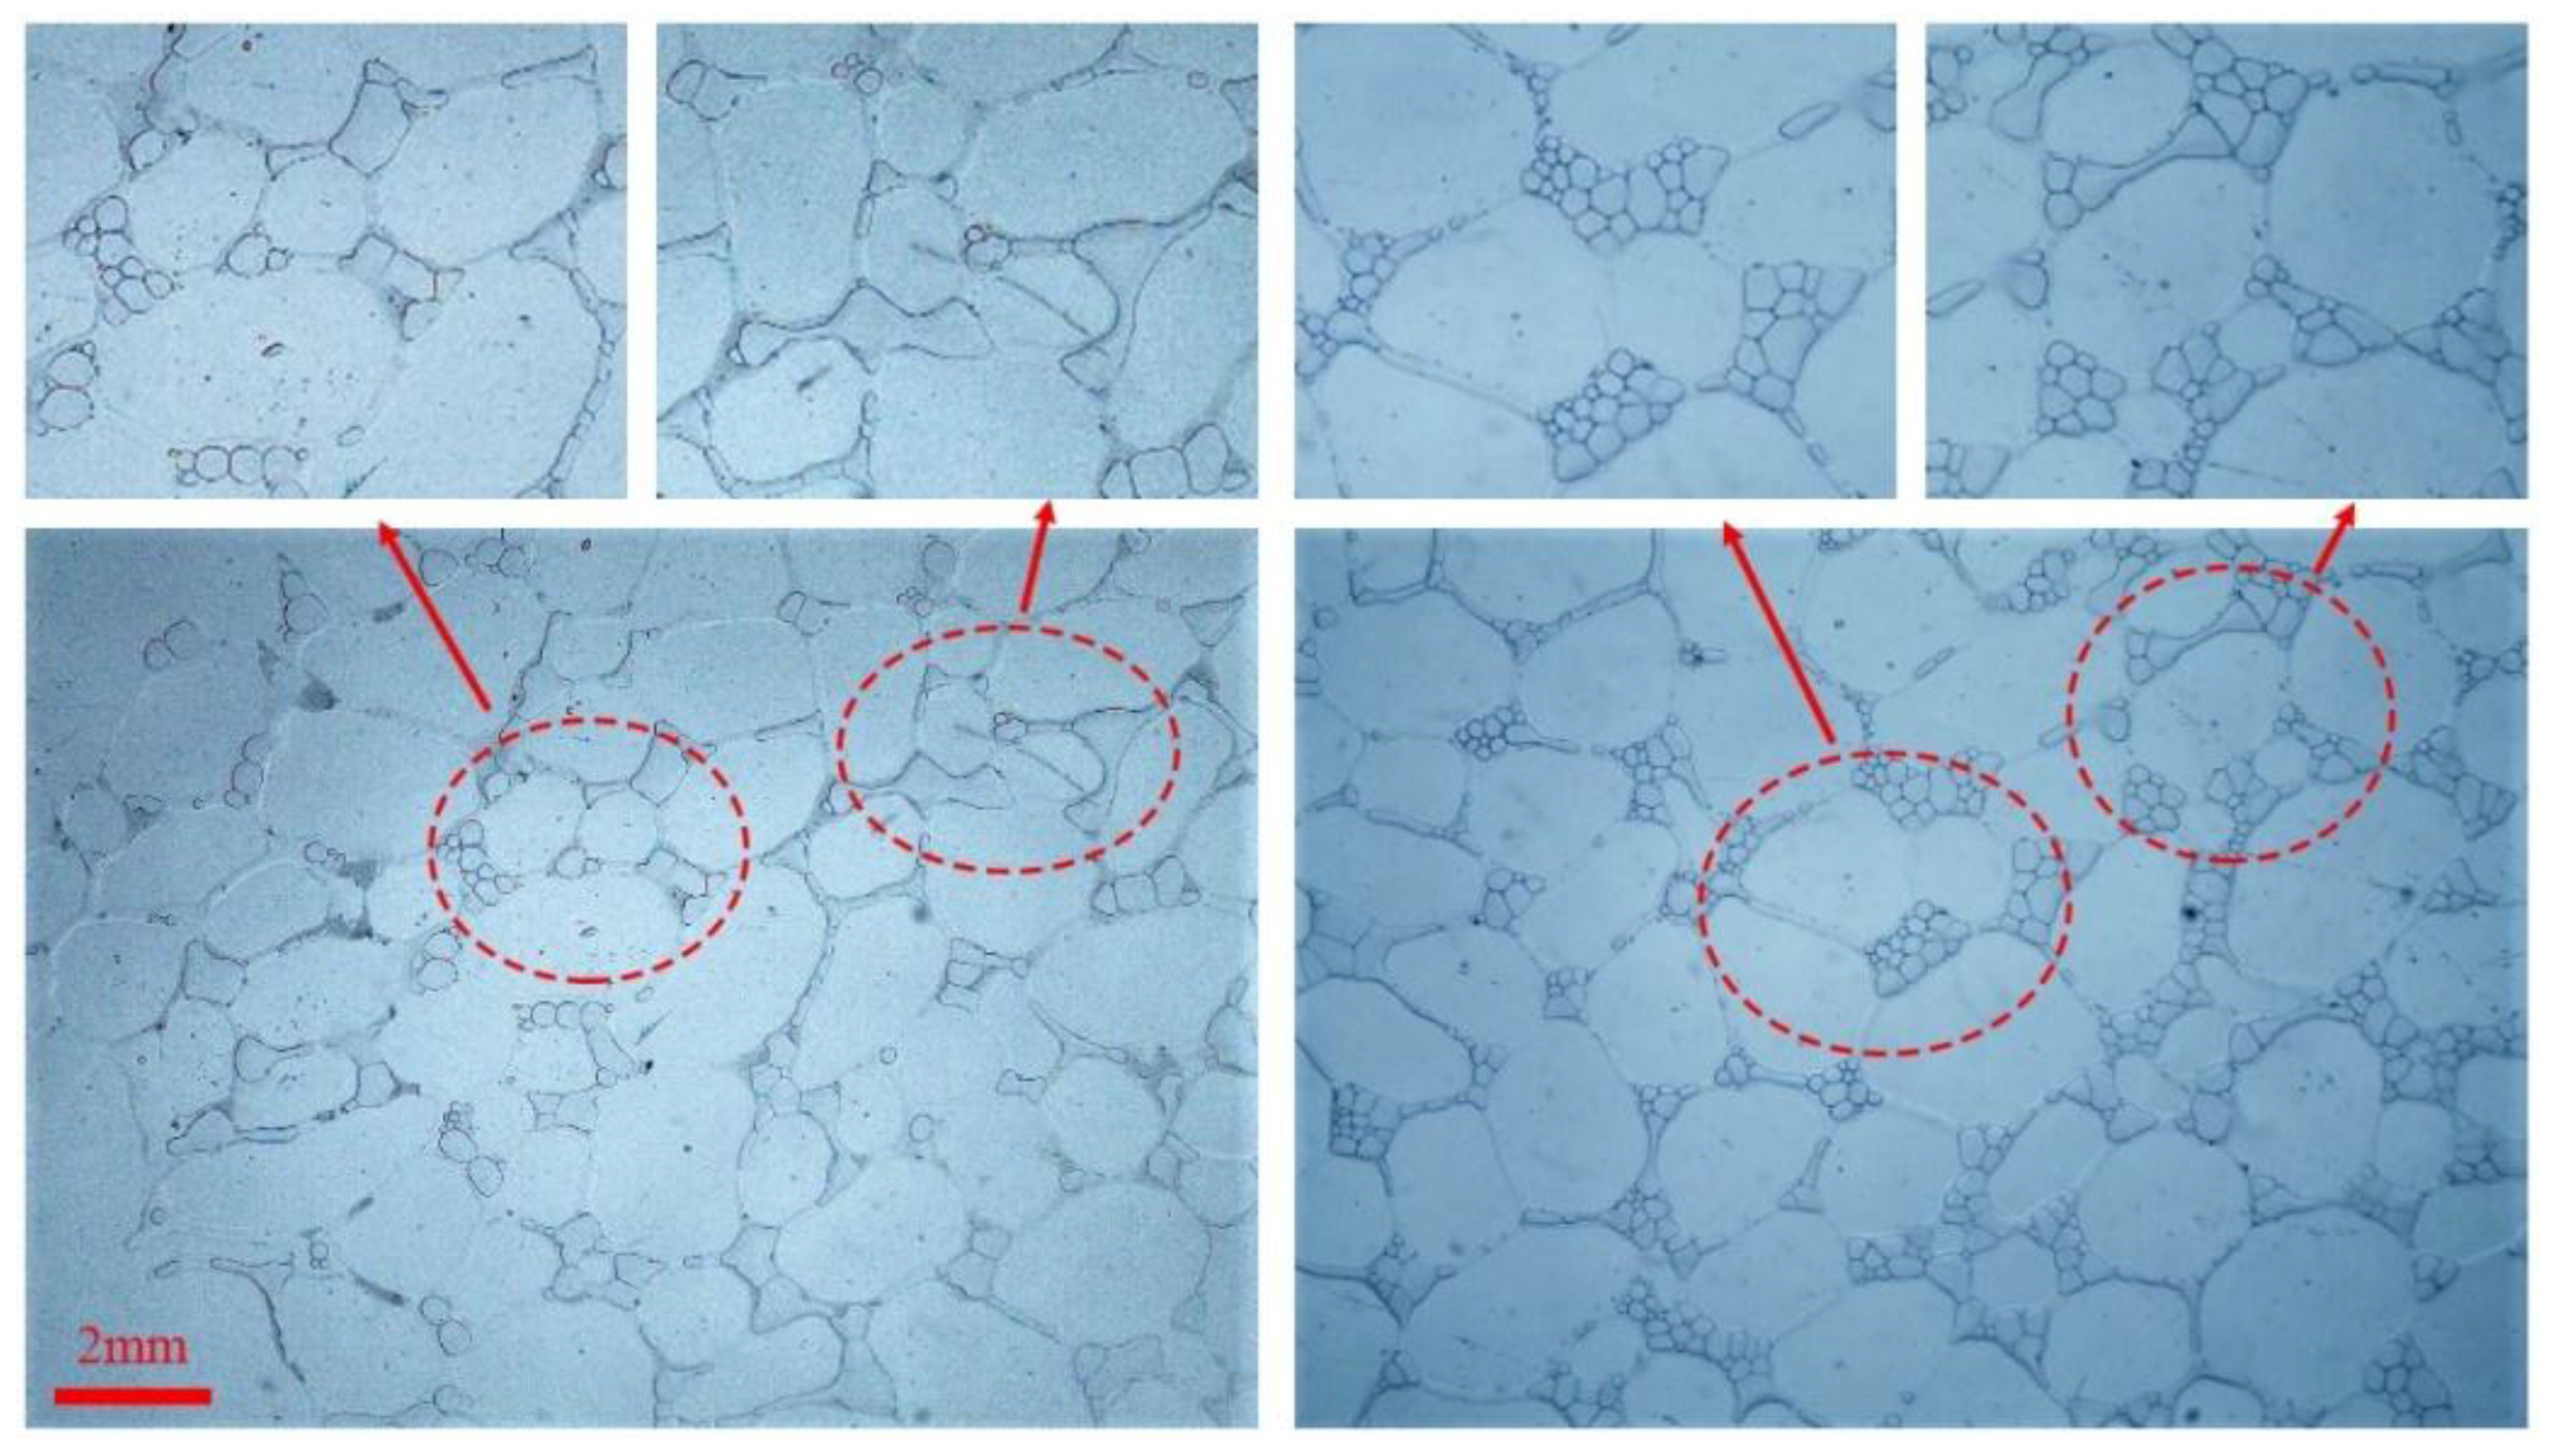
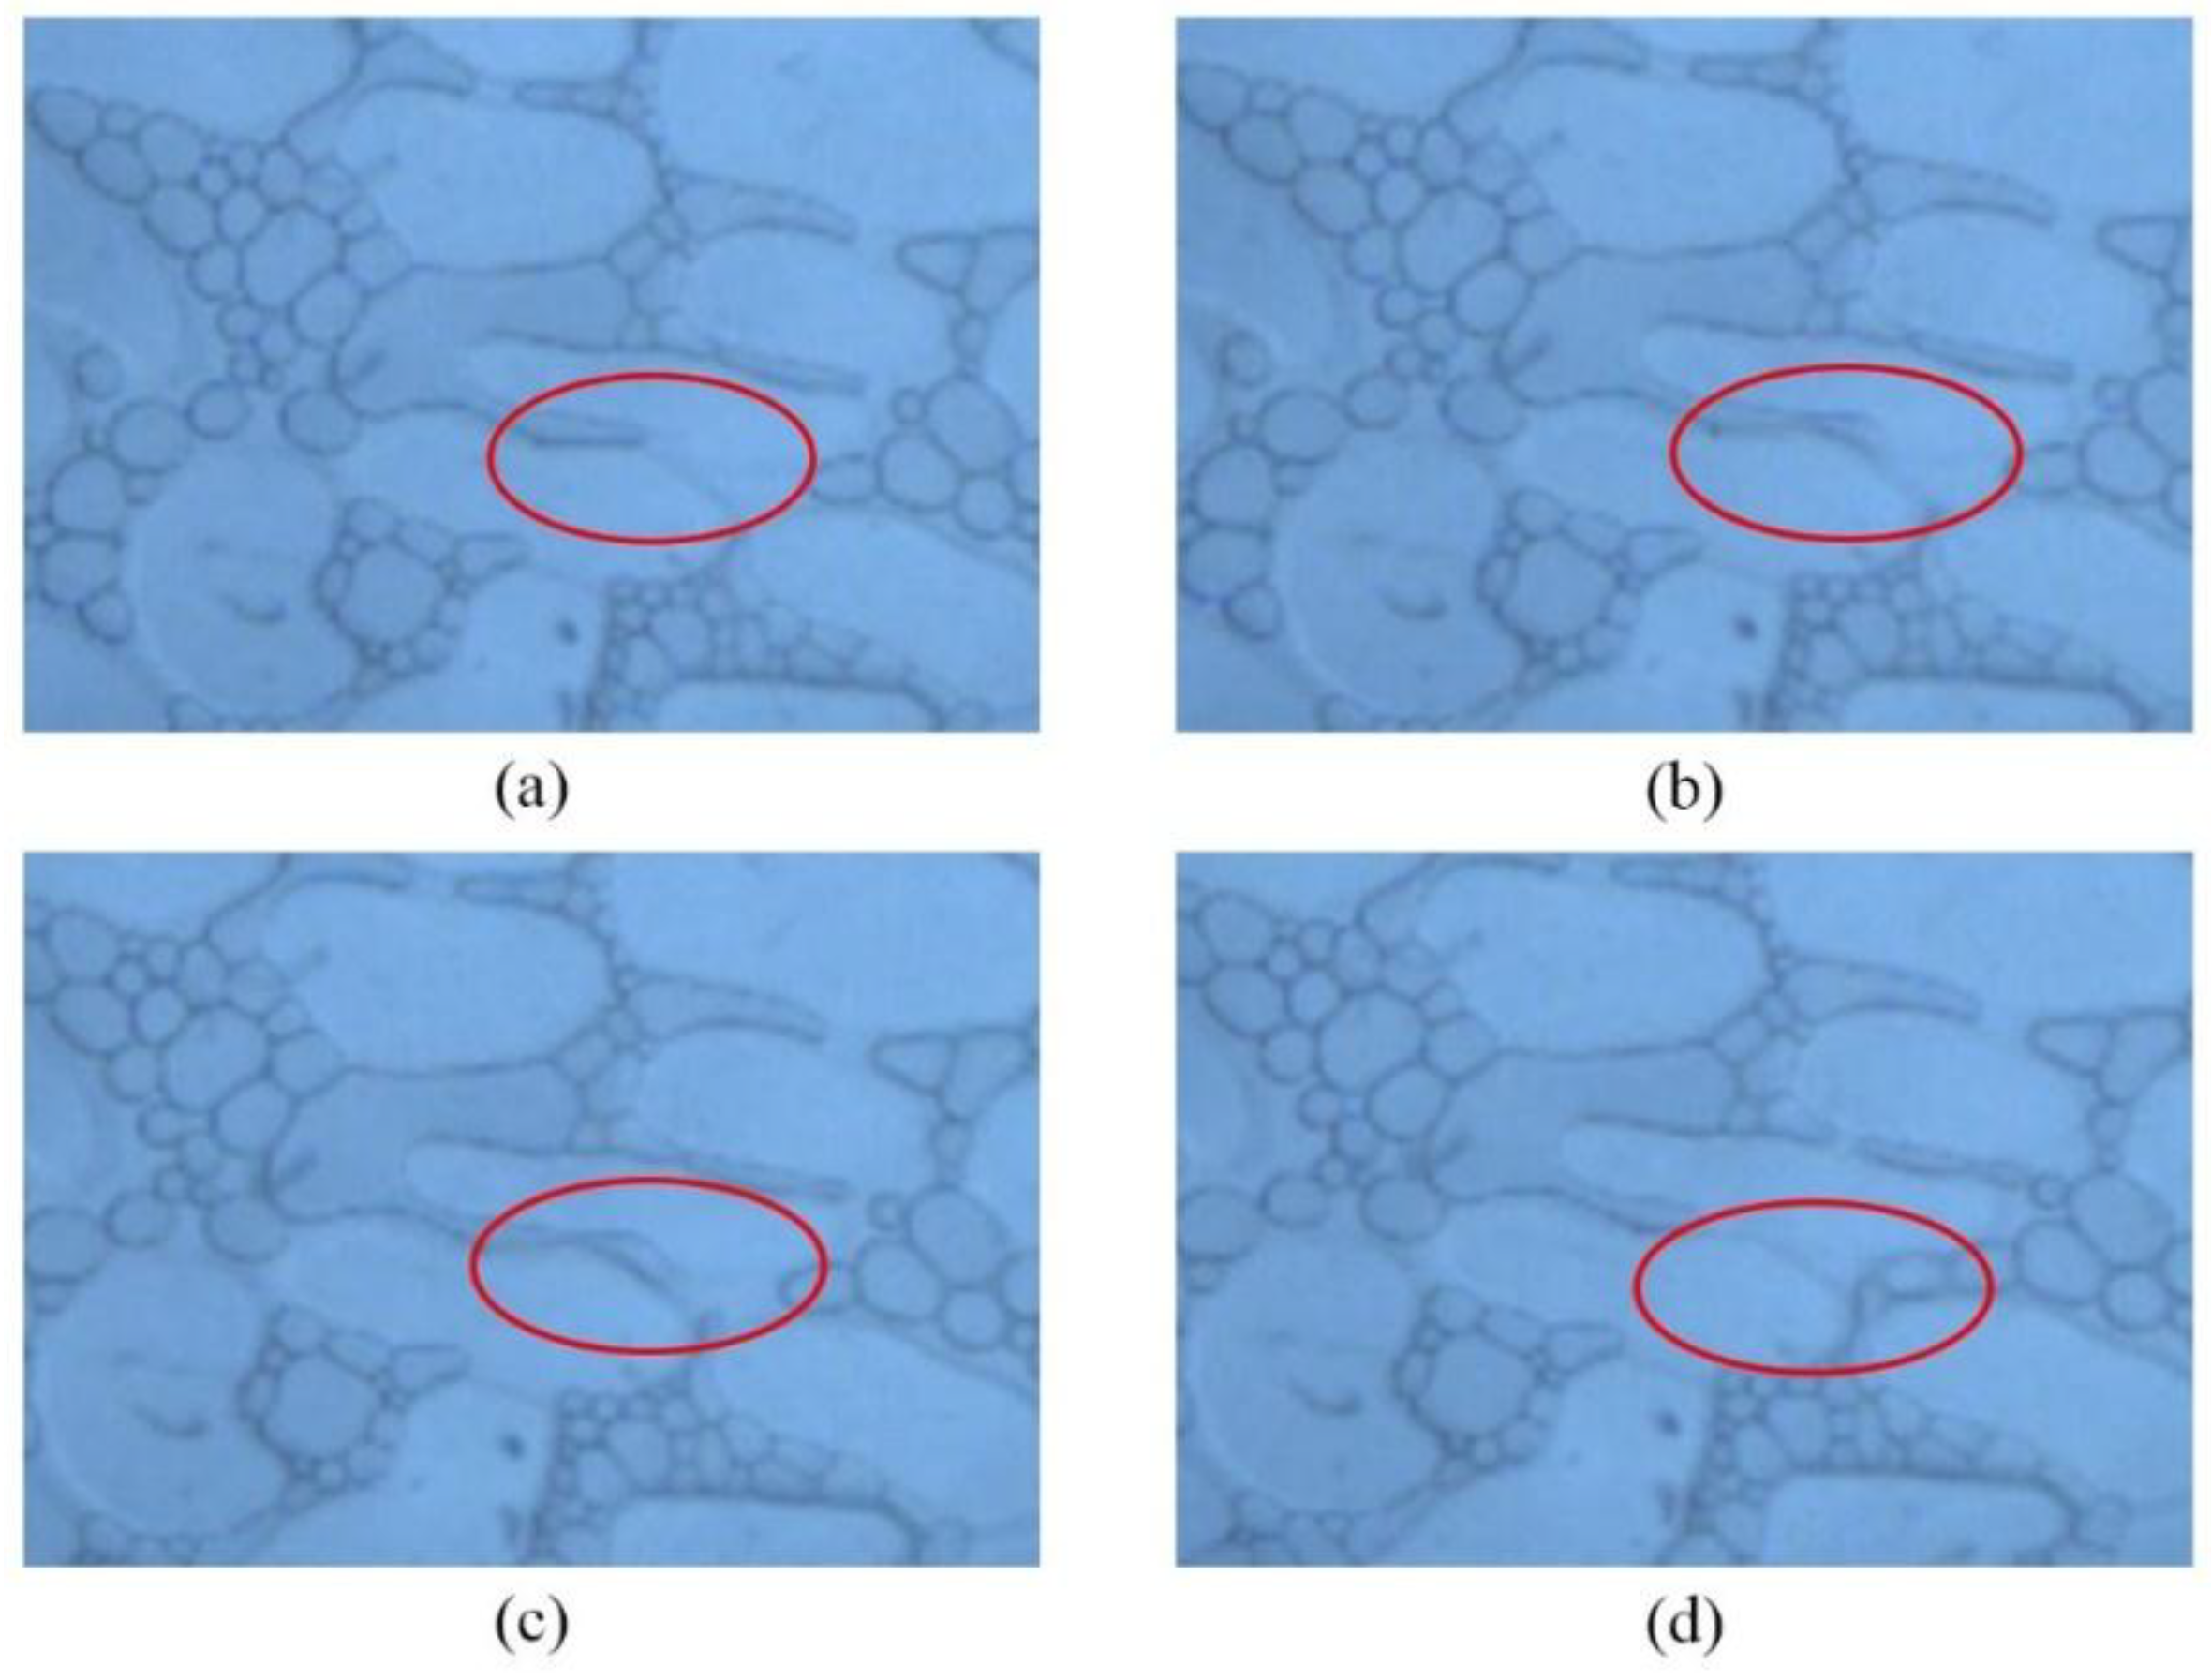
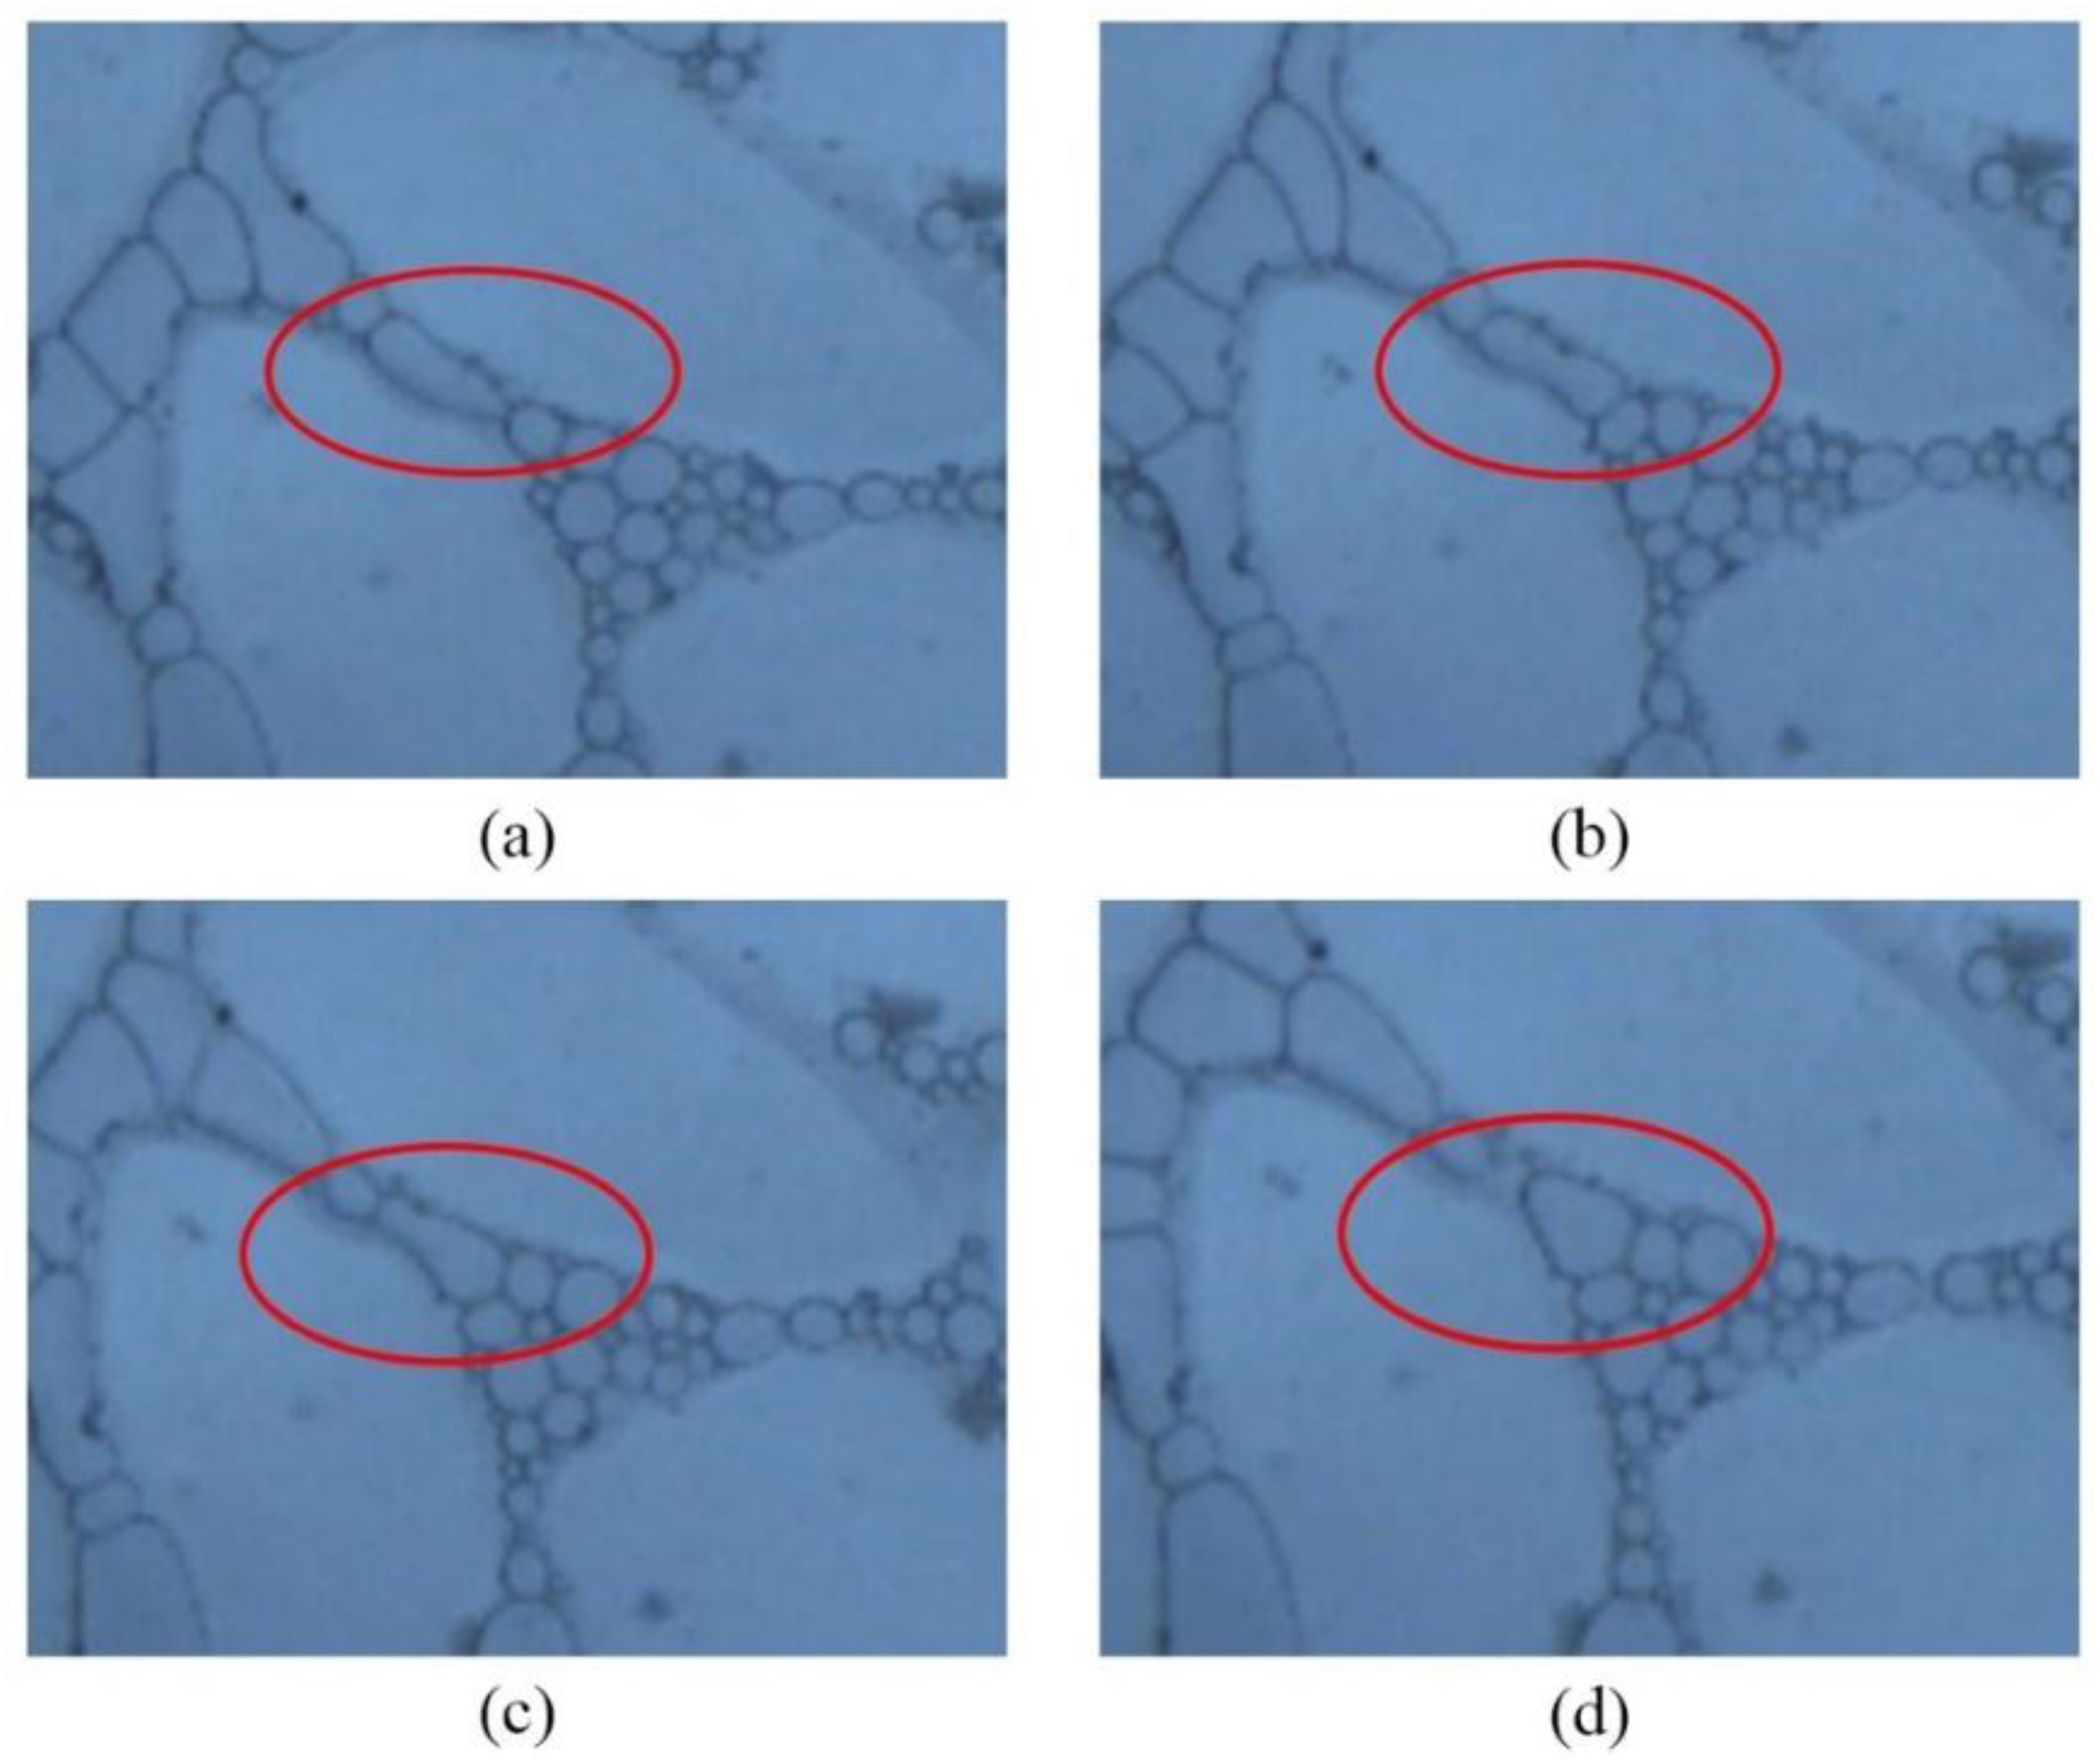
3.3. Microscopic States of the Foam Fluid

The effect of enhancing oil recovery of foam fluid is mainly determined by its states under the reservoir condition, thus, the visible porous models with different permeabilities were employed to study and compare the static and flow states of foams with and without clay particle. The static states of clay-HY-2 foam and HY-2 foam in visible models with high, middle and low permeabilities are illustrated in Figure 8, Figure 9 and Figure 10, respectively. According to Figure 8 and Figure 9, the bubble sizes of clay-HY-2 foam were obviously small, hence there were more bubbles accumulating in pores. Besides, most bubbles are regular round, which is a state with high stability for the foam fluid [26,27]. These characters also show that the clay enhanced foam has a better plugging effect on high- and middle-permeable layers. On the other hand, the sizes of bubbles of HY-2 foam were much larger, and the number of bubbles was less. Besides, the shapes of bubbles were not so regular, which were polygons or ellipses. So, the plugging effect of HY-2 foam is relatively low in high- and middle-permeable pores.
However, above rule is not valid in porous media with low permeability. As is shown in Figure 10, the pores and throats were too narrow, which made it hard for high strength bubbles of clay enhanced foam to distort and flow [21,27]. Therefore, there are less bubbles of clay-HY-2 foam in pores. While the flexible HY-2 foam can pass through the narrow throats easily, and more bubbles congregate in pore structures. For the above reasons, the clay-HY-2 foam had weaker plugging effect on low-permeable layers in reservoirs than HY-2 foams, i.e., the clay enhanced foam had less negative influence on the production of low-permeable layers and made the flooding profile more uniform [28].
The flow states of big and small bubbles of the clay-HY-2 foam are illustrated in Figure 11 and Figure 12, respectively. Figure 11 shows the deformation and stretch process of big bubbles. When the size difference between the bubble and the throat is too large, it is hard for the big bubble to flow through the throat structure directly. The narrow passage forces the bubble to deform, and the liquid film of the bubble keeps getting thinner (see Figure 11a,b). When the strength of the liquid film cannot resist the pressure, the big bubble will break into two small bubbles (see Figure 11a,b). Through this way, big bubbles get through narrow throat, and more small and stable bubbles are generated.
However, when the size difference between bubbles and the throat is not obvious, bubbles can pass through the throat with slight deformation. As is shown in Figure 12, the round bubble becomes an oval one to decrease the resistance from the throat, and the shape of the bubble recovers after the bubble passed the throat.

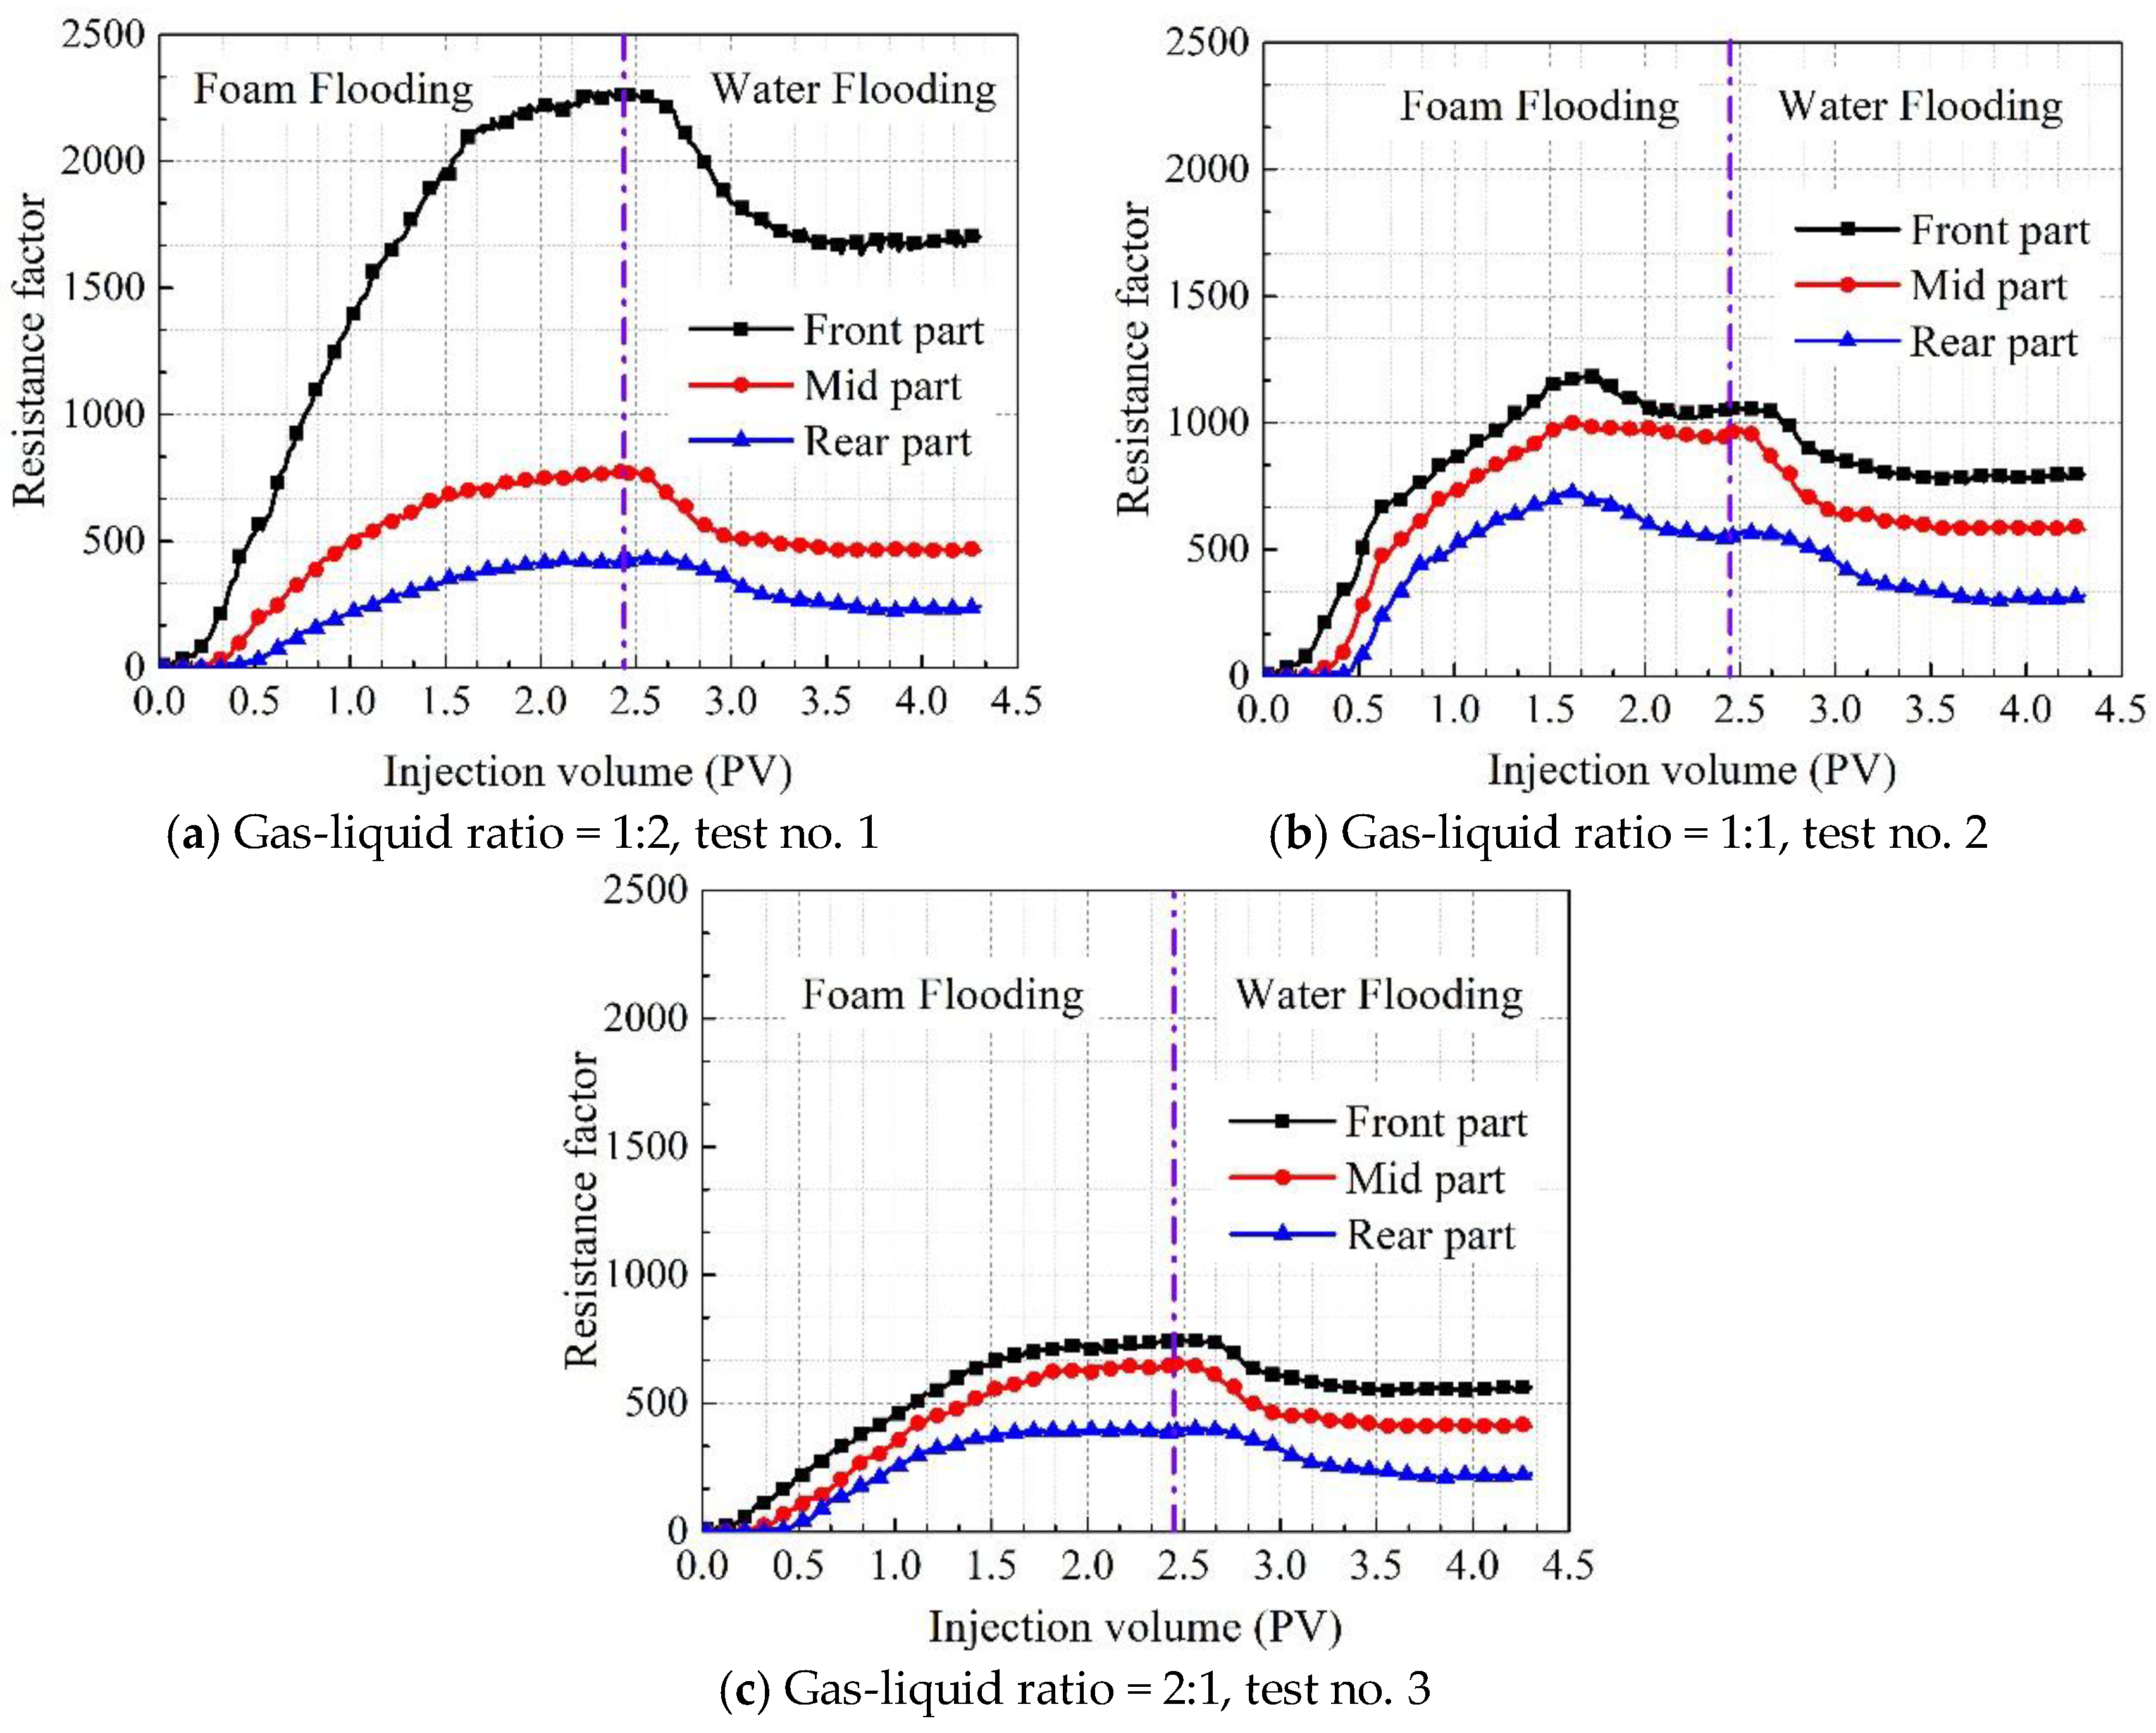
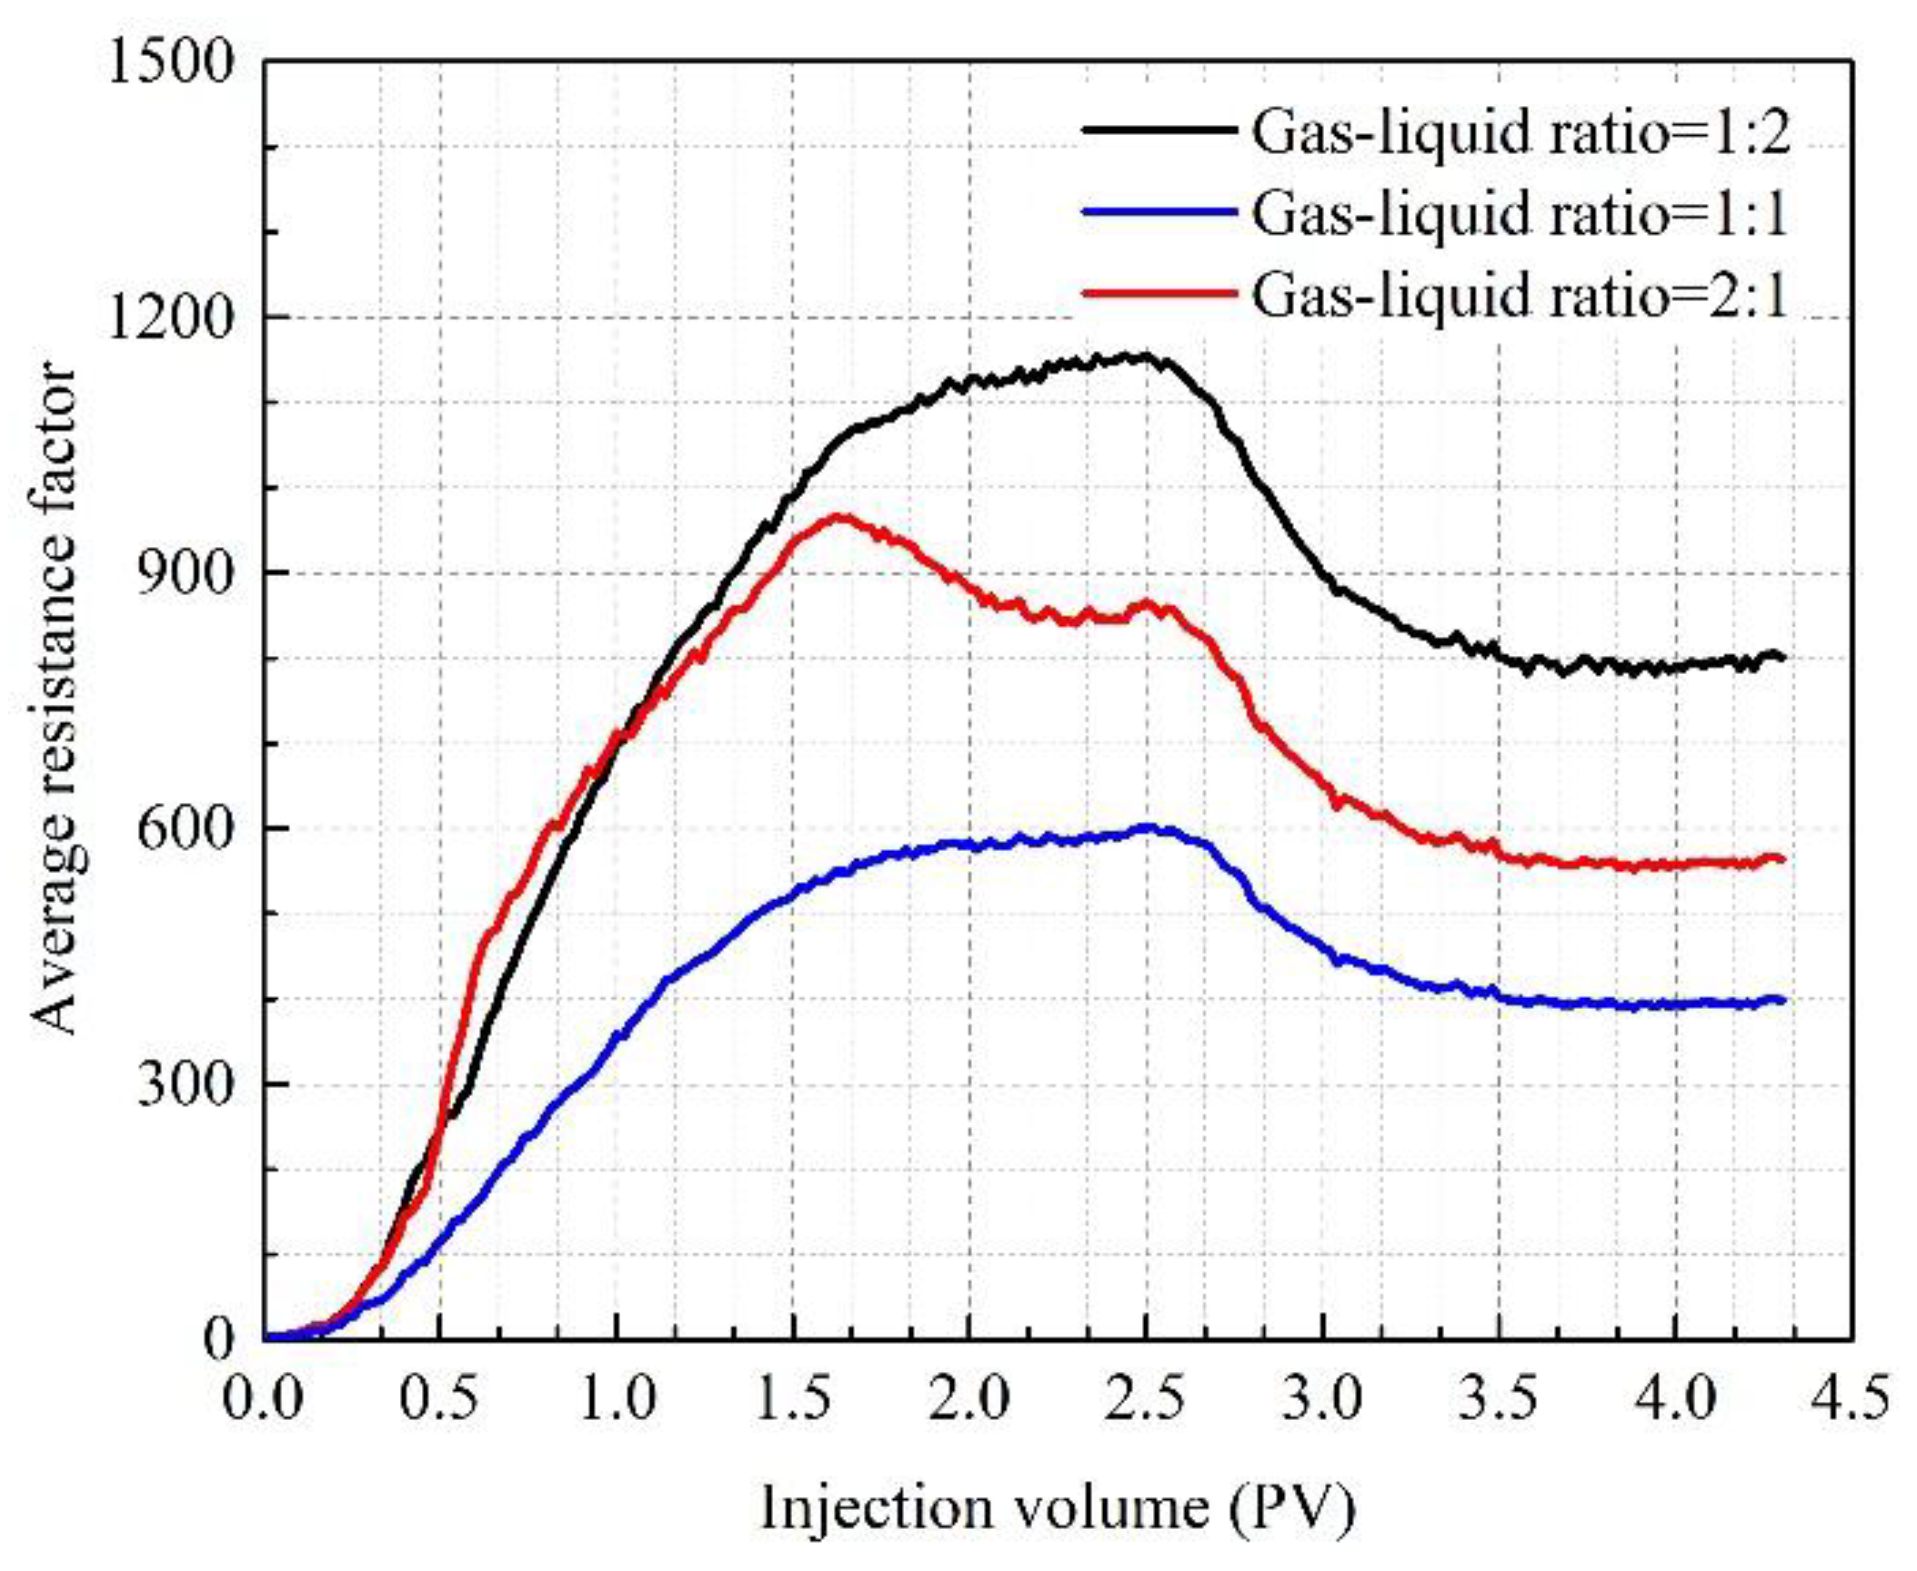
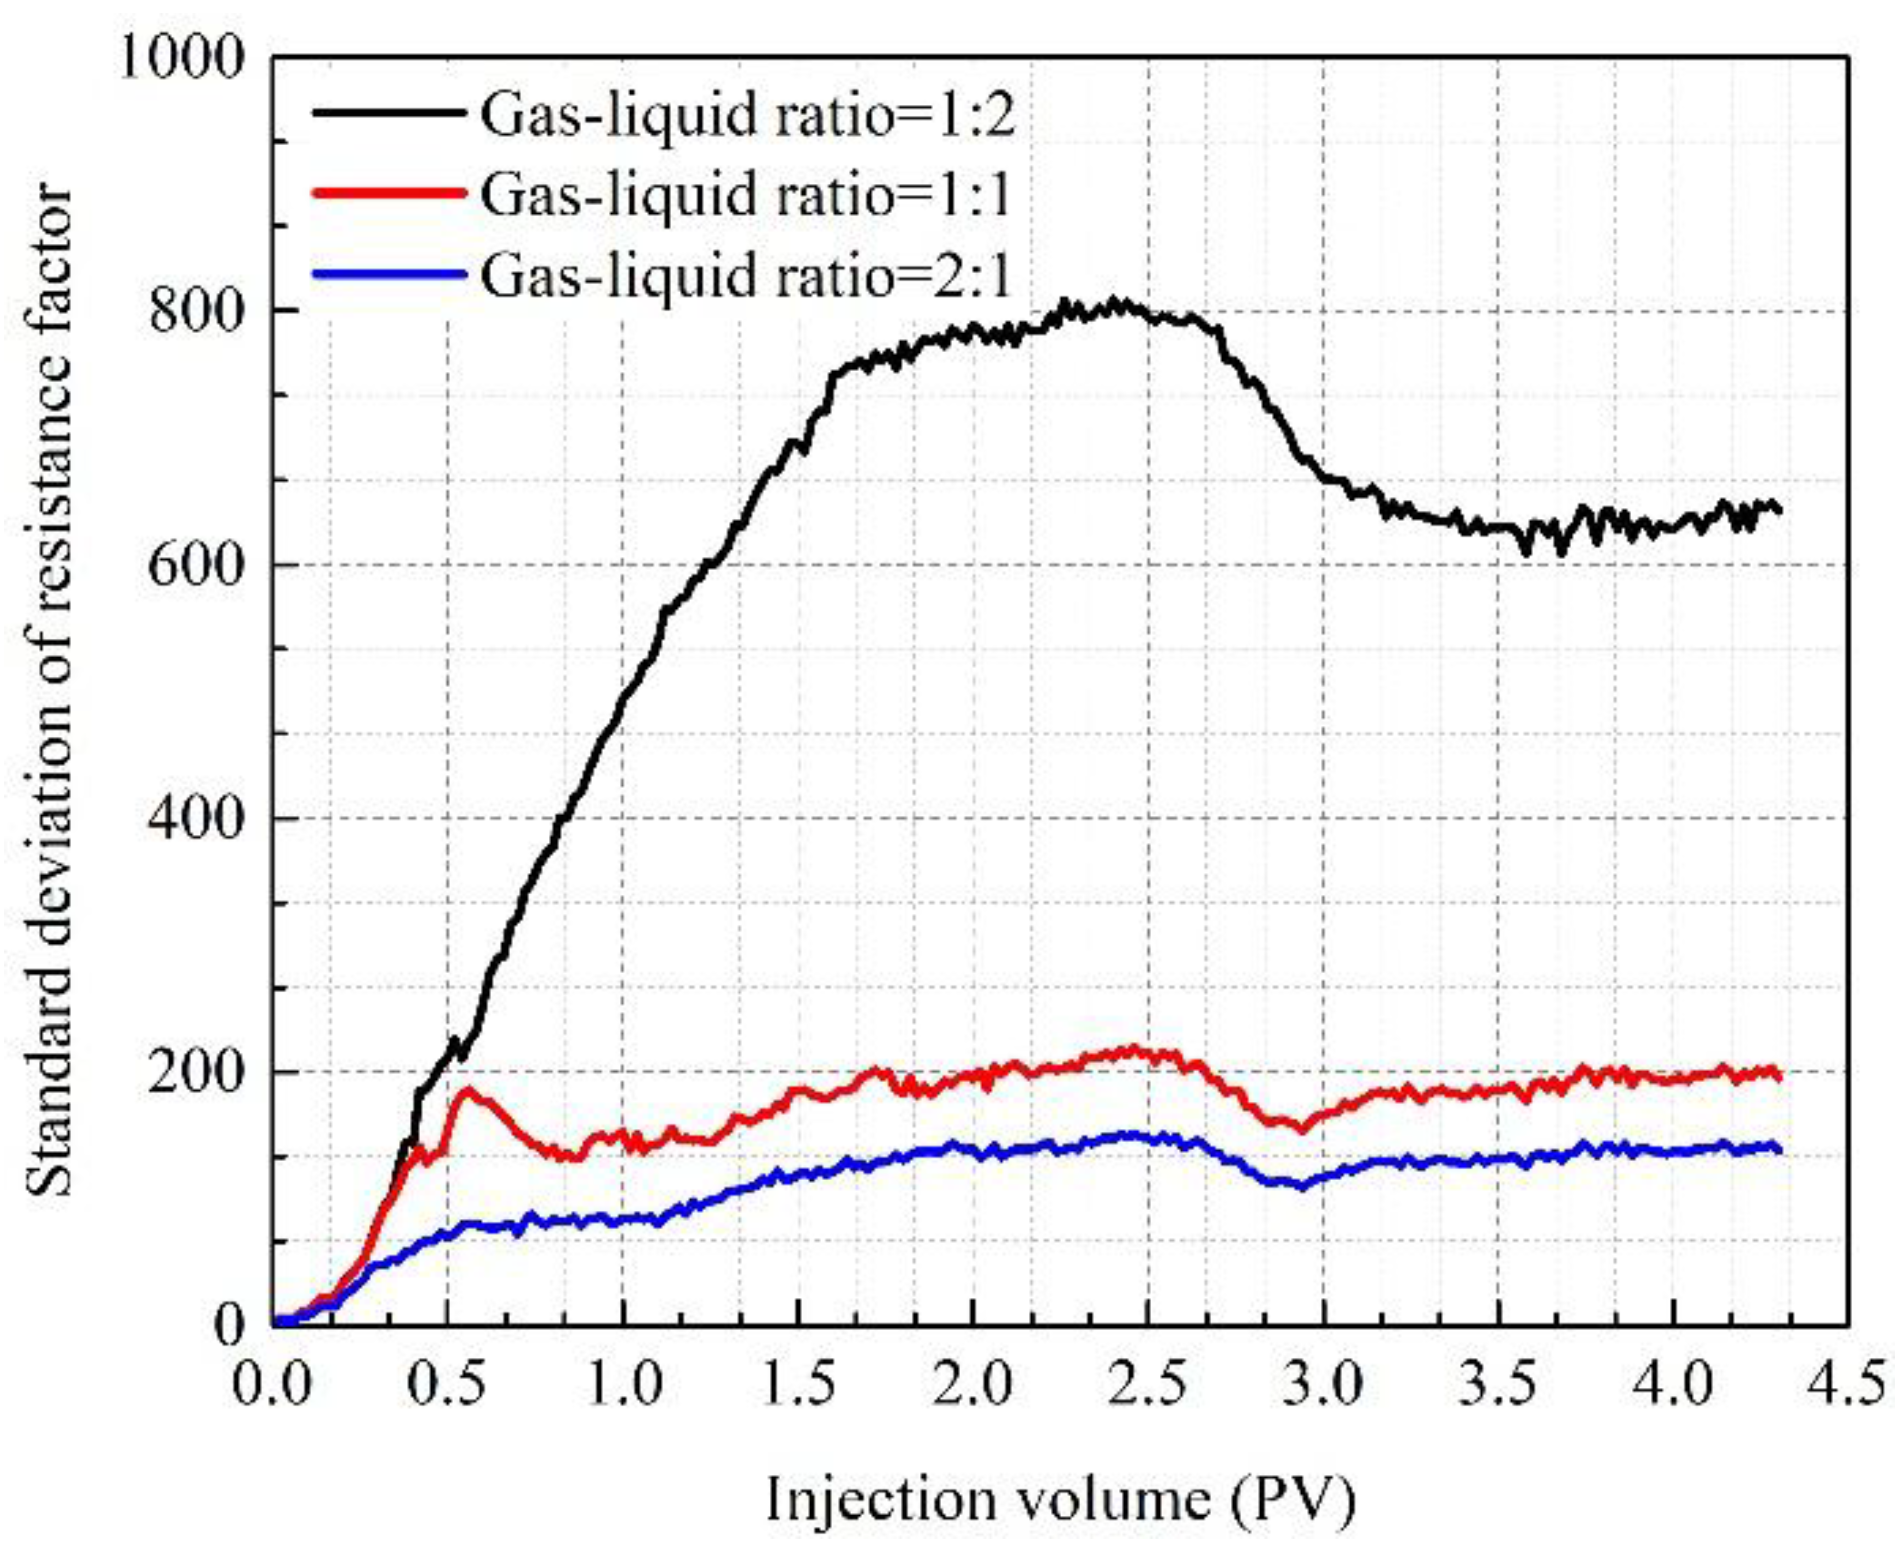
3.4. The Effect of the Gas–Liquid Ratio on Profile Control

The effect of the gas–liquid ratio on the resistance factor during foam flooding and follow-up water flooding is depicted in Figure 13. In the foam flooding period, the resistance factors increase gradually with the injection of the clay-HY-2 foam and then reach a plateau. In the follow-up water flooding period, the resistance factors decrease slightly and then remain at a certain level. From Figure 13a–c, the overall resistance factors in sandpacks decline as the gas–liquid ratio increases, i.e., the relatively low foam quality facilitates the plugging effect in porous media. This trend coincides with conclusions in the literature [29]. Compared with previous works under the same gas–liquid ratio, the resistance factor of clay-HY-2 foam in this study is five to ten times higher than those of traditional foams [30,31]. However, the difference among resistance factors of various parts is large in Figure 13a, and the extra high resistance factor at the front part of the sandpack means that most bubbles and clay particles assemble at the entrance of the sandpack. In such a situation, the deep profile control of the foam is limited. While in Figure 13b, c, the curve of the front part of the sandpack is approximate to curves of other parts, which means that the clay enhanced foam moves into the deep part of the sandpack and has a relatively uniform plugging effect on the whole sandpack.
Moreover, the average resistance factor and the standard deviation of the resistance factor are defined in this work to evaluate the profile control effect of the clay-HY-2 foam. The former reflects the general plugging strength of the foam fluid in the sandpack, and the latter shows the uniformity of plugging effect. These two parameters are given as Equations (2) and (3).
R a = i = 1 n R i n
S = i = 1 n ( R i R a ) 2 n ,
where R a is the average resistance factor in the sandpack; R i is the resistance factor of each part; n is the number of sections of the sandpack; S is the standard deviation of resistance factors. As is shown in Figure 14, the average resistance factor decreases gradually with the increasing foam quality, which coincides with the trend in Figure 13. According to Figure 15, the standard deviation of resistance factor is extra-large when the gas–liquid ratio is 1:2, while the data under two other conditions are relatively small and close to each other. The figure shows that the plugging effect of foam in sandpack is relatively uniform when the gas–liquid ratio is around 1:1. In conclusion, the optimum gas–liquid ratio is set as 1:1 because of its high strength and uniform plugging effect.

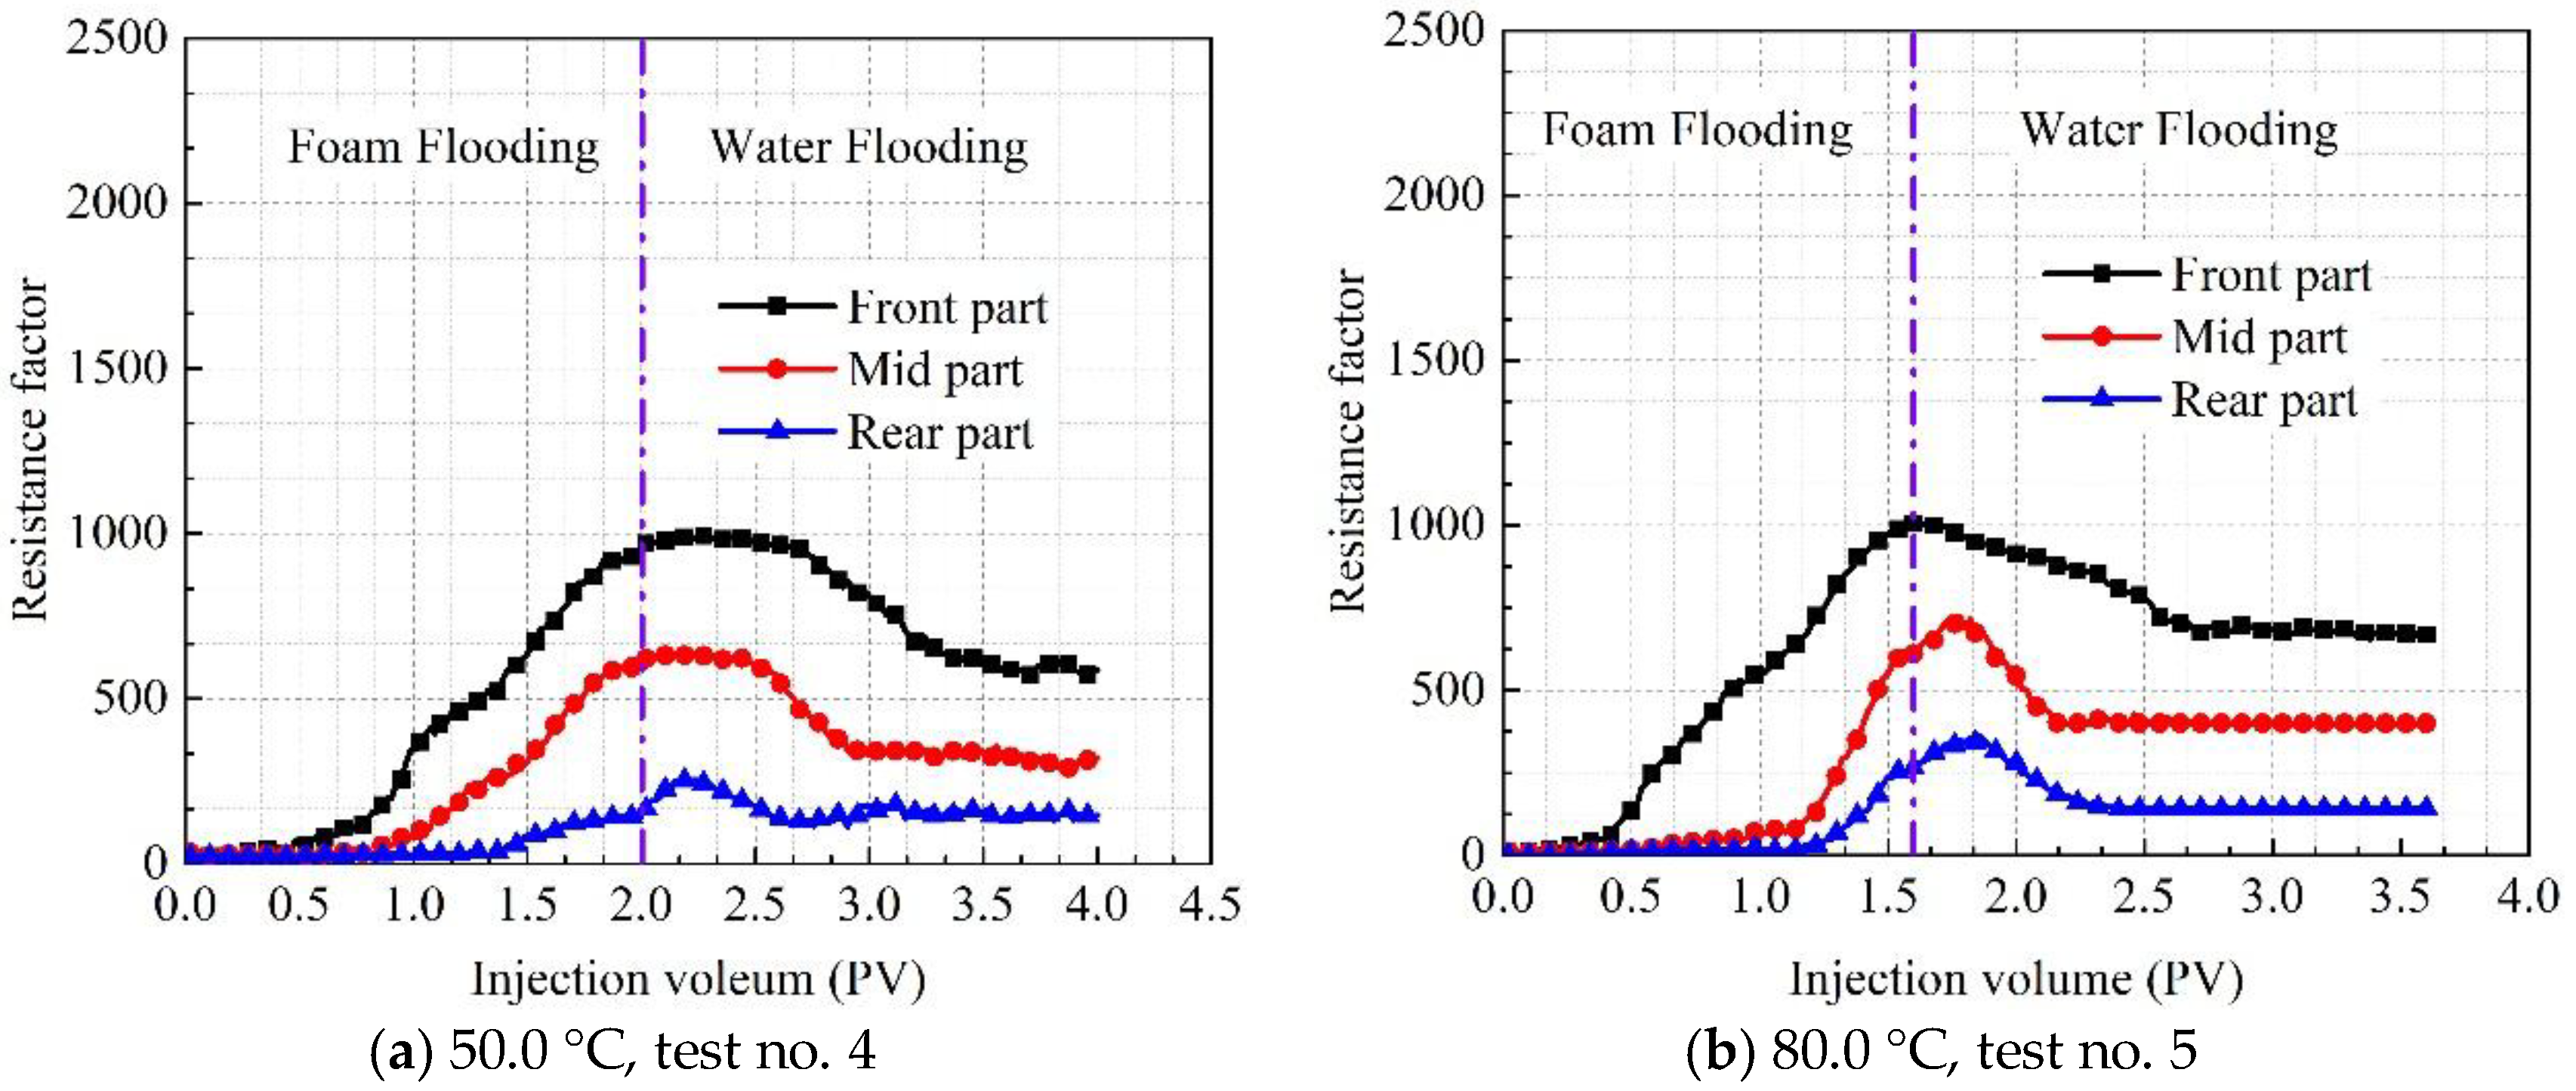
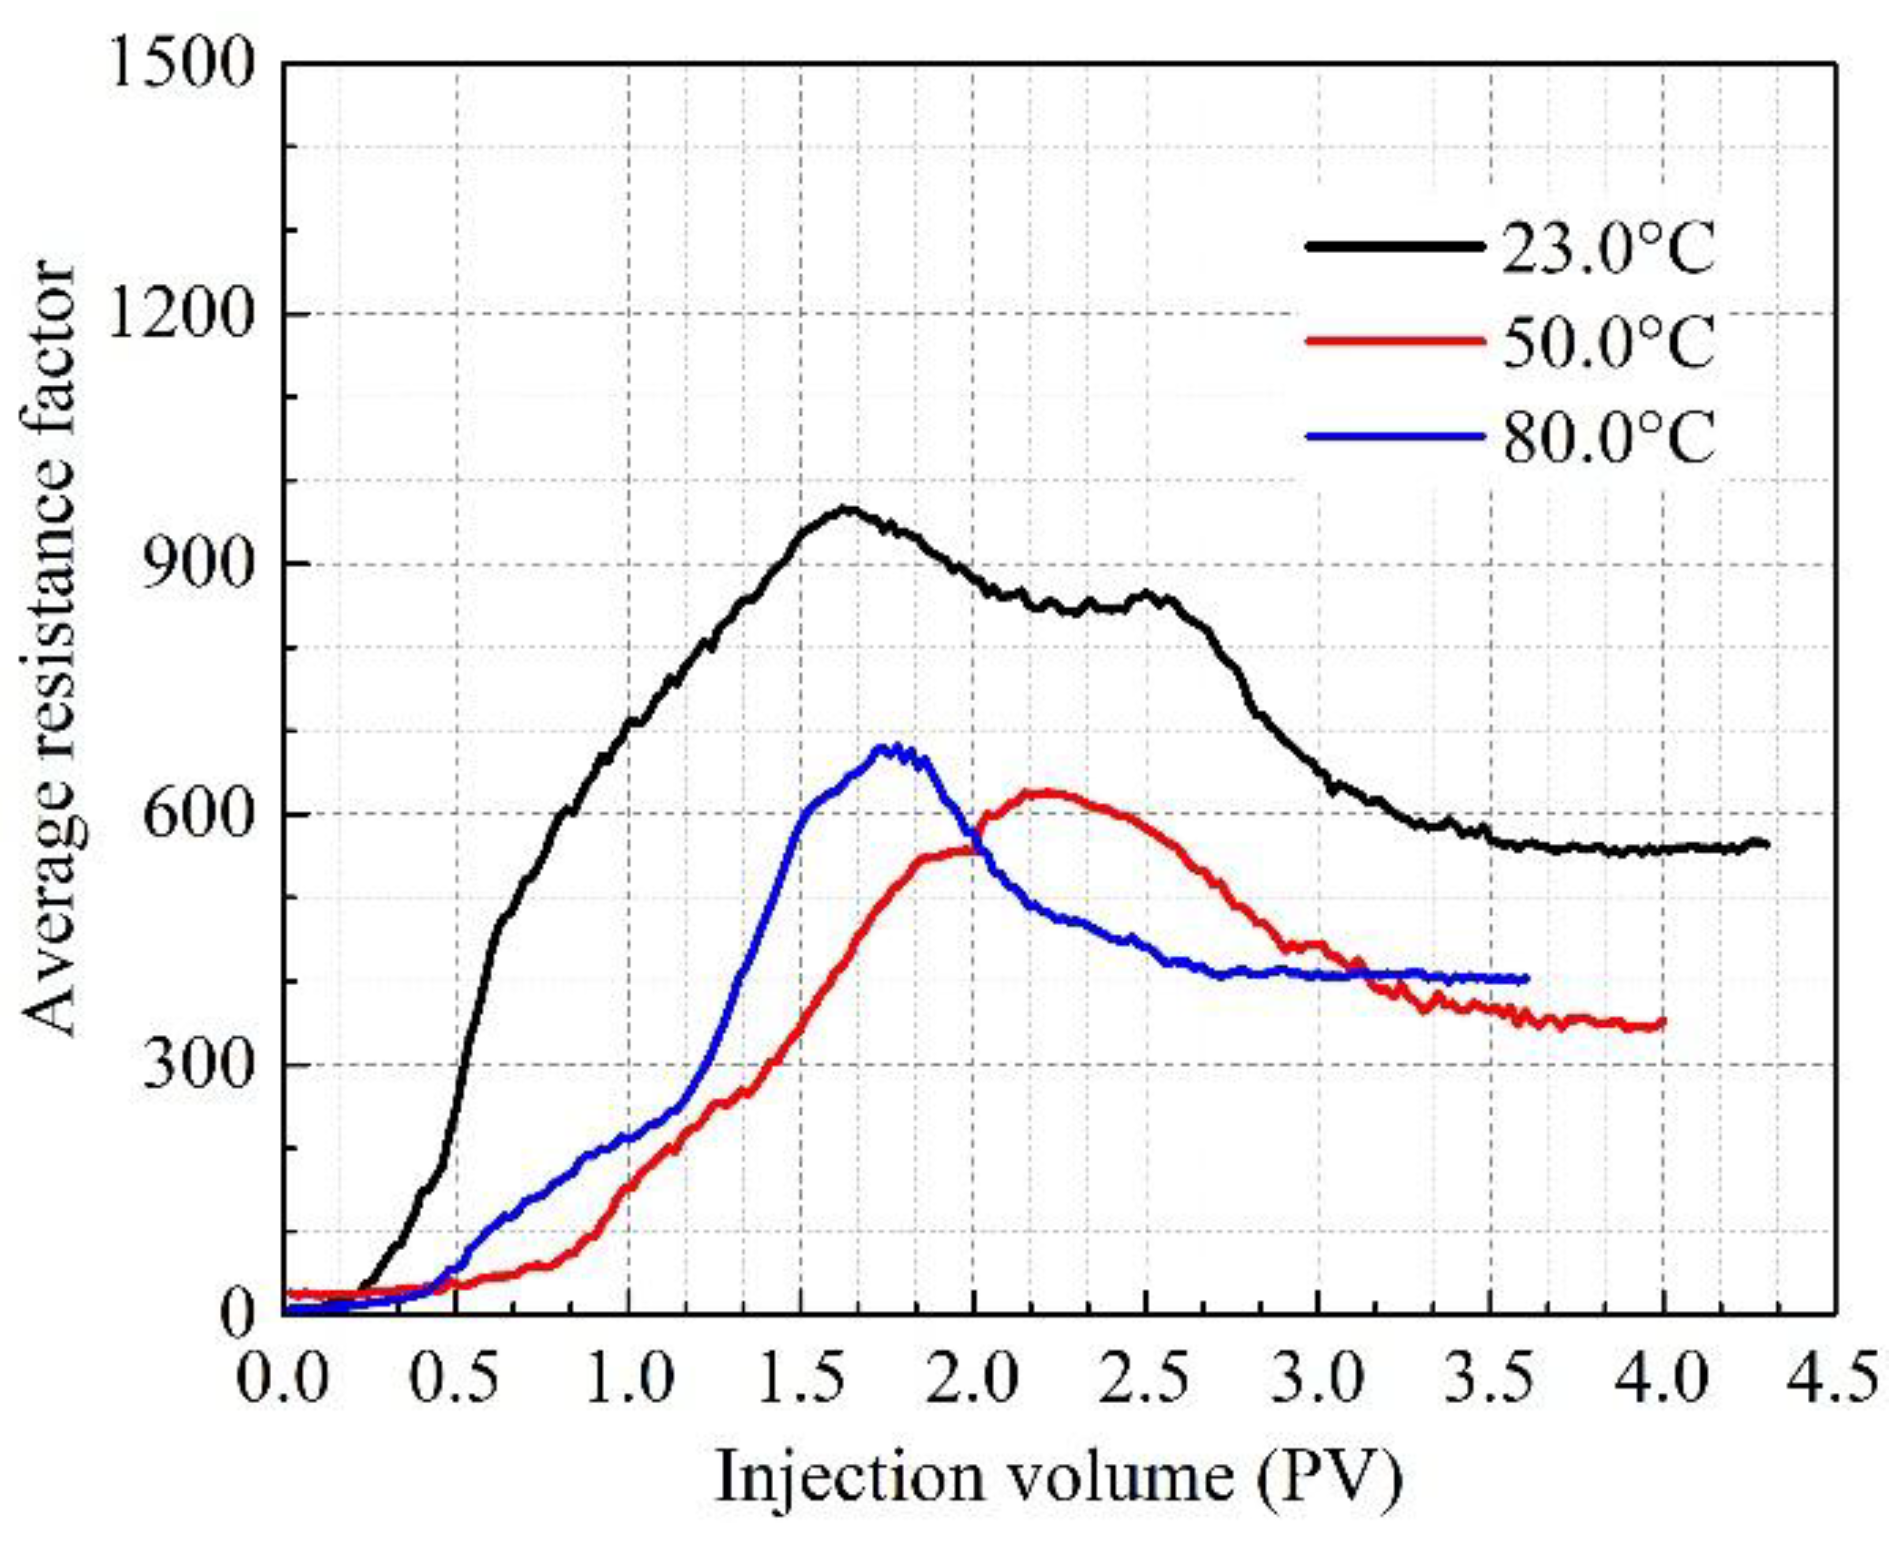
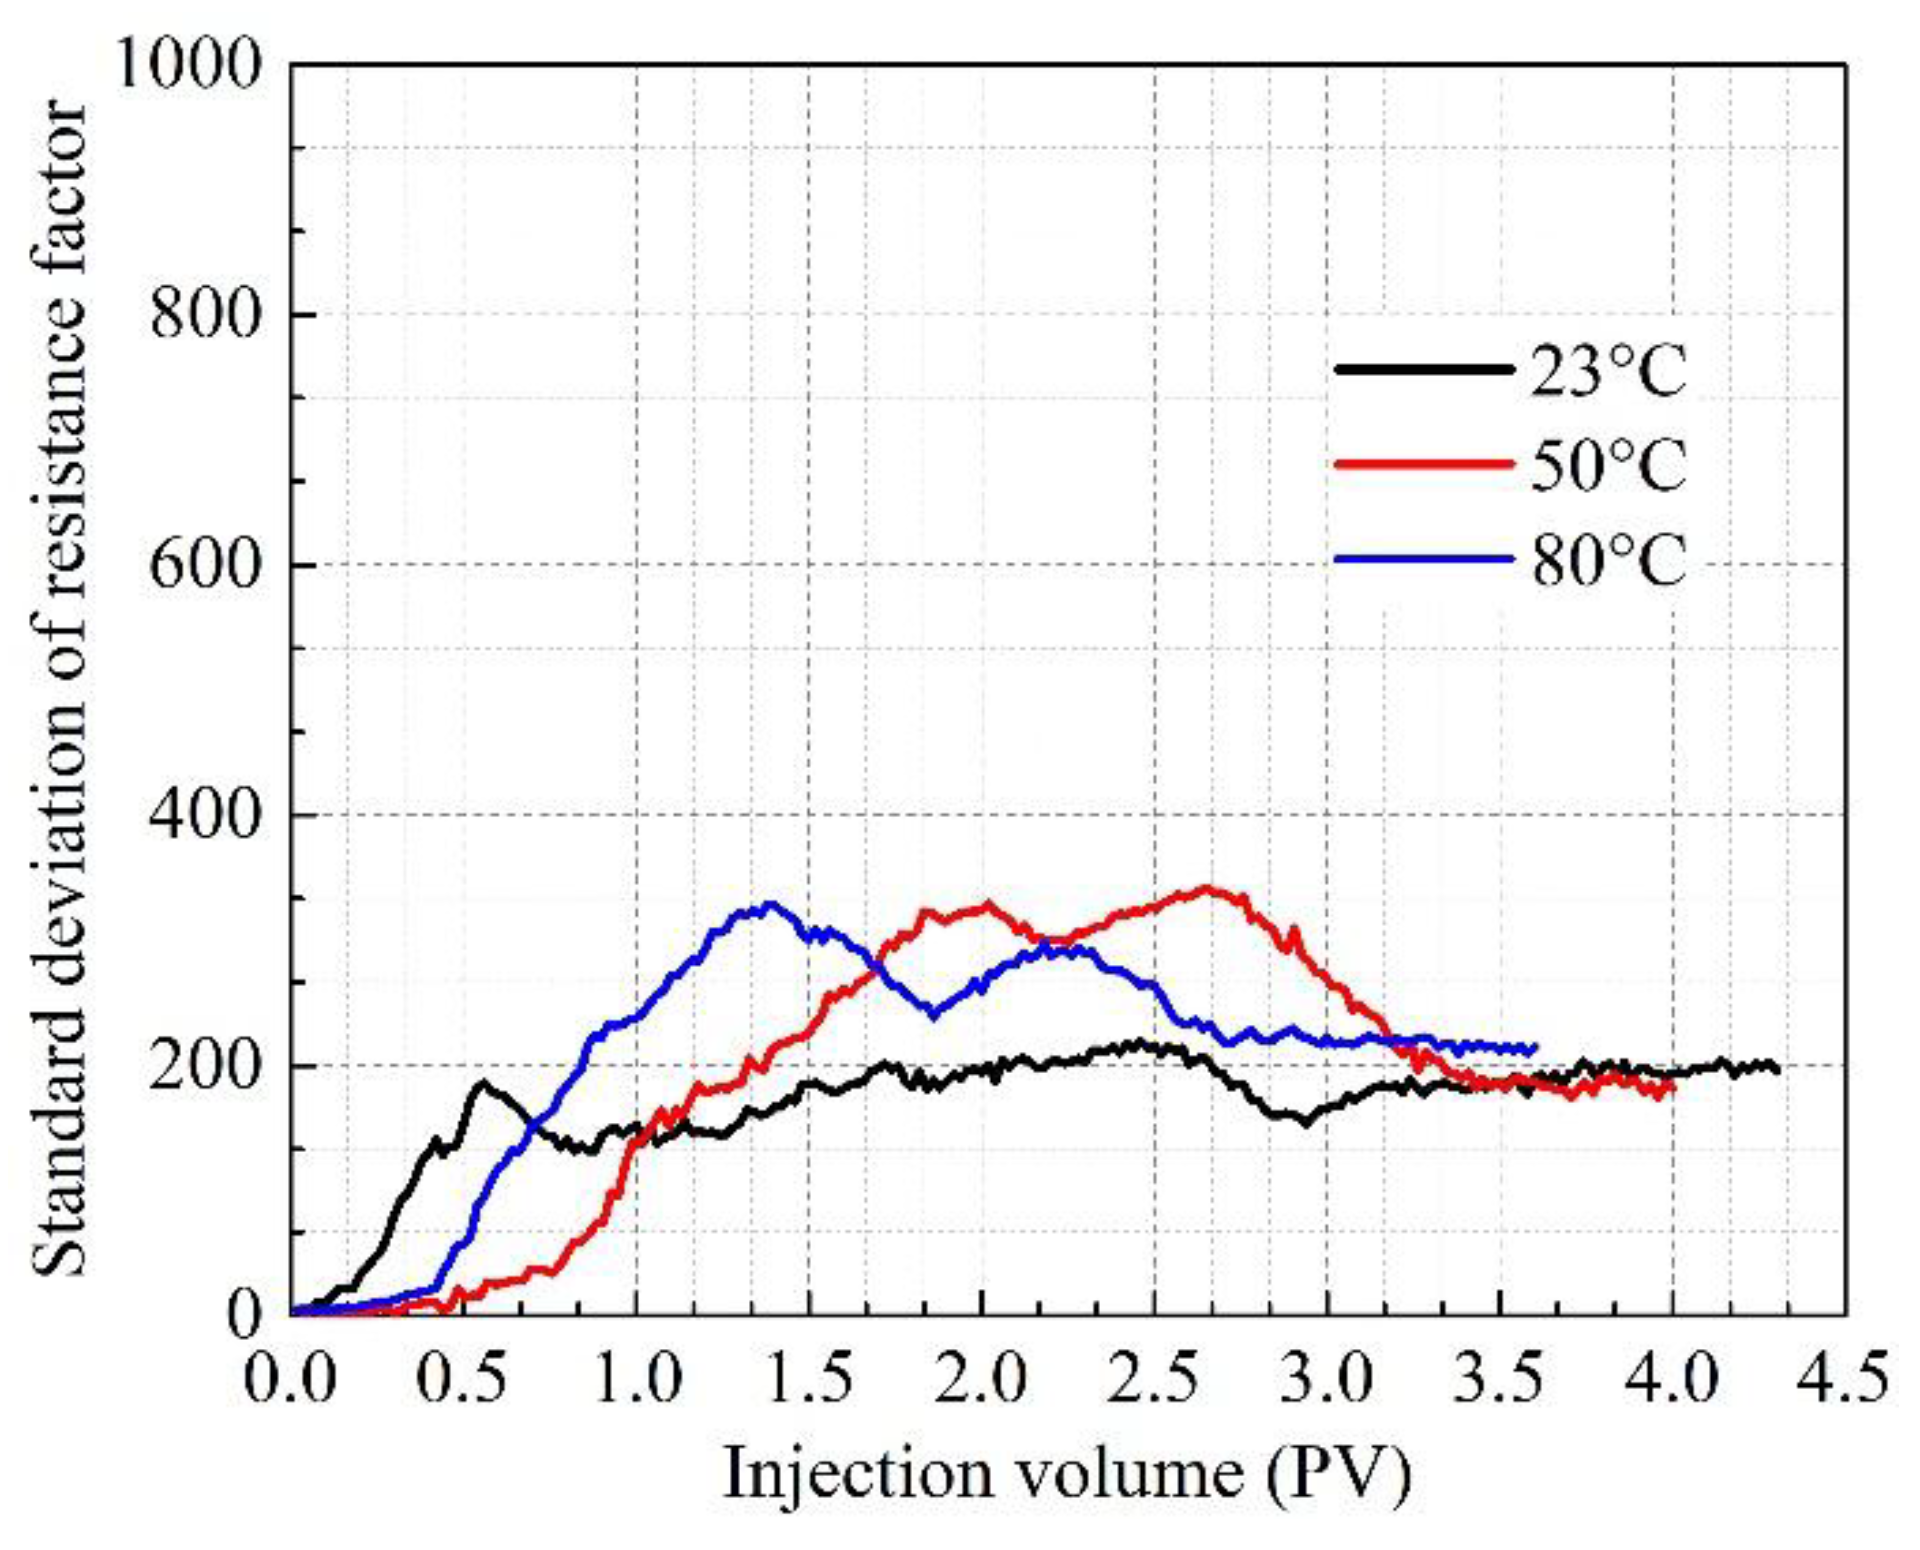
3.5. The Effect of Temperature on Profile Control

The effect of temperature on the resistance factor during the foam flooding and follow-up water flooding is illustrated in Figure 16, and means and standard deviations of above data are given in Figure 17 and Figure 18, respectively. According to Figure 16 and Figure 17, the resistance factor decreases gradually with the increase of temperature in the range of 23.0 to 50.0 °C, and then it is not sensitive to temperature when the temperature is higher than 50.0 °C. The decrease of the resistance factor may be attributed to the decrease of foam stability with the increasing temperature [32,33], and the decline rate of foam stability slows down when the temperature exceeds 50.0 °C. As is shown in Figure 18, the standard deviation increases slightly with the increase of temperature, i.e., the increasing temperature causes the deterioration of uniformity of the plugging effect in sandpacks. In summary, the clay-HY-2 foam has good plugging effect in the temperature range of 23.0–50.0 °C, and its ability decreases as the increasing temperature. However, the average resistance factor is stable at 400 during the follow-up water flooding period under 80.0 °C, which shows that the foam system still has certain plugging capacity under such condition. Moreover, compared with the plugging effect of traditional foams under similar temperature [34,35], the resistance factor of clay-HY-2 foam in this study is much higher than those in literatures, which shows the good properties of the clay enhanced foam under the relatively high temperature.

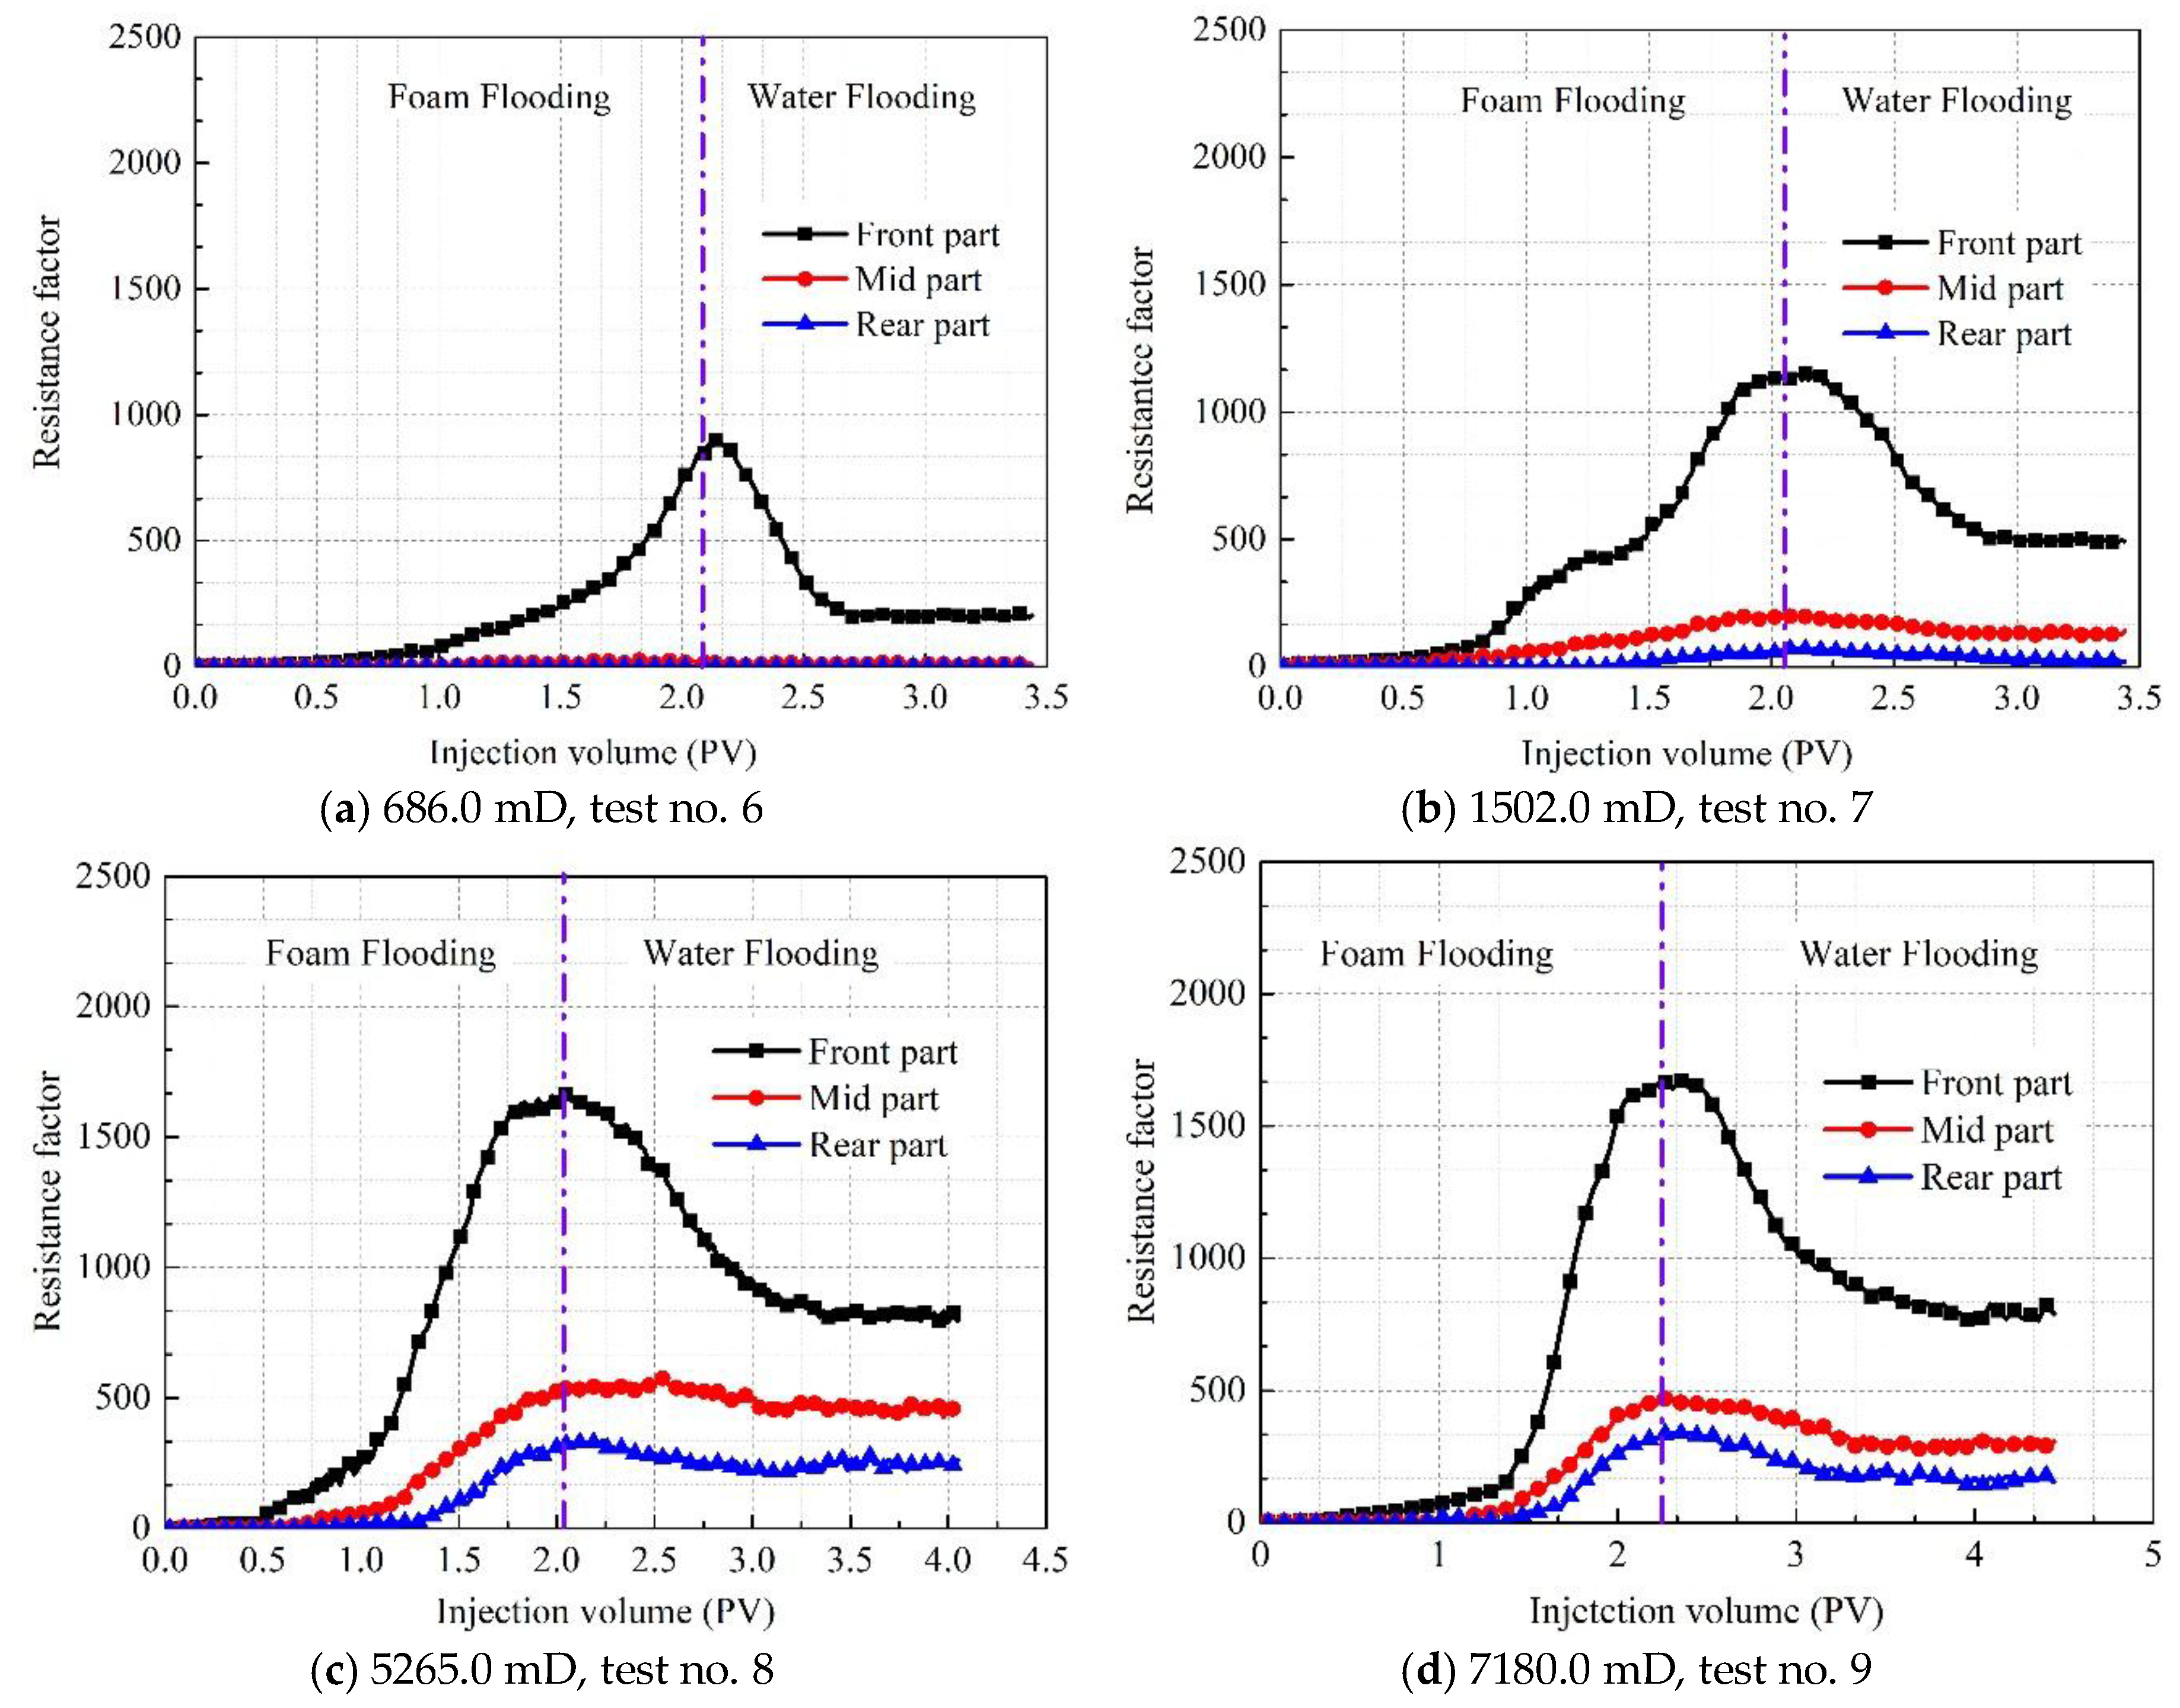
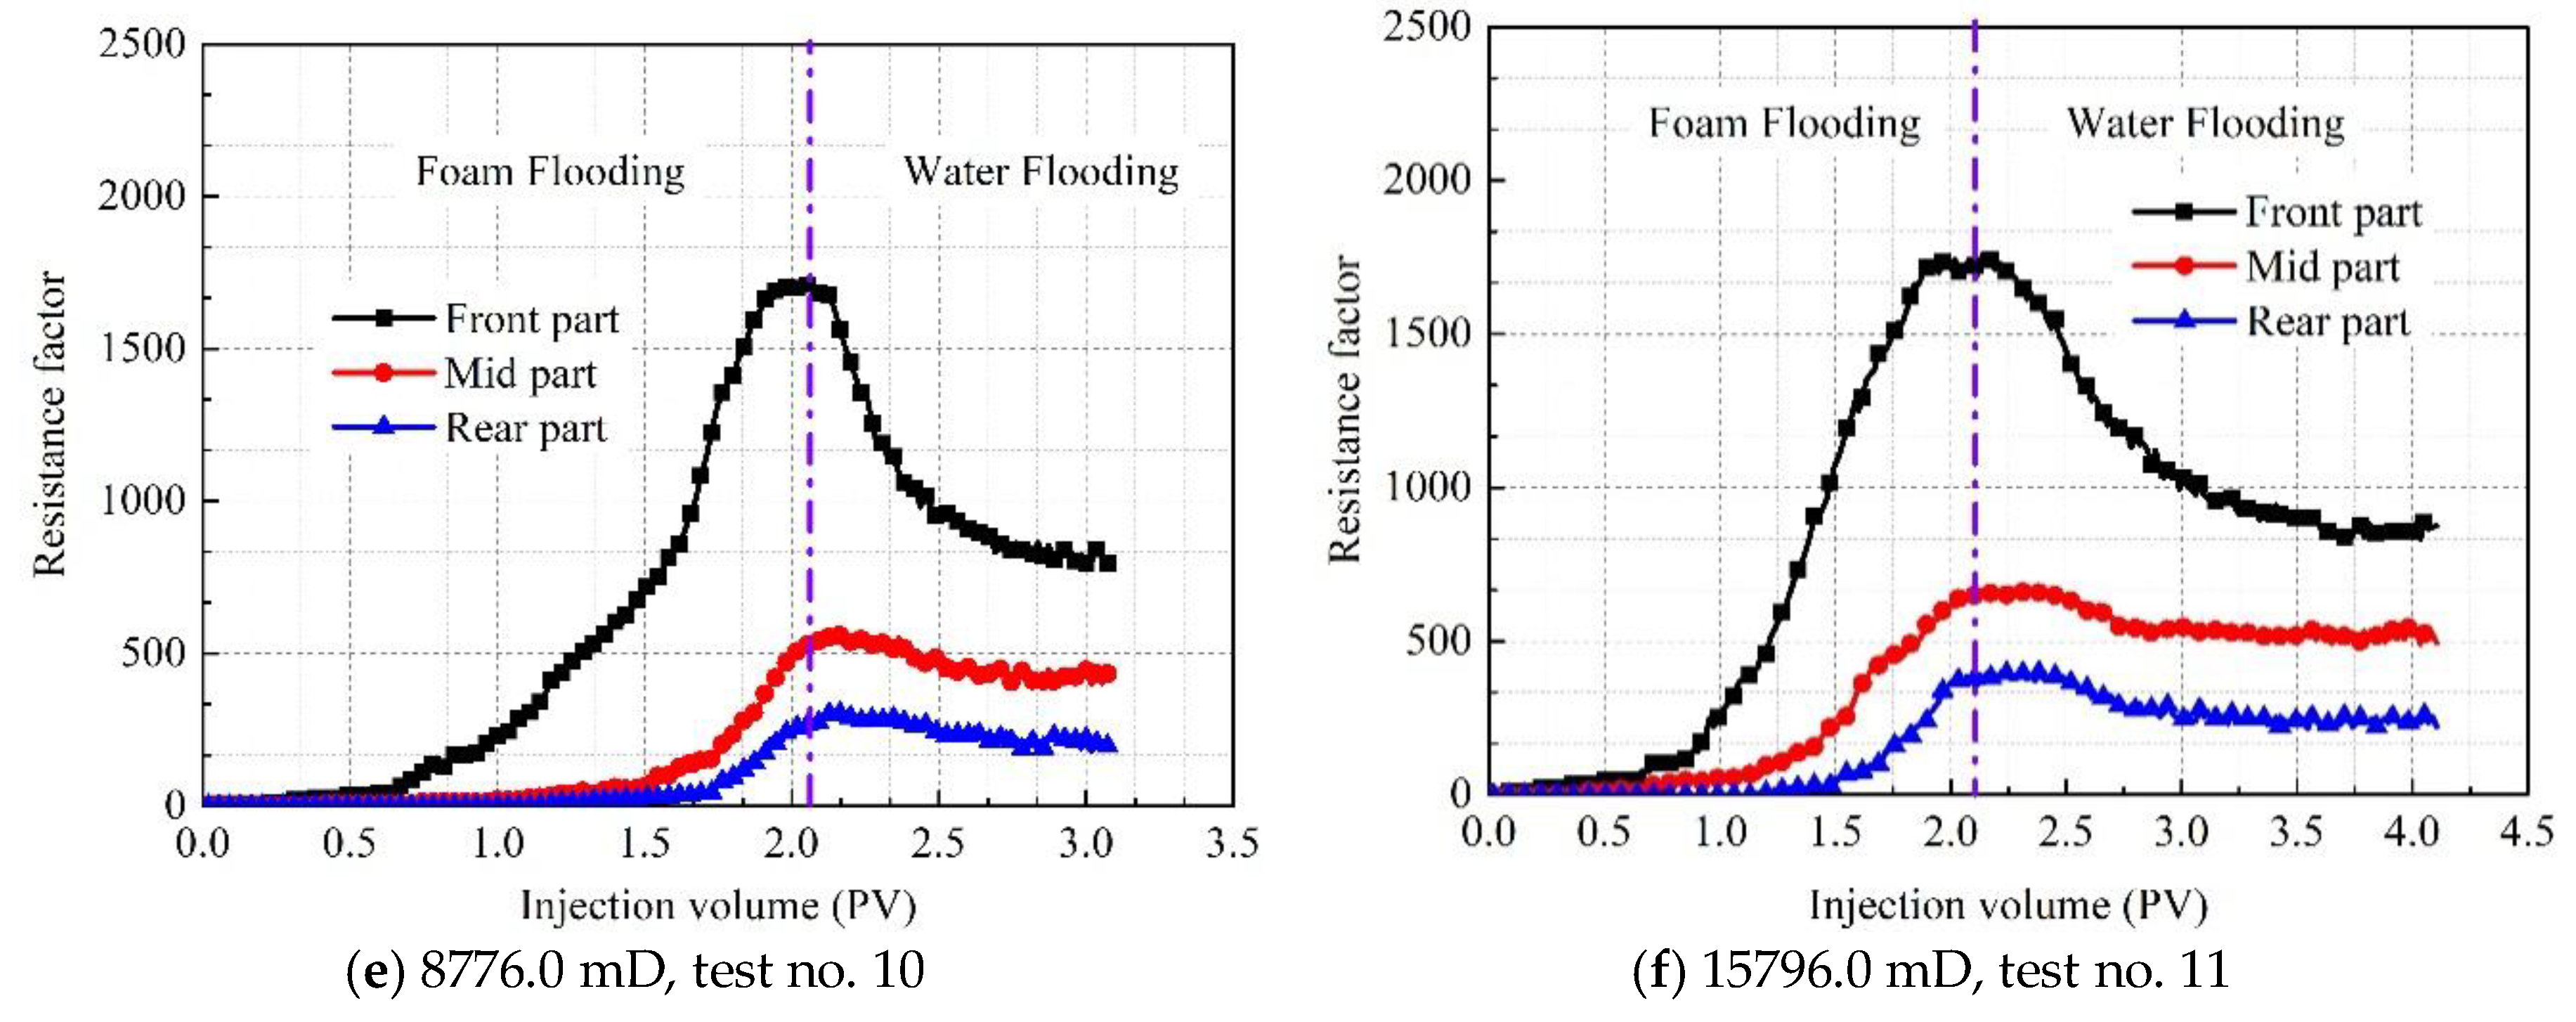
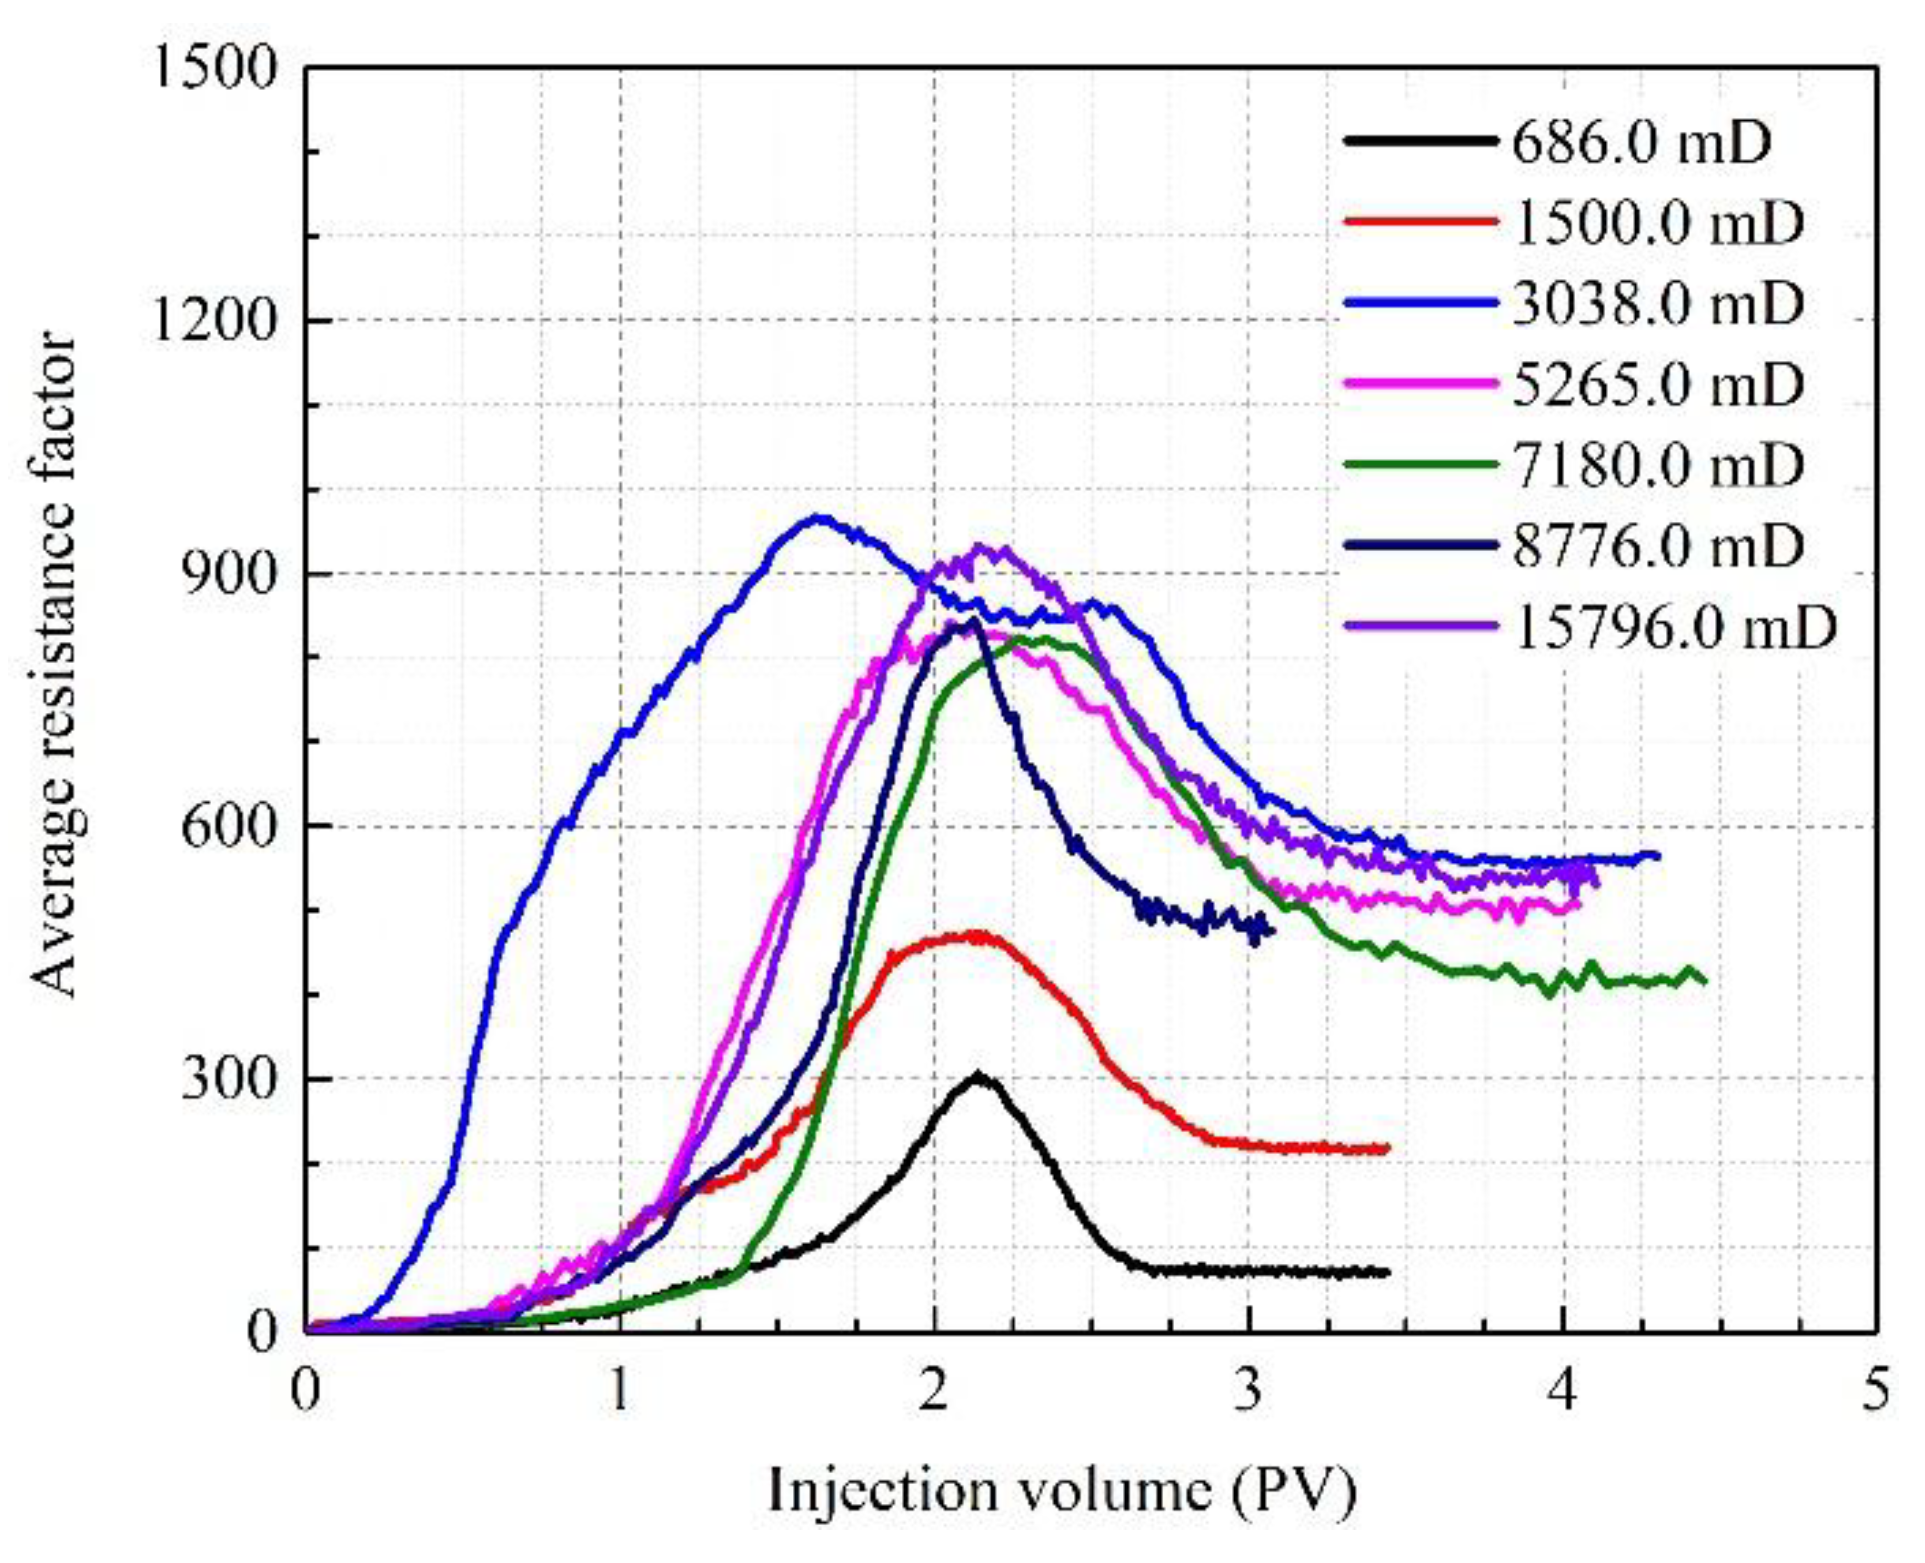
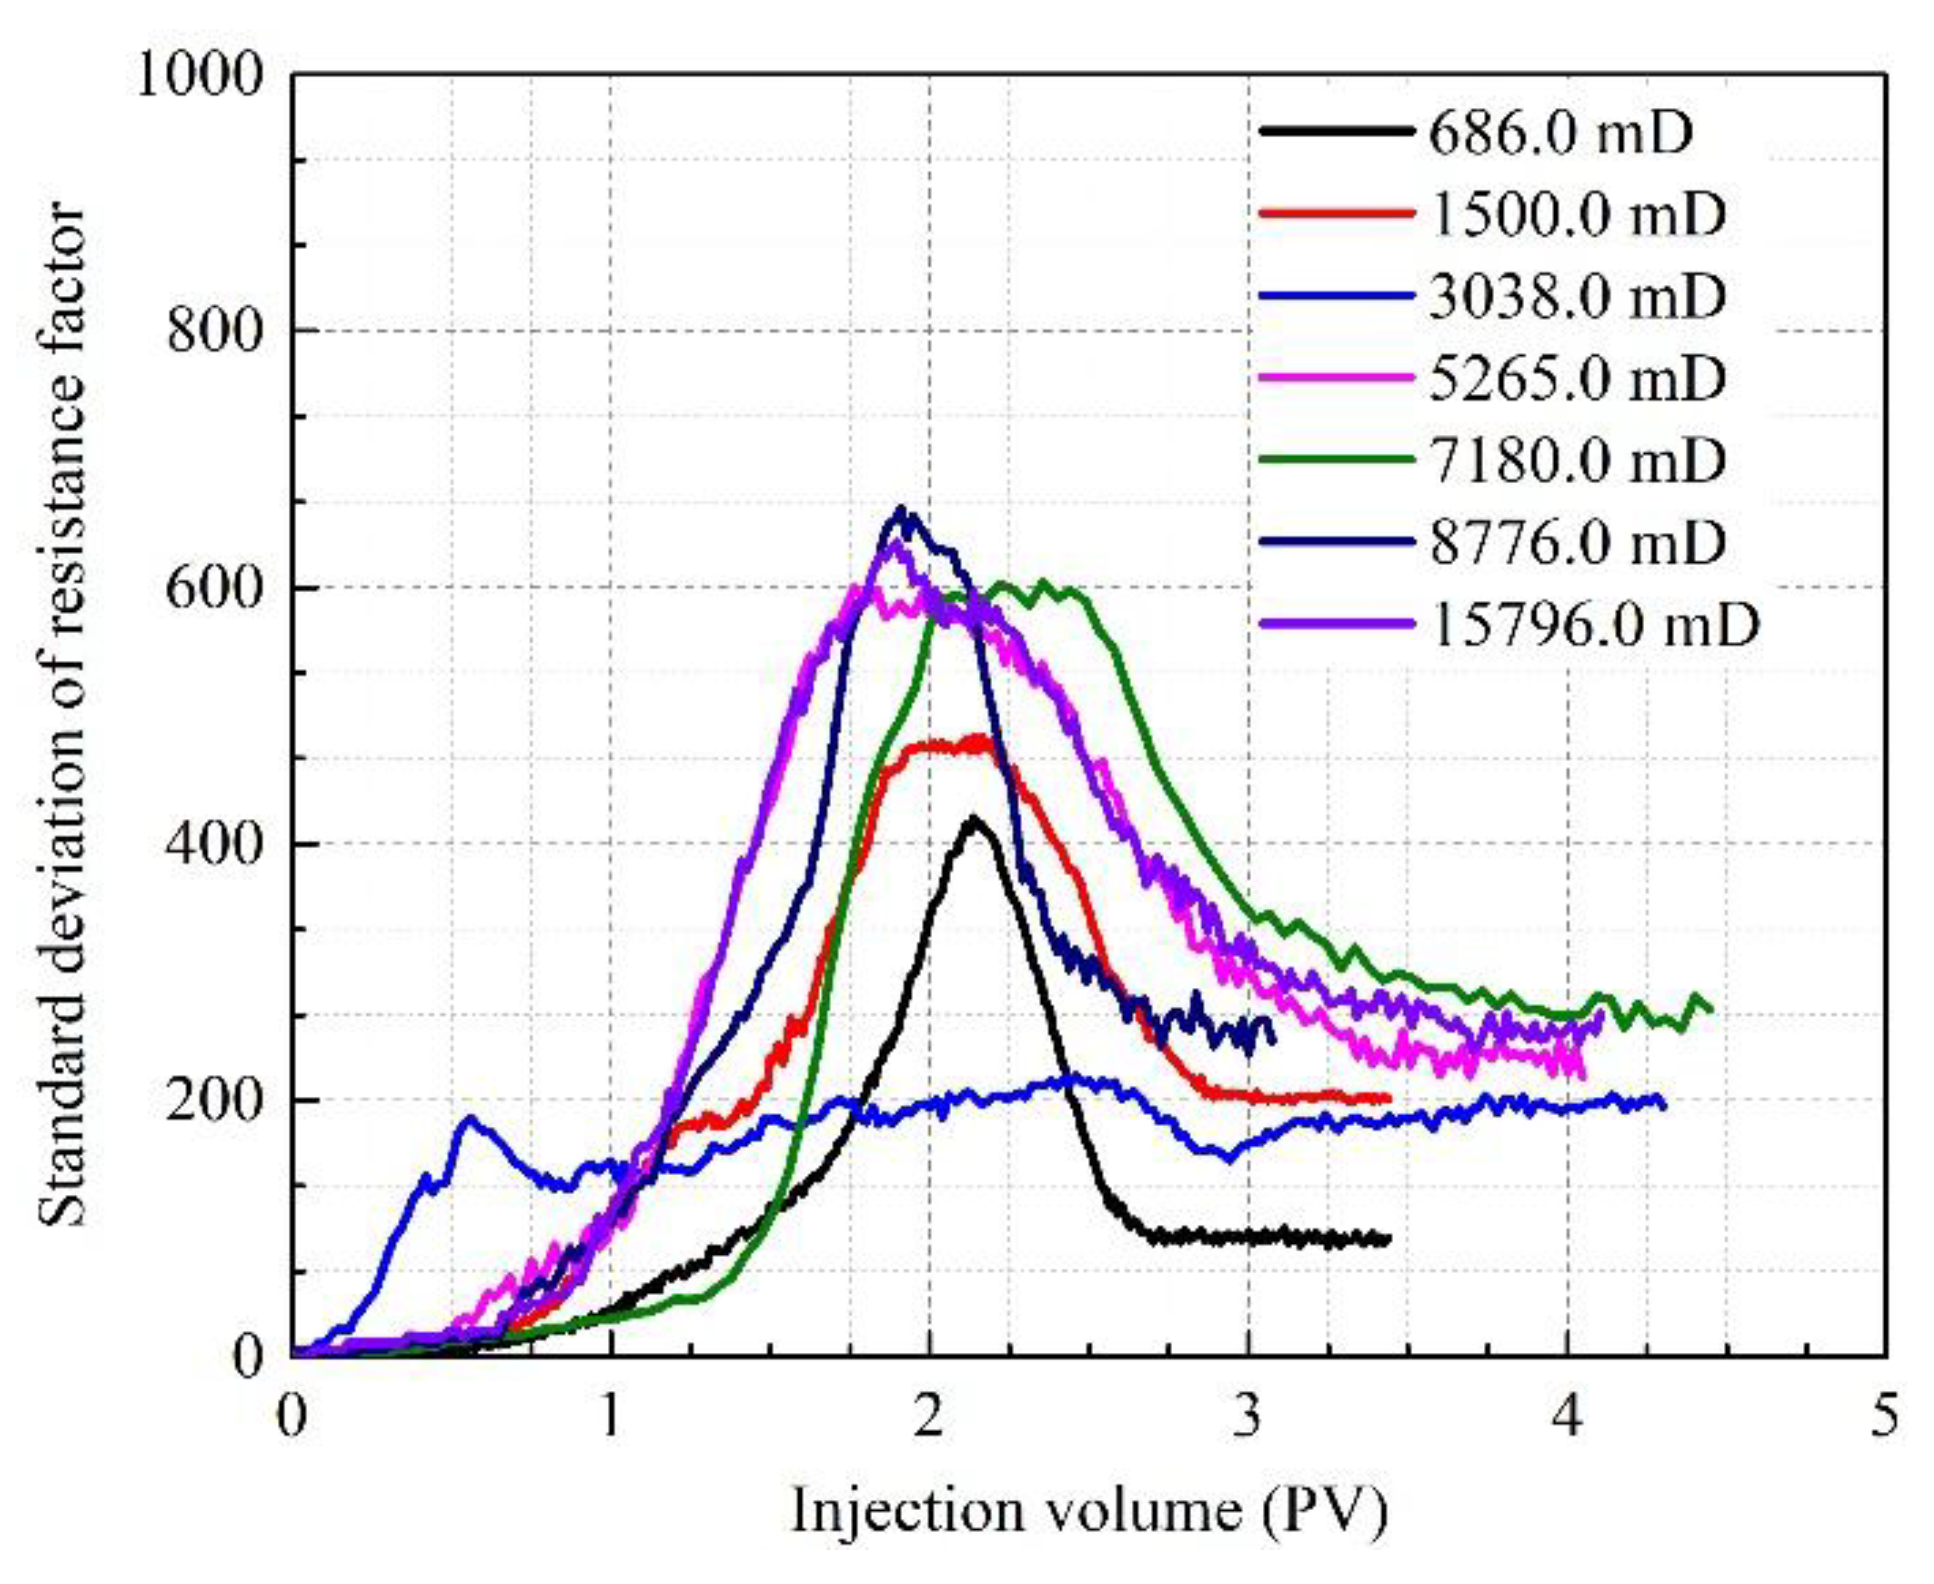
3.6. The Effect of Permeability on Profile Control

The effect of permeability on the resistance factor during the foam flooding and follow-up water flooding is depicted in Figure 19, and means and standard deviations of above data are given in Figure 20 and Figure 21, respectively. As is shown in Figure 19 and Figure 20, the plugging strength increases gradually until the permeability of sandpack reaches 3038.0 mD, and then the resistance factor is stable at a certain level. In Figure 19a,b, the resistance factors of mid and rear parts are extra small, which can be contributed to the narrow pores and throats in the low-permeable sandpack. It is hard for the clay-HY-2 foam to flow through narrow structures, thus the plugging effect can only be observed in the front part of the sandpack. This tendency coincides with Figure 10 in this work. When the permeability reaches 3038.0 mD, the resistance factor at every part is stable, which means that the sizes of pores and throats of sandpacks will not restrict the movement of foam fluid at that situation. According to Figure 21, the permeability has no obvious effect on the uniformity of the plugging effect of the foam fluid. In conclusion, the plugging strength of clay-HY-2 foam increases gradually before the permeability of sandpack reaches 3038.0 mD, and then it is stable at a certain level. Moreover, when the permeability exceeds 1502.0 mD, the foam can flow to the mid and rear parts of the sandpack.

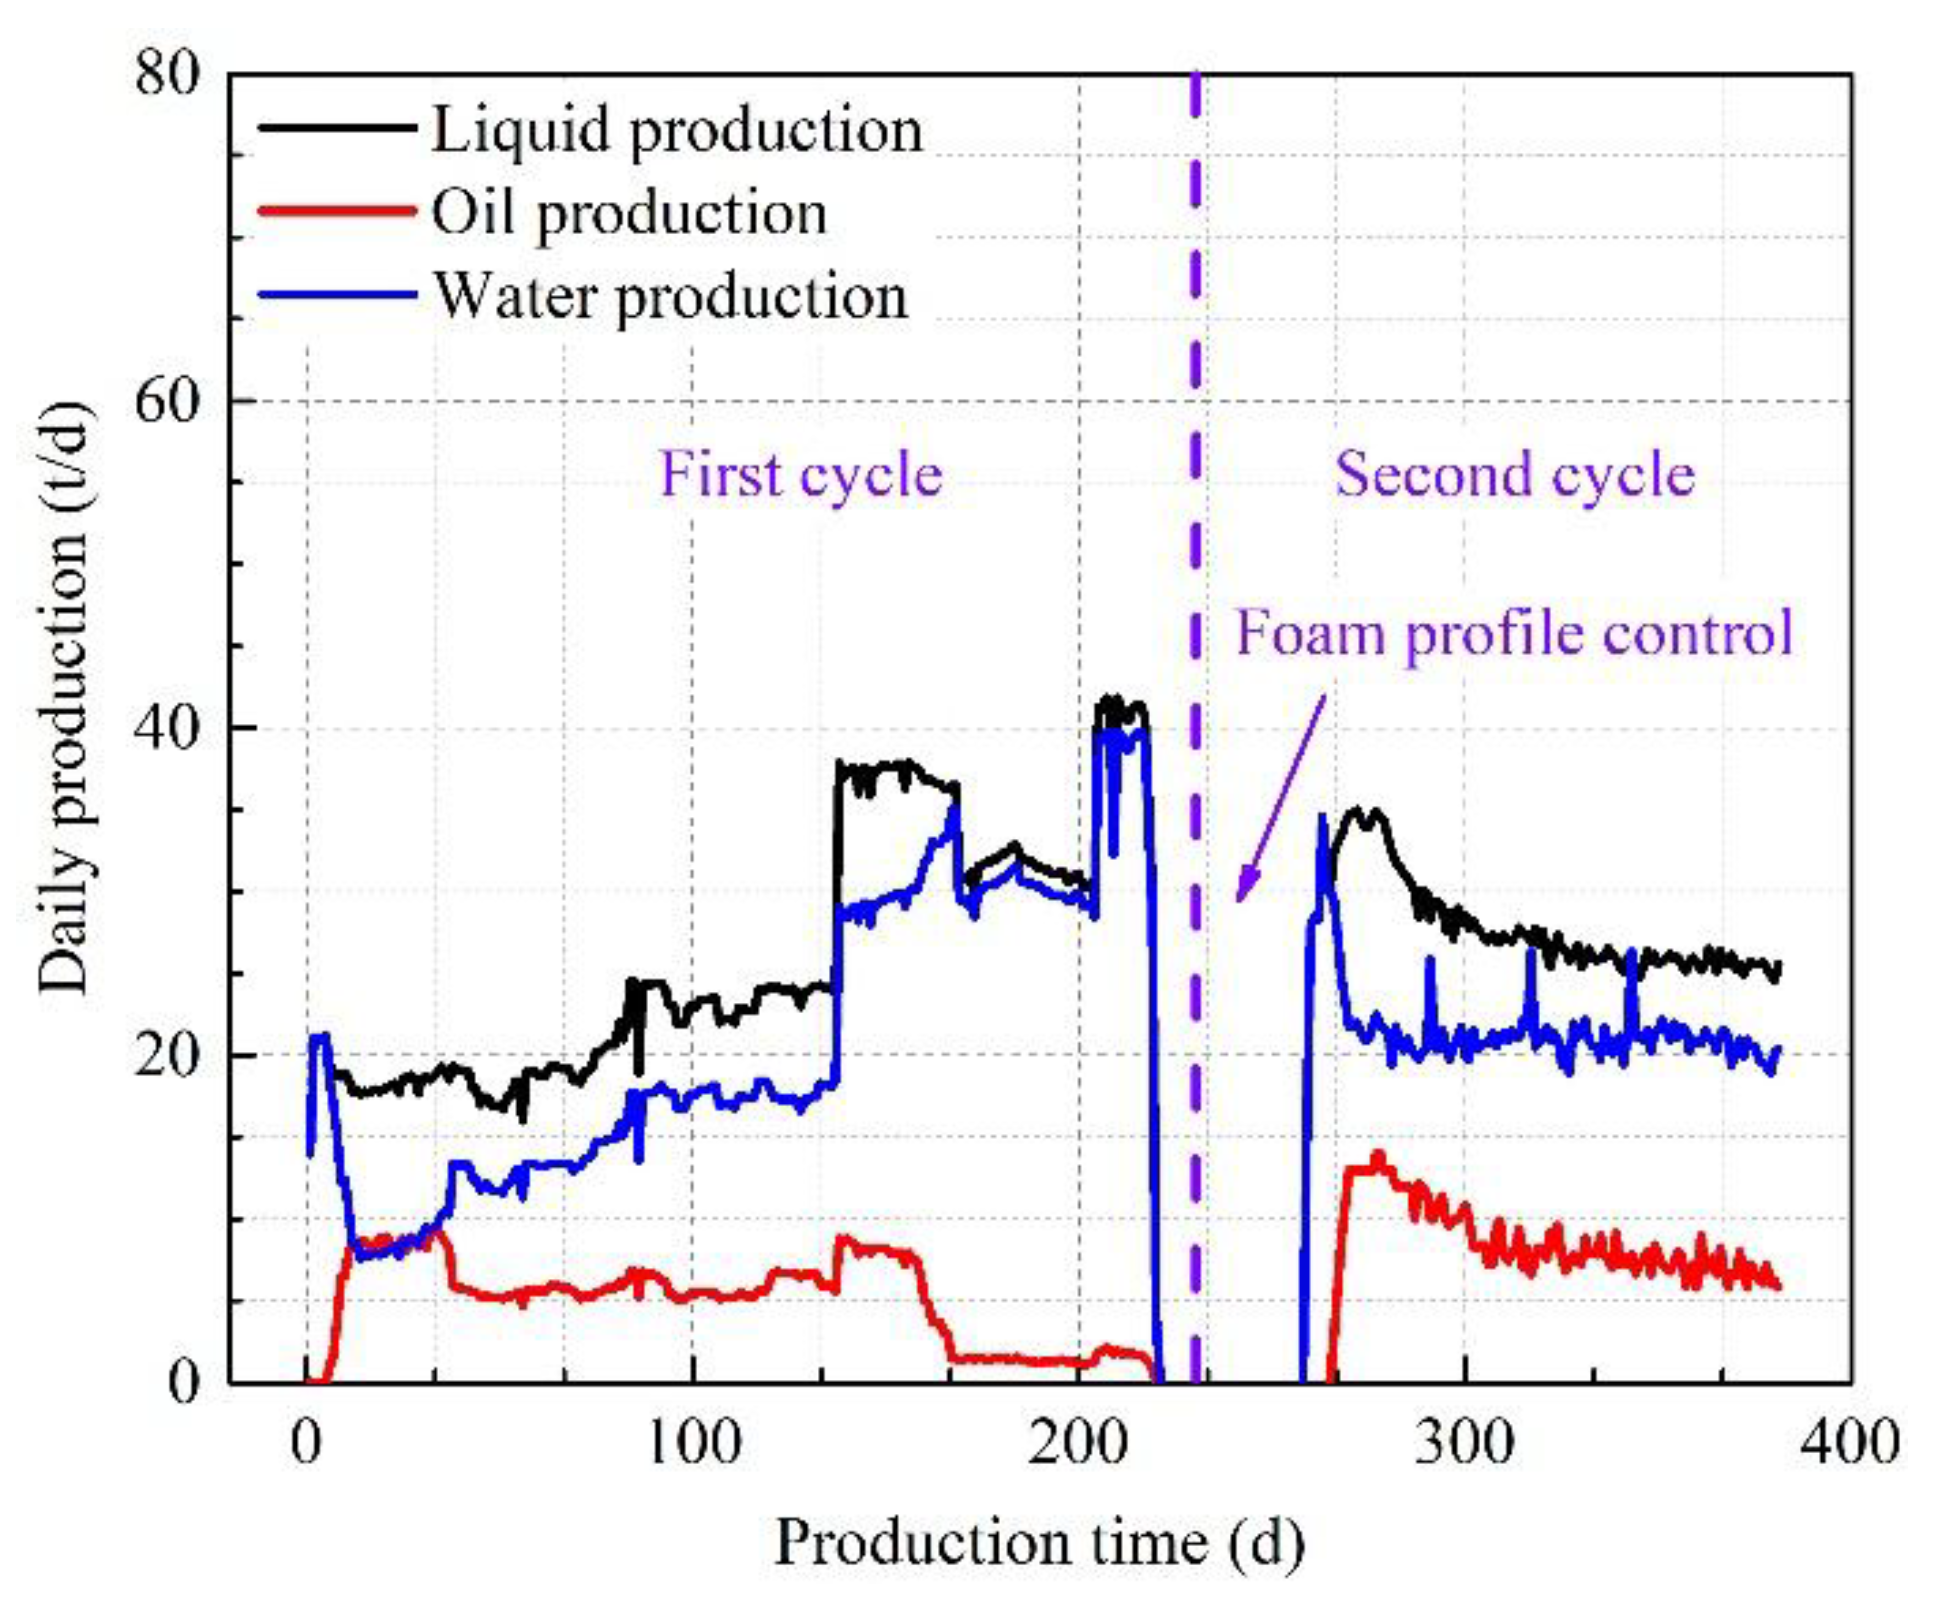
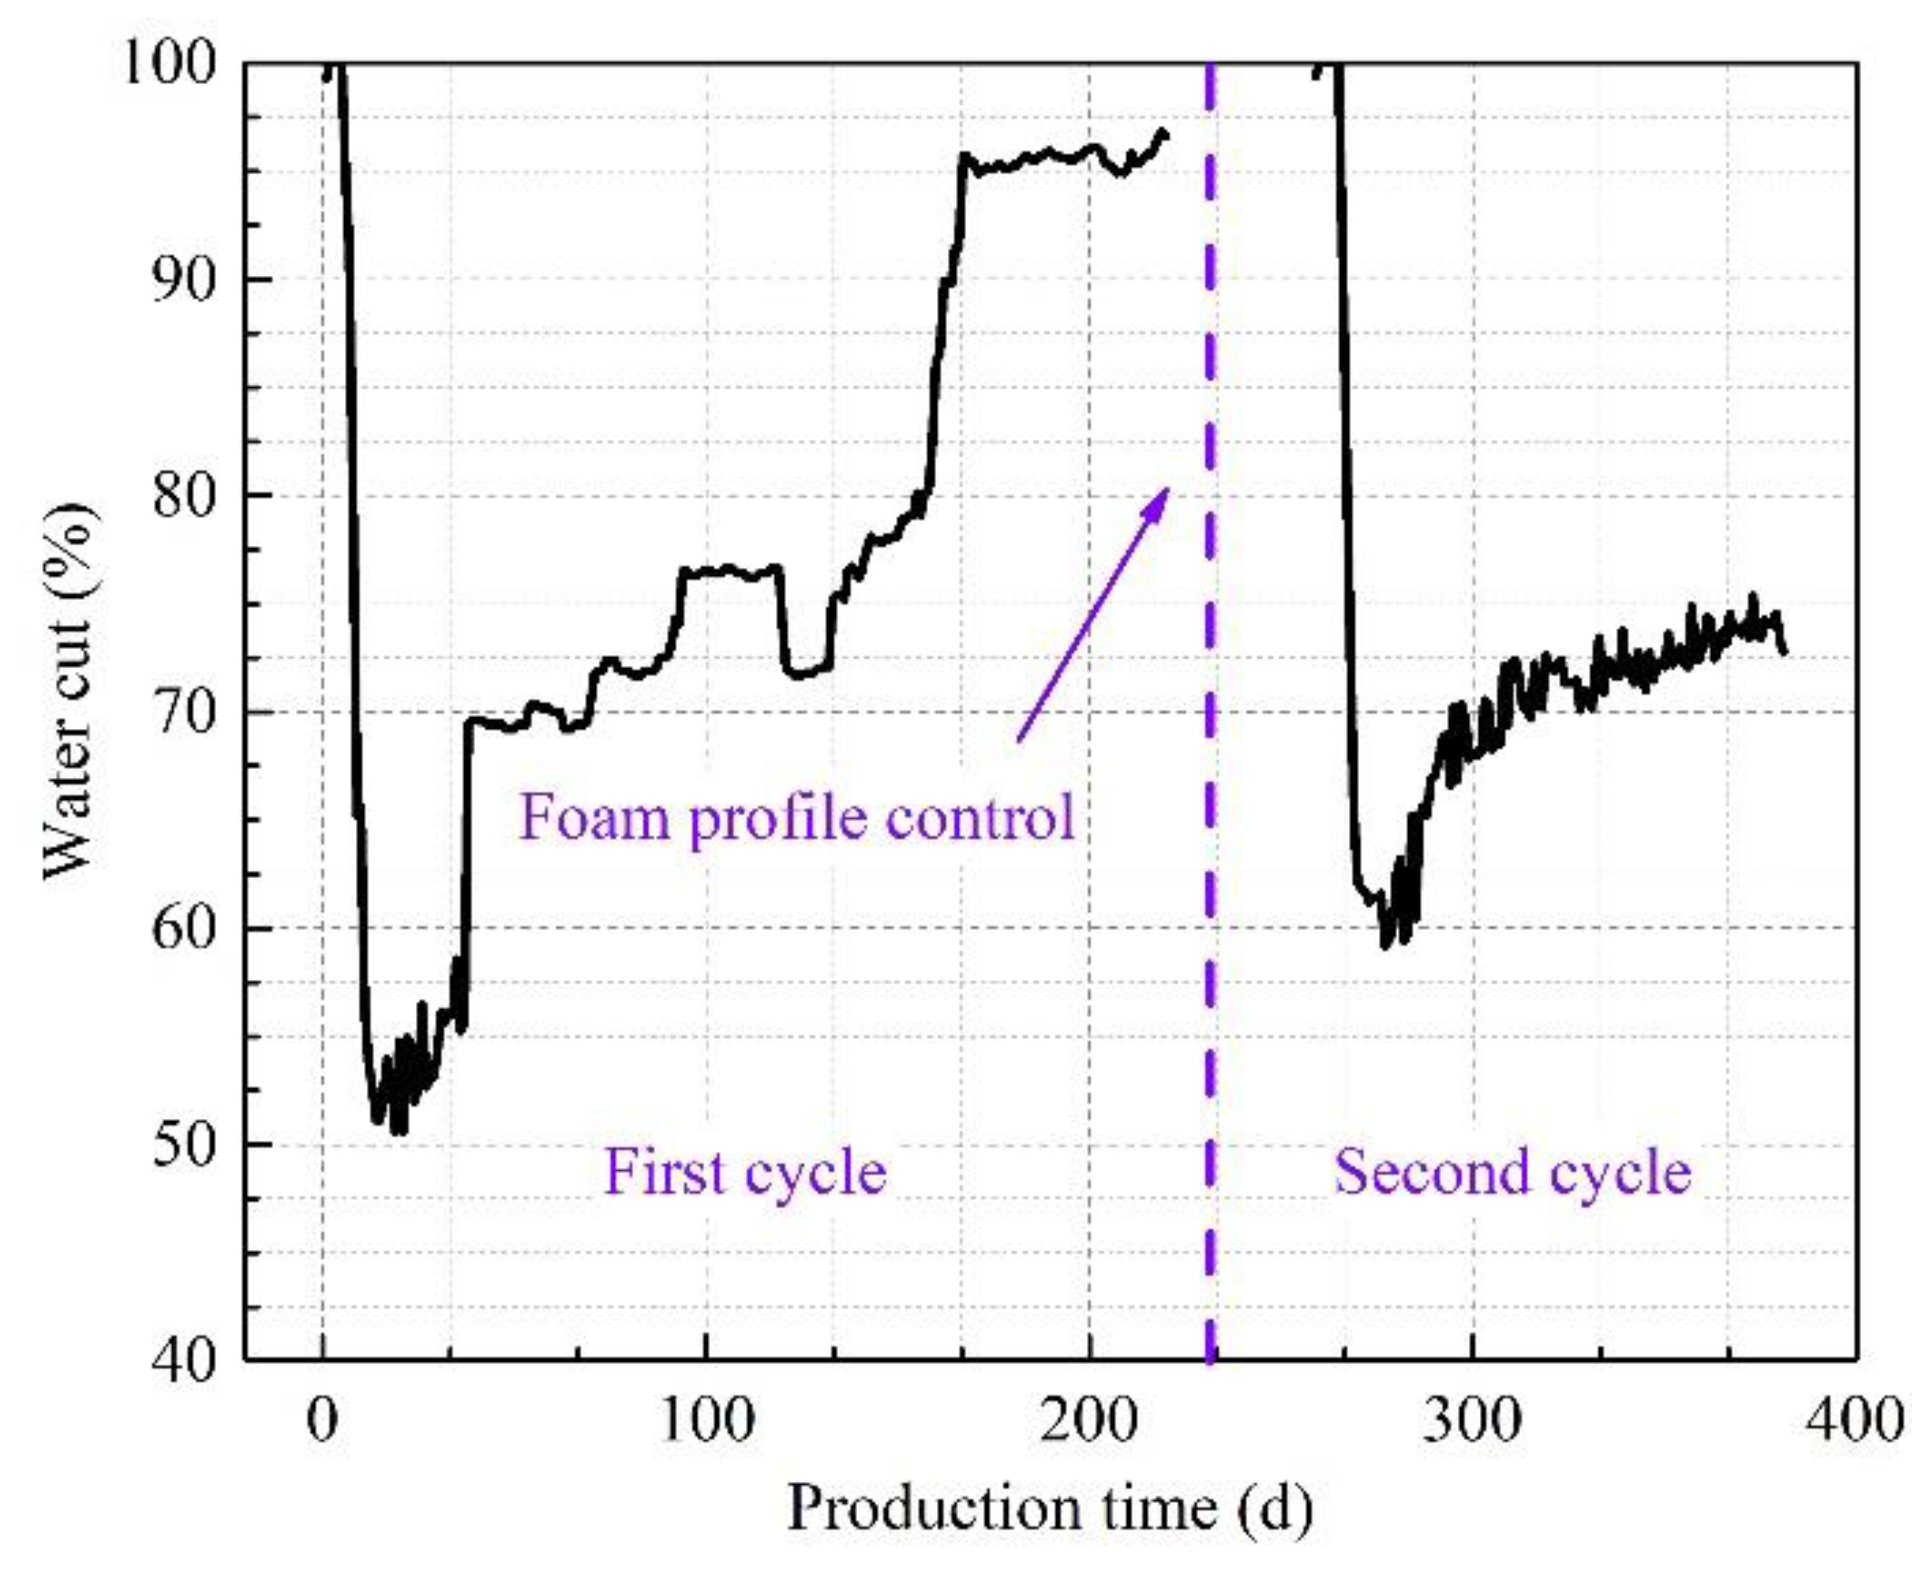
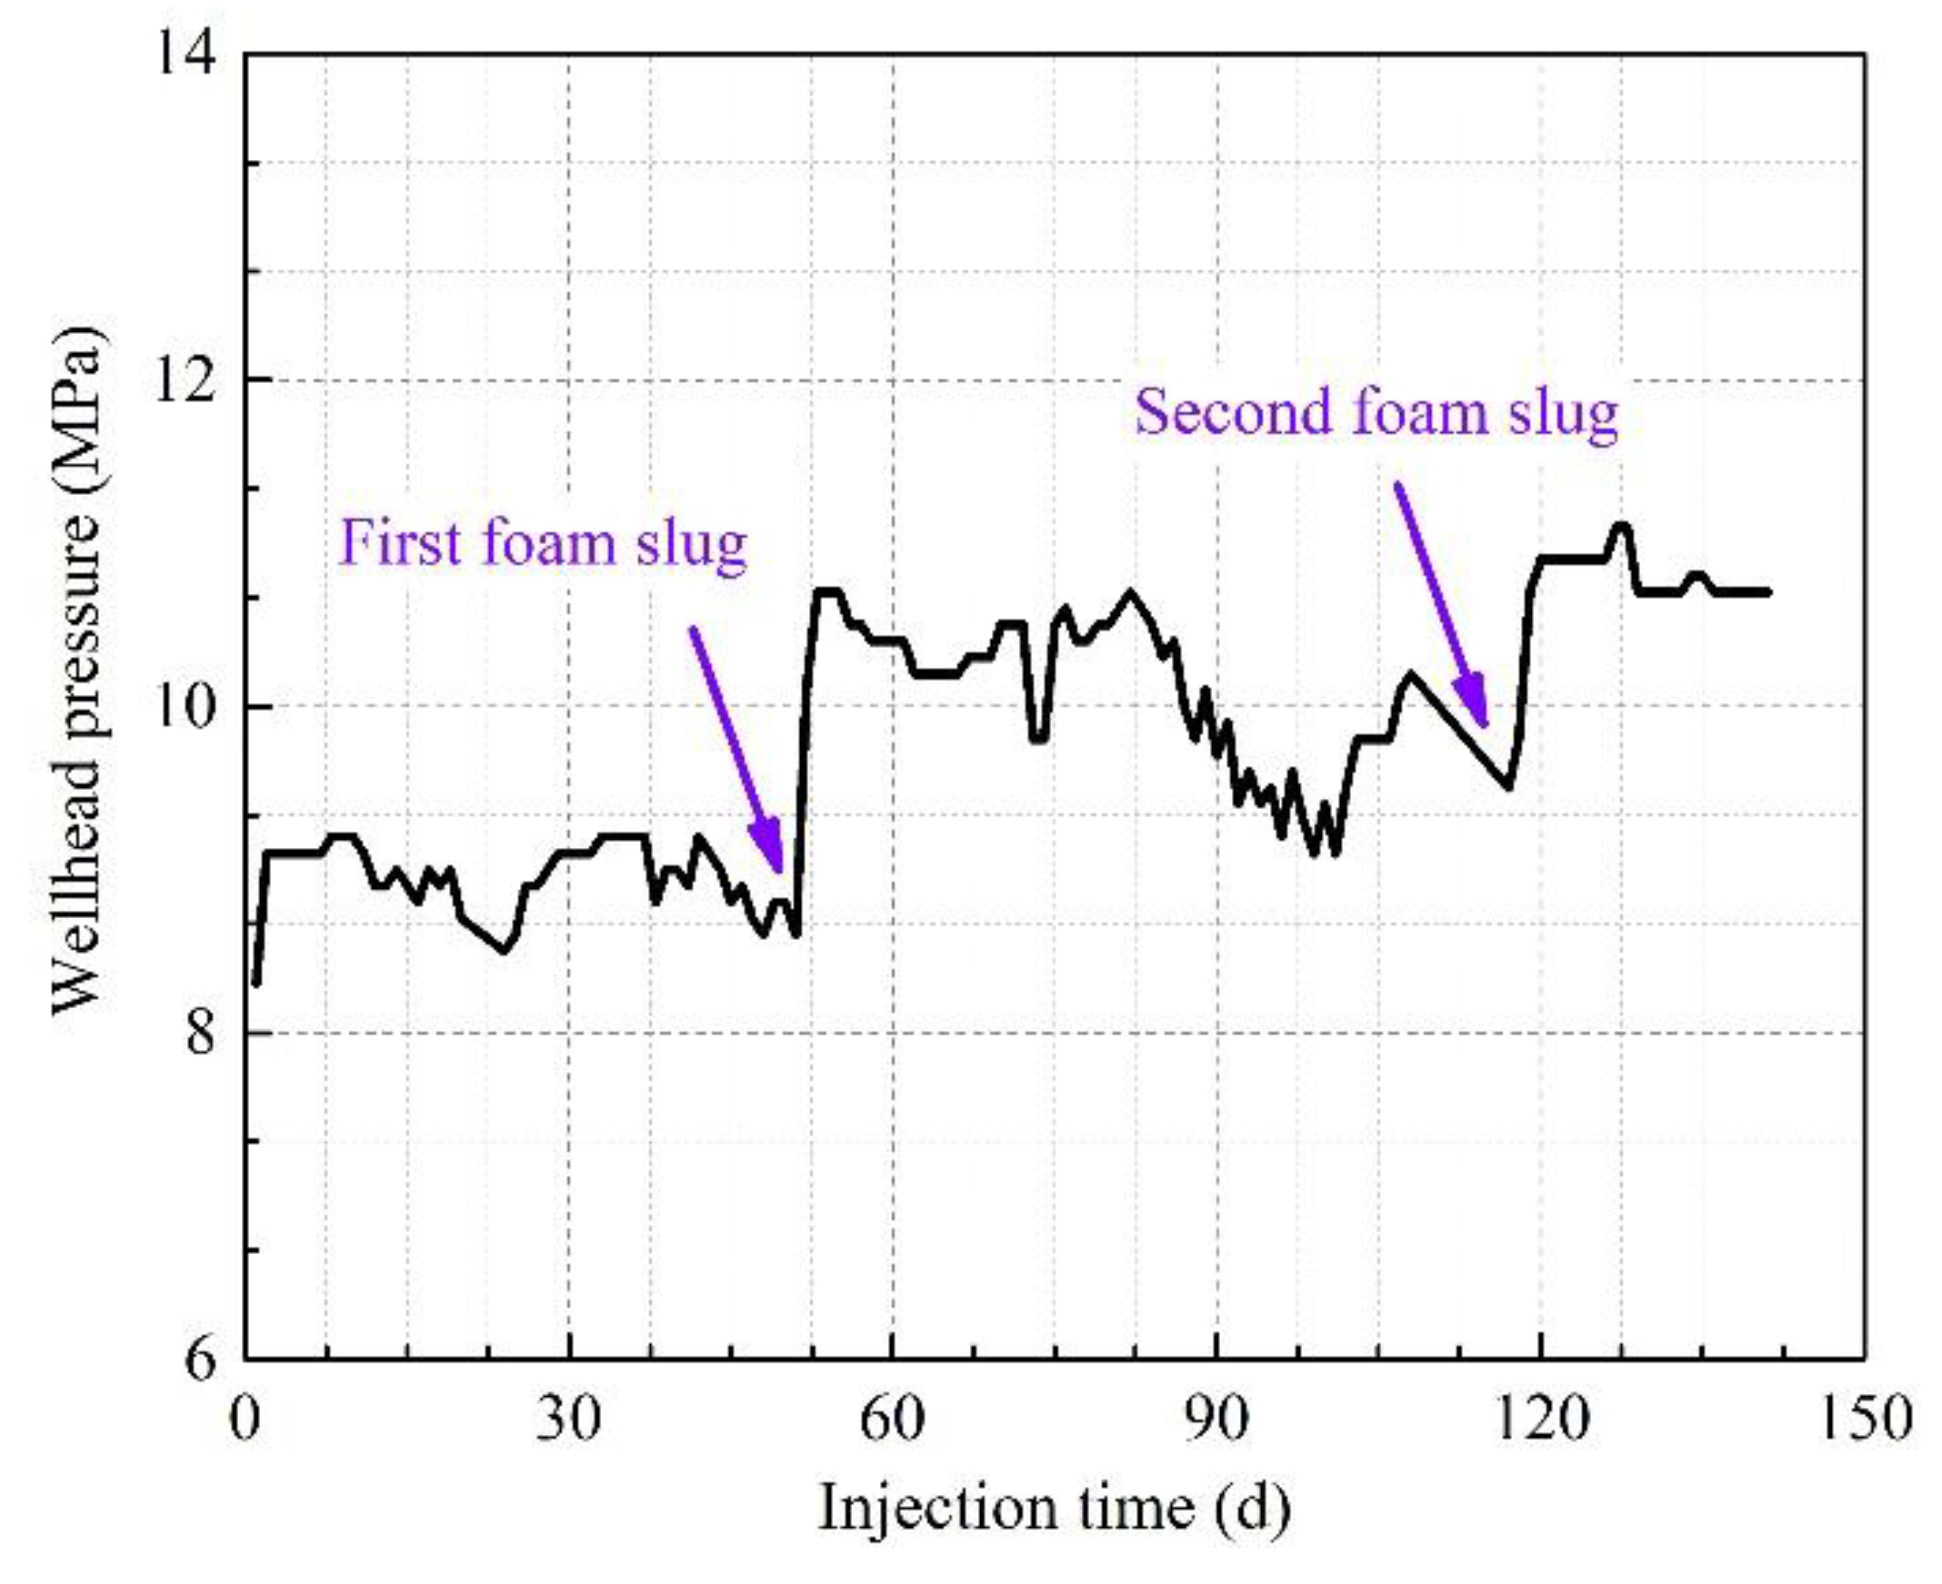
4. The Application Case of Clay-HY-2 Foam in Oilfield

Well T1 is a new well at the KB18 Block in the Shengli Oilfield, whose average permeability and porosity are 1860.0 mD and 35.7%, respectively. The depth of the deformation is around 1450.0 m, and the average temperature of the deformation is 68.7 °C. The development method of Well T1 is steam huff and puff, and the daily production rate and water cut of the well during two injection and production cycles are illustrated in Figure 22 and Figure 23, respectively. As is shown in above figures, during the first huff-n-puff cycle, the daily oil production of Well T1 was kept stable at 8.9 t/d for 20 days, and then it decreased gradually to 1.9 t/d within 130 days. Simultaneously, the water cut of Well T1 increased rapidly from 51.8% to 95.3%, and then it reached a plateau. To slow down the decline of the oil production rate, enhance utilization of steam, and inhibit the increase of water cut, the foam profile control method was employed in the steam injection period of the second huff-n-puff cycle.
Two clay-HY-2 foam slugs were designed in the profile control process, and the foam fluid was generated through a foam generator on the ground and was injected into the annular space during steam injection. In this cycle, the total injection amounts of steam, surfactant and nitrogen were 1225.0 t, 2.2 t and 34,000 sm3, respectively. As for the foam system, the concentrations of HY-2 and clay particle are 0.6 wt% and 5.0 wt%, respectively. Besides, the foam quality was around 48.2%, which is an ideal value according to the conclusion in chapter 3.4.
The wellhead pressure during injection process of the second cycle is depicted in Figure 24. The figure shows that the first foam slug was injected at the second day of steam injection, while the other slug was injected at the fourth day. Moreover, the injection rates of all fluids are constant during the process. With the presence of foam fluid, the injection pressure increased by 2.4 MPa from 8.7 MPa to 11.1 MPa, which shows that the plugging effect of clay-HY-2 foam is obvious. In Figure 22, the daily oil production increased greatly to 13.2 t/d during the second production cycle, and it kept stable around 8.2 t/d over 80 days. Moreover, the water cut of Well T1 also decreased rapidly after foam profile control, and it was stable around 72.0% for almost three months. Therefore, the clay-HY-2 foam system had good effect on the improvement of oil production and the decline of the water cut.

5. Conclusions

In this study, a clay enhanced foam system was proposed for profile control in reservoirs with high permeability. HY-2 was selected from four surfactants experimentally for its good foamability, stability and salinity resistance. As for the clay-HY-2 foam system, the optimum concentrations of clay particles and HY-2 surfactant are 5.0 wt% and 0.6 wt%, respectively.
In visible model flooding experiments, the static and flow states of clay-HY-2 foam and HY-2 foam were observed and analyzed. Compared with traditional foams, the clay-HY-2 system can form denser and smaller bubbles in high- and middle-permeable layers and have a more obvious plugging effect there [26,27], while there are less bubbles in low-permeable layers, i.e., the restriction on the flow in narrow structures is slight [21,28].
As for flooding experiments in sandpacks, the effect of different factors such as the gas–liquid ratio, temperature, and permeability on profile control were investigated. The clay-HY-2 foam performs the efficient and uniform profile control effect on sandpacks when the foam quality is around 50% [29,30,31,32,33]. The resistance factors of the foam decrease gradually with the increasing temperature, however, the resistance factor remains higher than 350.0 when the temperature reaches 80.0 °C. When the permeability exceeds 1502.0 mD, the clay-HY-2 foam can perform deep profile control in reservoirs, and the resistance factors are not sensitive to the change of permeability when it exceeds 3038.0 mD.
Besides, a site test was conducted to test the profile control effect of the clay-HY-2 foam. After foam injection, the oil production rate increased from 1.9 t/d to 13.2 t/d, while the water cut of the well decreased from 95.2% to 60.0% and was stable around 72.0%. Therefore, the site application case proves that the clay-HY-2 foam do have a good profile control effect in reservoirs.

Author Contributions

Data curation, G.J.; methodology, S.L. and Q.W.; investigation, C.Q. and G.J.; writing—original draft preparation, C.Q. and S.L.; writing—review and editing, S.L. and C.Q.; supervision, S.L. and L.T.

Funding

This project was funded by the National Key Scientific and Technological Project for the Oil and Gas Field and Coalbed Methane (Grant No. 2016ZX05011004-005), the National Natural Science Foundation of China (Grant No. 51774306), and the Fundamental Research Funds for the Central Universities (Grant No. 14CX02185A).

Acknowledgments

We are grateful to the Foam Research Center at the China University of Petroleum (East China) for their assistance with the experimental research.

Conflicts of Interest

The authors declare no conflict of interest.

References

  1. Burman, J.W.; Hall, B.E. Foam-diverting Technique Improved Sandstone Acid Jobs. World Oil 1987, 205, 31–36. [Google Scholar]
  2. Falls, A.H.; Hirasaki, G.J.; Patzek, T.W.; Gauglitz, D.A.; Miller, D.D.; Ratoulowski, T. Development of a Mechanistic Foam Simulator: The Population Balance and Generation by Snap-off. SPE Reserv. Eng. 1988, 3, 884–892. [Google Scholar] [CrossRef]
  3. Gdanski, R.D. Experience and Research Show Best Designs for Foam-diverted Acidizing. Oil Gas J. 1993, 91, 85–89. [Google Scholar]
  4. Hirasaki, G.J.; Lawson, J.B. Mechanism of Foam Flow in Porous Media: Apparent Viscosity in Smooth Capillaries. SPE J. 1985, 25, 176–190. [Google Scholar] [CrossRef]
  5. Huh, D.G.; Handy, L.L. Comparison of Steady and Unsteady-state Flow of Gas and Foaming Solution in Porous Media. SPE Reserv. Eng. 1989, 4, 77–84. [Google Scholar] [CrossRef]
  6. Friedmann, F.; Jensen, J.A. Some Parameters Influencing the Formation and Propagation of Foams in Porous Media. Acta Ophthalmol. 1986, 56, 977–983. [Google Scholar]
  7. Hill, A.D.; Rossen, W.R. Fluid Placement and Diversion in Matrix Acidizing; University of Tulsa Centennial Petroleum Engineering Symposium: Tulsa, OK, USA, 1994. [Google Scholar]
  8. Morphy, P.H.; Greenwald, K.G.; Herries, P.E. Operational Experience with Foam-diverted Acid Jobs in the Gulf of Mexico. Oil Well 1998, 50, 44–45. [Google Scholar]
  9. Rossen, W.R.; Bruining, J. Foam Displacements with Multiple Steady States. SPE J. 2007, 12, 5–18. [Google Scholar] [CrossRef]
  10. Vries, A.S.D.; Wit, K. Rheology of Gas/Water Foam in the Quality Range Relevant to Steam Foam. SPE Reserv. Eng. 1990, 5, 185–192. [Google Scholar] [CrossRef]
  11. Lv, Q.; Li, Z.; Li, B.; Li, S.; Sun, Q. Study of Nanoparticle–Surfactant-Stabilized Foam as a Fracturing Fluid. Ind. Eng. Chem. Res. 2015, 54, 9456–9477. [Google Scholar] [CrossRef]
  12. Romero-Zeron, L.; Kantzas, A. Evolution of Foamed Gel Confined in Pore Network Models. J. Can. Pet. Technol. 2006, 45, 51–62. [Google Scholar] [CrossRef]
  13. Romero, C.; Alvarez, J.M.; Mller, A.J. Micromodel Studies of Polymer-Enhanced Foam Flow through Porous Media; SPE/DOE Improved Oil Recovery Symposium: Tulsa, OK, USA, 2002. [Google Scholar]
  14. Hoefner, M.L.; Seetharam, R.V.; Shu, P.; Phelps, C.H. Selective Penetration of Biopolymer Profile-Control Gels: Experiment and Model. J Pet. Sci. Eng. 1992, 7, 53–66. [Google Scholar] [CrossRef]
  15. Parmeswar, R.; Willhite, G.P. A Study of the Reduction of Brine Permeability in Berea Sandstone with the Aluminum Citrate Process. SPE Reserv. Eng. 1988, 3, 959–966. [Google Scholar] [CrossRef]
  16. Seright, R.S. Effect of Rheology on Gel Placement. SPE Reserv. Eng. 1991, 6, 212–218. [Google Scholar] [CrossRef]
  17. Koroleva, M.Y.; Tokarev, A.M.; Yurtov, E.V. Modeling of O/W Emulsion Stabilization by Nanoparticles. In Proceedings of the Fifth International Colloid Conference, Amsterdam, The Netherlands, 20–24 June 2015. [Google Scholar]
  18. Sharma, T.; Kumar, G.S.; Sangwai, J.S. Comparative Effectiveness of Production Performance of Pickering Emulsion Stabilized by Nanoparticle–Surfactant–Polymerover Surfactant–Polymer (SP) Flooding for Enhanced Oil Recoveryfor Brownfield Reservoir. J. Pet. Sci. Eng. 2015, 129, 221–232. [Google Scholar] [CrossRef]
  19. Binks, B.P.; Horozov, T.S. Colloidal Particles at Liquid Interfaces; Cambridge University Press: London, UK, 2006. [Google Scholar]
  20. Nikolov, A.D.; Wasan, D.T. Dispersion Stability Due to Structural Contributions to the Particle Interaction as Probed by Thin Liquid Film Dynamics. Langmuir 1992, 8, 2985–2994. [Google Scholar] [CrossRef]
  21. Zhang, S.; Lan, Q.; Liu, Q.; Xu, J.; Sun, D. Aqueous Foams Stabilized by Laponite and CTAB. Colloids Surf. A 2008, 317, 406–413. [Google Scholar] [CrossRef]
  22. Zhong, X.; Liu, D.; Shi, X.; Zhao, H.; Pei, C.; Zhu, T.; Shao, M.; Zhang, F. Characteristics and Functional Mechanisms of Clay-Cement Stabilized Three-Phase Nitrogen Foam for Heavy Oil Reservoir. J. Pet. Sci. Eng. 2018, 170, 497–506. [Google Scholar] [CrossRef]
  23. Sun, Q.; Li, Z.; Wang, J.; Li, S.; Li, B.; Jiang, L.; Wang, H.; Lv, Q.; Zhang, C.; Liu, W. Aqueous Foam Stabilized by Partially Hydrophobic Nanoparticles in the Presence of Surfactant. Colloids Surf. A 2015, 471, 54–64. [Google Scholar] [CrossRef]
  24. Li, T.; Fang, J.; Jiao, B.; He, L.; Dai, C.; You, Q. Study on a Novel Felled Foam for Conformance Control in High Temperature and High Salinity Reservoirs. Energies 2018, 11, 1364. [Google Scholar] [CrossRef]
  25. Zhao, G.; Fang, J.; Dai, C.; Yan, Y.; Yan, Z.; You, Q. Enhanced Foam Stability by Adding Dispersed Particle Gel: A New Three-Phase Foam Study. In Proceedings of the SPE Asia Pacific Enhanced Oil Recovery Conference, Kuala Lumpur, Malaysia, 11–13 August 2015. [Google Scholar]
  26. Kostoglou, M.; Lioumbas, J.; Karapantsios, T. A Population Balance Treatment of Bubble Size Evolution in Free Draining Foams. Colloids Surf. A 2015, 473, 75–84. [Google Scholar] [CrossRef]
  27. Li, S.; Qiao, C.; Li, Z.; Wanambwa, S. Properties of Carbon Dioxide Foam Stabilized by Hydrophilic Nanoparticles and Hexadecyl Trimethyl Ammonium Bromide. Energy Fuels 2017, 31, 1478–1488. [Google Scholar] [CrossRef]
  28. Ma, K.; Liontas, R.; Conn, C.A.; Hirasaki, G.J.; Biswal, S.L. Visualization of Improved Sweep with Foam in Heterogeneous Porous Media Using Microfluidics. Soft Matter 2012, 8, 10669–10675. [Google Scholar] [CrossRef]
  29. Li, S.; Li, Z.; Li, B. Experimental Study and Application on Profile Control Using High-Temperature Foam. J. Pet. Sci. Eng. 2011, 78, 567–574. [Google Scholar] [CrossRef]
  30. Fuseni, A.B.; Julaih, A.H.; Al-Aseeri, A.A.; Alsofi, A.M. Development and Evaluation of Foam-Based Conformance Control for a High Salinity and High Temperature Carbonate. In Proceedings of the SPE Middle East Oil & Gas Show and Conference, Muscat, Oman, 26–28 March 2016. [Google Scholar]
  31. Liu, H.; Ye, P.; Li, W.; Song, L.; Zhong, Y. Application of Nitrogen Foam for Profile Modification in a Heterogeneous Multi-Layer Sandstone Oilfield. In Proceedings of the SPE Asia Pacific Oil and Gas Conference and Exhibition, Brisbane, Australia, 23–25 October 2010. [Google Scholar]
  32. Chen, N.; Wang, Z.; Liu, Y.; Jiang, Z. Research on Foaming Ability and Foam Stability of Foaming Agent at the Temperature and Pressure. Chem. Eng. Oil Gas 2017, 46, 65–68. [Google Scholar]
  33. Zhang, Y.; Wu, Z.; Wu, Z.; Yang, D. Effects of Temperature on Foam Stability and Separation Efficiencies of Foam Formed by High Concentration SDS Aqueous Solution During Foam Separation. J. Chem. Eng. Chin. Univ. 2012, 26, 536–540. [Google Scholar]
  34. Sun, Z.; Chen, Y.; Lin, J.; Meng, Q. Research and Application of Profile Control by Carbon Dioxide Foam in Steam Drive. Sino-Glob. Energy 2017, 22, 64–67. [Google Scholar]
  35. Yao, K.; Wang, Z.; Guo, H. Experimental Study and Application of Profile Control by Steam-Foam during Recovery of Heavy Oil. Spec. Oil Gas Reserv. 1996, 3, 44–48. [Google Scholar]
Figure 1. The diagram of ultrasonic dispersion instrument.
Energies 12 00781 g001
Figure 2. The diagram of apparatus in microscopic experiments.
Energies 12 00781 g002
Figure 3. The diagram of apparatus in flooding experiments.
Energies 12 00781 g003
Figure 4. The properties of ultrapure water foams stabilized with different surfactants.
Energies 12 00781 g004
Figure 5. The properties of brine foams stabilized with different surfactants.
Energies 12 00781 g005
Figure 6. The properties of clay-HY-2 foam with different clay particle concentrations.
Energies 12 00781 g006
Figure 7. The size of particles in clay-HY-2 dispersions with different salinities.
Energies 12 00781 g007
Figure 8. The static states of clay-HY-2 foam (left) and HY-2 foam (right) in high-permeable visible model.
Energies 12 00781 g008
Figure 9. The static states of clay-HY-2 foam (left) and HY-2 foam (right) in middle-permeable visible model.
Energies 12 00781 g009
Figure 10. The static states of clay-HY-2 foam (left) and HY-2 foam (right) in low-permeable visible model.
Energies 12 00781 g010
Figure 11. The deformation and stretch of big bubbles in the throat of porous media.
Energies 12 00781 g011
Figure 12. The move and deformation of small bubbles in the throat of porous media. (a) Before throat, (b) In the forepart of throat, (c) In the rear part of throat and (d) After throat.
Energies 12 00781 g012
Figure 13. The pressure curve of foam injection with different gas–liquid ratios.
Energies 12 00781 g013
Figure 14. The average resistance factor in sandpacks under different gas–liquid ratios.
Energies 12 00781 g014
Figure 15. The standard deviation of resistance factors in sandpacks under different gas–liquid ratios.
Energies 12 00781 g015
Figure 16. The pressure curve of foam injection under different temperatures.
Energies 12 00781 g016
Figure 17. The average resistance factors in sandpacks under different temperatures.
Energies 12 00781 g017
Figure 18. The standard deviation of resistance factors in sandpacks under different temperatures.
Energies 12 00781 g018
Figure 19. The resistance factor of foam injection in cores with different permeability.
Energies 12 00781 g019aEnergies 12 00781 g019b
Figure 20. The average resistance factor in sandpacks with different permeabilities.
Energies 12 00781 g020
Figure 21. The standard diversion of resistance factor in sandpacks with different permeabilities.
Energies 12 00781 g021
Figure 22. The production of well T1 before and after foam profile control.
Energies 12 00781 g022
Figure 23. The water cut of well T1 before and after foam profile control.
Energies 12 00781 g023
Figure 24. The wellhead pressure of Well T1 during injection process.
Energies 12 00781 g024
Table 1. The experimental conditions of foam flooding in sandpacks.
Test No.Permeability (mD)Porosity (%)Temperature (°C)Gas–liquid RatioInjection Rate (mL/min)
13038.024.423.01:22.0
22985.024.323.01:12.0
33159.023.523.02:12.0
43010.024.950.01:12.0
53025.025.480.01:12.0
6686.019.223.01:12.0
71502.023.623.01:12.0
85265.027.523.01:12.0
97180.032.223.01:12.0
108776.035.623.01:12.0
1115,796.037.323.01:12.0

