Abstract
The dynamics of a homogeneous adiabatic autoignition of an ammonia/air mixture at constant volume was studied, using the algorithmic tools of Computational Singular Perturbation. Since ammonia combustion is characterized by both unrealistically long ignition delays and elevated NO emissions, the time frame of action of the modes that are responsible for ignition was analyzed by calculating the developing time scales throughout the process and by studying their possible relation to NO emissions. The reactions that support or oppose the explosive time scale were identified, along with the variables that are related the most to the dynamics that drive the system to an explosion. It is shown that reaction HO (+M) → OH + OH (+M) is the one contributing the most to the time scale that characterizes ignition and that its reactant HO is the species related the most to this time scale. These findings suggested that addition of HO in the initial mixture will influence strongly the evolution of the process. It was shown that ignition of pure ammonia advanced as a slow thermal explosion with very limited chemical runaway. The ignition delay could be reduced by more than two orders of magnitude through HO addition, which causes only a minor increase in NO emissions.
Ammonia is considered a source of hydrogen that can be easily manufactured, liquified, and economically stored safely at relatively low pressure, providing energy per unit volume greater than that of pure hydrogen [1]. When compared to hydrocarbons and hydrogen, ammonia is the least expensive onboard fuel (in terms of cost per gigajoule) with the cheapest 100 km driving range, and it has narrower flammability limits and lower risk of explosion [2]. Another attractive feature is its high octane rating leading to higher compression ratios inside internal combustion (IC) engines and thus to higher efficiency [1]. Furthermore, ammonia can be easily made from hydrogen, or produced from water electrolysis with renewable energy and atmospheric nitrogen through the Haber process [3].
There are several challenges in realizing ammonia as a fuel, such as long ignition delay [4], low flame speed and temperature, narrow flammability range, and high ignition energy and autoignition temperature [1]. Application of ammonia to fuel engines goes back to World War II, when the shortage in fossil fuel led some European nations to use ammonia as a fuel in buses [5]. Ammonia regained its interest as an alternative fuel in the past decade, during which plenty of studies have been reported on ammonia usage in compression ignition (CI) and spark ignition (SI) engines [3,5,6,7,8]. Several studies have identified strategies and additives that would assist ammonia in reaching the optimal combustion behavior for its application in combustion engines. Hydrogen, with its high flammability range and flame speed, can be considered as one of the potential carbon-free additives to be used. Frigo and Gentili [3] studied the effect of introducing hydrogen onboard by catalytic reforming of ammonia to a 4-stroke twin-cylinder SI engine. By producing hydrogen from ammonia and introducing it in the fuel mixture, the minimum ignition energy dropped from 8 mJ to 0.018 mJ, with an increase in the laminar flame velocity from 0.015 ms to 3.51 ms was reported [9]. The results showed that with a minimum content of hydrogen, which differed as a function of engine load, ammonia combustion could be accelerated to achieve proper engine behavior [3].
Li et al. [10] conducted an experimental study to identify the combustion characteristics and emissions of the hydrogen–ammonia–air mixture. The flame velocity was measured using a Bunsen burner. The authors observed that the flame velocity of the mixture increased as the hydrogen mole fraction increased. Controlling the concentration of ammonia in the mixture gave the flexibility to control the flame velocity, thus, widening the possible applications of such fuel. The maximum flame velocity of the mixture occured at = 1.01, which was similar to the ammonia–air mixture, from which it can be concluded that hydrogen accelerates the combustion while ammonia has the major effect on the maximum flame speed. NO emission increased with increasing equivalence ratio.
In [4], an experiment was reported in a dual-fuel engine with diesel being injected along with ammonia to ignite the mixture. Since the stoichiometric air–fuel ratio of ammonia is more than half that of diesel, additional ammonia can be introduced in the combustion cylinder to compensate for its lower energy density [7]. The results indicated that a minimum amount of diesel was needed in order to run the engine with the same output. The amount of NO released decreased with the increase in ammonia. This happened because the cylinder temperature decreased with higher ammonia content, due to the low flame temperature of ammonia [4,8]. For the same reason, the amount of unburnt hydrocarbons (UHC) increased due to incomplete combustion of diesel [8], except for low diesel ratios [4]. Carbon dioxide emission dropped drastically without any effect on the output power of the engine when 40% to 60% of the power delivered to the engine was replaced by ammonia. By substituting only 3% of intake air with the gaseous fuel, 10% less diesel was used, which significantly reduced the CO emissions [8]. “Dissociated" ammonia, i.e., ammonia mixed with hydrogen derived from its catalytic processing, was shown to have reduced ammonia and NOx emissions compared to pure ammonia [8]. In [11], CI engine operation with a mixture of ammonia with dimethyl ether (DME) was studied and it was shown that ammonia addition limited the operation range. This was explained by the high latent heat of ammonia and lower heating value that caused the cylinder temperature to drop by nearly 100 °C.
Li et al. [12] numerically studied ammonia laminar burning velocity at various contents of hydrogen using CHEMKIN [13]. The study also looked into the ignition delay using a homogeneous charge compression ignition model of CHEMKIN with realistic engine conditions. The simulation results proved that ammonia burning velocity increased with the mole fraction of blended hydrogen. This enhancement was caused by chemical and transport effects [12]. Using CHEMKIN, the same author studied the effect of oxygen enrichment on the combustion characteristics of ammonia [14]. As of the short-lived H, O, and OH radicals, they tended to increase with oxygen-enriched combustion [12,14]. HNO, which is a significant predecessor for NO formation, also increased at lean conditions, which lead to the increase in NO. At rich conditions, NH, NH, and N radicals reduced the reaction rate of NO decreasing its mole fraction [14].
All this rich phenomenology points to the need for a rigorous exploration of the pertinent chemical dynamics that seems to be mostly missing. A notable exception is Ref. [15], where the autoignition of NH/H/O mixtures were studied and branching reactions were identified, to which the results were most sensitive. Several experimental studies point to the crucial importance of additives, which have so far been determined empirically, rather than algorithmically. Of particular importance is also the relatively slow dynamics that determines NO formation. In this work we have performed a novel study of the autoignition dynamics of NH/air mixture using the method of Computational Singular Perturbation (CSP). The focus is on the determination of the reactions that contribute significantly to the generation of the time scale that characterizes ignition at engine relevant conditions and on the algorithmic determination of an additive that would reduce ignition delay, possibly without increasing NO emissions.
1. The CSP Methodology
The homogeneous adiabatic autoignition of ammonia/air mixtures at constant volume are considered here. A chemical kinetics mechanism consisting of N = 34 species, E = 5 elements (H, N, O, Ar, and He), and K = 229 elementary reactions was employed. This mechanism was constructed by removing all carbon chemistry from the Aramco 2.0 mechanism [16,17] and by adding NH-chemistry [18]. In what follows, for the K elementary reactions, each direction will be considered as a distinct unidirectional reaction. The system of the species mass fractions and temperature governing equations may be considered as of the form:
where is the state column vector of the species mass fraction of dimension N, is the density of the mixture, T is the temperature, is the heat capacity, R is the universal gas constant, is an diagonal matrix with the species molecular weights, is the N-dimensional vector of the species absolute enthalpies and [19,20]. Furthermore, denotes the stoichiometric vector and the reaction rate of the k-th unidirectional reaction.
The species and energy governing Equations (1) and (2) can be considered as a ()-dimensional system of the form:
where is a -dim. vector that consists of the vector of the species mass fractions and the temperature T, while is the -dim. column vector field. Since the chemical source term represents K reversible reactions, whose two directions are treated separately, then:
where is the generalized stoichiometric vector [21,22].
Equation (3) can be further cast into a new from by resolving the vector field along the CSP basis vectors, so that:
where the -dimensional column vector is the CSP basis vector of the n-th mode and is the -dimensional row n-th dual basis vector () [23,24,25]; is the related amplitude and is always considered positive, by appropriate altering the sign of (and of in order to preserve orthogonality). Each CSP mode, say the n-th (), in Equation (5) is characterized by
- its time scale, , which provides a measure of the time frame of its action
- its amplitude, , which provides a measure of its contribution to the evolution of the system
- the variables that pertain to this mode.
When the M fastest time scales in the dynamics of the system in Equation (5) are of dissipative character and much faster than the rest (), the system can be reduced to the following two relations:
The first relation is an M-dim. system of algebraic equations, which defines an -dim. surface in the -dim. tangent space. This surface approximates the slow invariant manifold (SIM). On this surface, the solution evolves. The second relation in Equation (6) is an -dim. system of ordinary differential equations that describes the way the slow system evolves along the SIM. This system does not contain fast time scales and its dynamics is characterized by the slow ones. These approximations are valid in the case when the trajectory is not close to the edges of the SIM [26,27].
The fastest time scales in chemical processes originate from chemical kinetics [21,28,29,30,31,32,33,34]. These time scales are approximated by the relation (), where is the n-th nonzero eigenvalue of the Jacobian of the vector field in Equation (3). A positive (negative) real part of is generated by components of the vector field that tend to drive the system away from (towards) equilibrium and, thus, is called explosive (dissipative). Denoting the n-th right (column) and left (row) eigenvectors of as and , the respective eigenvalue is defined as . If the n-th eigenvalue is real and nonzero (for complex pairs see [35]), then it can be expressed as a summation of 2K terms:
where and according to Equation (4), [22,36]. From the expression in Equation (7) the Time scale Participation Index (TPI) can be introduced as:
where , [36]. provides a measure of the relative contribution of the k-reaction to the eigenvalue and, therefore, to the time scale . Positive indicates that the k-th reaction reinforces the explosive character of . On the other hand, negative indicates that the k-th reaction reinforces the dissipative character of . The use of TPI has been already used in a large number of reacting flow, biological and pharmacokinetics problems in order to identify the driving processes [22,33,34,35,36,37,38,39,40,41,42,43,44,45,46,47,47].
Given the expression the chemical kinetics term in Equation (4), the amplitude of the n-th CSP mode (, defined in Equation (5), can be expressed as the sum of additive terms:
where (k = 1,2K) is the relative contribution of the k-th reaction to the amplitude . The amplitudes to equal zero, due to the conservation of the E elements. The relative contribution of each reaction to the amplitude can be evaluated by the Amplitude Participation Index (API):
where and [21,22,24,33,48,49,50,51]. Since by definition , positive (negative) values of indicate a contribution of the k-th process towards strengthening (weakening) the impact of the n-th mode. In the case of an exhausted mode (m = 1,M) (see Equation (6)), . Therefore, a relatively large value of indicates a large contribution from the k-th process to (i) the cancellations between the various terms in the expression in Equation (9) and (ii) the m-th component of the SIM, the development of which is characterized by the m-th fast time scale, .
The variables that relate the most to the m-th fast time scale are identified by the CSP Pointer (Po) for the m-th mode:
where due to orthogonality , () [21,24,48]. A large value of () denotes a strong relationship between the j-th variable and the m-th CSP mode and the related fast time scale .
2. Autoignition of Ammonia
The dynamics of homogeneous adiabatic autoignition of a lean NH/air mixture at constant volume was analyzed for the initial conditions of T = 800 K, p = 20 atm, and a stoichiometric ratio of = 0.7. This is the reference case and will be analyzed first. For future reference, the reactions influencing the most the dynamics of the system in Equation (3) are summarized in Table 1.

Table 1.
The reactions most significant to the dynamics of the autoignition process.
Unlike hydrocarbon fuels, where ignition takes place in few milliseconds, the ignition delay time, which is defined as the period from t = 0 to the point in time where temperature gradient is maximum, was calculated to be t 2.4 s, indicating that ammonia has high resistance to ignition and a long ignition delay. As a result, it is difficult to time ammonia ignition realistically, making the operation of the engine practically impossible.
The evolution of the developing dissipative (grey) and explosive (red) time scales is depicted in Figure 1, along with the profile of the temperature (blue). The time scales of the system extend over a wide range of values, varying from 10 to 10 s. Among them, two explosive time scales exist throughout the process, one fast and one slow, which are denoted as as and , respectively. These two time scales are present until shortly before the end of the steep temperature rise. This point marks the completion of the ignition delay. The period extending from t = 0 to the point where the two explosive time scales meet is known as the explosive stage [22,41]. Throughout this period, the fast explosive timescale characterizes the prevailing dynamics [22], since it is much faster than the slow one.
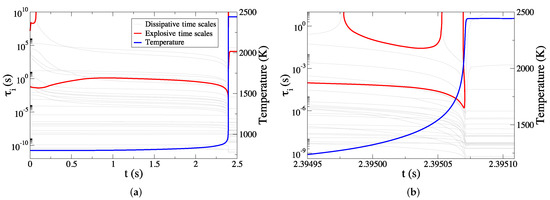
Figure 1.
The developing dissipative (grey) and explosive (red) time scales for the case of pure NH/air autoignition, overlaid with the evolution of temperature (blue): (a) the full explosive stage, (b) the final part of the explosive stage.
Figure 1 indicates that initially decelerates until ∼0.75 s and then accelerates slowly until ∼2.3 s, when the temperature starts to increase much faster than previously. Furthermore, it is illustrated that the period, in which undergoes a slow acceleration and its magnitude does not vary much, occupies the largest portion of the explosive stage. After ∼2.3 s, starts a rapid acceleration until it reaches its minimum value. From that point, decelerates rapidly until it meets the slow time scale , which is also rapidly accelerating; they both disappear when they meet. Note that the point where the two time scales meet is right before the point where the temperature completes its steep increase. This feature appears also in the autoignition of H/air, CH/air, n-hexane/air, n-heptane/air, DME/air, and ethanol/air mixtures [22,34,37,38,41,43,44,46,52,53,54,55,56].
In order to get insight of the dynamics that influences the autoignition process and is responsible for the long ignition delay, a set of diagnostics was obtained in five indicative points throughout the process along the explosive stage. The points are depicted in Figure 2 and are indicative of significant features the . Point P was chosen to represent the early period, where exhibits a deceleration. Point P was chosen in the second period, where the magnitude of the slowly accelerating does not change significantly. Finally, points P to P where chosen in the final period, where exhibits a steep acceleration and, in particular, P was chosen as the point where obtains its minimum value. The reactions that either support or oppose (i) the explosive action and (ii) the impact of the explosive mode are identified by the CSP Timescale Participation Index (TPI) and Amplitude Participation Index (API) and are displayed in Table 2. This Table reports also values of the Pointer (Po), which identifies the variables that affect the explosive mode the most. Only the largest contributions (larger than 5%) are included in the Table.
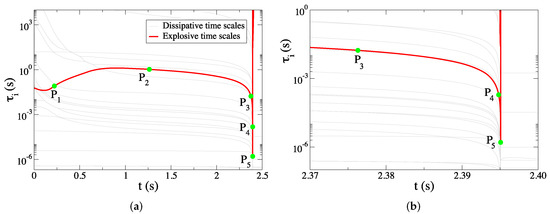
Figure 2.
The five selected points in time where the diagnostics were obtained: (a) the full explosive stage, (b) the final part of the explosive stage.
Table 2.
The largest TPI, API and Po for the fast explosive mode of the pure NH autoignition for the five points under consideration (see Figure 2); numbers in parenthesis denote powers of ten. Only contributions larger than 5% are displayed.
According to Table 2, at the start of the process, the chain initiating reaction 18f: HO (+M) → OH + OH (+M) is the largest contributor to the and it is the one that sets the time frame of action of the explosive mode. Furthermore, reactions 110f: NH + NH→ NH + H and 71f: NH + HO→ HNO + OH are shown to contribute to a lesser degree to and, along with reaction 18f support its explosive character. The largest opposition to comes from the chain terminating reaction 64f: NH + NO → N + HO. According to API, the same set of reactions are found to provide the largest contribution to the amplitude of the explosive mode. This implies that the reactions which support (oppose) the explosive character of the explosive mode tend to increase (decrease) its impact.
As the process evolves in the period where exhibits a mild acceleration, reaction 156b: NH + OH ← NH + HNO, which initially had a smaller relative contribution, becomes the dominant contributor to both the timescale and amplitude of the mode, while the relative contribution of reaction 18f decreases slightly. These are the reactions that provide the system with OH radicals, thus contributing to the most reactive component of the radical pool, which is needed in the final part of the explosive stage [41]. The main opposition to now originates from reaction 208f: HNO + NH→ HNO + NH, which converts NH back to NH by depleting the reactant of 156b that promotes ignition. Throughout the slow acceleration of (up to P), the reactions that influence the explosive dynamics remain the same; i.e., 18f and 156b being the major supporters of the explosive mode and 208f being the major opponent. Furthermore, reaction 70b: NH + HO← NH + HO appears to become an important contributor opposing both the explosive character of and the magnitude of its amplitude f. This reaction is competing with reaction 18f that promotes ignition for the consumption of HO, which is shown by the CSP pointer to be the most important species in this period of the autoignition process. While 18f uses HO in order to produce OH that contributes to the radical pool, 70b converts it to the relatively long-lived HO and NH.
Towards the end of the explosive stage, during the steep acceleration of , hydrogen-related reactions become important. The major relative contribution to becomes the chain branching reaction 5f: O + H → O + OH, which is strongly exothermic and continues the OH radical production. Reactions 63f and 64f are found to contribute substantially at P, however they compete with each other. Reaction 63f produces the radicals NNH and OH (thus promoting ignition), while reaction 64f produces the stable molecules N and HO (thus opposing ignition). As a result of this competition, the relative contribution of reaction 3f: H + OH → H + HO becomes dominant. This reaction is strongly exothermic, thus promoting the explosive character of and its impact by increasing .
The CSP Pointer (Po) identified HO, which is a reactant of the ignition promoting reactions 18f and 156b, to be most related species to the explosive mode throught the explosive stage, except close to its end, where the steep rise of temperature and steep acceleration of are manifested. After t = ∼0.75 s, temperature is identified by Po to be the variable mostly related to the explosive dynamics. The stage where temperature is not strongly pointed by CSP is defined as the chemical runaway and emerges in the initial portion of the explosive stage [22,29,42]. On the other hand, when the temperature is pointed strongly, then the system undergoes the thermal runaway, which usually develops in the last part of the explosive stage [22,29,42]. In previous studies relating to the autoignition of H/air, CH/air, n-hexane/air, n-heptane/air, DME/air, and ethanol/air mixtures, it was shown that chemical runaway regime practically occupies all the explosive stage, while the thermal runaway regime only appears at the very final portion of the explosive stage [22,34,37,38,41,43,44,46,52,53,54,55,56]. The results diaplayed in Table 2 suggest that autoignition of ammonia is qualitatively different than this of hydrocarbons in that the chemical runaway process is very short and the process develops as a thermal explosion.
The use of CSP Pointer, as an indicator of probable additives in the starting fuel/air mixture from the set of intermediate species, has been successfully employed in previous works [42,43,45,57]. This tool was shown most successful when employed during the chemical runaway regime, where the explosive activity is chemically driven. The results in Table 2 indicate that HO is pointed throughout the largest part of the explosive stage, which means that is strongly related to . Furthermore, the reaction that affects the most is reaction 18f: HO (+M) → OH + OH (+M), which consumes HO. Therefore, the addition of HO to the initial mixture, is expected to reinforce the action of the explosive mode. This issue will be explored in the sections that follow.
3. The Addition of HO
Figure 3 depicts the temperature profiles for the reference case of pure ammonia and all cases of HO addition that were considered. HO addition has a drastic effect on the ignition delay time. In particular, with just 2% molar addition of HO to the fuel, the ignition delay drops significantly by a factor of about 30; i.e., from 2.395 s to 8.375 × 10 s. When increasing HO further to 10%, there appears to be an even more significant ignition delay reduction (by a factor of 248) compared to the reference case. This is very important, since only tenth of HO in the initial mixture can cause a reduction of more than two orders of the time needed for ignition in CI engines. Furthermore, by increasing HO concentration further up to 30% the ignition delay time is decreased by a factor more than 600 compared to the reference case.
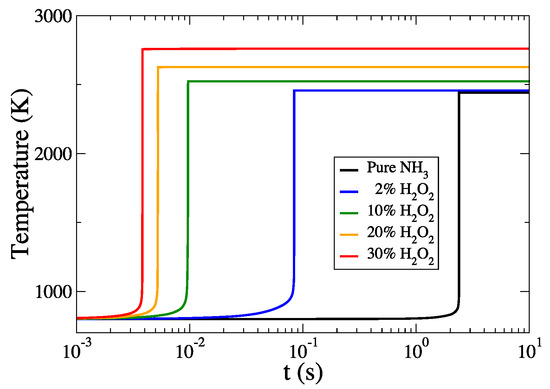
Figure 3.
The evolution of temperature profiles for all cases considered.
Additionally, Figure 3 illustrates a final temperature increase with increasing HO concentration in the initial mixture. More precisely, it appears to be an almost linear dependence of final temperature with the percentage of HO addition; i.e., with each 1% of additional HO content there is an increase in final temperature of approximately 0.3%. These results are displayed in detail on Table 3, where the values of the ignition delay times and final temperatures for all cases considered are presented.
Table 3.
Absolute and relative change of ignition delay times and final temperatures for all cases considered; numbers in parenthesis denote power of ten.
Although the difference in final temperature is not as pronounced as the difference in the ignition delay times, the effect of the increasing final temperature changes the dynamics of the process leading to increased NO species concentration. Figure 4, Figure 5 and Figure 6 display the evolution of selected species of nitrogen chemistry against time (scaled to ignition delay), for all cases considered.
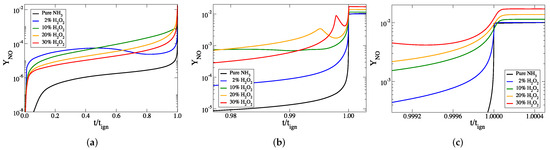
Figure 4.
The temporal evolution of the mass fraction of NO against scaled time, for all cases considered: (a) the full explosive stage, (b) the final part of the explosive stage and (c) at ignition. The mass fraction of NO in the final products can be seen most clearly in panel (c).
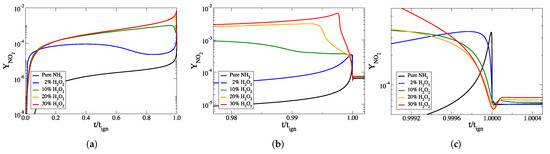
Figure 5.
The temporal evolution of the mass fraction of NO against scaled time, for all cases considered: (a) the full explosive stage, (b) the final part of the explosive stage and (c) at ignition. The mass fraction of NO in the final products can be seen most clearly in panel (c).
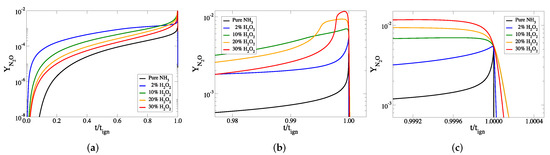
Figure 6.
The temporal evolution of the mass fraction of NO against scaled time, for all cases considered: (a) the full explosive stage, (b) the final part of the explosive stage and (c) at ignition.
Figure 4 shows that for all cases considered the addition of HO results in larger mass fractions of NO throughout the ignition process in comparison to the reference case. The final mass fraction of NO increases monotonically with HO content in the initial mixture. In particular, for the cases of 0%, 2%, 10%, 20%, and 30% of HO in the initial mixture the final NO mass fractions are 0.0103, 0.0105, 0.0115, 0.0128, and 0.0144, respectively. Considering the 2% case, it is noted that a 96.50% reduction of ignition delay is achieved with only 2% increase in NO mass fraction.
Figure 5 and Figure 6 indicate that the mass fractions of NO and NO increase when HO is added to the initial mixture. The final mass fractions of these two species are much smaller than those of NO, for all cases considered.
In order to study the dynamics of HO addition, the case of 20% HO addition was further analyzed by examining the developing explosive time scales and by comparing them to those of the reference case. As shown in Figure 7, the fast explosive timescale, which is the one characterizing the evolution of the ignition process, is much faster in the case of 20% HO addition, almost by three orders of magnitude. This indicates that the process in the case of 20% HO addition is faster than the reference one by the same order, confirming the results of Table 3.
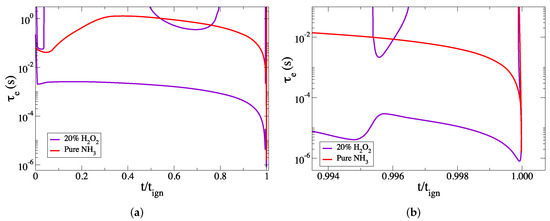
Figure 7.
The developing explosive time scales of the cases of 20% HO addition (purple), compared to the ones of the case of pure ammonia (red), versus the scaled time: (a) the full explosive stage, (b) the final part of the explosive stage.
Figure 7a indicates that, compared to the reference case (red), the profile of in the case of HO addition (purple), does not exhibit any significant deceleration, and remains approximately steady during most of the explosive stage. Close to the end, the process accelerates and a transition to hydrogen chemistry is expected, similarly to the reference case. However, at around 99.5% of the process, there appears to be a sudden and short deceleration of , as shown in Figure 7b, of about one order in magnitude. Inspection of Figure 4, Figure 5 and Figure 6 indicates that in this period there are significant changes in the species profiles of NOx. However, soon, regains its fast acceleration towards the end of the explosive stage.
4. Conclusions
Pure ammonia demonstrates unrealistically long ignition delays that make its application as a fuel impractical. CSP analysis of the isochoric and adiabatic ignition of an ammonia–air mixture with an equivalence ratio of 0.7 showed that the reaction chain initiating reaction 18f: HO (+M) → OH + OH (+M) is related for the most of the process to the explosive mode, supporting its explosive action. Throughout the most part of the explosive stage, this reaction competes with the ammonia dissociation reaction 156b: NH + OH ← NH + HNO for the production of OH radical, building the radical pool needed in the final part of the explosive stage. The action of this reaction is reinforced by that of the ammonia dissociation reaction NH + OH ← NH + HN, which along with 18f produces OH radicals. The major opposition to the ignition arises from the chain terminating reaction 208f HNO + NH→ HNO+NH.
The variable related to the explosive mode for the largest portion of the explosive stage was the temperature. This indicates that, contrary to hydrocarbons, ammonia demonstrates a brief chemical runaway and a long thermal one.
HO was the species pointed the largest portion of the explosive stage. Therefore, this species was selected as an additive in order to shorten ignition delay. It was demonstrated that even a small addition of HO (e.g., 2%) could decrease the ignition delay by as much as factor of 30. This came with a relatively small increase in NO emissions by just 2%. These results show that HO addition can drastically decrease ammonia ignition delay without increasing NO emissions substantially. Practical application of HO addition will only be possible if the issues are addressed that relate to the corrosive action and the stability of this molecule, which tends to dissociate to HO and O after long term storage.
The mechanism by which HO accelerates the process will be studied in a future work using CSP, by considering different NH/HO mixtures at various initial temperatures and pressures.
Author Contributions
Conceptualization, D.A.G. and D.C.K.; methodology, D.A.G.; software, D.A.G., D.M.M. and E.-A.T.; validation, D.M.M.; formal analysis, D.A.G.; investigation, A.T.K. and D.M.M. and A.T.K.; data curation, D.M.M. and E.-A.T.; writing–original draft preparation, D.M.M. and A.T.K.; writing–review and editing, D.C.K. and D.M.M. and A.T.K. and D.A.G.; visualization, D.M.M. and A.T.K.; supervision, D.C.K. and D.A.G.; project administration, D.C.K. and D.A.G.; funding acquisition, D.C.K. and D.A.G.
Funding
This research was funded by Khalifa University of Science and Technology: RC2-2019-007.
Acknowledgments
We acknowledge support for this work from Khalifa University of Science and Technology under project RC2-2019-007.
Conflicts of Interest
The authors declare no conflict of interest.
Abbreviations
The following abbreviations are used in this manuscript:
| CSP | Computational Singular Perturbation |
| IC | Internal Combustion |
| CI | Compression Ignition |
| SI | Spark Ignition |
| UHC | Unburnt Hydrocarbons |
| SIM | Slow Invariant Manifold |
| DME | Di-Methyl Ether |
| TPI | Timescale Participation Index |
| API | Amplitude Participation Index |
References
- Ryu, K.; Zacharakis-Jutz, G.E.; Kong, S.C. Effects of gaseous ammonia direct injection on performance characteristics of a spark-ignition engine. Appl. Energy 2014, 116, 206–215. [Google Scholar] [CrossRef]
- Zamfirescu, C.; Dincer, I. Ammonia as a green fuel and hydrogen source for vehicular applications. Fuel Process. Technol. 2009, 90, 729–737. [Google Scholar] [CrossRef]
- Frigo, S.; Gentili, R. Analysis of the behaviour of a 4-stroke SI engine fuelled with ammonia and hydrogen. Int. J. Hydrog. Energy 2013, 38, 1607–1615. [Google Scholar] [CrossRef]
- Reiter, A.J.; Kong, S.C. Demonstration of compression-ignition engine combustion using ammonia in reducing greenhouse gas emissions. Energy Fuels 2008, 22, 2963–2971. [Google Scholar] [CrossRef]
- Kroch, E. Ammonia, A Fuel for Motor Buses. J. Inst. Pet 1945, 31, 213–223. [Google Scholar]
- Duynslaegher, C.; Jeanmart, H.; Vandooren, J. Ammonia combustion at elevated pressure and temperature conditions. Fuel 2010, 89, 3540–3545. [Google Scholar] [CrossRef]
- Reiter, A.J.; Kong, S.C. Combustion and emissions characteristics of compression-ignition engine using dual ammonia-diesel fuel. Fuel 2011, 90, 87–97. [Google Scholar] [CrossRef]
- Gill, S.; Chatha, G.; Tsolakis, A.; Golunski, S.; York, A. Assessing the effects of partially decarbonising a diesel engine by co-fuelling with dissociated ammonia. Int. J. Hydrogen Energy 2012, 37, 6074–6083. [Google Scholar] [CrossRef]
- Saika, T.; Nakamura, M.; Nohara, T.; Ishimatsu, S. Study of hydrogen supply system with ammonia fuel. JSME Int. J. Ser. B Fluids Therm. Eng. 2006, 49, 78–83. [Google Scholar] [CrossRef]
- Li, J.; Huang, H.; Kobayashi, N.; He, Z.; Nagai, Y. Study on using hydrogen and ammonia as fuels: Combustion characteristics and NOx formation. Int. J. Energy Res. 2014, 38, 1214–1223. [Google Scholar] [CrossRef]
- Gross, C.W.; Kong, S.C. Performance characteristics of a compression-ignition engine using direct-injection ammonia–DME mixtures. Fuel 2013, 103, 1069–1079. [Google Scholar] [CrossRef]
- Li, J.; Huang, H.; Kobayashi, N.; Wang, C.; Yuan, H. Numerical study on laminar burning velocity and ignition delay time of ammonia flame with hydrogen addition. Energy 2017, 126, 796–809. [Google Scholar] [CrossRef]
- Kee, R.J.; Miller, J.A.; Jefferson, T.H. CHEMKIN: A General-Purpose, Problem-Independent, Transportable, FORTRAN Chemical Kinetics Code Package; Sandia Laboratories: Albuquerque, NM, USA, 1980. [Google Scholar]
- Li, J.; Huang, H.; Kobayashi, N.; He, Z.; Osaka, Y.; Zeng, T. Numerical study on effect of oxygen content in combustion air on ammonia combustion. Energy 2015, 93, 2053–2068. [Google Scholar] [CrossRef]
- He, X.; Shu, B.; Nascimento, D.; Moshammer, K.; Costa, M.; Fernandes, R. Auto-ignition kinetics of ammonia and ammonia/hydrogen mixtures at intermediate temperatures and high pressures. Combust. Flame 2019, 206, 189–200. [Google Scholar] [CrossRef]
- Li, Y.; Zhou, C.W.; Somers, K.P.; Zhang, K.; Curran, H.J. The oxidation of 2-butene: A high pressure ignition delay, kinetic modeling study and reactivity comparison with isobutene and 1-butene. Proc. Combust. Inst. 2017, 36, 403–411. [Google Scholar] [CrossRef]
- Burke, U.; Metcalfe, W.K.; Burke, S.M.; Heufer, K.A.; Dagaut, P.; Curran, H.J. A detailed chemical kinetic modeling, ignition delay time and jet-stirred reactor study of methanol oxidation. Combust. Flame 2016, 165, 125–136. [Google Scholar] [CrossRef]
- Nakamura, H.; Hasegawa, S.; Tezuka, T. Kinetic modeling of ammonia/air weak flames in a micro flow reactor with a controlled temperature profile. Combust. Flame 2017, 185, 16–27. [Google Scholar] [CrossRef]
- Williams, F.A. Combustion Theory; The Benjamin/Cummings Publ. Co.: Menlo Park, CA, USA, 1985. [Google Scholar]
- Law, C.K. Combustion Physics; Cambridge University Press: New York, NY, USA, 2006. [Google Scholar]
- Valorani, M.; Najm, H.N.; Goussis, D.A. CSP analysis of a transient flame-vortex interaction: Time scales and manifolds. Combust. Flame 2003, 134, 35–53. [Google Scholar] [CrossRef]
- Diamantis, D.J.; Mastorakos, E.; Goussis, D.A. H2/air Autoignition: The Nature and Interaction of the Developing Explosive Modes. Combust. Theor. Model. 2015, 19, 382–433. [Google Scholar] [CrossRef]
- Lam, S.H.; Goussis, D.A. Understanding complex chemical kinetics with Computational Singular Perturbation. Proc. Combust. Inst. 1989, 22, 931–941. [Google Scholar] [CrossRef]
- Lam, S.H.; Goussis, D.A. CSP method for simplifying kinetics. Int. J. Chem. Kinet. 1994, 26, 461–486. [Google Scholar] [CrossRef]
- Hadjinicolaou, M.; Goussis, D.A. Asymptotic solution of stiff PDEs with the CSP method: The reaction diffusion equation. SIAM J. Sci. Comput. 1998, 20, 781–810. [Google Scholar] [CrossRef]
- Goussis, D.A. The role of slow system dynamics in predicting the degeneracy of slow invariant manifolds: The case of vdP relaxation-oscillations. Physica D 2013, 248, 16–32. [Google Scholar] [CrossRef]
- Maris, D.T.; Goussis, D.A. The “hidden” dynamics of the Rössler attractor. Physica D 2015, 295–296, 66–90. [Google Scholar] [CrossRef]
- Najm, H.N.; Ponganis, D.; Prager, J. Analysis of NO structure in a methane-air edge flame. Proc. Combust. Inst. 2009, 32, 1117–1124. [Google Scholar] [CrossRef]
- Lu, T.; Yoo, C.; Chen, J.; Law, C.K. Three-dimensional direct numerical simulation of a turbulent lifted hydrogen jet flame in heated coflow: A chemical explosive mode analysis. J. Fluid Mech. 2010, 652, 45–64. [Google Scholar] [CrossRef]
- Goussis, D.A.; Valorani, M.; Creta, F.; Najm, H.N. Reactive and reactive-diffusive time scales in stiff reaction-diffusion systems. Prog. Comput. Fluid Dy. 2005, 5, 316–326. [Google Scholar] [CrossRef]
- Luo, Z.; Yoo, C.S.; Richardson, E.S.; Chen, J.H.; Law, C.K.; Lu, T. Chemical explosive mode analysis for a turbulent lifted ethylene jet flame in highly-heated coflow. Combust. Flame 2012, 159, 265–274. [Google Scholar] [CrossRef]
- Shan, R.; Yoo, C.S.; Chen, J.H.; Lu, T. Computational diagnostics for n-heptane flames with chemical explosive mode analysis. Combust. Flame 2012, 159, 3119–3127. [Google Scholar] [CrossRef]
- Kooshkbaghi, M.; Frouzakis, C.E.; Boulouchos, K.; Karlin, I.V. n-Heptane/air combustion in perfectly stirred reactors: Dynamics, bifurcations and dominant reactions at critical conditions. Combust. Flame 2015, 162, 3166–3179. [Google Scholar] [CrossRef]
- Tingas, E.A.; Kyritsis, D.C.; Goussis, D.A. Autoignition dynamics of DME/air and EtOH/air homogeneous mixtures. Combust. Flame 2015, 162, 3263–3276. [Google Scholar] [CrossRef]
- Goussis, D.A.; Najm, H.N. Model reduction and physical understanding of slowly oscillating processes: The circadian cycle. Multiscale Model. Simul. 2006, 5, 1297–1332. [Google Scholar] [CrossRef]
- Goussis, D.A.; Skevis, G. Nitrogen chemistry controlling steps in methane-air premixed flames. In Computational Fluid and Solid Mechanics; Bathe, K.J., Ed.; Elsevier: Amsterdam, The Netherlands, 2005; pp. 650–653. [Google Scholar]
- Manias, D.M.; Diamantis, D.J.; Goussis, D.A. Algorithmic identification of the reactions related to the initial development of the time scale that characterizes CH 4/air autoignition. J. Energy Eng. 2014, 141, C4014015. [Google Scholar]
- Diamantis, D.; Kyritsis, D.; Goussis, D.A. Two stage ignition of n-heptane: Identifying the chemistry setting the explosive time scales. In Proceedings of the 2nd International Workshop on Model Reduction in Reacting Flows, Notre Dame, IN, USA, 30 March–1 April 2009; Univerity of Notre Dame: Notre Dame, IN, USA, 2009. [Google Scholar]
- Kourdis, P.D.; Palasantza, A.G.; Goussis, D.A. Algorithmic asymptotic analysis of the NF-kB signaling system. Comput. Math. Appl. 2013, 65, 1516–1534. [Google Scholar] [CrossRef]
- Shan, R.; Lu, T. A bifurcation analysis for limit flame phenomena of DME/air in perfectly stirred reactors. Combust. Flame 2014, 161, 1716–1723. [Google Scholar] [CrossRef]
- Diamantis, D.J.; Kyritsis, D.C.; Goussis, D.A. The reactions supporting or opposing the development of explosive modes: Auto-ignition of a homogeneous methane/air mixture. Proc. Combust. Inst. 2015, 35, 267–274. [Google Scholar] [CrossRef]
- Manias, D.M.; Tingas, E.A.; Frouzakis, C.E.; Boulouchos, K.; Goussis, D.A. The mechanism by which CH2O and H2O2 additives affect the autoignition of CH4/air mixtures. Combust. Flame 2016, 164, 111–125. [Google Scholar] [CrossRef]
- Tingas, E.A.; Kyritsis, D.C.; Goussis, D.A. Ignition delay control of DME/air and EtOH/air homogeneous autoignition with the use of various additives. Fuel 2016, 169, 15–24. [Google Scholar] [CrossRef]
- Tingas, E.A.; Kyritsis, D.C.; Goussis, D.A. Comparative investigation of homogeneous autoignition of DME/air and EtOH/air mixtures at low initial temperatures. Combust. Theory Model. 2017, 21, 93–119. [Google Scholar] [CrossRef]
- Tingas, E.A.; Kyritsis, D.C.; Goussis, D.A. Algorithmic determination of the mechanism through which H2O-dilution affects autoignition dynamics and NO formation in CH4/air mixtures. Fuel 2016, 183, 90–98. [Google Scholar] [CrossRef]
- Tingas, E.A.; Manias, D.M.; Sarathy, S.M.; Goussis, D.A. CH4/air homogeneous autoignition: A comparison of two chemical kinetics mechanisms. Fuel 2018, 223, 74–85. [Google Scholar] [CrossRef]
- Patsatzis, D.G.; Maris, D.T.; Goussis, D.A. Asymptotic analysis of a target-mediated drug disposition model: Algorithmic and traditional approaches. Bull. Math. Biol. 2016, 78, 1121–1161. [Google Scholar] [CrossRef] [PubMed]
- Goussis, D.A.; Lam, S.H. A study of homogeneous methanol oxidation kinetics using CSP. Proc. Combust. Inst. 1992, 24, 113–120. [Google Scholar] [CrossRef]
- Najm, H.N.; Valorani, M.; Goussis, D.A.; Prager, J. Analysis of methane-air edge flame structure. Combust. Theor. Model. 2010, 14, 257–294. [Google Scholar] [CrossRef]
- Prager, J.; Najm, H.N.; Valorani, M.; Goussis, D.A. Structure of n-heptane/air triple flames in partially-premixed mixing layers. Combust. Flame 2011, 158, 2128–2144. [Google Scholar] [CrossRef]
- Gupta, S.; Im, H.G.; Valorani, M. Classification of ignition regimes in HCCI combustion using computational singular perturbation. Proc. Combust. Inst. 2011, 33, 2991–2999. [Google Scholar] [CrossRef]
- Gupta, S.; Im, H.G.; Valorani, M. Analysis of n-heptane auto-ignition characteristics using computational singular perturbation. Proc. Combust. Inst. 2013, 34, 1125–1133. [Google Scholar] [CrossRef]
- Sarathy, S.M.; Tingas, E.A.; Nasir, E.F.; Detogni, A.; Wang, Z.; Farooq, A.; Im, H. Three-stage heat release in n-heptane auto-ignition. Proc. Combust. Inst. 2019, 37, 485–492. [Google Scholar] [CrossRef]
- Tingas, E.A.; Wang, Z.; Sarathy, S.M.; Im, H.G.; Goussis, D.A. Chemical kinetic insights into the ignition dynamics of n-hexane. Combust. Flame 2018, 188, 28–40. [Google Scholar] [CrossRef]
- Tingas, E.A.; Kyritsis, D.C.; Goussis, D.A. H2/Air Autoignition Dynamics around the Third Explosion Limit. J. Energ. Eng. 2018, 145, 04018074. [Google Scholar] [CrossRef]
- Manias, D.M.; Tingas, E.A.; Goussis, D.A. Algorithmic identification of the reactions that support or oppose the development of explosive modes in n-heptane/air autoignition. In Proceedings of the European Combustion Meeting, Budapest, Hungary, 30 March–2 April 2015. [Google Scholar]
- Tingas, E.A.; Im, H.G.; Kyritsis, D.C.; Goussis, D.A. The use of CO2 as an additive for ignition delay and pollutant control in CH4/air autoignition. Fuel 2018, 211, 898–905. [Google Scholar] [CrossRef]
© 2019 by the authors. Licensee MDPI, Basel, Switzerland. This article is an open access article distributed under the terms and conditions of the Creative Commons Attribution (CC BY) license (http://creativecommons.org/licenses/by/4.0/).