1. Introduction
The International Energy Agency (IEA) fixed the objective of reducing CO
2 emissions (related with energy generation) by 50% before 2050, compared to 2005 values [
1]. This challenge requires the development and implementation of renewable energy plants, CO
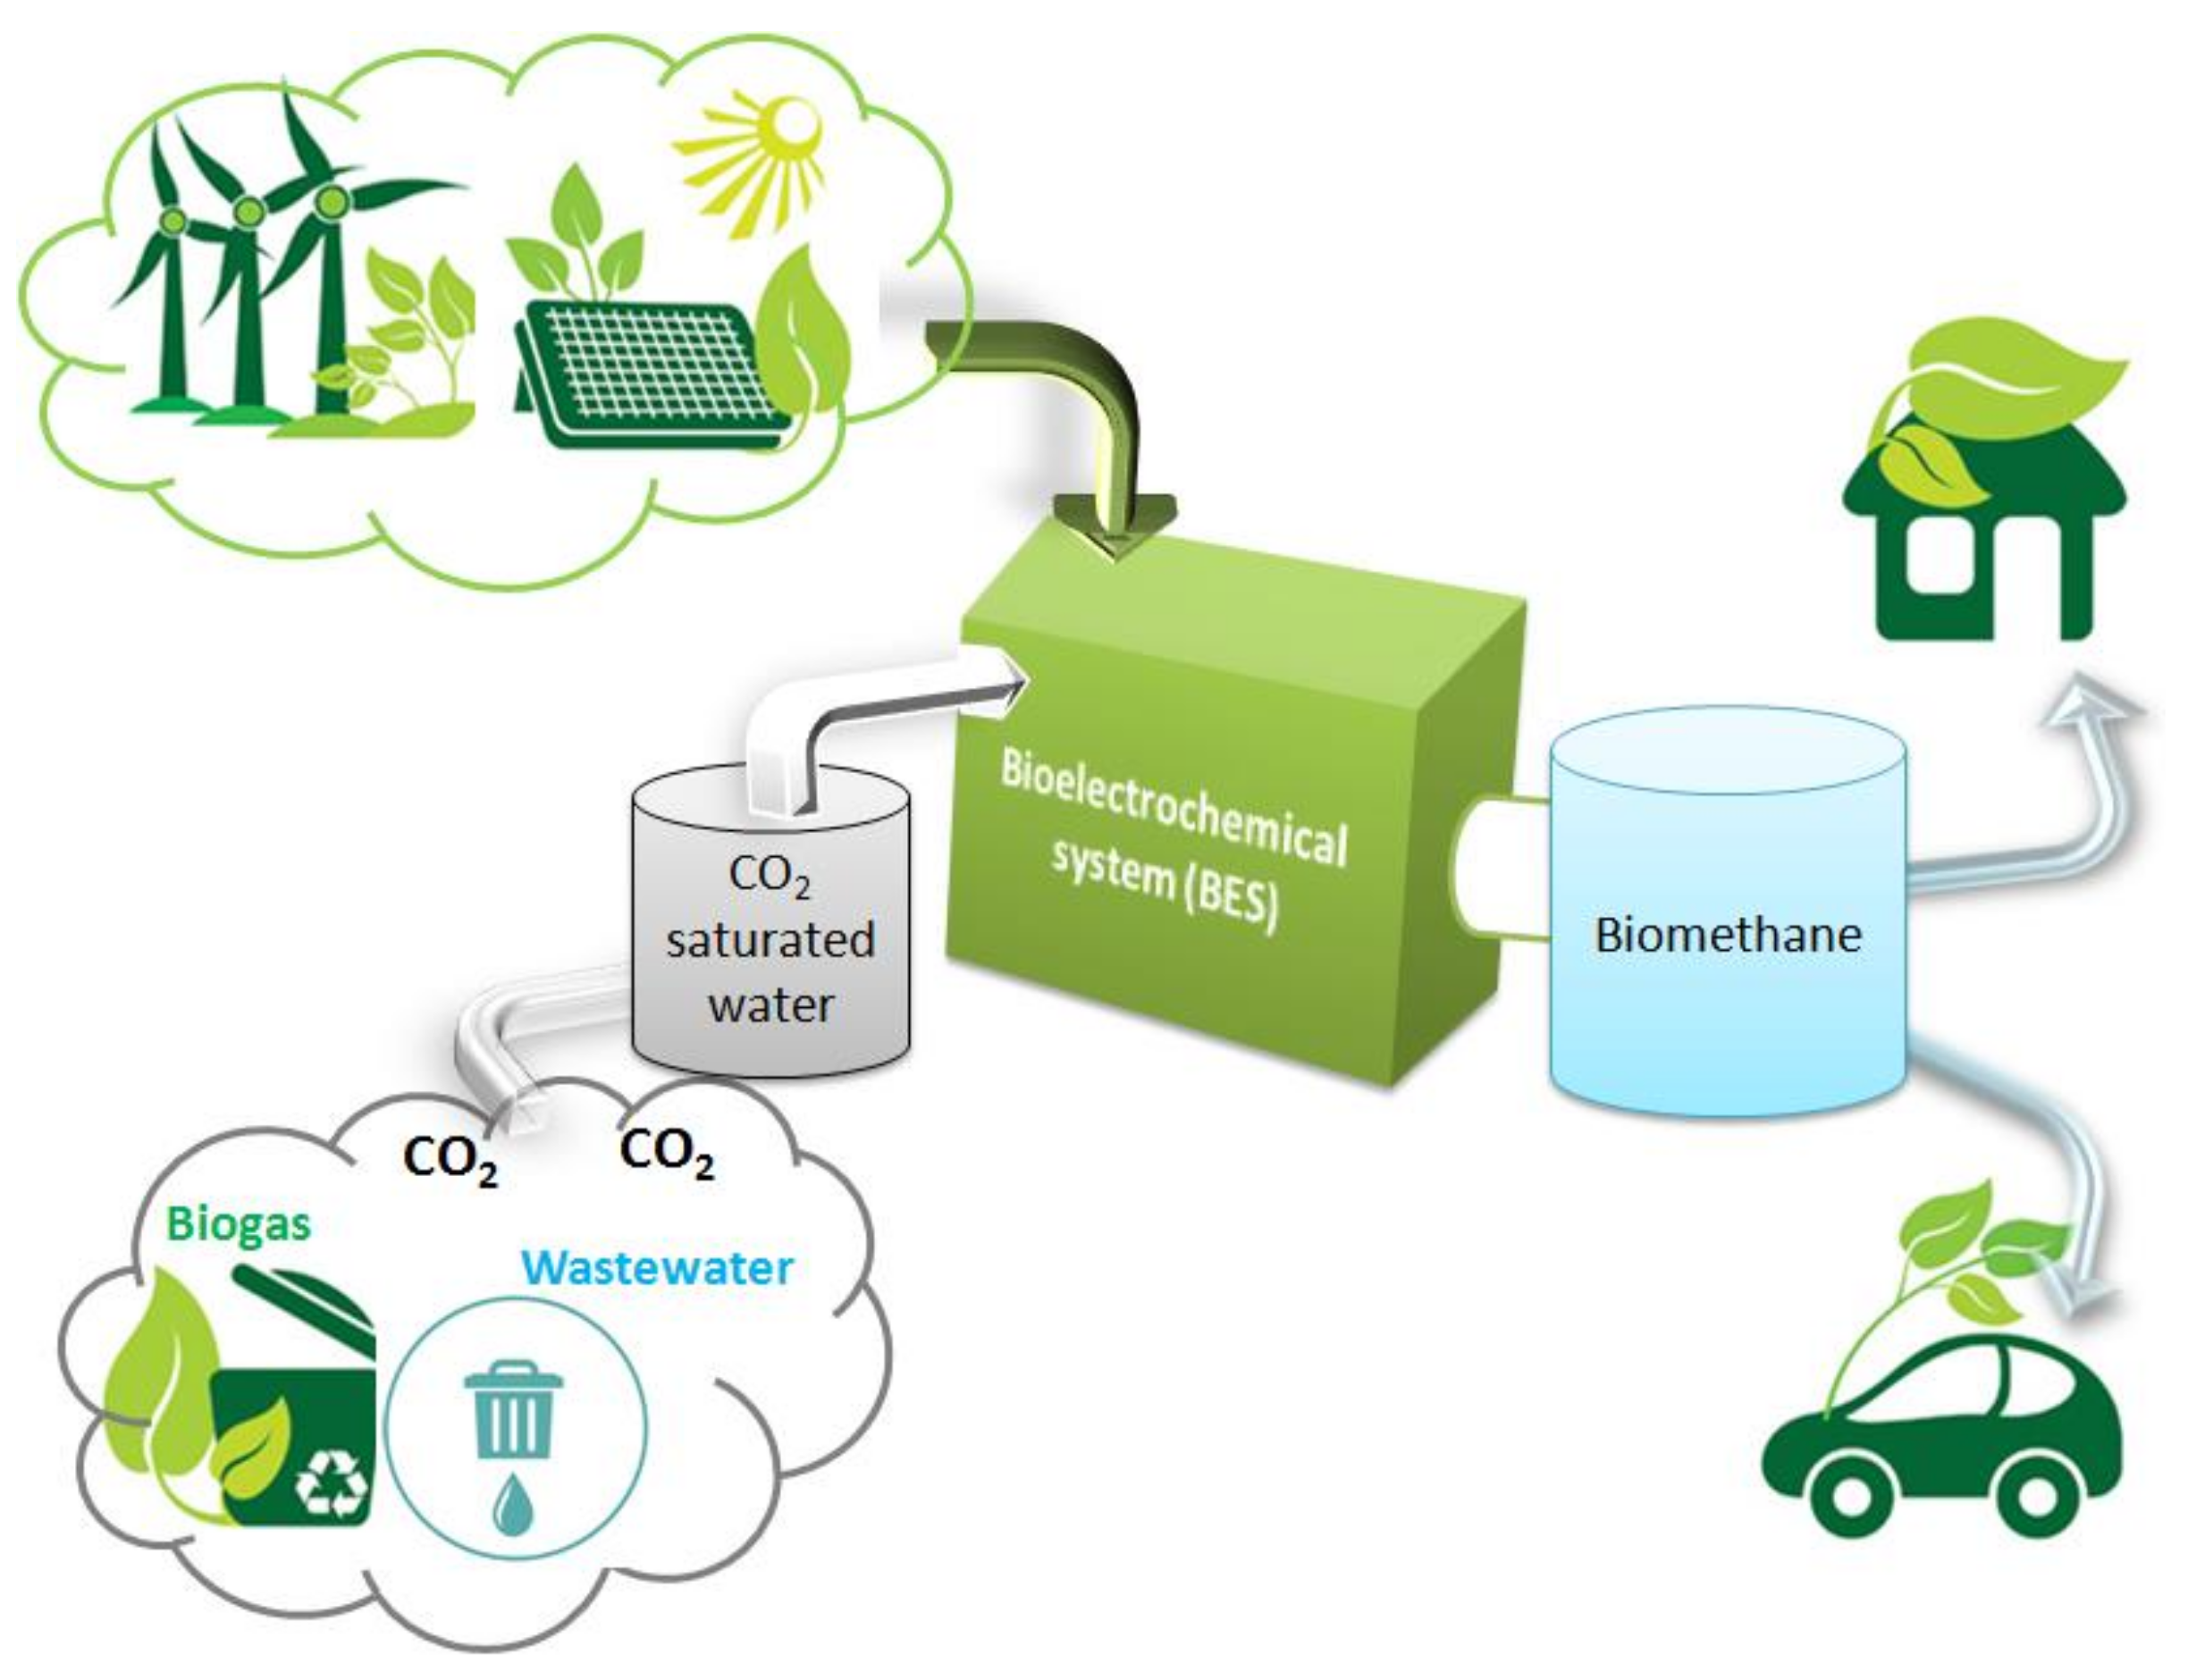
2 capture, and usage (CCU) technologies, and the production and use of biofuels. On the other hand, the extensive integration of renewables into the electrical system comes with the need of energy storage and backup systems, to secure continuity in the production and distribution of electricity. In the present study, an innovative power-to-gas technology, based on a bioelectrochemical system (BES), was developed for renewable energy surplus storage in the form of biomethane (
Figure 1).
The term biomethane defines a biogas rich in methane (>95%
v/
v), obtained from a biological source (like wastewater or sludge), that can be directly used as vehicle fuel or injected into the gas pipeline [
2]. The biomethane can be obtained from biogas by different upgrading systems, being water scrubbing the most common one.
The BES platform was first proposed by Cheng et al. in 2009 as a promising way to drive the reduction of CO
2 (dissolved into an aqueous medium) into biomethane [
3]. BES use electro-active bacteria to drive the conversion of the chemical energy contained in wastewater to electrical energy, or vice versa. In particular, microbial fuel cells (MFC) allow the direct recovery of electricity from wastewater treatment [
4]. Conversely, microbial electrolysis cells (MEC) produce hydrogen from wastewater treatment, but only when external energy is provided to the system [
5]. Similar systems can support the reductive generation of biomethane (or other added value chemicals) from CO
2, and are grouped under the name of microbial electrosynthesis (MES) [
6]. Among the latter, several trials of the so-called electromethanogenesis process were published since 2009 [
7,
8,
9,
10,
11]. The complete reaction is composed by two semi-reactions: organic matter oxidation at the anode and CO
2 reduction at the cathode. These can be obtained in both double-chamber (where anode and cathode are separated by an ionic exchange membrane) or single-chamber BES reactors. The former configuration allows to increase the Coulombic efficiency of the process (ratio of electrons recovered as methane, versus the amount provided as current) but at higher costs due to membrane presence, causing an increase of the internal resistance [
2]. The latter configuration, although less efficient, is cheaper to build and operate, and can be easily scaled-up [
9]. In both cases, electrical energy must be provided to the system to allow the reaction proceeding at a significant rate. Cathode potentials lower than −0.4 V vs. standard hydrogen electrode (SHE) were imposed in previous studies to reach significant rates of methane production [
12]. This means that a cell voltage between 0.7 and 1.25 V must be applied (between anode and cathode) to win thermodynamic losses of the process, being then able to store electrical energy in the form of biomethane.
This study was performed with 5 replicate single-chamber electromethanogenic reactors, powered at different voltage levels (0.7–0.9 V) and fed with CO2 saturated synthetic wastewater. These voltage values are still far from what is needed for an industrial exploitation of the technology for energy storage purposes. Here comes the need of process modeling, in order to simulate an energy storage system requiring 40 kW renewable power to operate.
Process modeling in BES field is still at its infancy. Since the mid-90 s, researchers have attempted to mechanically simulate the bioelectrochemical activity of BES, mainly focusing on anode biofilm activity [
13]. Applications of soft simulation methods such as genetic programming (GP), artificial intelligence (AI), fuzzy logic, and neural networks are sometimes used as an alternative to deterministic mathematical modeling of complex physical nonlinear systems. System identification approach was used for BES using autoregressive exogenous (ARX) and least-squares (LS) methods for MFCs [
14] and artificial neural networks for MECs [
15]. In this study, LS method was selected to model a BES system performing electromethanogenesis. Nevertheless, electromethanogenic process details are out of the scope of this paper, and a developed model is just the tool needed for the following electrical grid integration.
The paper objective is to show that BES-based power-to-gas energy storage is feasible on a large scale, showing a first approximation that goes from the BES design and operation to the electrical grid integration.
Figure 1 shows a scheme of the proposed solution: the BES system is represented in the center, absorbing electrical energy and CO
2 saturated wastewater to produce biomethane. It represents a promising technology for seasonal energy storage, complementary to other energy storage technologies as electrical batteries.
The BES system is presented in
Section 2 and modeled in
Section 3. On the upper left side of
Figure 1 the renewable energy generation is represented, which surplus is used to feed the BES system. This process is described in
Section 4 where the simulation of the energy storage through BES is carried out, by using the previously developed model and the renewable energy resource variability information. The interconnection between renewable energy plants and BES system is done through a power converter, which control is detailed in
Appendix C.
Section 5 shows the real time simulation and implementation of the BES fed by the power converter, absorbing the renewable energy surplus.
2. Bioelectrochemical System (BES) Design and Operation
2.1. Design and Operation
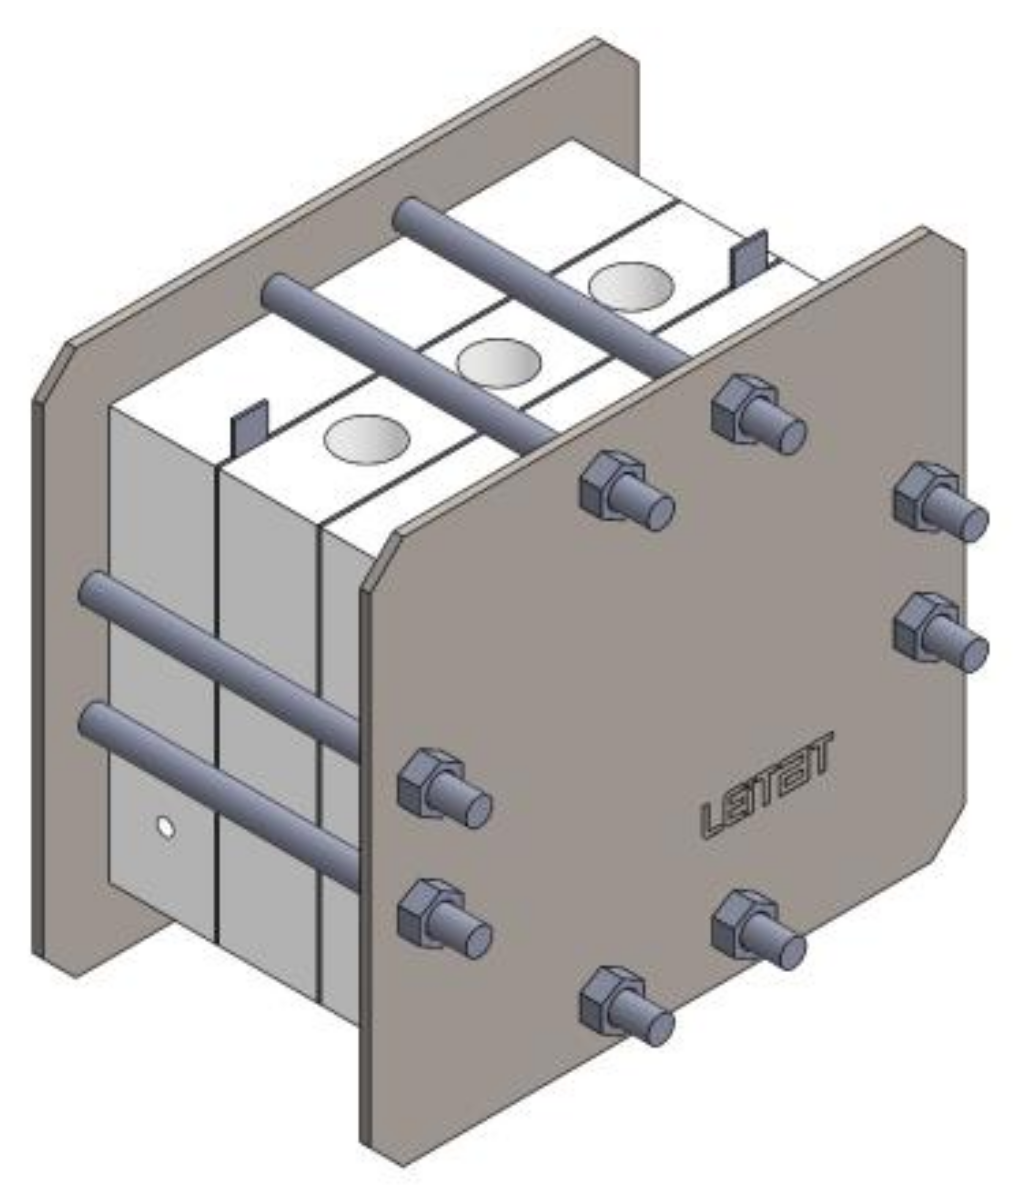
Designed BES reactors were originally conceived as single-chamber systems (
Figure 2). The net reactor volume (V) was 714 mL. The electrodes (170 cm
2 projected surface) were both made of carbon felt, thermally activated at 700 °C (SGL group, Munich, Germany). This material was chosen given its good mechanical and electrical properties, and its proper surface chemistry, suitable for biofilm growth, based on authors previous experience [
16]. The electrical connection to the external circuit was made by current collectors of plain graphite (SGL group, Munich, Germany), pressed together to the same electrodes.
A constant external voltage of 0.7 V was applied between anode and cathode by using a potentiostat (VMP3, BioLogic, Grenoble, France), while their individual potentials were monitored in comparison with an Ag/AgCl reference electrode (+0.197 V vs. SHE, Xi’an Yima Opto-electrical Technology, Shaanxi, China).
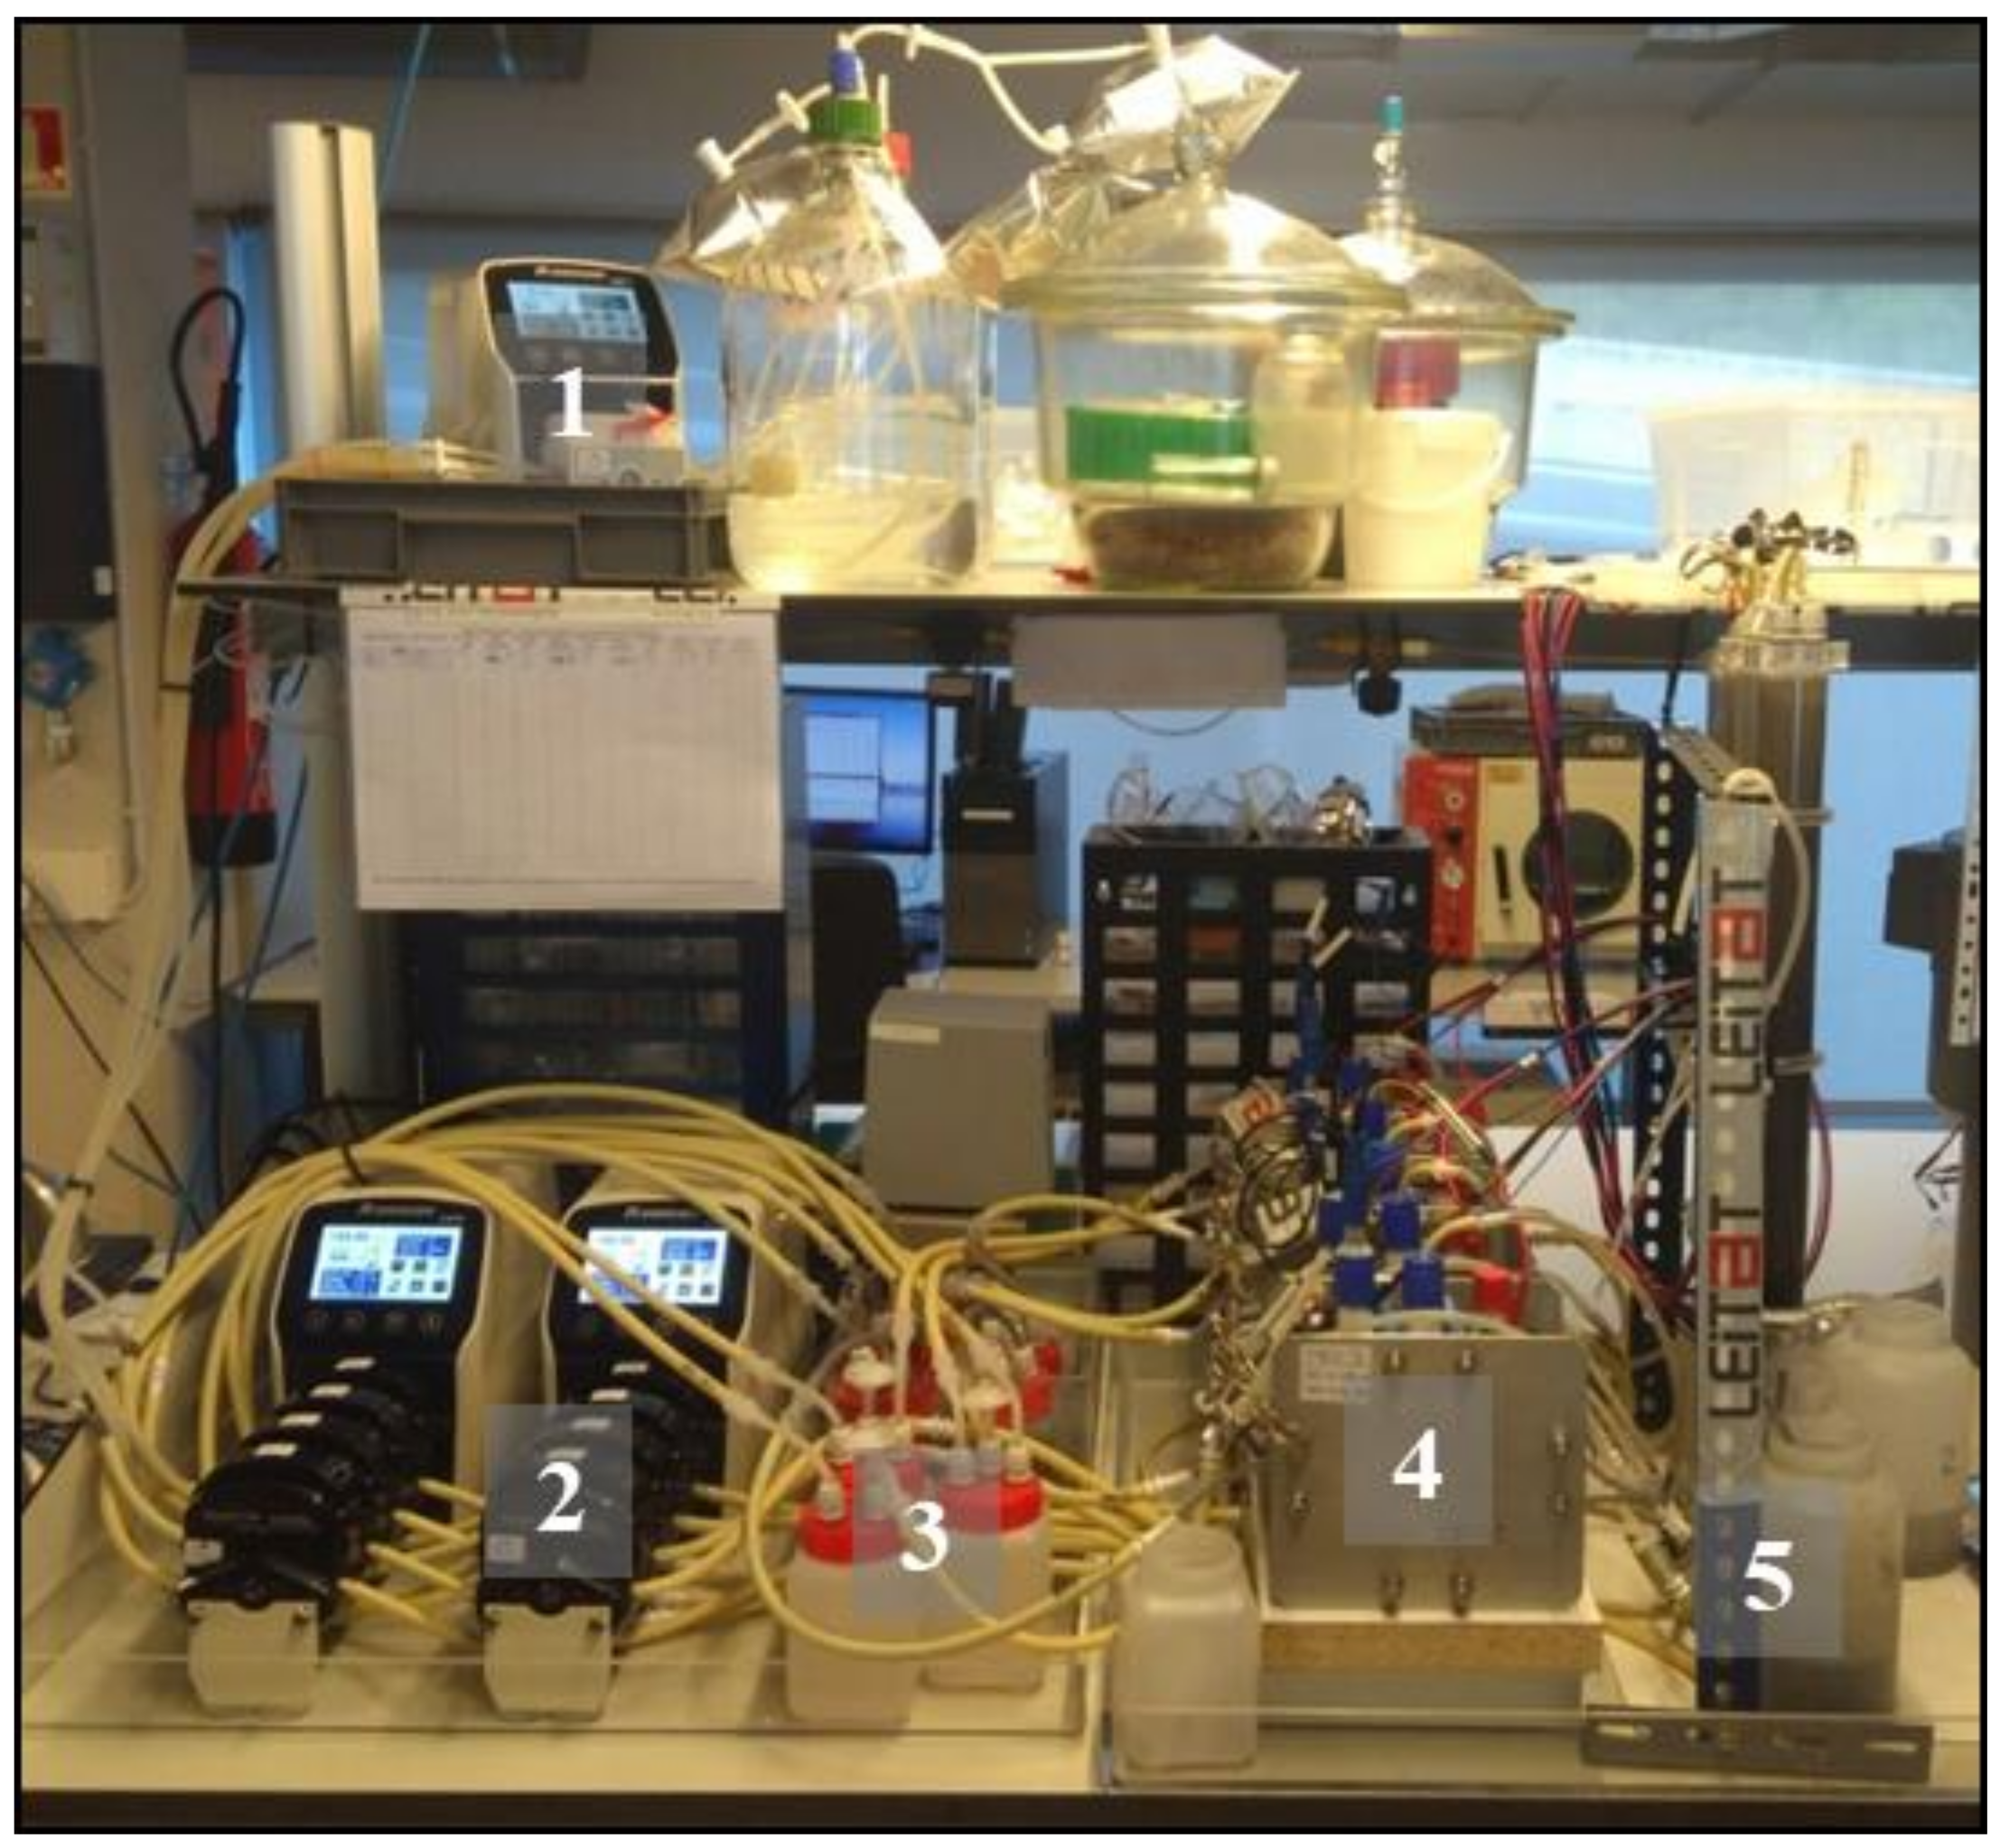
The 5 BES reactors were kept at a constant mesophilic temperature of 32 ± 1 °C by installing a thermostatic bath along their recirculation loop, as shown in
Figure 3. Reactors were inoculated in batch mode with a mixture of 50% acetate-based mineral medium and 50% anaerobic sludge, collected at a local wastewater treatment plant (WWTP). Three different inoculation strategies were initially adopted, which description lies outside the scope of the paper. After 28 days of batch operation, a continuous feeding at 0.12 mL min
−1 was applied. This was increased to 0.18 mL min
−1 at day 38, and remained constant for the rest of the experiment, lasting 8 months approximately, guaranteeing a hydraulic residence time (HRT) of the wastewater in the reactor equal to 2.9 days. A recirculation flux of 150 mL min
−1 helped maintaining homogeneous conditions inside the reactor, avoiding eventual concentration gradients and electrodes polarization.
The feeding solution (acetate-based mineral medium) was composed of: 450 mg L−1 NaCl, 165 mg L−1 MgCl2 6H2O, 13.6 mg L−1 CaCl2, 15.3 mg L−1 Mg2SO4, 8.4 mg L−1 NaHCO3, 2.5 g L−1 CH3COONa, 128 mg L−1 K2HPO4, 50 mg L−1 NH4Cl, 1 mL L−1 trace elements solution, 5 mL L−1 vitamins solution. The medium (1.95 g-COD L−1, with COD staying for Chemical Oxygen Demand) was neutralized at pH 7, flushed with CO2 for 30 min, and stored at 4 °C.
2.2. Experimental Techniques and Data Elaboration
The reactors were electrochemically operated and characterized using the aforementioned potentiostat. Adopted techniques were organized in weekly operational cycles, over which average values of electricity consumption were calculated and used for the subsequent modeling task. In particular, each cycle was organized as following:
- -
open circuit voltage, measured 2 times per week (data not shown);
- -
cathode cyclic voltammetry, measured 2 times per week (data not shown);
- -
chronoamperometry, applied for 160 h week−1 at constant voltage values of 0.7 V and 0.9 V.
Samples of liquid and gas effluent streams were collected from each reactor, once per cycle (one time per week), and analyzed according to Standard Methods [
17]. The liquid influent and effluent were characterized in terms of pH and conductivity (IntelliCAL
TM probes + HQd
TM Digital Meter, Hach Lange, Barcelona, Spain) and soluble COD (LCK 514 kits, Hach Lange, Barcelona, Spain). Also actual values of feeding rate (Q) and internal temperature were regularly validated. Thus, actual influent organic loading rate (OLR
IN) and organic removal rate (ORR) were calculated as:
where COD
IN is the COD of fed medium (1.95 g L
−1) and COD
EFF is that of the effluent.
The gas produced in the reactor was trapped by an external methacrylate chamber and sampled with a syringe. Gas samples were analyzed to determine volumetric content of carbon dioxide, methane, oxygen, nitrogen, hydrogen, and hydrogen sulfide by a Micro-GC (Agilent 490, Barcelona, Spain) with dual channel cabinet and thermal conductivity detector. Biomethane production rate was obtained by multiplying the total gas production rate (measurable through the external collection chamber) by its relative methane content. A normalized value of biomethane production was achieved dividing it by the reactor volume.
Electrical current demand of BES reactors was monitored every minute and averaged at the cycle end. A normalized value of current (current density) was obtained dividing it by cathode surface.
A summary of achieved experimental results is shown in
Appendix A.
3. Electromethanogenesis Model
The electrochemical BES model is a Multi Input Multi Output System (MIMO), and combines both the electrical and the chemical data collected during reactors operation at laboratory scale. Then, this model uses OLRIN and applied voltage as input parameters, and calculates the ORR, the methane production rate and the current consumption as outputs.
The chemical and electrical values in each cycle are interpolated multiplying by ten the database size in order to have enough data representation. The polynomial equation, representing the system behavior, can be expressed as Equation (3)
where
y(
t) represents the model output,
u(
t) the input,
e(
t) the error,
A and
B are the input and output polynomial equations.
Na is the order of the polynomial
A(
q) and
nb is the order of the polynomial
B(
q)
+ 1. As the system is MIMO, the output model is a matrix transfer function that is composed by several polynomials. Between these, the polynomials
naij, and
nbij are the order of the polynomials
A(
q) and
B(
q) for the output
i and input
j, with
i = 1–3 corresponding to: (
i = 1) ORR, (
i = 2) methane production rate, and (
i = 3) current consumption, and with
j = 1–2 corresponding to: (
j = 1) OLR
IN and (
j = 2) applied voltage.
In order to obtain the polynomial parameters, the system identification approach based on least-squares method is used. The least-squares method estimates the polynomial parameters based on the data observation. It is an iterative method, which tries to minimize the output error between experimental data and computed model.
For this purpose, with the relation between input and output, the order of each polynomials was changed from two to nine in order to find the best model fitting with the database.
Table 1 shows the model fitting for some of the better solutions that were found. In this table, the polynomial orders mean the aforementioned
naij, and
nbij polynomials for
A(
q) and
B(
q), respectively. The “model fit” columns of
Table 1 represent the matching of the model output (
yi) and experimental data output, for each output
i = 1–3. The higher these “model fit” terms, the better the model represents a specific aspect of the system. The model name is TF (transfer function) and the number corresponds to the different order used for the polynomials. In general, TF models presented in
Table 1 present good fitting and low autocorrelation values.
TF878 is the selected model (shown in
Appendix B), which has one of the highest model fitting. In other cases, problems as instabilities, negative ORR or negative methane production rate (physically meaningless) appeared in steady state. This happens because contour variables cannot be defined for linear models. For this reason, the aforementioned problems can appear along the simulation, but they should be limited to transient conditions.
The selected model showed a very good estimation of both electrical and chemical output values, and also the autocorrelation was good. The electrochemical model is a matrix transfer function of eight order in each denominator and in the numerator of eight order for ORR and current consumption, and of seventh order for methane production.
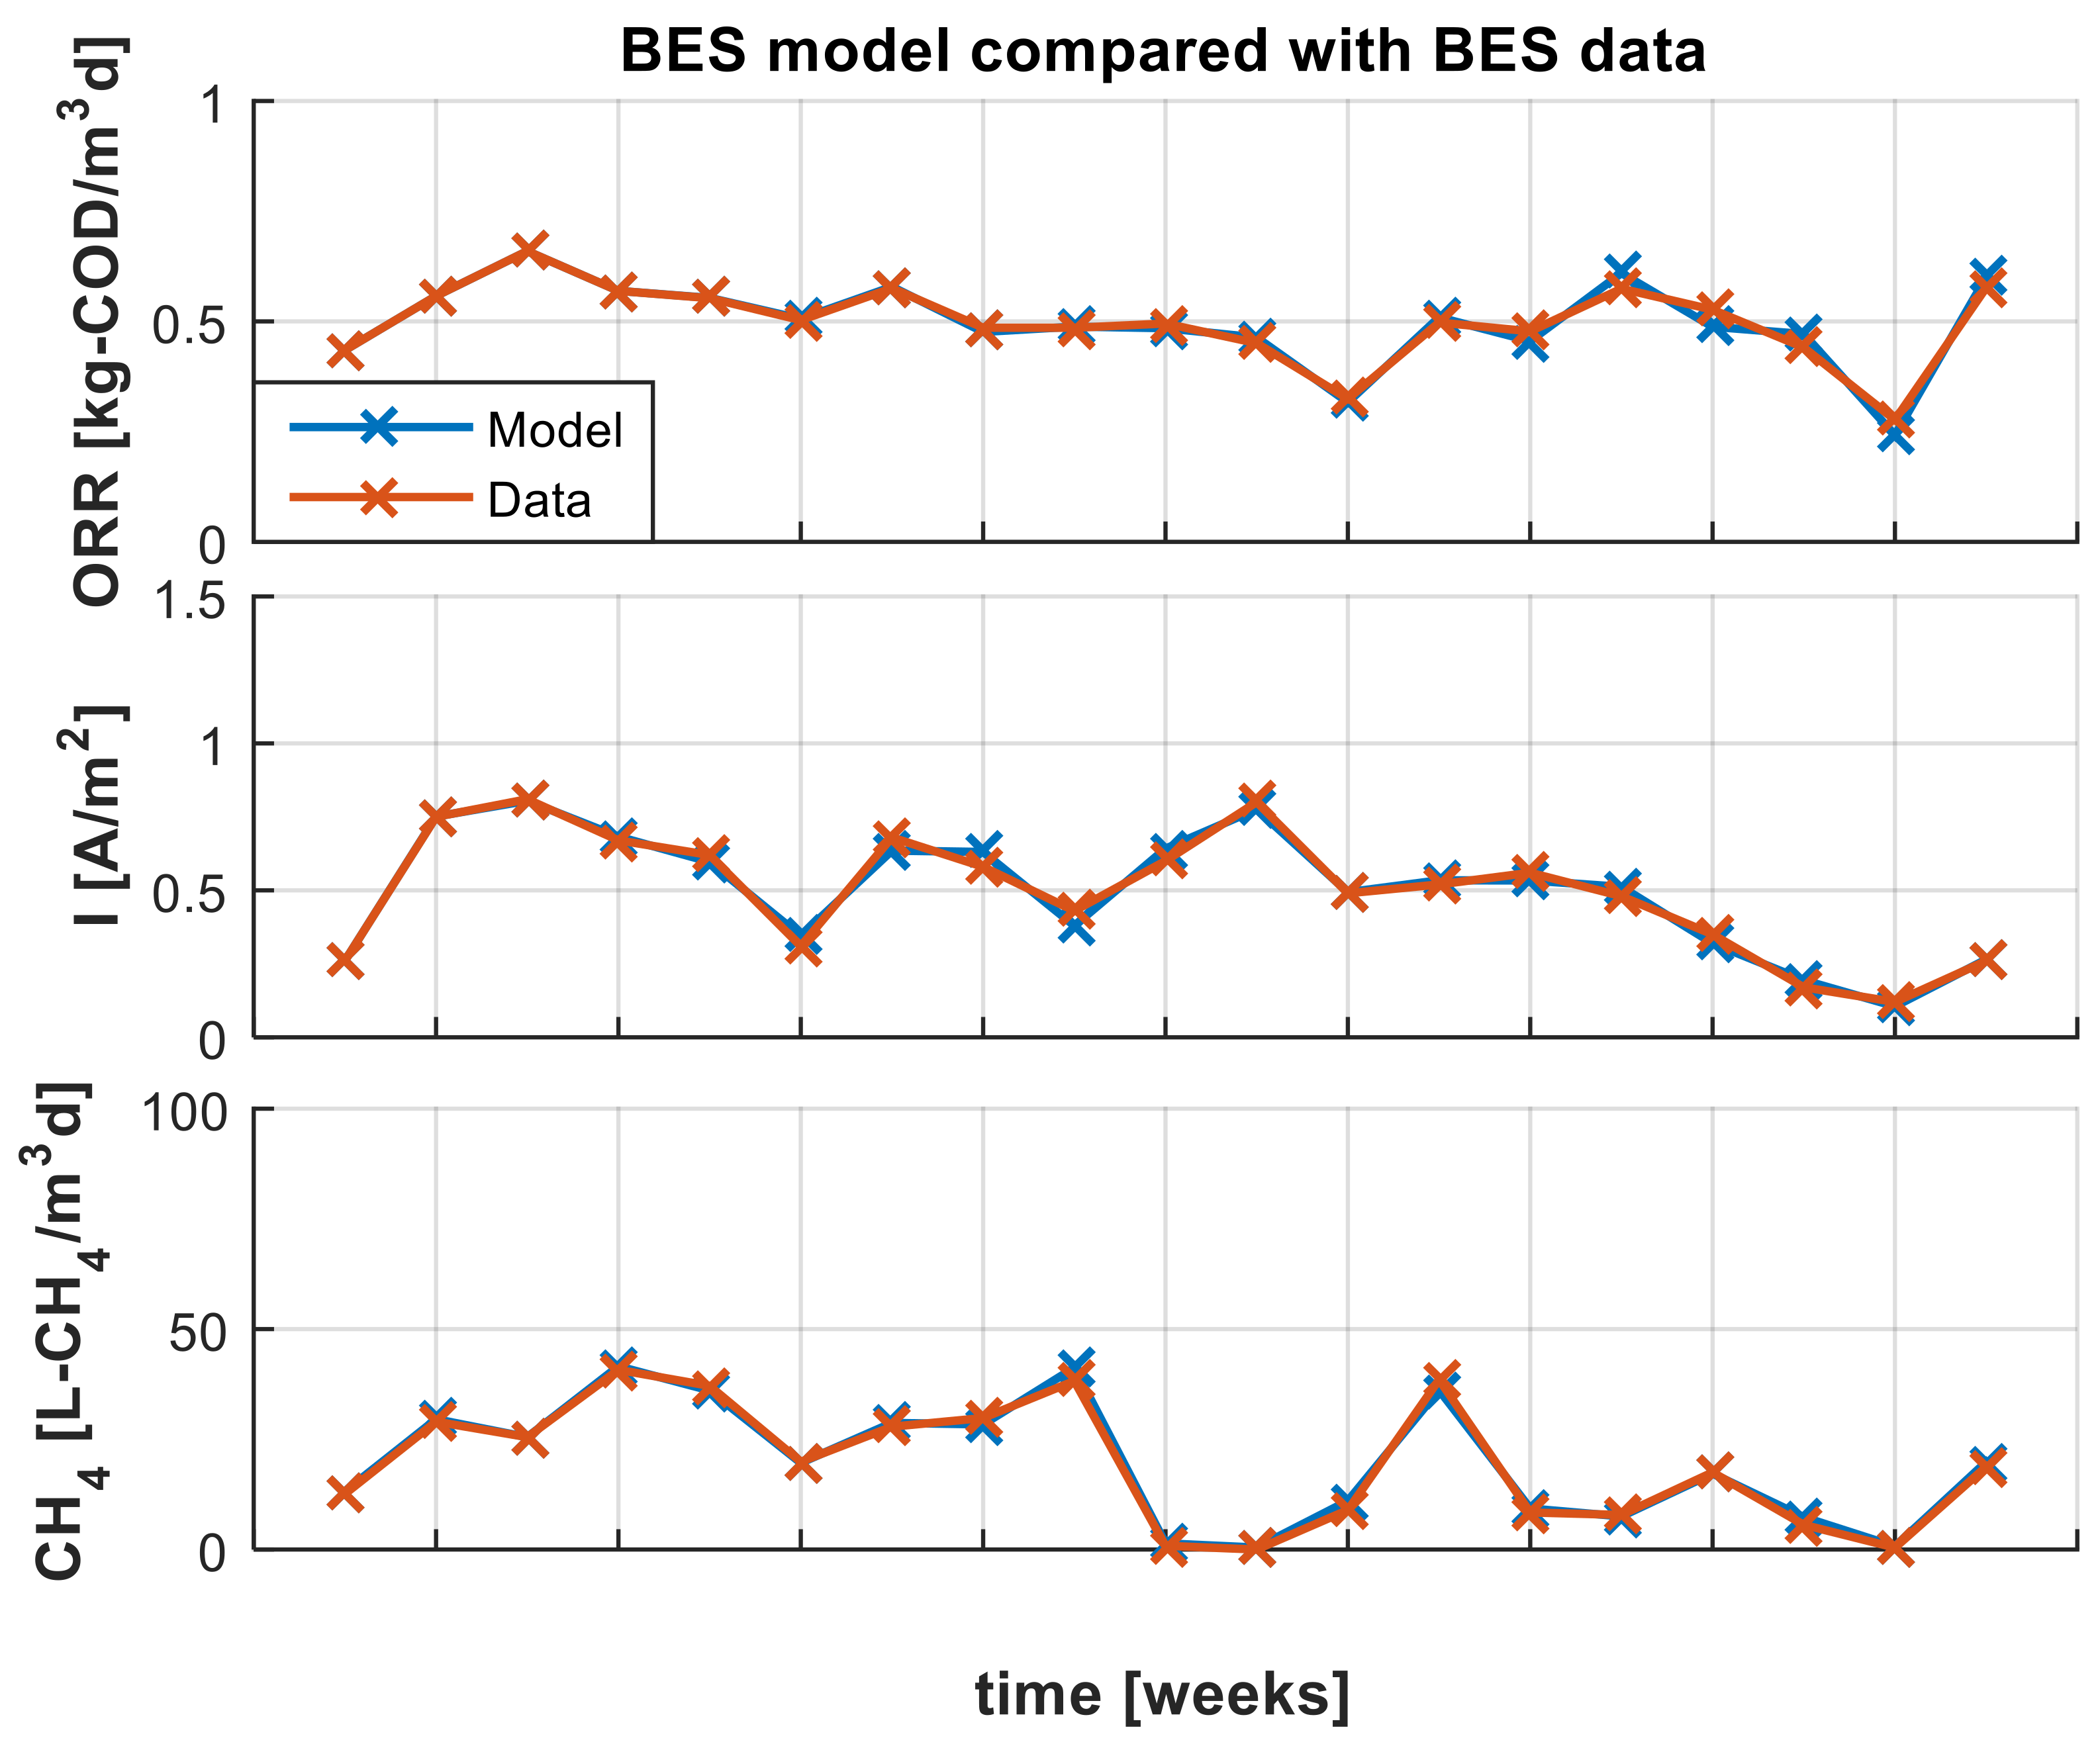
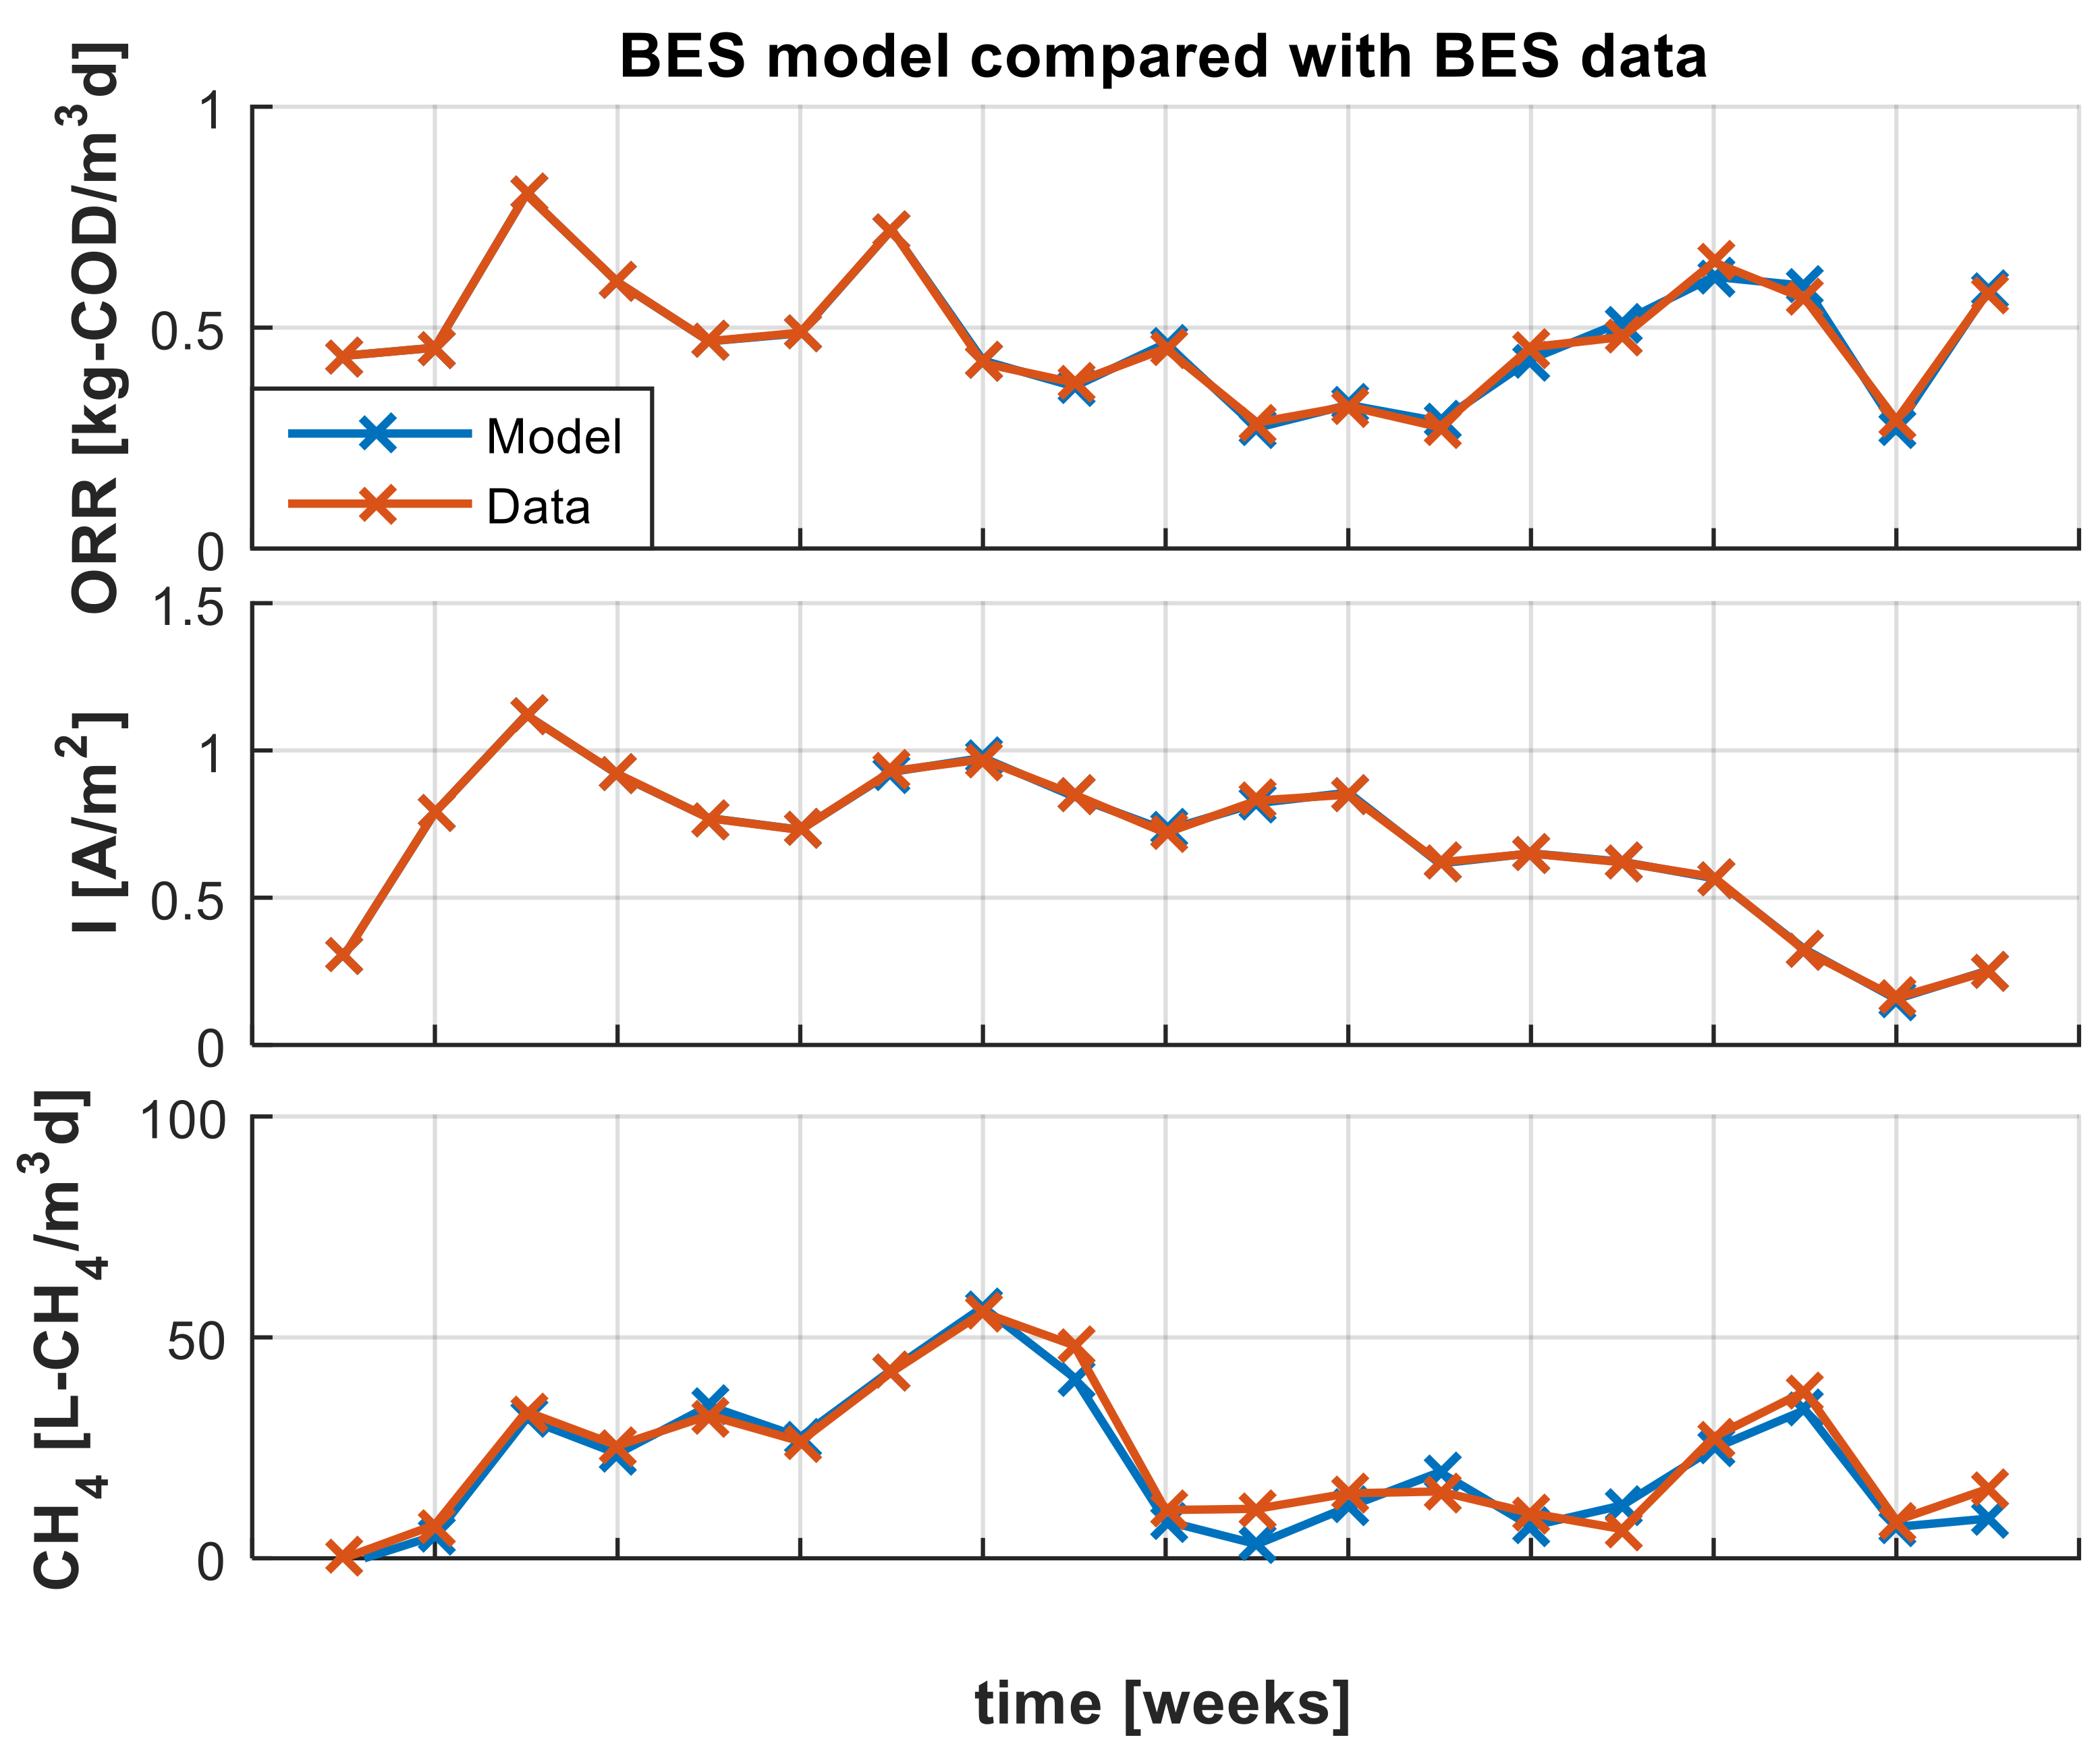
Figure 4 presents the comparison of model data and experimental results (resumed in
Table A1) to show the model matching with the data obtained from experiments in laboratory. Note that, at higher current demand (higher power consumption), the methane production and organic removal proceed at a higher rate, and vice versa.
In order to validate the model, the data from another reactor are used with the same obtained model (
Table A2).
Figure 5 shows the aforementioned validation. There is a good matching in each output, showing that the model can work properly with another reactor.
Unnatural behavior appears in the system model dynamics, like close to zero or negative methane production rates during transients, due to the intrinsic limits of the linear model, conserving internal dynamics but not incorporating contour conditions. Future studies will deal with contour conditions incorporation into the model, in order to solve these issues.
4. Renewable Energy Surplus Storage
Renewable energy surplus storage capacity of several technologies was evaluated in previous studies. In particular, the hydraulic pumping was studied, showing that in the Spanish market it can reduce the renewable energy waste up to 70% [
18]. In this context, we want to explore the energy storage potential of the biomethane produced by BES technology. This technology is flexible in terms of discontinuous working periods, and it can be powered when the price of electricity is lower than a threshold while kept latent during periods with high electricity prices.
Renewable resource variability influences the energy cost, which daily variation is exemplified in
Figure 6. A stack of BES reactors can be used as energy storage system by absorbing electrical energy during the low energy price periods. Anyway, the electricity consumption measured in the laboratory for an individual BES cell reaches at maximum a few mW. A stack simulation is needed to reach meaningful levels of power. Therefore, in order to proceed with the study, we run a simulation of a stacked BES system consuming 40 kW nominal power.
The simulation was done connecting 1000 branches in parallel with 2000 BES series cells each branch. The volume, area, and number of cells scaled the normalized values of each cell in order to have representative values of the full stack.
As a first approximation, and due to model linearity, two assumptions were made: (i) adopting an external equipment to balance cells voltage; and (ii) adopting the same electrochemical model for each reactor. This way, the voltage of the individual BES cell is limited to 1 V and does not exceed the limits of water oxidation. At laboratory level, strategies were described to limit the voltage gradient of individual cells in series-stacked systems [
19].
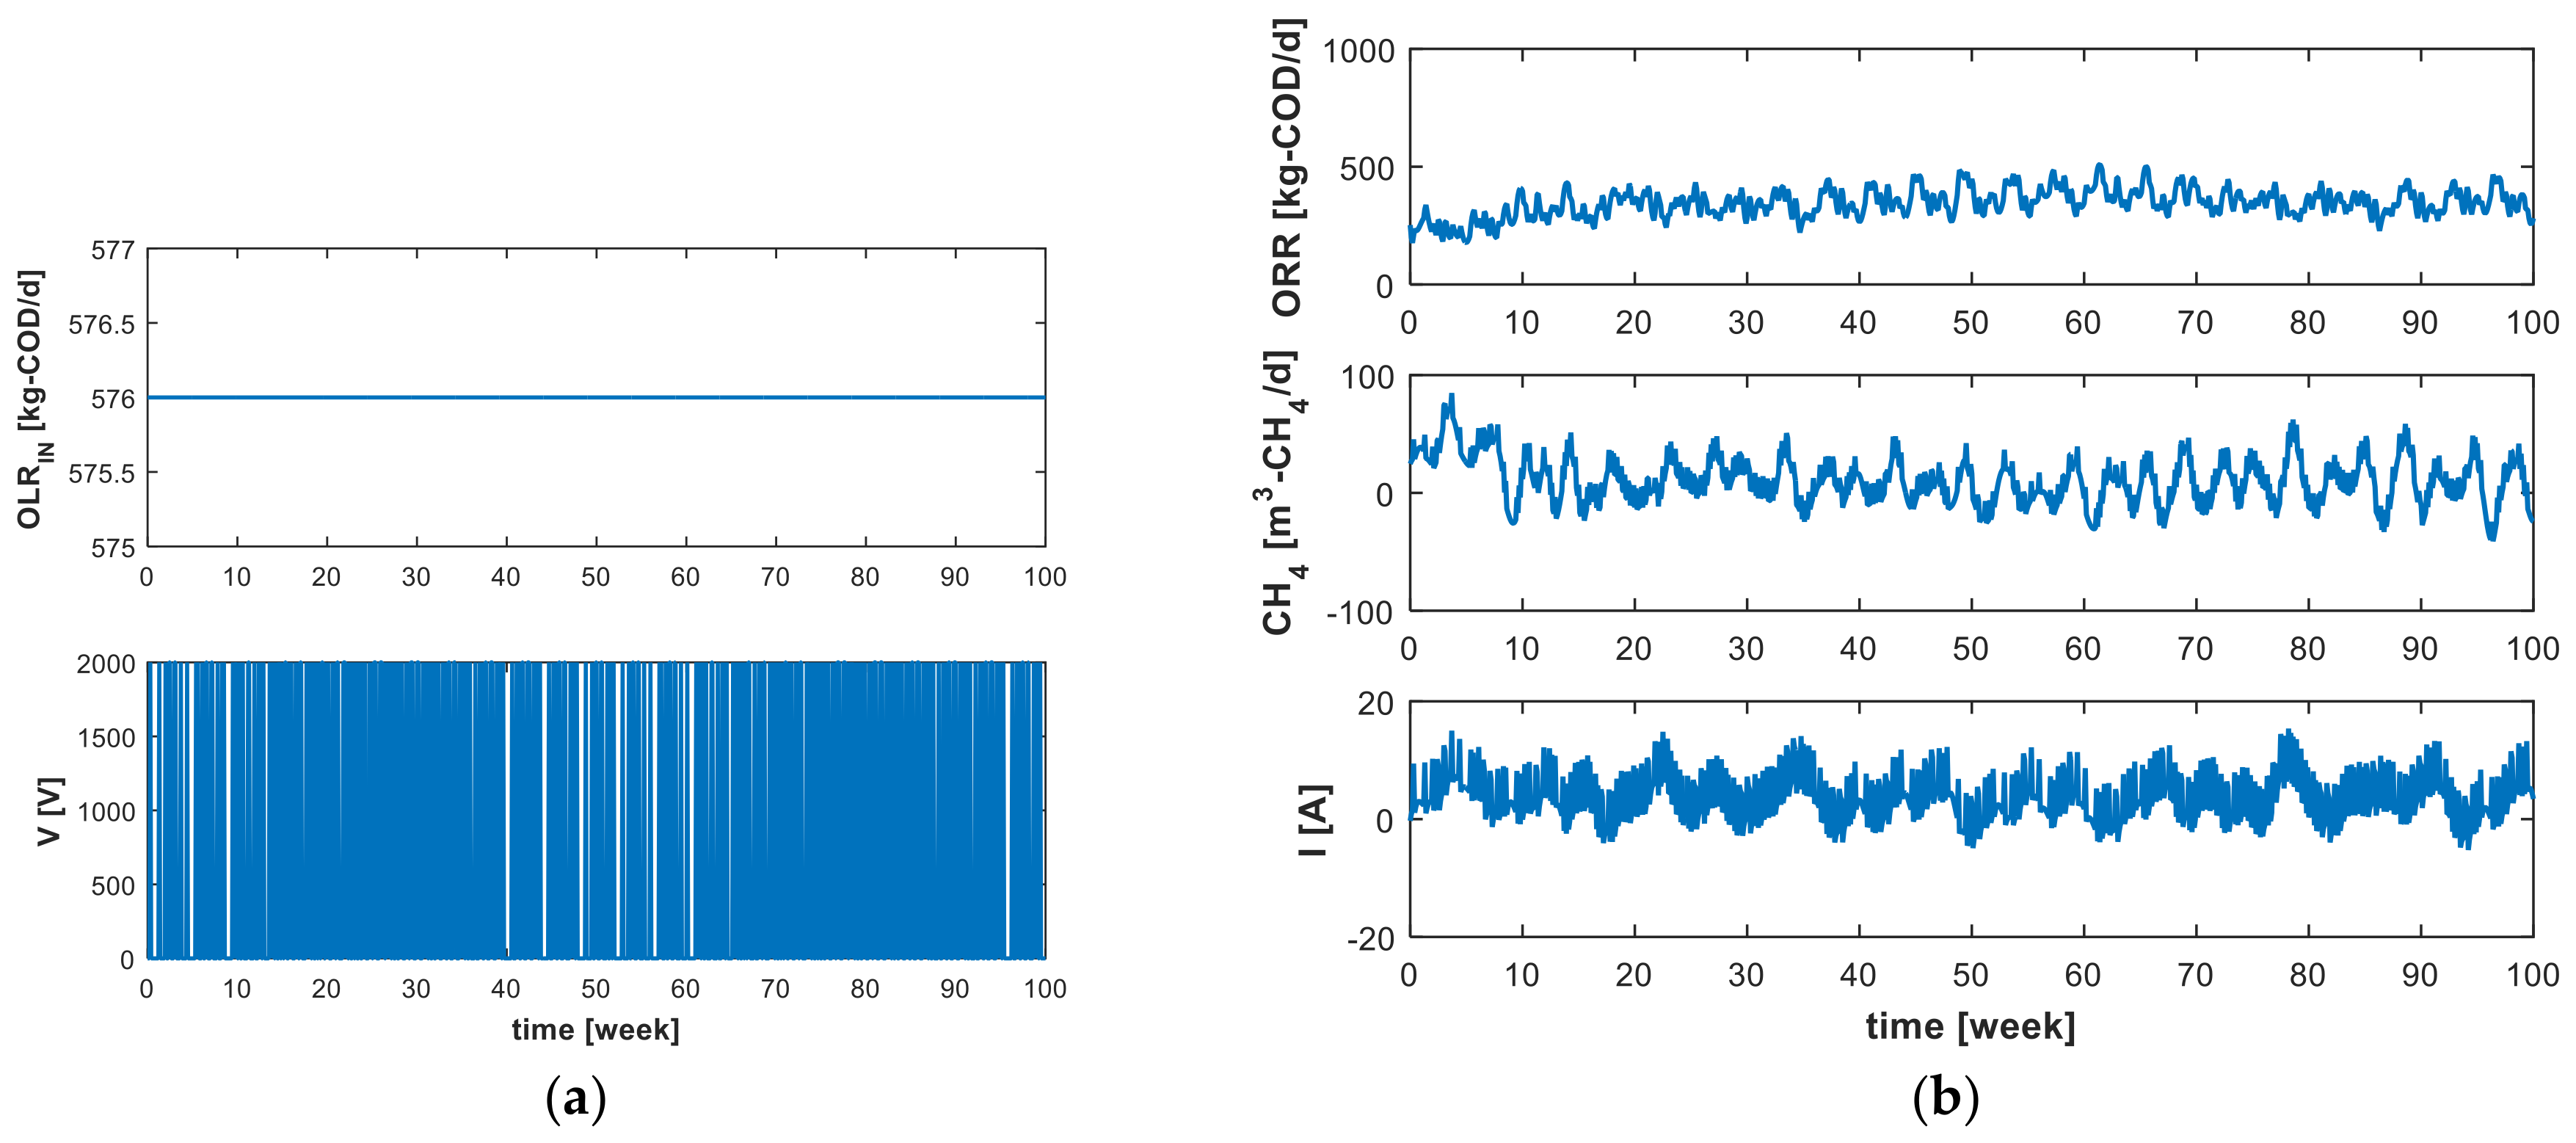
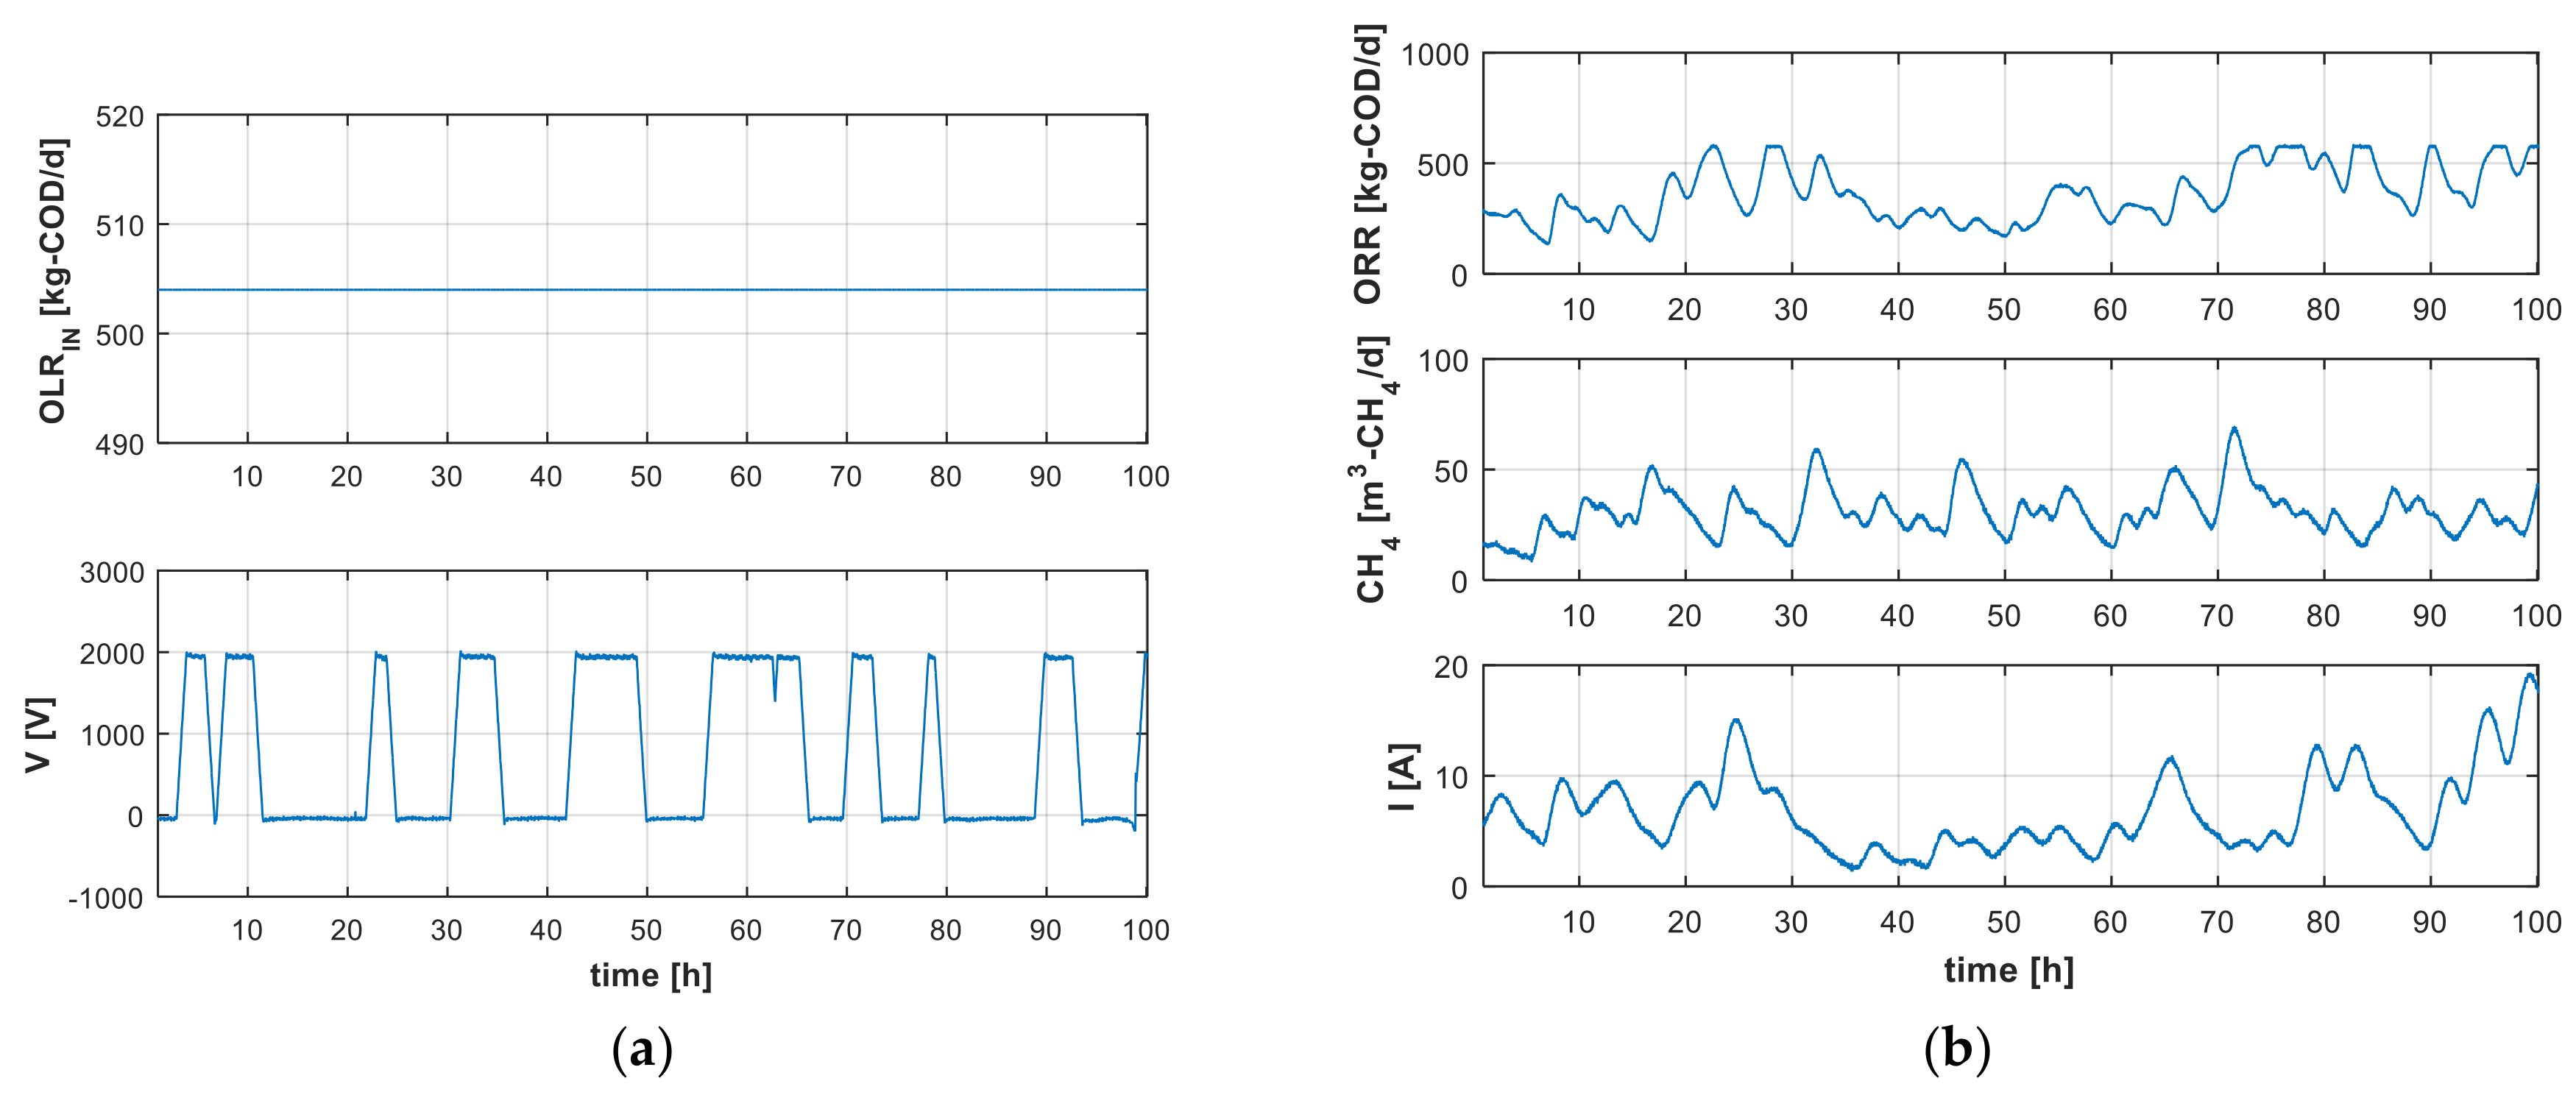
Figure 7 shows the simulation results of powering the BES during low energy price periods, demonstrating that reactors can produce methane using this scheme. In
Figure 7a the input signals are represented, meanwhile the output signals are reported in
Figure 7b. It can be observed that switching the voltage produces a switching in current and power. Moreover at higher power, higher methane production. The efficiency and cost of the system are out of the scope of this paper, and they will be studied in future works.
Also, note that the methane production rate reaches negative values during transient periods. As aforementioned, this behavior is a model limitation, due to its linearity that does not allow contour limits. Future studies will deal with models with contour limitation.
In the proposed application, the BES stack will absorb the power from the grid through a power converter during the low price time and the system will be inactive during the high price time.
A scheme of this process is depicted in
Figure 1. The renewable energy surplus is used to electrically power the BES reactor. On the other hand, wastewater saturated with CO
2 must be continuously fed to the reactor, to provide necessary reactants for the electromethanogenic process to occur. Biomethane is the output product, acting as energy storage medium.
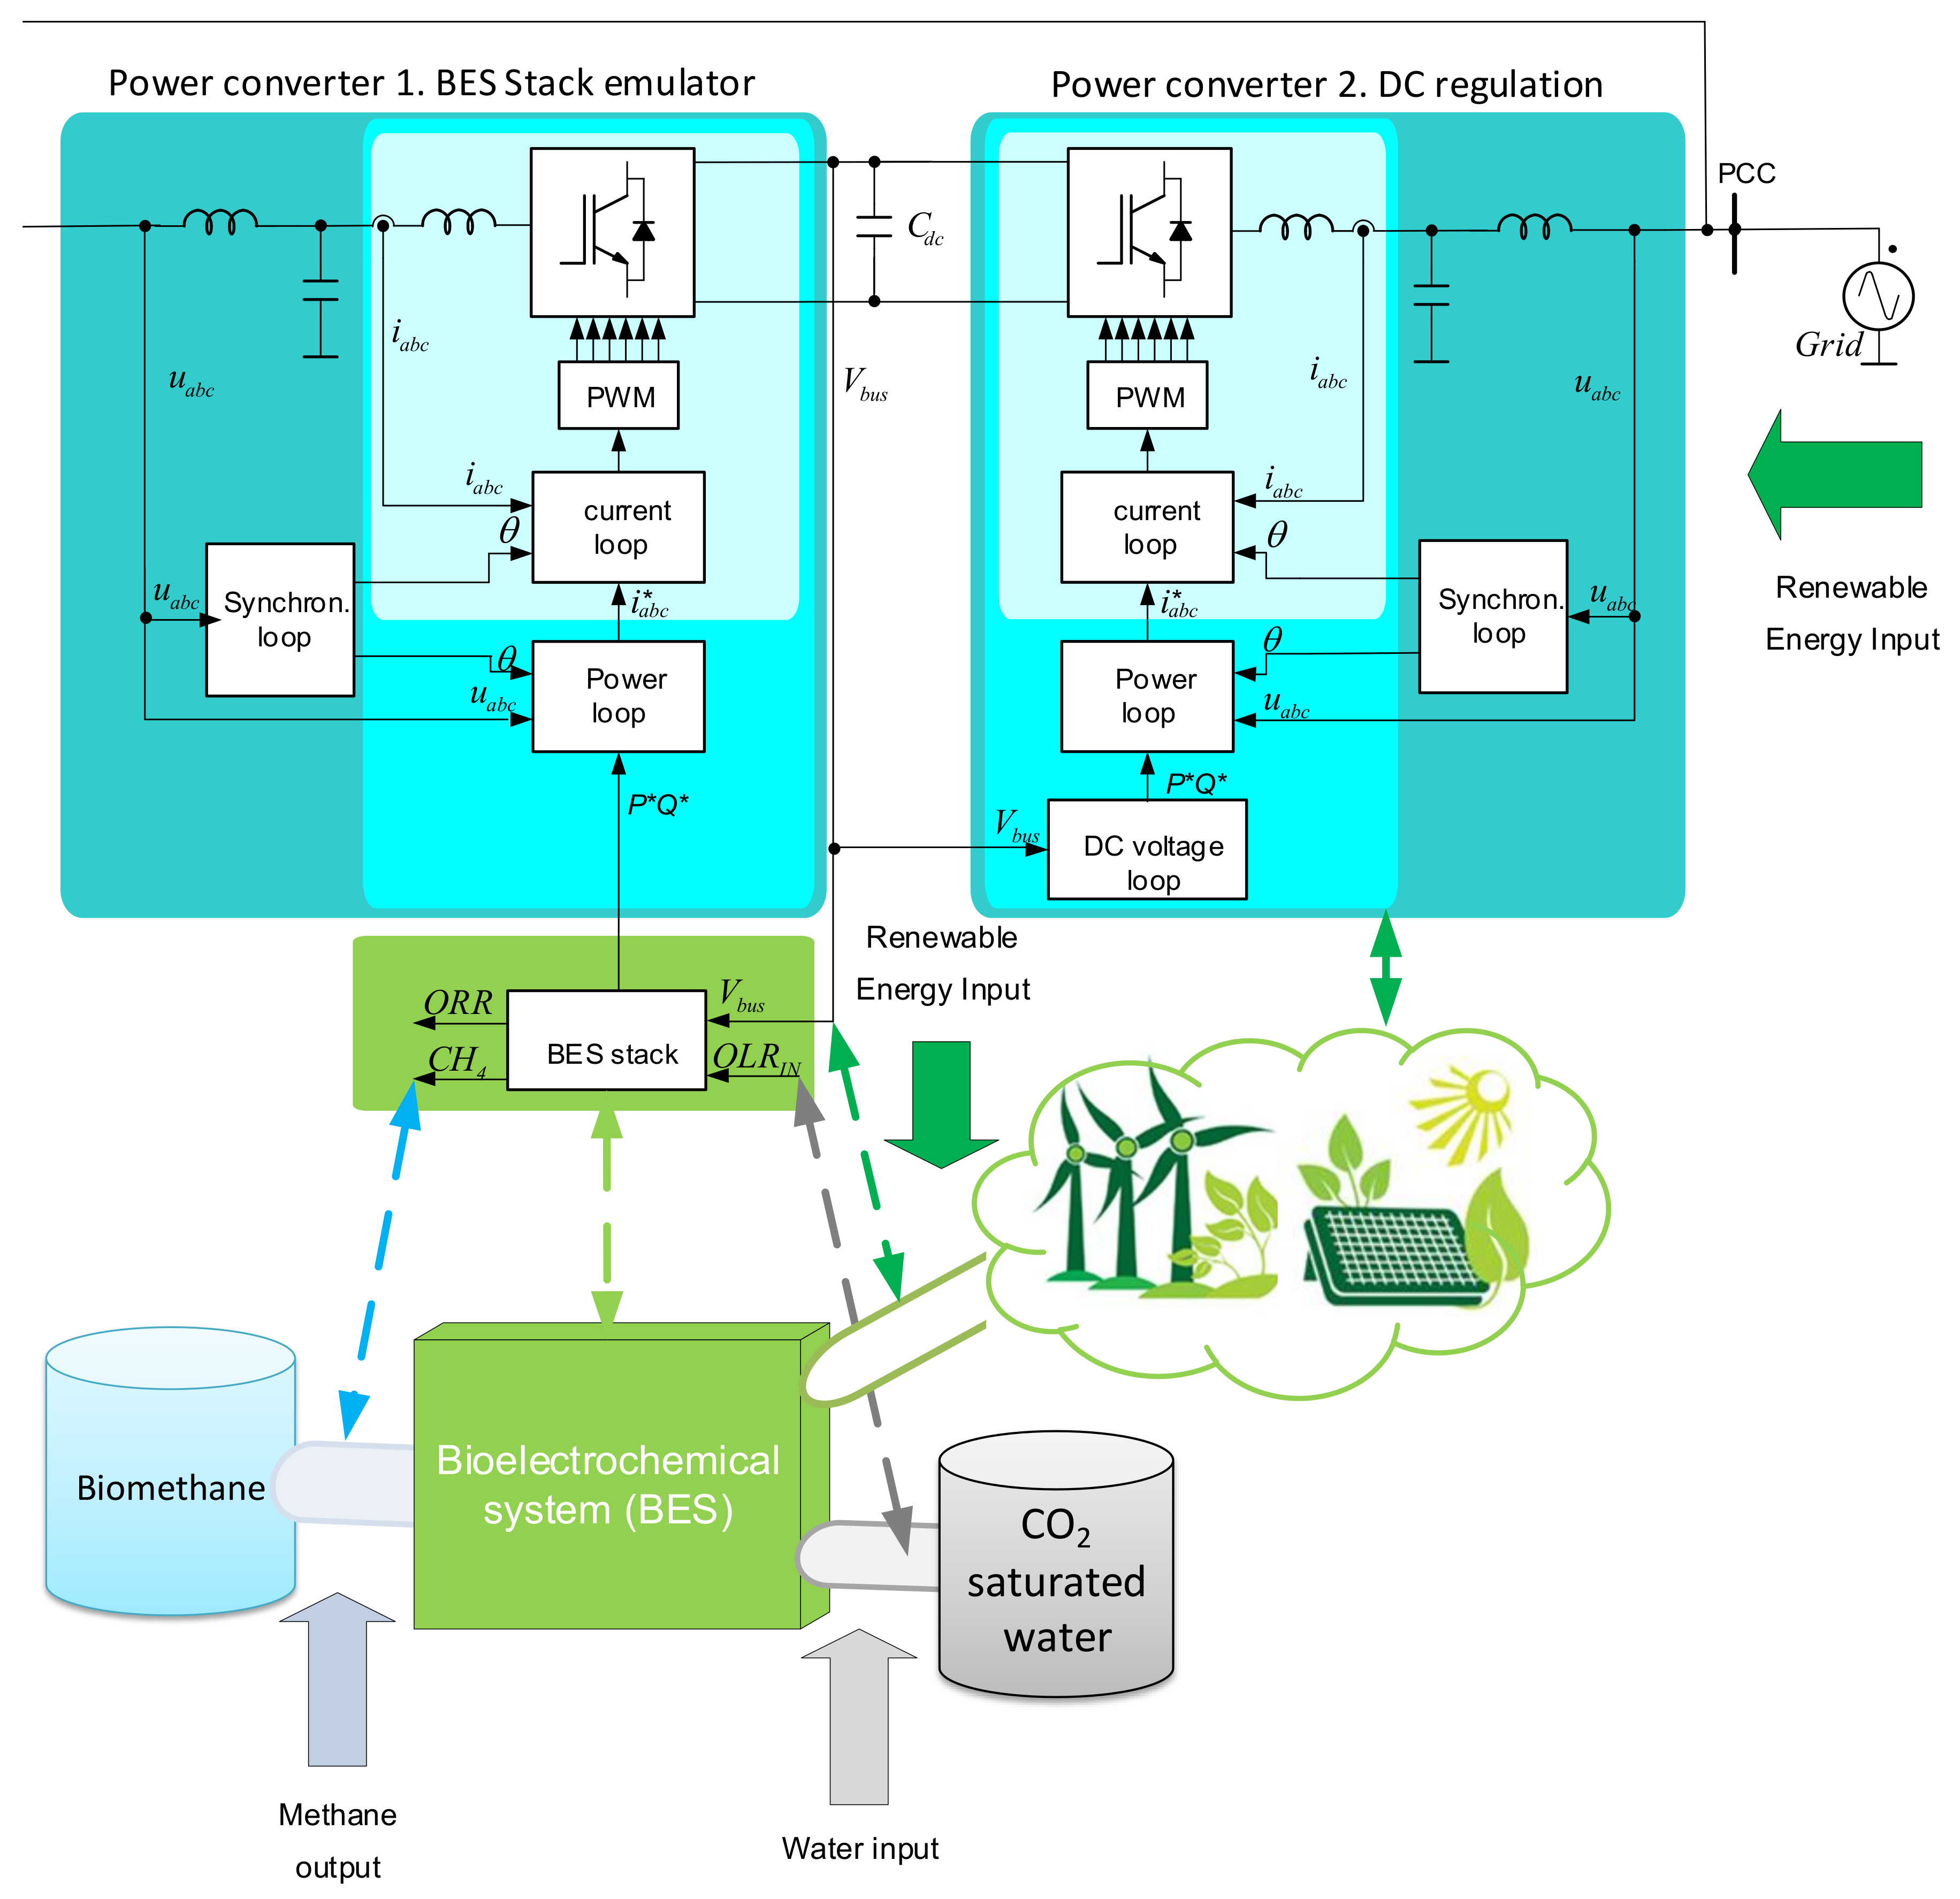
For simulating the process in real time, two power converters were used as presented in
Figure 8. The upper left one is the BES emulator. This converter is a grid side converter, being fed in DC and injecting the power into the grid according to the BES model.
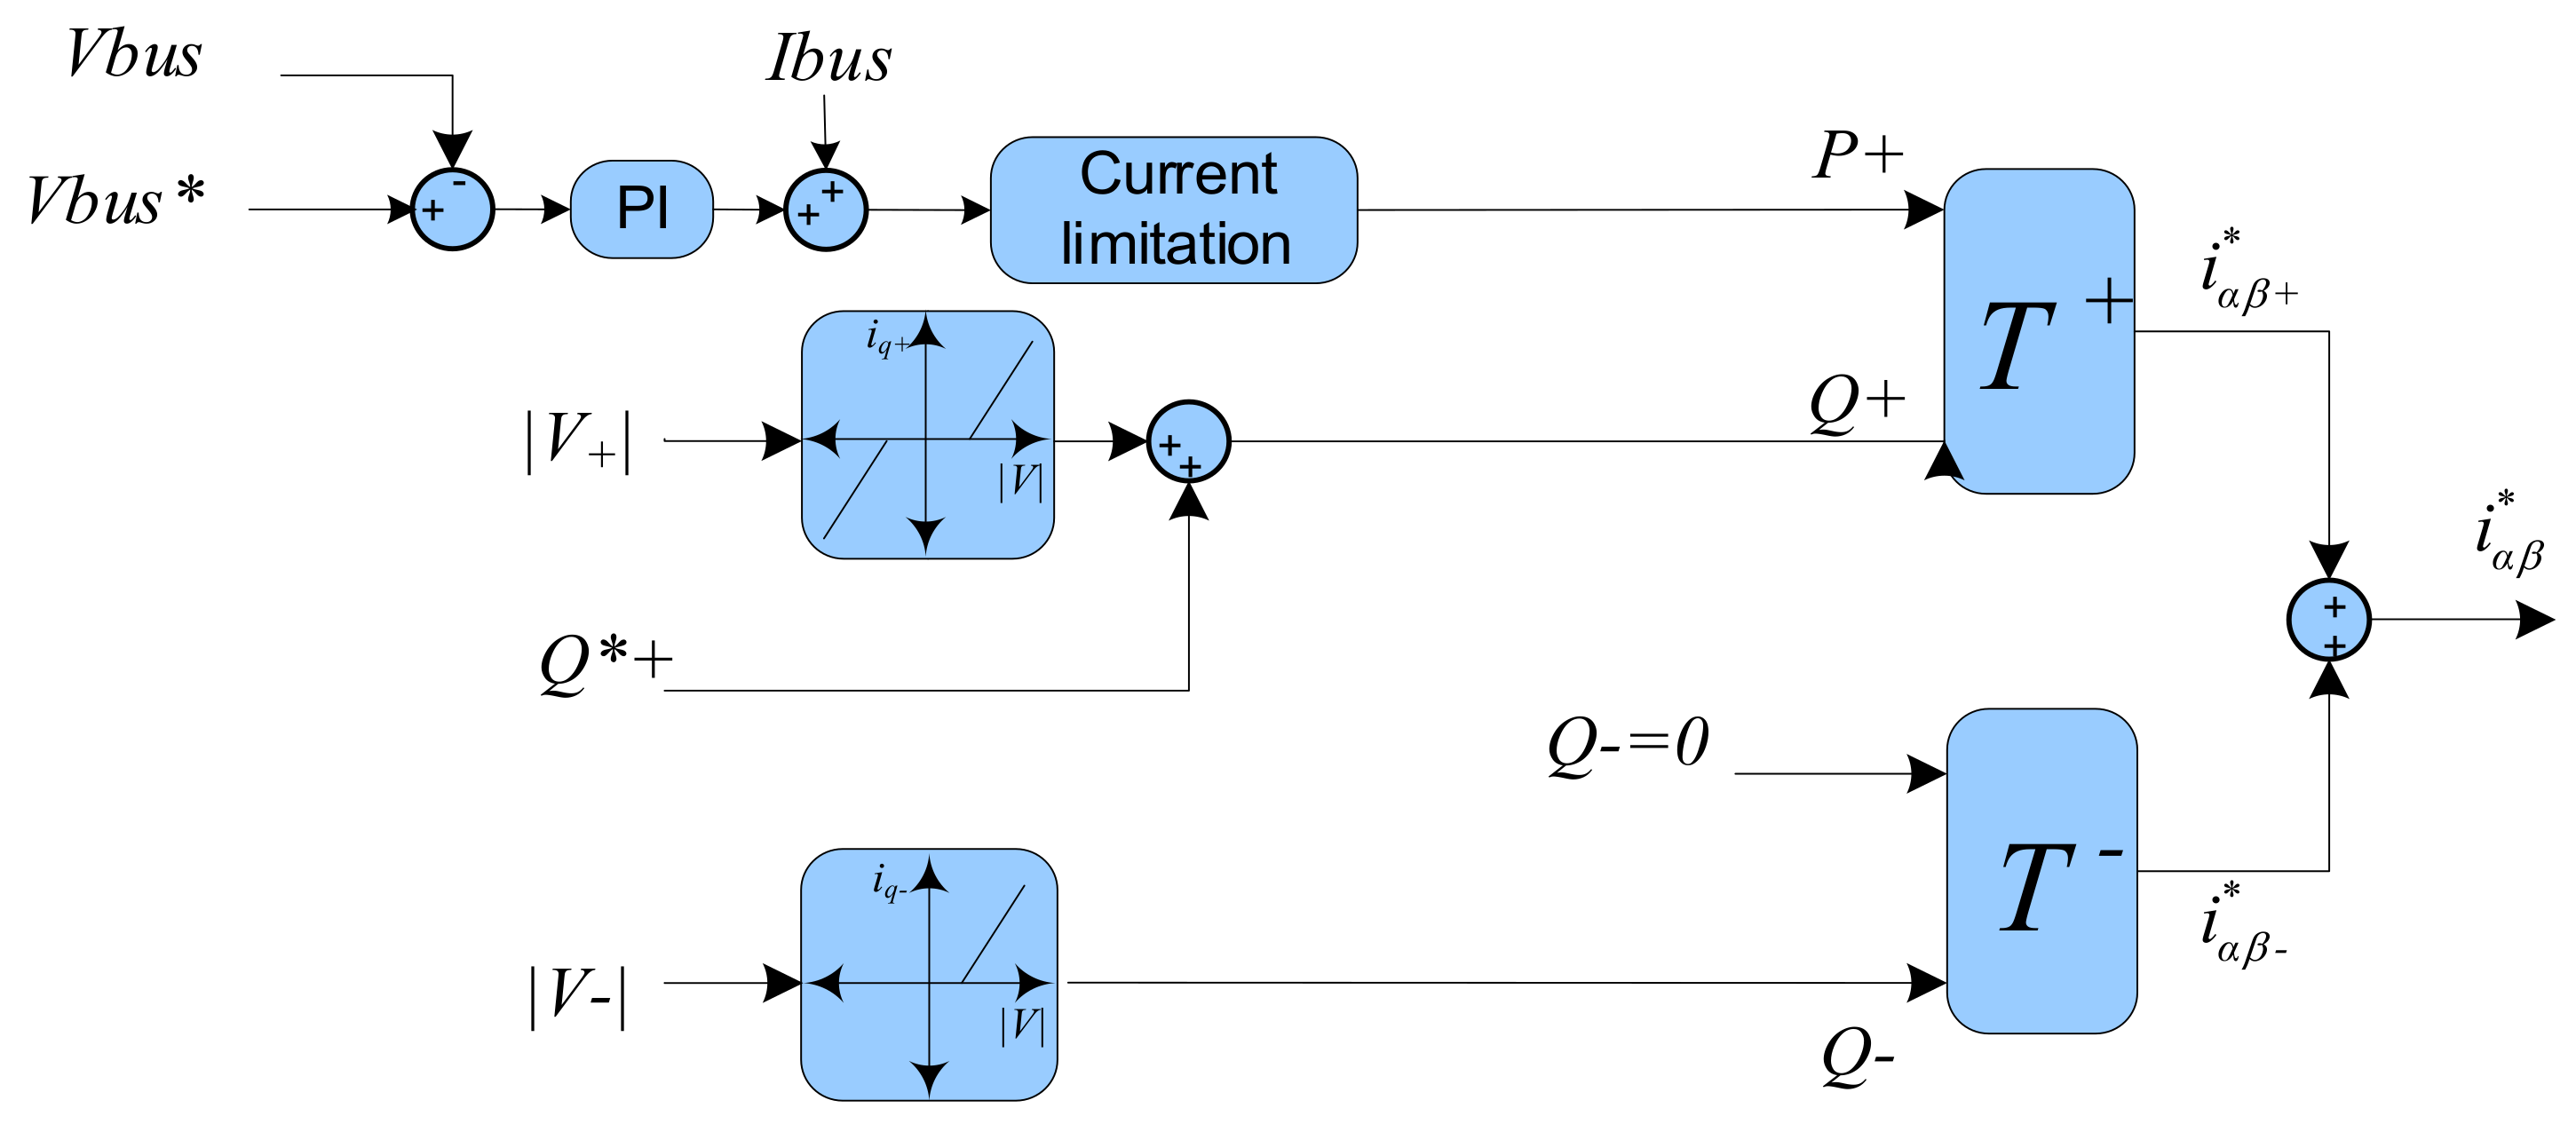
The BES converter control is a nested loop controller, which is explained in detail in
Appendix A. It is composed of an inner current loop that is a proportional resonant controller. The current controller receives its reference by a power reference generator. The power reference is obtained by the BES stack model computation depending on DC bus voltage and the influent organic load. On the upper right of
Figure 8, the second grid side converter is represented. This is an active rectifier, which feeds the BES stack emulator depending on energy market prices. The active rectifier control is also a nested loop scheme, in which the inner loop is a proportional resonant controller receiving the reference from a power reference generator, which is controlled by a proportional integral DC bus voltage regulator. The DC bus voltage value depends on market prices.
On the lower side of
Figure 8 the BES stack is presented. The BES receives as inputs the CO
2 saturated water and the renewable energy surplus by the DC regulation converter. The BES gives as outputs the methane production, cleaned water, and the electrical consumption, which is the reference power for the BES stack emulator.
As aforementioned,
Appendix C presents the converter control and
Section 5 the experimental results.
5. Experimental Results for the Real Time Simulations
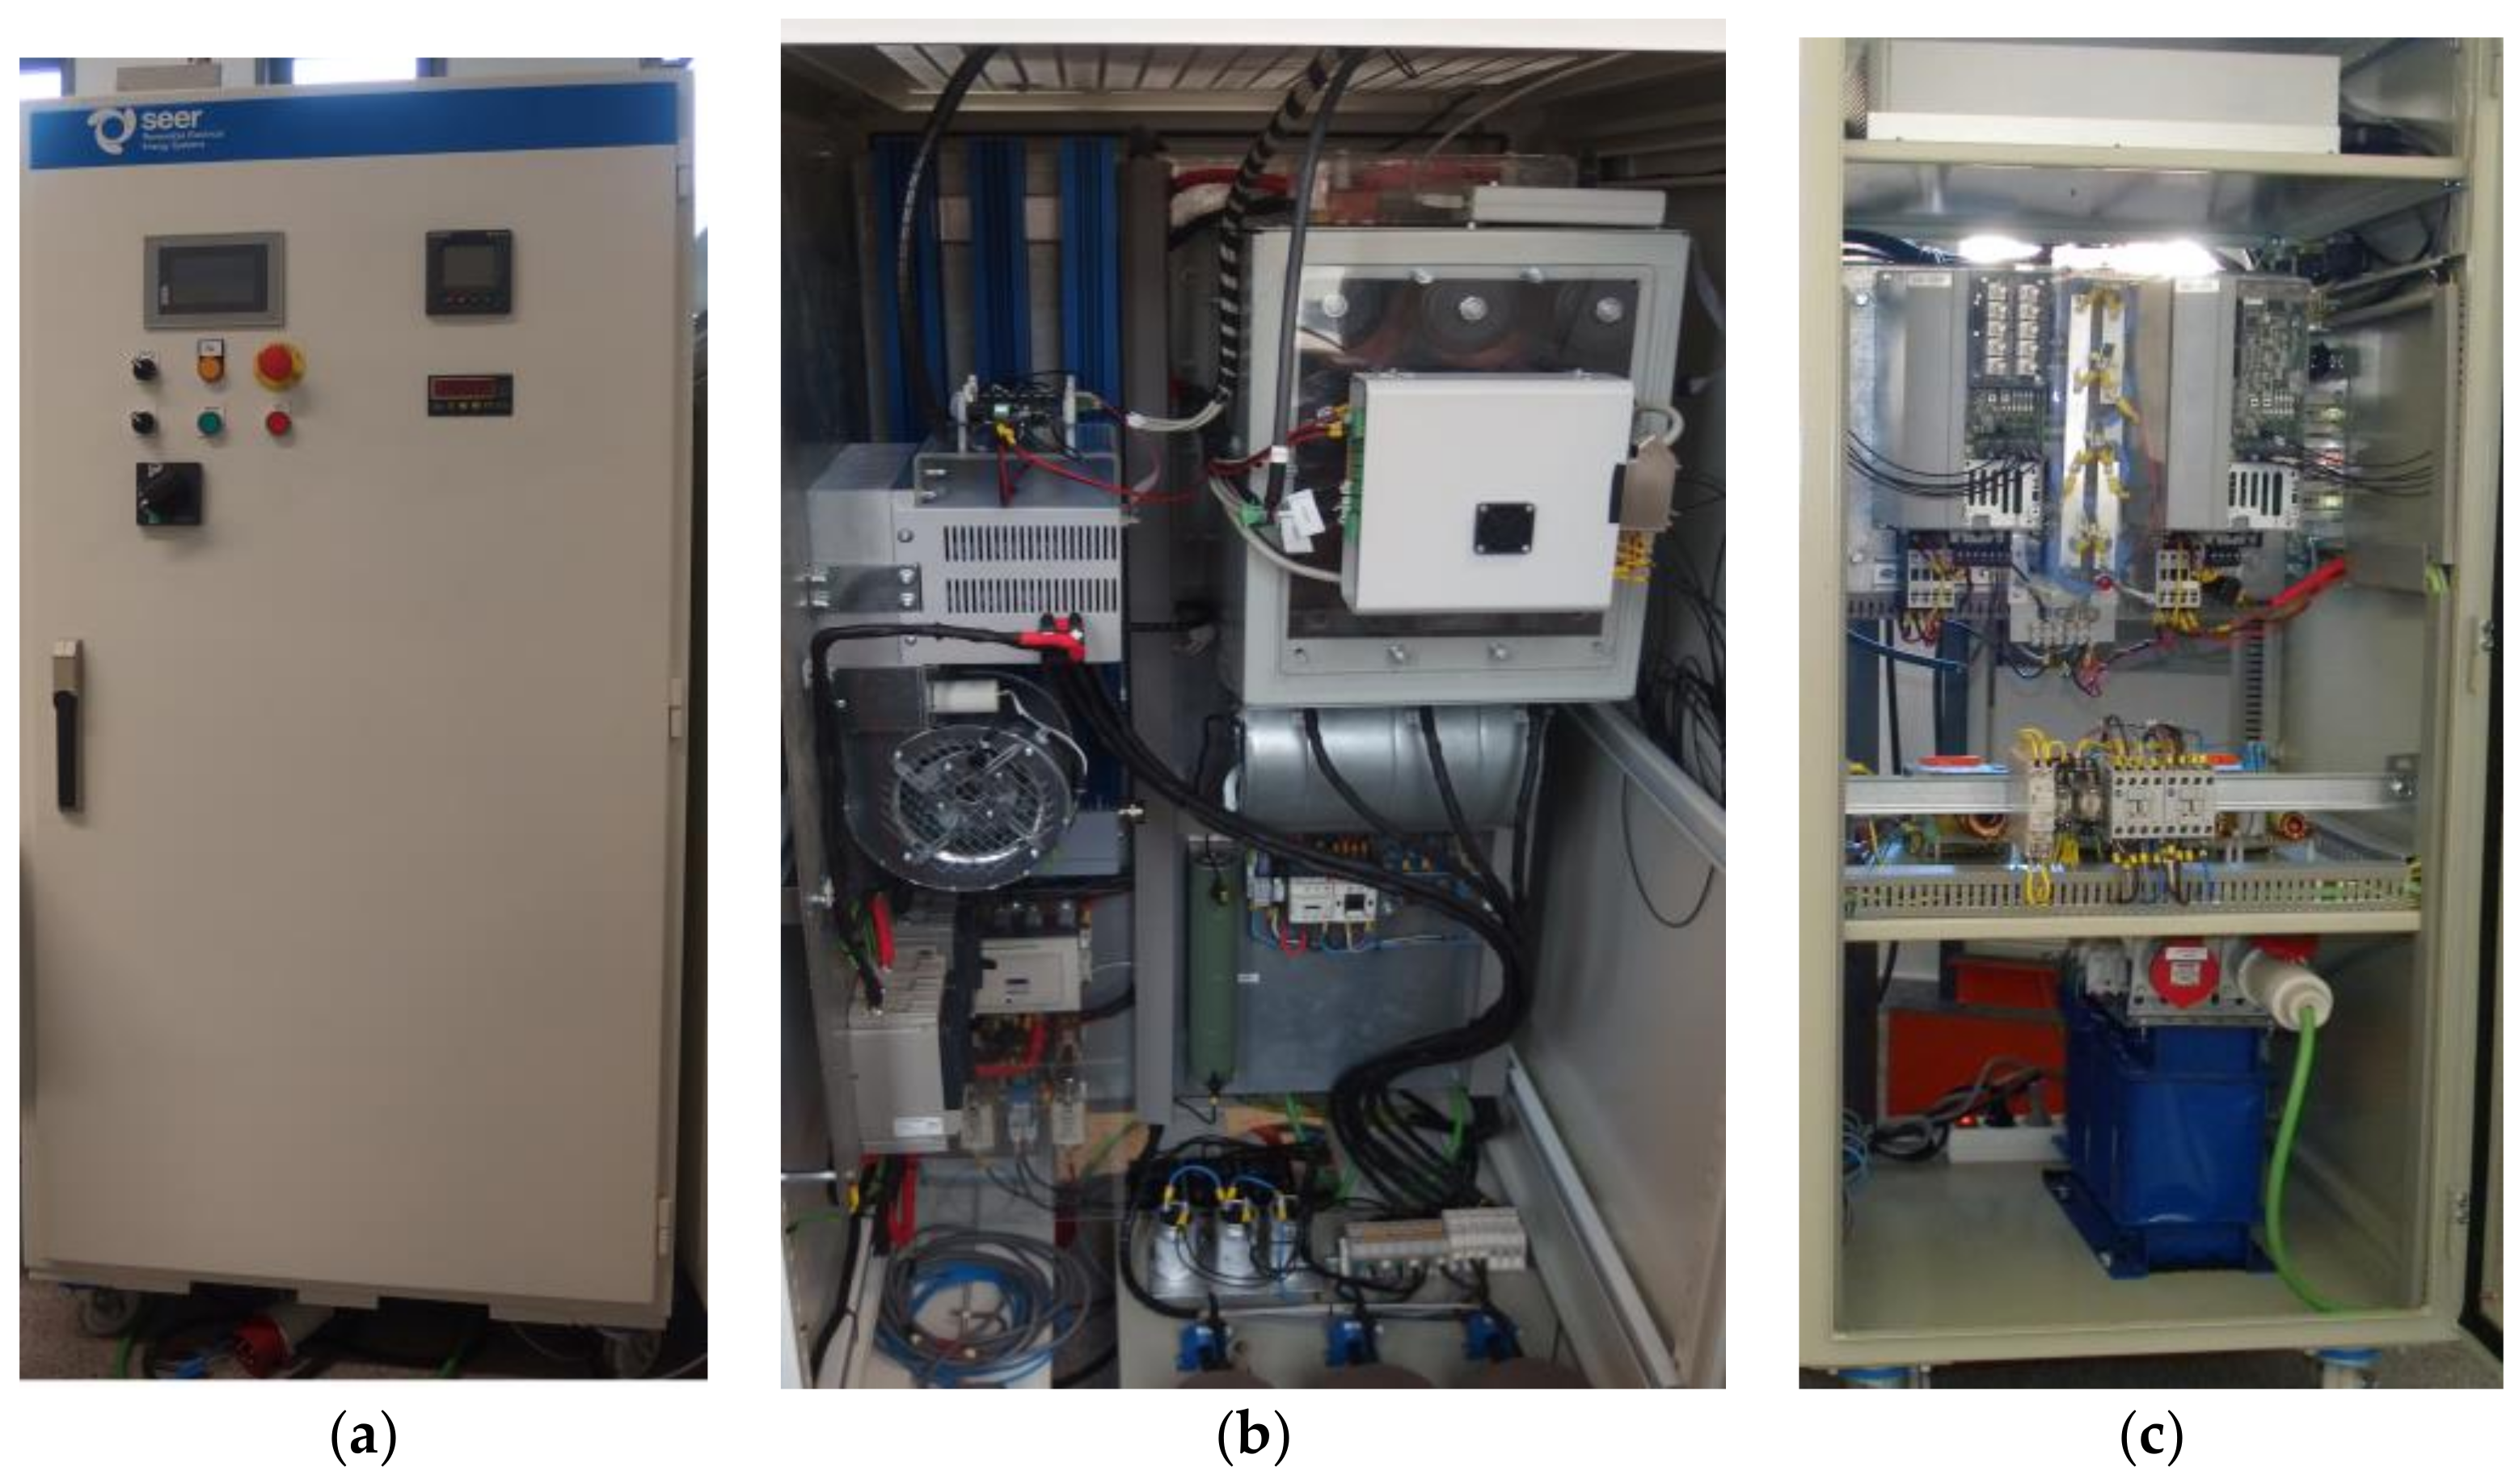
Figure 9 presents the experimental setup for real time simulations. On the left side (
Figure 9a) there is the inverter designed to absorb the renewable energy surplus and feed the BES reactors stack. It is possible to observe in the door the disconnector, buttons for precharge, and the DC and AC measurement equipment. Inside the cabinet (
Figure 9b) we can observe the converter, the grid-connection filter, the control board, and the interface board between the control and the inverter. On the right side, on
Figure 9c, there is the converter controlled by Dspace, emulating the BES stack. It is possible to observe the filter, the inverter, and the Dspace controller. This is also a grid-tied converter and the power injected into the grid depends on the power consumed by the BES stack.
Figure 10 shows the experimental results in which the BES is being electrically fed according to the price variation graph (
Figure 6). The stack is fed when the electricity price is low (under 35 €/MWh), while it is kept in electrical starvation when price is high. It can be observed that when the voltage increases, the methane production increases, together with the current consumption. The opposite happens when voltage decreases, according to the simulation results presented in
Figure 7.
The current consumption and methane production in zero voltage application can be interpreted by using an analogy: the BES can be modeled as a series connection of a resistor and a capacitor; the current increases during the voltage connection due the capacitor charging; in voltage zero application, the capacitor discharges through the resistor. A similar phenomenon occurs in the BES, but with a more complex dynamics and longer stabilization time.
6. Conclusions
This study was focused on the development of a novel energy storage solution based on bioelectrochemical power-to-gas technology. It aims to cover all the aspects of the value chain, from reactors design and operation, to process modeling and electric grid integration. For this reason, five BES reactors were long-term operated, and monitored from both electric and chemical points of view. Experimental data were used to build and validate an electrochemical model.
By using this electrochemical model structure, the BES reactors were modeled achieving a stable steady state response. The model was scaled to a higher power and simulated in real time by a power converter. Power absorption increases the methane production, showing the system feasibility and the high impact as future energy storage technology. On the other hand, reactors optimization, efficiency, and cost estimation of the system were out of the scope of this paper, and they will be studied in future works.
Negative methane production rates could appear along simulations, highlighting a model limitation due to the impossibility to define contour conditions. Future works will deal also with model modification setting contour conditions.

 ,
, 


