Abstract
Urbanization has intensified population concentration, and the quality of residential environments has deteriorated owing to the accelerated construction of high-rise and high-density buildings. In this study, a quantitative analysis is conducted regarding the natural lighting and outdoor thermal comfort of apartment complexes, and satisfactory improvement measures for both factors are investigated. Natural lighting and outside microclimate modeling simulations and statistical analyses are performed on 27 cases using the layout planning factors of an apartment complex. In addition, outdoor thermal comfort analysis is performed by applying heat island mitigation factors (greening and reflective asphalt pavement) to cases satisfying the condition of daylight factor (DF ≥ 75%). To improve natural lighting, the azimuth (correlation coefficient −0.812) should be considered, and to improve outdoor thermal comfort, the aspect ratio should be considered (−0.402). The results of applying heat island mitigation factors suggest that greening can improve outdoor thermal comfort to a greater extent than reflective asphalt pavement. The significance of this study is that the measures to improve residential comfort have been determined by considering the factors affecting the residential environment.
1. Introduction
1.1. Background and Research Motivation
Urbanization has intensified population concentrations and has caused housing shortages in cities. To solve this problem, apartments have been built in large quantities. however, the accelerated construction of high-rise and high-density buildings has infringed upon the right to enjoy sunshine and privacy [1]. Highly populated areas cause cities to develop either vertically or horizontally, resulting in more released anthropogenic heat, a higher blockage effect against urban ventilation, higher absorption of solar radiation by the implementation of artificial materials, and eventually a reduced longwave emission to the sky due to the blockage effect of buildings [2,3]. Energy consumed in urban environments represents at least 75% of the total energy resources. Heat generated in the urban core is trapped by urban structures, and the accumulated heat is gradually dissipated at night. Part of this energy is dissipated in the form of heat, which is intensified by solar radiation. Such phenomena result in heat island effects, with temperatures potentially increasing with urban density. The temperature increases due to heat island effects decrease the need for winter heating, but simultaneously increase the demand for summer cooling [4].
To improve the quality of life in urban residential environments, this study investigated measures to secure lighting and sunshine. The Korean government has enforced the Building Act, which limits the height of buildings and provides criteria for distances between buildings in planning an apartment complex (Article 61 of the Building Act of South Korea and Article 86 of the Enforcement Decree, respectively). Foreign cases also utilize similar legislations and guidelines to ensure the rights to enjoy sunshine as well as the rights of light. In Japan, Article 56 of the Building Code and Article 135 of the Building Law Enforcement Order include the areas and hours of sun-shadowing, sun-shadow regulations by use district, and the restrictions for the rights to enjoy light due to the north diagonal [5]. Additionally, the United Kingdom has the Prescription Act of 1832, the Rights of Light Act of 1959, the British Standard (B.S.) Code, and the BRE Guidelines [6]. However, there are concerns that the plan to secure sunshine in apartment complexes may worsen their microclimates. The temperatures of the outer walls of buildings and the ground surface in apartment complexes rise because of solar radiation. Consequently, it is difficult to obtain outdoor comfort, and economic costs increase because of the increased cooling load during summer.
1.2. Related Work
Maximum utilization of elements of the natural environment is a method that enables pleasant indoor and outdoor environments that can accommodate the mental and physical demands of people and also reduce energy consumption. Therefore, urban and architectural plans that properly utilize environmental factors in city centers are necessary.
Researchers have used actual measurements, surveys, and simulations to create pleasant indoor environments and outdoor thermal comfort using sunshine and outdoor thermal environment factors in similar studies.
Previous studies on sunshine examined the influence of the shape and location of urban blocks and the geometry of street canyons on sunshine [7,8,9,10,11,12,13], and the effect of urban design and building design plans considering sunshine on human comfort [14,15,16,17,18,19,20,21,22]. They also investigated the effects of street canyons on solar energy and energy consumption, and the use of sunshine to reduce energy consumption. The appropriate geometry of street canyons reduces the energy consumption of buildings, and the parameters that influence the amount of radiation reaching city blocks, visual comfort, and energy consumption have been derived [23,24,25,26,27,28,29,30,31,32]. The field-measurement method has been utilized most frequently for daylight analysis and simulations are typically used for research. Radiance, Relux, Daysim, and other tools have been used for simulations [23].
Previous studies related to the outdoor thermal environment were performed primarily in urban areas and attempted to improve the thermal comfort and thermal environment for urban pedestrians. Thermal comfort indices such as OUT_SET*, PET, UTCI, MOCI, and GOCI were used, as well as analysis tools such as ENVI-met and CFD [33,34,35,36,37,38,39,40]. Building layout, density, green area, and other variables have been applied to cities and residential complexes [41,42,43,44]. Researchers have conducted field surveys, experiments, and pedestrian surveys to investigate the actual conditions and determine improvement measures for the thermal environments in cities and buildings, and have applied green area planning to reduce heat islands and energy loads [45,46,47,48,49,50,51,52,53,54].
The existing literature has provided studies on environmental quality evaluation of sunshine environment and outdoor thermal environment and improvement of urban components and environmental factors. Solutions have been proposed through case settings, case analysis, and various research methods. However, it is not sufficient to evaluate complex urban environments using single environmental factors. To secure comfortable urban and residential environments, it is essential to investigate combinations of various environmental factors in a city.
1.3. Research Purpose and Method
To promote indoor natural lighting and outdoor thermal comfort and reduce energy consumption, shadowed areas should be reduced by establishing the distance between buildings, and the natural lighting and microclimate should be secured by mitigating heat accumulation on surfaces caused by shadowed areas. However, a conflicting relationship occurs between natural lighting and the microclimate in summer, and it is essential to obtain a proper balance that can satisfy both factors [55]. Hence, environmental factors must be analyzed for an acceptable combination of natural lighting and microclimate.
This study considers an existing paper that selected valid cases using the orthogonal matrix L27(313) for the design of experiments [56]. To create a comfortable living environment using these cases, the two environmental factors of natural lighting and microclimate were selected and a method that can satisfy both of these factors was investigated in this study. Figure 1 shows a matrix that represents the method to secure natural lighting and improve the outdoor microclimate.
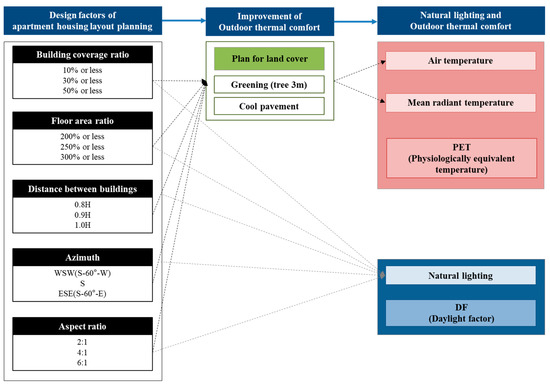
Figure 1.
Matrix for securing natural lighting and improving outdoor thermal comfort.
This study investigated apartment complexes that occupy the largest proportion of the buildings that constitute the cities of South Korea and are supplied in generalized form for residence. Valid cases for the design factors of apartment complex plans were selected using the orthogonal matrix for the design of experiments (27 for 243 cases) [56]. For the selected cases, natural lighting analysis was conducted for indoor spaces and outdoor thermal comfort analysis for outdoor spaces. In addition, statistical analysis was conducted based on the results to examine the effects of the design factors of apartment complex plans on outdoor thermal comfort and natural lighting. Finally, to obtain a method that meets both conditions of outdoor thermal comfort and natural lighting, a case satisfying the natural lighting condition was selected and corresponding outdoor thermal comfort changes were examined by applying thermal island planning elements to this case.
For the simulations used in this study, Daysim was chosen for the natural lighting simulations and ENVI-met for the microclimate model simulations. The indoor daylight performance was evaluated using the daylight factor (DF) as a natural lighting index, and outdoor thermal comfort was evaluated using the physiologically equivalent temperature (PET) index. The natural lighting and outdoor thermal comfort analysis results were stored in a database, and changes were predicted by applying an outdoor thermal comfort improvement method for cases satisfying the natural lighting condition.
1.4. Physiologically Equivalent Temperature
While principles of the thermal environment field have primarily been applied to indoor environments [57], finding a reliable and worldwide accepted metric for assessing thermal conditions outdoors is still a debated issue due to limit values related to local climatic conditions and the impossibility in some cases to account for radiation [58,59]. This is the reason why the PET index was used to evaluate outdoor environments in the current study.
The PET index for thermal comfort was developed in Germany. It quantifies the energy absorbed into the human body and the energy emitted to the surroundings using temperature, relative humidity, wind speed, and radiant energy in an outdoor space in summer, which are affected by the amount of solar radiation, and PET represents the thermal stress felt by people, expressed in levels [60,61,62]. The ranges of thermal stress levels are listed in Table 1 [63].

Table 1.
Physiologically equivalent temperature (PET) evaluation scale (Matzarakis and Mayer 1996; modified).
In this study, PET was predicted using RayMan Pro version 3.1 (Meteorological Institute of the University of Freiburg, Germany) (Matzarakis 2010). This software is well suited for determining micrometeorological changes in different urban structures, as it calculates the radiation fluxes of different surfaces and their changes (Gulyàs et al., 2006). RayMan has been used in many studies and its reliability has been demonstrated [64,65,66,67,68]. Table 2 shows the physiological parameters set for PET prediction. Note that physiological parameters were considered constant with an internal heat production of 80 W and a clothing heat transfer resistance of 0.9 clo. In addition, the meteorological simulation parameters are atmospheric temperature (°C), relative humidity (%), MRT (°C), wind speed (m/s), and vapor pressure (hPa), all of which affect the human thermal environment. In this study, the meteorological factors for measurement points were derived using ENVI-met.
Table 2.
Physiological parameters.
1.5. Daylight Factor
Daylight factor (DF) expresses the ratio of indoor daylight illumination to outdoor daylight illumination in a cloudy sky based on the International Commission on Illumination (CIE) standard [69]. The value of DF depends on building types, window sizes, frames and position, types of glazing, transmission characteristics of glazing, cleanliness of glazing, and interior room surface reflectance [70]. The calculated DF excludes the effects of building orientation or direct sunlight from both indoor and outdoor illuminance, while the overcast sky on which it is based is very much a worst-case condition [71,72]. DF is used as an architectural criterion for lighting and is applied by the British Standards Institute (BSI) and the US’s leadership in energy and environmental design (LEED) certification system [73].
2. Simulation Overview
Simulations were conducted to investigate the changes in outdoor thermal comfort and natural lighting for the selected cases. The target location of the simulation is at latitude of 37°33′59′′and longitude of 126°58′41′′ in Seoul, Korea. Seoul belongs to a modified humid subtropical climate (Cwa), which implies a hot summer and a short winter dry season (Köppen climate classification). The average temperature is 12.5 °C, the average wind speed is 2.3 m/s, and the average relative humidity is 64.4%.
2.1. Microclimate Modeling Simulation
The buildings that occupy most parts of the city center have as much impact on the meteorological field as the topography or surface. To simulate the changes in the thermal environment of the city, a modeling system that can consider the buildings, layout, and vegetation in the city center is required [74].
ENVI-met version 4.3 (ENVI_MET GmbH, Essen, Germany) is a holistic three-dimensional non-hydrostatic model for the simulation of surface-plant-air interactions not only limited to, but very often used to simulate urban environments and to assess the effects of green architecture plans. It is designed for microscale analysis with a typical horizontal resolution from 0.5 to 5 m and a typical time frame of 24 to 48 h with a time step of 1 to 5 s. This resolution allows analysis of small-scale interactions between individual buildings, surfaces, and plants [75].
2.2. Natural Lighting Simulation
The Daysim application used in this study is designed based on the same Raytracing method as the Radiance application. Daysim is a dynamic simulation application developed by the National Research Council Canada (NRCC) to analyze natural lighting performance [76]. This tool facilitates selection of the optimal plan among various design plans because it reviews building sunshine and solar irradiance and quantifies environmental loads (greenhouse gas emissions) from the projected energy use. Daysim can be installed as an engine and used as a plug-in in various applications (Sketch up, Rhino, Ecotect) [77]. Daysim has been used and proven in many studies using its natural light modeling feature in various climatic and sky conditions [78,79]. In this study, Daysim was linked with the Autodesk Ecotect Analysis application.
3. Case Study Overview
3.1. Case Study Conditions
Figure 2 and Figure 3 show the floor area ratio (A), building coverage ratio (B), distance between buildings (C), azimuth (D), and aspect ratio (E) among the design factors for apartment complex planning. Based on the Urban Planning Ordinance and the Enforcement Decree of Korea’s National Land Planning and Utilization Act, the floor ratio was set as 200–300%, the building coverage ratio as 10–50%, the distance between buildings as 0.8 H–1.0 H (where H is the height of the upwind building), the azimuth as WSW, S, ESE [55], and the aspect ratio as 2:1, 4:1 and 6:1. Using the design of experiment orthogonal array table (L27(313)), 27 valid cases were selected from 243 cases in total. Furthermore, the floor area ratio, the building coverage ratio, and the distance between buildings were assumed to have environmental interactions [56].
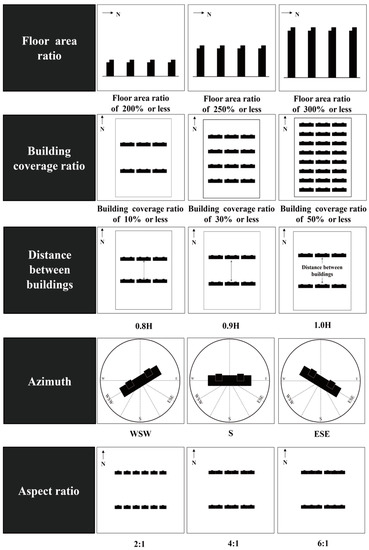
Figure 2.
Layout planning design factors.
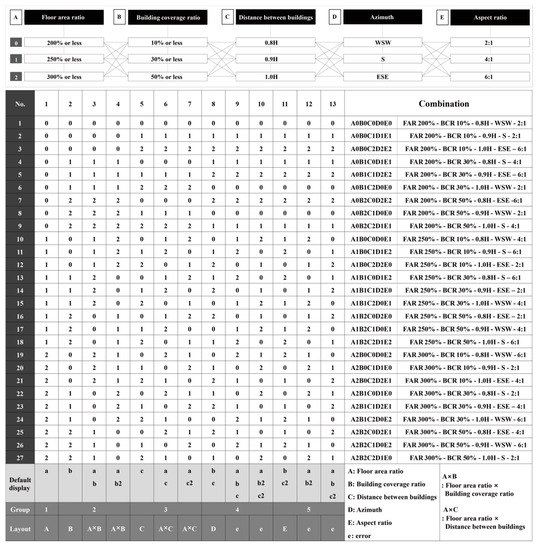
Figure 3.
Case settings of the orthogonal matrix L27(313).
3.2. Case Model Outline
Figure 4 shows the basic model of the case study. The land area is 265 m × 170 m, and residential buildings were planned to have a parallel layout. Furthermore, residential buildings were assumed to be plate type and each household unit area was set to 85 m2 or less, which is the national housing size. The height of each household was set as 2.9 m.
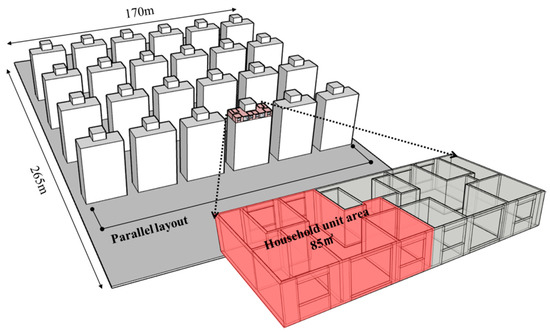
Figure 4.
Simulation case model overview.
3.3. Natural Lighting Simulation Setting Conditions
Figure 5 shows measurement objects for natural lighting simulation. For natural lighting analysis, the living rooms of each household in the lowest, middle, and highest floors of the residential building were selected. The measured area of each household is 4.0 m × 3.9 m, the cell size is 0.5 m, and the number of measurement points is 72. The measurement height for natural lighting is 0.7 m above the floor. The properties of the building materials used for natural lighting simulations are shown in Table 3. The percentages of natural lighting under CIE cloudy sky conditions were measured. Table 4 shows some of the simulation parameters for Daysim, which define the light reflection, optical resolution, etc. [80]. The time of use was set as 08:00 to 18:00 h, and the minimum illuminance was set as 300 lux.
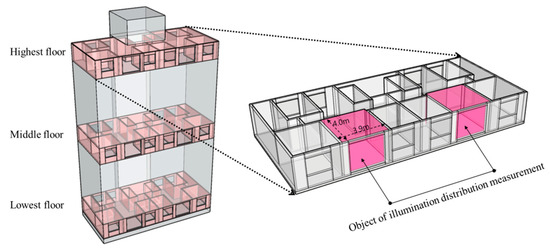
Figure 5.
Object of natural lighting measurement.
Table 3.
Material properties for natural lighting.
Table 4.
Simulation parameters using Daysim.
3.4. Microclimate Modeling Simulation Setting Conditions
Table 5 lists the microclimate modeling simulation conditions. They were evaluated at 14:00 h on 5 August 2017 when the ambient temperature was high [81]. For meteorological data, the Automated Surface Observing System (ASOS) was used. Figure 6 is a depiction of outdoor air temperature (1.2–1.5 m from the surface), relative humidity, wind speed, and solar radiation, among the data collected on 5 August. The dimension of the simulation space was 85 m × 133 m × 52 m, and the grid size was 2 m. The material for the target surface was set as asphalt, and the material of the residential buildings was set as concrete. For the evaluation indices, the atmospheric temperature, mean radiant temperature (MRT), relative humidity, and wind speed were measured at 1.4 m height from the center of the target site. For the meteorological factors, the atmospheric temperature is denoted as Ta, the mean radiant temperature as Tmrt, the relative humidity as RH, and the wind speed as WS in this paper.
Table 5.
ENVI-met execution conditions.
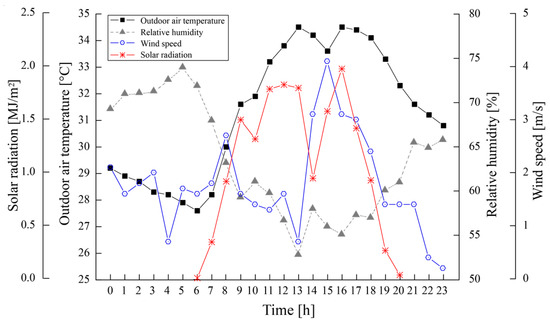
Figure 6.
Weather conditions during micrometeorological modeling simulation.
4. Results
Table 6 shows the meteorological factors used for PET prediction. Ta (°C), RH (%), Tmrt (°C), and WS (m/s) were used to predict the PET. Ta is in the range of 23.9 °C–33.4 °C, Tmrt, in the range of 44.6 °C–48.1 °C, RH in the range of 56.5–81.0%, and WS in the range of 0.3–2.1 m/s. The PET was predicted using these results.
Table 6.
ENVI-met simulation results for 27 cases (meteorological factors).
The simulation results were obtained for 27 cases involving outdoor thermal comfort and natural lighting conditions. Figure 7 shows a graph representing the simulation results of the outdoor thermal comfort and natural lighting for the 27 cases. The Y axis represents the outdoor thermal comfort PET index, and the left side of the Y axis represents the mean DF values corresponding to the natural lighting index.
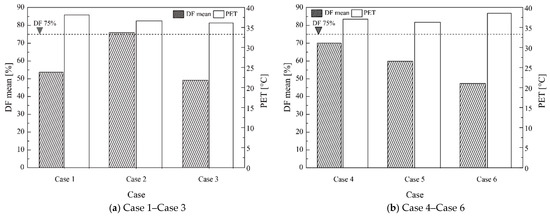
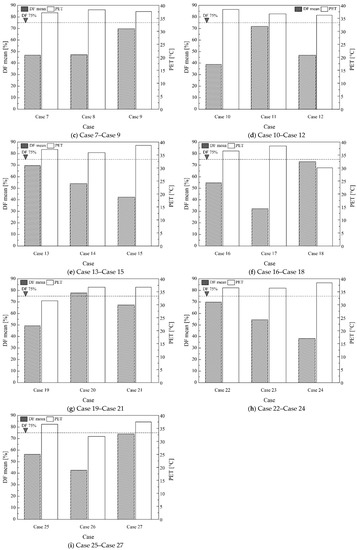
Figure 7.
Simulation results outdoor thermal comfort and natural lighting.
The mean DF value was determined by averaging all the targets’ DF values for each case. The PET is a predicted value taken 1.4 m from the center of the target site. Ta (°C), RH (%), Tmrt (°C), and WS (m/s) were used to predict the PET. Table 6 shows the meteorological factors used for PET prediction.
PET ranges from 30.1 °C to 38.7 °C with a difference of approximately 8.6 °C. Cases 18, 19, and 26 have lower PET values than other cases. In the PET evaluation scale classification, they represent moderate heat stress, and other cases represent great heat stress. The PET value appears high if an apartment complex is planned in accordance with the current Urban Planning Ordinance and the Enforcement Decree of the National Land Planning and Utilization Act. This suggests that to reduce this problem, the outdoor thermal comfort should be improved by applying heat island planning factors in the complex planning stage.
From the results of the DF, the DF ranged from 32.1% to 77.7% with a difference of approximately 45.6%. The cases belonging to DF ≥ 75% are cases 2 and 20. It was noted that the azimuth, among the design factors, leads to different DF results by case. The DF result was the highest in the south (S), followed by ESE, and WSW.
Table 7 shows the correlations of layout design factors with outdoor thermal comfort and natural lighting. To examine the effects of the layout design factors on outdoor thermal comfort and natural lighting, a correlation analysis was conducted using the SPSS statistics application (version 18.0, IBM, Armonk, NY, USA) for the following factors: the number of floors (floor area ratio, building coverage ratio), distance between buildings, azimuth, and aspect ratio.
Table 7.
Layout planning design factors and correlations between outdoor thermal comfort and natural lighting.
Among the design factors, the aspect ratio shows a negative correlation with the outdoor thermal comfort PET index (−0.402). It is thought that a change in building shade on the surface (reflected by the aspect ratio) lowers the solar radiation absorption ratio and changes the surface temperature. The design factor that shows a strong correlation with DF is the azimuth. It has a high negative correlation (−0.812).
5. Review of Outdoor Thermal Comfort Improvement Measures for Natural Lighting
As shown from the analysis results of outdoor thermal comfort and natural lighting, outdoor thermal comfort is improved by the shadowed area. however, natural lighting exhibits a low daylight factor. To obtain the right balance between outdoor thermal comfort and natural lighting, measures to improve the outdoor thermal comfort were investigated by applying heat island mitigation factors to surfaces for the cases satisfying 75% DF (cases 2 and 20).
In this study, outdoor thermal comfort changes were examined by applying greening and reflective asphalt pavements to the outdoor space of the target area [82,83,84]. Table 8 outlines the application of heat island mitigation factors. For the application scope of heat island mitigation factors, 30% (the range of application for greening is based on the urban planning application measures of biotope area factors recommended by the Seoul Metropolitan Government, and 30–60% of large-scale parcels of the class-3 general residential area) of the apartment complex area was set [83]. In addition, 3 m trees were included for greening, and a 0.52 albedo effect was set for the reflective asphalt pavements [84,85].
Table 8.
Outline of heat island mitigation factors.
Figure 8, Table 9 and Table 10 show the results and images, respectively, of applying greening and reflective asphalt pavement plans among the heat island mitigation plans. The images are the simulation result images of Ta and Tmrt.
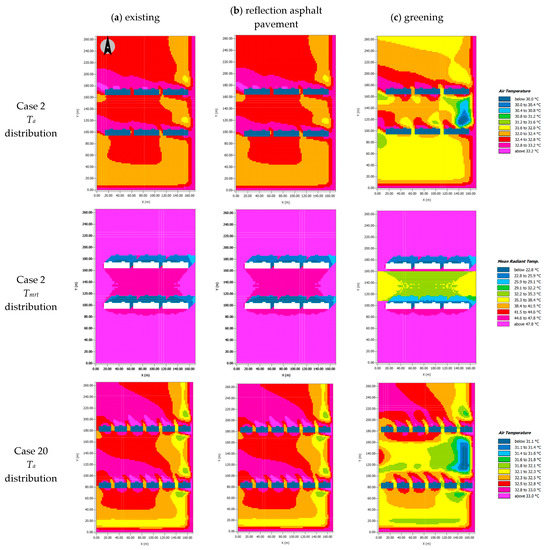
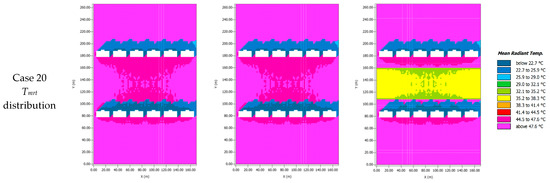
Figure 8.
Outdoor thermal comfort results of applying greening (3 m trees) and reflection asphalt pavement.
Table 9.
Results of applying the heat island mitigation plan.
Table 10.
ENVI-met results of simulations applying greening and reflective asphalt pavement (meteorological factors).
The PET value obtained by applying the reflective asphalt pavement is almost identical to the existing PET value. On the PET evaluation scale, the stress stage is great heat stress, which is the same as the current stress stage. When a reflective asphalt pavement is planned, if there is a surface at the measurement point that has no shadow, the reflected radiation increases Tmrt during the day and lowers the thermal comfort of pedestrians. It helps to add trees in places where there is no shade [86].
As a result of applying a greening plan, the temperature decreased by 3.0 °C in Case 2 and by 1.9 °C in Case 20. Furthermore, the stress stage is moderate heat stress, which is lower than the current stress stage. The shadows generated by the trees lowered the solar heat gain of the surface and the evapotranspiration lowered the dry bulb temperature and increased the latent heat cooling effect. This result suggests that greening can decrease Ta, improve the microclimate, and reduce heat island effects. Similar to the result of this study, the existing literature also concluded that greening (3 m trees) produces better effects on lowering the surface and air temperatures and mitigates the heat island phenomenon, compared with other factors [86,87,88,89,90,91].
6. Conclusions
This study investigated measures to balance outdoor thermal comfort and natural lighting conditions by performing simulations for various cases by applying layout design factors for apartment complexes.
Outdoor thermal comfort and natural lighting were analyzed for a total of 27 cases. The DF ranged from 32.1% to 77.7%, with a difference of approximately 45.6%. The design factor that showed the largest effect on natural lighting was the azimuth. In particular, the South showed the highest value of DF (S > ESE > WSW). Among the 27 cases, two cases satisfied the 75% condition for DF (cases 2 and 20).
The PET value appears high if an apartment complex is planned in accordance with Korea’s current Urban Planning Ordinance and the Enforcement Decree of the National Land Planning and Utilization Act. This suggests that to reduce this problem, the outdoor thermal comfort should be improved by applying heat island planning factors in the complex planning stage.
A correlation analysis was performed to investigate the effects of the layout planning design factors on outdoor thermal comfort and natural lighting in apartment complexes. Among the design factors affecting outdoor thermal comfort, the aspect ratio showed strong correlation with PET (−0.402). The design factor affecting natural lighting is the azimuth, which showed a high correlation (−0.812). This result indicates that layout design factors should be considered to obtain a reasonable balance between indoor natural lighting and outdoor thermal comfort.
To obtain measures that satisfy both outdoor thermal comfort and natural lighting conditions, an outdoor thermal comfort improvement plan that considers natural lighting was examined. Greening (3 m trees) and reflective asphalt pavement, which are heat island mitigation factors, were applied to two cases (cases 2 and 20), and reductions in outdoor thermal comfort were examined.
The PET value obtained by applying the reflective asphalt pavement was essentially identical to the existing PET value of normal asphalt. This confirms that the degree of improvement of reflective pavement can vary based on the location of shadows. When greening was applied, the temperature decreased by 3.0 °C in Case 2 and by 1.9 °C in Case 20, thus improving outdoor thermal comfort. Furthermore, the stress stage decreased compared to the current stage (asphalt) from great to moderate heat stress.
The findings of this study indicate that to improve the social and economic problems caused by the less-than-ideal residential environment resulting from urbanization, new designs should first consider the layout plan. Furthermore, this study confirmed that a greening plan together with a layout plan can achieve a suitable balance between indoor and outdoor environment conditions. The significance of this study is that it shows the possibility of obtaining improvement measures through the combined consideration of outdoor thermal comfort and natural lighting. Further, the results of this study can be used as basic data for architectural planning and policy making.
Author Contributions
S.J. and S.Y. conceived and designed the measurements; S.J. performed the measurements and simulation analyzed the data. S.J. visualized the results. S.J. wrote the paper with the help from S.Y. All authors contributed to the final version of the manuscript by proofreading and bringing in constructive ideas.
Funding
This research received no external funding.
Acknowledgments
This study was financially supported by the 2017 Post-Doc. Development Program of Pusan National University. And This research was supported by Basic Science Research Program through the National Research Foundation of Korea (NRF) funded by the Ministry of Science, ICT & Future Planning (NRF-2017R1E1A1A01074904).
Conflicts of Interest
The authors declare no conflict of interest.
Nomenclature
| Ta | atmospheric temperature (°C) |
| Tmrt | mean radiant temperature (°C) |
| RH | relative humidity (%) |
| WS | wind speed (m/s) |
References
- Kim, H. A Study on the Evaluation of Residential Environment Improvement Program: Focused on Multi-family Housing Building Method; Korean Urban Management Association: Seoul, Korea, 2002; Volume 15, pp. 53–67. [Google Scholar]
- Ashtiani, A.; Mirzaei, P.A. Indoor thermal condition in urban heat island: Comparison of the artificial neural network and regression methods prediction. Energy Build. 2014, 76, 597–604. [Google Scholar] [CrossRef]
- Mizaei, P.A.; Haghighat, F. Approaches to study Urban Heat Island-abilities and limitations. Build. Environ. 2010, 45, 2192–2201. [Google Scholar] [CrossRef]
- Gago, E.J.; Roldan, J.; Pacheco-Torres, R.; Ordóñez, J. The city and urban heat island: A review of strategies to mitigate adverse effects. Renew. Sustain. Energy Rev. 2013, 25, 749–758. [Google Scholar] [CrossRef]
- Lim, M.; Jo, S.; Dong, J. A Comparative Study on Laws of Korea and Japan. J. Archit. Inst. Korea 2018, 38, 231–234. [Google Scholar]
- Yoo, G. Review of overseas standards for daylight in buildings and ways for institutional improvement. Real Estate Focus 2012, 53, 44–63. [Google Scholar]
- Lobaccaro, G.; Frontini, F. Solar energy in urban environment: How urban densification affects existing buildings. Energy Procedia 2014, 48, 1559–1569. [Google Scholar] [CrossRef]
- Villalba, A.; Pattini, A.; Correa, E. An approach to urban tree daylight permeability simulation using models based on louvers. Build. Environ. 2014, 73, 75–87. [Google Scholar] [CrossRef]
- Sanaieian, H.; Tenpierik, M.; Linden, K.; Mehdizadeh, S.; Mofidi, S. Review of the impact of urban block form on thermal performance, solar access and ventilation. Renew. Sustain. Energy Rev. 2014, 38, 551–560. [Google Scholar] [CrossRef]
- Acosta, L.; Navarro, J.; Sendra, J. Lighting design in courtyards: Predictive method of daylight factors under overcast sky conditions. Renew. Energy 2014, 71, 243–254. [Google Scholar] [CrossRef]
- Johansson, M.; Pedersen, E.; Maleetipwan, M.; Kuhn, L.; Laike, T. Perceived outdoor lighting quality (POLQ): A lighting assessment tool. J. Environ. Psychol. 2014, 39, 14–21. [Google Scholar] [CrossRef]
- Al-Obaidi, K.; Lsmail, M.; Abdul, R. A study of the impact of environmental loads that penetrate a passive skylight roofing system in Malaysian buildings. Front. Archit. Res. 2014, 3, 178–191. [Google Scholar] [CrossRef]
- He, X.; Miao, S.; Shen, S.; Li, J.; Zhang, B.; Zhang, Z.; Chen, X. Influence of sky view factor on outdoor thermal environment and physiological equivalent temperature. Int. J. Biometeorol. 2014, 59, 285–297. [Google Scholar] [CrossRef] [PubMed]
- Tatiana, Y.; Neander, S.; Ecilamar, L. Computer simulation applied to the design of urban public spaces: Day lighting in the squares. Emerg. Trends Comp. Inform. Syst. Sci. Eng. 2013, 949–963. [Google Scholar]
- Lamnatou, C.; Chemisana, D. Solar radiation manipulations and their role in greenhouse claddings: Fluorescent solar concentrators, photoselective and other materials. Renew. Sustain. Energy Rev. 2013, 27, 175–190. [Google Scholar] [CrossRef]
- Li, D.; Chau, N.; Wan, K. Predicting daylight illuminance and solar irradiance on vertical surfaces based on classified standard skies. Energy 2013, 53, 252–258. [Google Scholar] [CrossRef]
- Christoph, F.; Timur, D.; Alstan, J.; Tarek, R.; Andrew, S. UMI—An urban simulation environment for building energy use, Daylighting and Walkability. In Proceedings of the 13th Conference of IBPSA, Le Bourget Du Lac, France, 25–30 August 2013; pp. 476–483. [Google Scholar]
- Ivanova, S. Estimation of background diffuse irradiance on orthogonal surfaces under partially obstructed anisotropic sky. Sol. Energy 2013, 95, 376–391. [Google Scholar] [CrossRef]
- Andersen, M.; Gochenour, S.; Lockley, S. Modelling ‘non-visual’ effects of daylighting in a residential environment. Build. Environ. 2013, 70, 138–149. [Google Scholar] [CrossRef]
- Anne, I.; Nicolas, R.; Mette, H.; Michael, J.; Jens, C.; Werner, O.; Kjeld, J. Daylight Calculations in Practice: An Investigation of the Ability of Nine Daylight Simulation Programs to Calculate the Daylight Factor in Five Typical Rooms; Danish Building Research Institute, Aalborg University: Aalborg, Denmark, 2013; p. 26. [Google Scholar]
- Acosta, L.; Navarro, J.; Sendra, J. Daylighting design with lightscoop skylights: Towards an optimization of shape under overcast sky conditions. Energy Build. 2013, 60, 232–238. [Google Scholar] [CrossRef]
- De la Flor, F.; Ortiz, C.; Luis, F.; Alvarez, D. Solar radiation calculation methodology for building exterior surfaces. Sol. Energy 2004, 79, 513–522. [Google Scholar] [CrossRef]
- Nasrollahi, N.; Shokri, E. Daylight illuminance in urban environments for visual comfort and energy performance. Renew. Sustain. Energy Rev. 2016, 66, 861–874. [Google Scholar]
- Eltbaakh, Y.; Ruslan, M.; Alghoul, M.; Othman, M.; Sopian, K.; Fadhel, M. Measurement of total and spectral solar irradiance: Overview of existing research. Renew. Sustain. Energy Rev. 2010, 15, 1409–1426. [Google Scholar]
- Strømann-Andersen, J.; Sattrup, P. The urban canyon and building energy use: Urban density versus daylight and passive solar gains. Energy Build. 2011, 43, 2011–2020. [Google Scholar] [CrossRef]
- Li, D.; Cheung, K.; Tang, H.; Cheng, C.; Li Danny, H.; Cheng Charles, C. Identifying CIE standard skies using vertical sky component. J. Atmos. Sol. Terr. Phys. 2011, 73, 1861–1867. [Google Scholar] [CrossRef]
- Martin, H.; Tamás, G.; János, U.; Adreas, M. Comparison of models calculating the sky view factor used for urban climate investigations. J. Theor. Appl. Climatol. 2011, 105, 521–527. [Google Scholar]
- Li, D.; Cheung, G.; Cheung, K.; Lam, T. Determination of vertical daylight illuminance under non-overcast sky conditions. Build. Environ. 2009, 45, 498–508. [Google Scholar] [CrossRef]
- Pérez-Burgos, A.; de Miguel, A.; Bilbao, J. Daylight illuminance on horizontal and vertical surfaces for clear skies. Case study of shaded surfaces. Sol. Energy 2010, 84, 137–143. [Google Scholar] [CrossRef]
- Li, D. A review of daylight illuminance determinations and energy implications. Appl. Energy 2010, 87, 2109–2118. [Google Scholar] [CrossRef]
- Ann, R. Considerations for lighting in the built environment: Non-visual effects of light. Energy Build. 2006, 38, 721–727. [Google Scholar]
- Cárdenas, J. Thermal characterisation of urban fabrics using GIS and Townscope modelling tool. In Proceedings of the 4th European Conference on Energy Performance & Indoor Climate in Buildings (EPIC), Lyon, France, 20–22 November 2006. [Google Scholar]
- Coma, J.; Pérez, G.; de Gracia, A.; Burés, S.; Urrestarazu, M.; Cabeza, L. Vertical greenery systems for energy savings in buildings: A comparative study between green walls and green facades. Build. Environ. 2016, 111, 228–237. [Google Scholar] [CrossRef]
- Squier, M.; Davidson, C. Heat flux and seasonal thermal performance of an extensive green roof. Build. Environ. 2016, 107, 235–244. [Google Scholar] [CrossRef]
- Taleghani, M.; Tenpierik, M.; Dobbelsteen, A. Indoor thermal comfort in urban courtyard block dwellings in the Netherlands. Build. Environ. 2014, 82, 556–579. [Google Scholar] [CrossRef]
- Santos Nouri, A.; Costa, J.P.; Santamouris, M.; Matzarakis, A. Approaches to Outdoor Thermal Comfort Thresholds through Public Space Design. Atmosphere 2018, 9, 108. [Google Scholar] [CrossRef]
- Golasi, I.; Salata, F.; de Lieto Vollaro, E.; Coppi, M. Complying with the demand of standardization in outdoor thermal comfort: A first approach to the Global Outdoor Comfort Index (GOCI). Build. Environ. 2018, 130, 104–119. [Google Scholar] [CrossRef]
- Nikolopoulou, M.; Lykoudis, S. Thermal comfort in outdoor urban spaces: Analysis across different European countries. Build. Environ. 2006, 41, 1455–1470. [Google Scholar] [CrossRef]
- Golasi, I.; Salata, F.; de Lieto Vollaro, E.; Coppi, M.; de Lieto Vollaro, A. Thermal perception in the Mediterranean area: Comparing the Mediterranean Outdoor Comfort Index (MOCI) to other outdoor thermal comfort indices. Energies 2016, 9, 550. [Google Scholar] [CrossRef]
- Brode, P.; Fiala, D.; Blazejczyk, K.; Holmer, I.; Jendritzky, G.; Kampmann, B.; Tinz, B.; Havenith, G. Deriving the operational procedure for the Universal Thermal Climate Index (UTCI). Int. J. Biometeorol. 2012, 56, 481–494. [Google Scholar] [CrossRef] [PubMed]
- Bourbia, F.; Awbi, H. Building cluster and shading in urban canyon for hot dry climate: Part 1: Air and surface temperature measurements. Renew. Energy 2004, 29, 249–262. [Google Scholar] [CrossRef]
- Bourbia, F.; Awbi, H. Building cluster and shading in urban canyon for hot dry climate: Part 2: Shading simulations. Renew. Energy 2004, 29, 291–301. [Google Scholar] [CrossRef]
- Ali-Toudert, F.; Mayer, H. Effects of asymmetry, galleries, overhanging façades and vegetation on thermal comfort in urban street canyons. Int. Sol. Energy Soc. 2006, 81, 742–754. [Google Scholar] [CrossRef]
- Yang, F.; Lau Stephen, S.; Qian, F. Urban design to lower summertime outdoor temperatures: An empirical study on high-rise housing in Shanghai. Build. Environ. 2010, 46, 769–785. [Google Scholar] [CrossRef]
- Mackey, C.; Lee, X.; Smith Ronald, B. Remotely sensing the cooling effects of city scale efforts to reduce urban heat island. Build. Environ. 2011, 49, 348–358. [Google Scholar] [CrossRef]
- Chow, W.; Brazel, A. Assessing xeriscaping as a sustainable heat island mitigation approach for a desert city. Build. Environ. 2011, 47, 170–181. [Google Scholar] [CrossRef]
- Shashua, B.; Tsiros, I.; Hoffman, M. Passive cooling design options to ameliorate thermal comfort in urban streets of a Mediterranean climate (Athens) under hot summer conditions. Build. Environ. 2012, 57, 110–119. [Google Scholar] [CrossRef]
- Wong, N.; Kardinal, J.; Aung, L.; Kyaw, T.; Syatia, N.; Xuchao, W. Environmental study of the impact of greenery in an institutional campus in the tropics. Build. Environ. 2006, 42, 2949–2970. [Google Scholar] [CrossRef]
- Berry, R.; Livesley, S.; Aye, L. Tree canopy shade impacts on solar irradiance received by building walls and their surface temperature. Build. Environ. 2013, 69, 91–100. [Google Scholar] [CrossRef]
- Klemm, W.; Heusinkveld, B.; Lenzholzer, S.; Jacobs, M.; Van Hove, B. Psychological and physical impact of urban green spaces on outdoor thermal comfort during summertime in The Netherlands. Build. Environ. 2014, 83, 120–128. [Google Scholar] [CrossRef]
- Cohen, P.; Potchter, O.; Matzarakis, A. Daily and seasonal climatic conditions of green urban open spaces in the Mediterranean climate and their impact on human comfort. Build. Environ. 2011, 51, 285–295. [Google Scholar] [CrossRef]
- Yang, W.; Wong, N.; Jusuf, S. Thermal comfort in outdoor urban spaces in Singapore. Build. Environ. 2012, 581, 426–435. [Google Scholar] [CrossRef]
- Salata, F.; Golasi, I.; Lieto Vollaro, R.; de Lieto Vollaro, A. Outdoor thermal comfort in the Mediterranean area: A transversal study in Rome, Italy. Build. Environ. 2015, 96, 46–61. [Google Scholar] [CrossRef]
- Niu, J.; Liu, J.; Lee, T.; Lin, Z.; Mak, C.; Tse, K.; Tang, B.; Kwok, K. A new method to assess spatial variations of outdoor thermal comfort: Onsite monitoring results and implications for precinct planning. Build. Environ. 2015, 91, 263–270. [Google Scholar] [CrossRef]
- Jung, S.; Yoon, S. Analysis of the Effects of Distance between Buildings and Orientation of Plate-Type Apartment Buildings on Sunlight Exposure and External Surface Temperature. J. Reg. Assoc. Archit. Inst. Korea 2015, 17, 31–38. [Google Scholar]
- Jung, S.; Yoon, S. Changes in sunlight and outdoor thermal environment conditions based on the layout plan of flat type apartment houses. Energies 2015, 8, 9155–9172. [Google Scholar] [CrossRef]
- D’Ambrosio Alfano, F.R.; Olesen, B.W.; Palella, B.I. Povl Ole Fanger’s Impact Ten Years Later. Energy Build. 2017, 152, 243–249. [Google Scholar] [CrossRef]
- De Freitas, C.R.; Grigorieva, E.A. A comprehensive catalogue and classification of human thermal climate indices. Int. J. Biometeorol. 2015, 59, 109–120. [Google Scholar] [CrossRef] [PubMed]
- Epstein, Y.; Moran, D.S. Thermal comfort and the heat stress indices. Ind. Health 2006, 44, 388–398. [Google Scholar] [CrossRef] [PubMed]
- Höppe, P. The physiological equivalent temperature—A universal index for the biometeorological assessment of the thermal environment. Int. J. Biometeorol. 1999, 43, 71–75. [Google Scholar] [CrossRef] [PubMed]
- Matzarakis, A.; Mayer, H.; Iziomon, MG. Application of a universal thermal index: Physiological equivalent temperature. Int. J. Biometeorol. 1999, 43, 76–84. [Google Scholar] [CrossRef] [PubMed]
- Mayer, H.; Höppe, P. Thermal comfort of man in different urban environments. Theor. Appl. Climatol. 1987, 38, 43–49. [Google Scholar] [CrossRef]
- National Institute of Environmental Research, Ministry of Environment Home Page. Available online: http://eng.me.go.kr/eng/web/main.do (accessed on 17 July 2018).
- Gulyás, A.; Unger, J.; Matzarakis, A. Assessment of the microclimatic and human comfort conditions in a complex urban environment: Modelling and measurements. Build. Environ. 2006, 41, 1713–1722. [Google Scholar] [CrossRef]
- Kántor, N.; Unger, J. Benefits and opportunities of adopting GIS in thermal comfort studies in resting places: An urban park as an example. Landsc. Urban Plan 2010, 98, 36–46. [Google Scholar] [CrossRef]
- Lin, T.-P.; Matzarakis, A.; Hwang, R.-L. Shading effect on long-term outdoor thermal comfort. Build. Environ. 2010, 45, 213–221. [Google Scholar] [CrossRef]
- Matzarakis, A.; Endler, C. Climate change and thermal bioclimate in cities: Impacts and options for adaptation in Freiburg, Germany. Int. J. Biometeorol. 2010, 54, 479–483. [Google Scholar] [CrossRef] [PubMed]
- Thorsson, S.; Lindberg, F.; Eliasson, I.; Holmer, B. Different methods for estimating the mean radiant temperature in an outdoor urban setting. Int. J. Climatol. 2007, 27, 1983–1993. [Google Scholar] [CrossRef]
- CIE Home Page. Available online: http://www.cie.co.at/publications/cie-standard-overcast-sky-and-clear-sky (accessed on 17 July 2018).
- Lighting Control and Daylight Use; H.M. Stationery Office: London, UK, 1983; p. 272.
- Littlefair, P.J. Average Daylight Factor: A Simple Basis for Daylight Design; Building Research Establishment: Garston, Watford, UK, 1988; p. 15. [Google Scholar]
- Littlefair, P.J. Measuring Daylight; Building Research Establishment: Watford, UK, 1993; p. 23. [Google Scholar]
- Choi, S.; Shin, S.; Seo, D. Evaluation of daylighting performance in office building with detailed global illuminance data of selected Korean cities. J. Korean Sol. Energy Soc. 2016, 36, 37–46. [Google Scholar] [CrossRef]
- Choi, H. Diffusion simulation using Envi-Met. in urban planetary boundary layer. Korean Soc. Clim. Chang. Res. 2016, 7, 357–371. [Google Scholar] [CrossRef]
- ENVI_MET Home Page. Available online: http://www.envi-met.com/introduction (accessed on 16 June 2018).
- Kim, H.; Yun, G.; Kim, K. Evaluation of Lighting Energy Saving Rate in a Small Office Space. J. Korean Sol. Energy Soc. 2012, 32, 50–58. [Google Scholar] [CrossRef]
- DAYSIM. Available online: http://daysim.ning.com/ (accessed on 24 February 2018).
- Jakubiec, J.A.; Reinhart, C.F. A method for predicting city-wide electricity gains from photovoltaic panels based on LiDAR and GIS data combined with hourly Daysim simulations. Sol. Energy 2013, 93, 127–143. [Google Scholar] [CrossRef]
- Bellia, L.; Pedace, A.; Fragliasso, F. The impact of the software’s choice on dynamic daylight simulations’ results: A comparison between Daysim and 3ds Max Design®. Sol. Energy 2015, 122, 249–263. [Google Scholar] [CrossRef]
- Sung, W.P.; Kao, J.C.M.; Chen, R. Environment, Energy and Sustainable Development; CRC Press: Boca Raton, FL, USA, 2013. [Google Scholar]
- Choi, H. Thermal Comfort Evaluation Using the Envi-Met: Micro Climate Model. J. Korean Inst. Archit. Sustain. Environ. Build. Syst. 2016, 10, 416–427. [Google Scholar]
- Jung, S.; Yoon, S. Changes in outdoor thermal environment during summer according to surface materials of apartment housing block. J. Archit. Inst. Korea 2017, 8, 29–36. [Google Scholar]
- Ng, E.; Chen, L.; Wang, Y.; Yuan, C. A study on the cooling effects of greening in a high-density city: An experience from Hong Kong. Build. Environ. 2011, 47, 256–271. [Google Scholar] [CrossRef]
- Qin, Y. A review on the development of cool pavements to mitigate urban heat island effect. Renew. Sustain. Energy Rev. 2015, 52, 445–459. [Google Scholar] [CrossRef]
- Anak Guntor, N.A.; Md Din, M.F.; Ponraj, M.; Lwao, K. Thermal performance of developed coating material as cool pavement material for tropical regions. J. Mater. Civ. Eng. 2014, 26, 755–760. [Google Scholar] [CrossRef]
- Taleghani, M.; Sailor, D.; A Ban-Weiss, G. Micrometeorological simulations to predict the impacts of heat mitigation strategies on pedestrian thermal comfort in a Los Angeles neighborhood. Environ. Res. Lett. 2016, 11, 024003. [Google Scholar] [CrossRef]
- Armson, D.; Stringer, P.; Ennos, A. The effect of tree shade and grass on surface and globe temperatures in an urban area. Urban For. Urban Green. 2012, 11, 245–255. [Google Scholar] [CrossRef]
- Liding, C.; Ranhao, S.; Zhifeng, W.; Yening, W.; Fanhua, K. The impact of greenspace on thermal comfort in a residential quarter of Beijing, China. Int. J. Environ. Res. Public Health 2016, 13, 1217. [Google Scholar]
- Lee, H.; Mayer, H.; Chen, L. Contribution of trees and grasslands to the mitigation of human heat stress in a residential district of Freiburg, Southwest Germany. Landsc. Urban Plan. 2015, 148, 37–50. [Google Scholar] [CrossRef]
- Skelhorn, C.; Lindley, S.; Levermore, G. The impact of vegetation types on air and surface temperatures in a temperate city: A fine scale assessment in Manchester, UK. Landsc. Urban Plan. 2013, 121, 129–140. [Google Scholar] [CrossRef]
- Chen, L.; Ng, E. Simulation of the effect of downtown greenery on thermal comfort in subtropical climate using PET index: A case study in Hong Kong. Archit. Sci. Rev. 2012, 56, 297–305. [Google Scholar] [CrossRef]


© 2018 by the authors. Licensee MDPI, Basel, Switzerland. This article is an open access article distributed under the terms and conditions of the Creative Commons Attribution (CC BY) license (http://creativecommons.org/licenses/by/4.0/).