A Novel Method of Kinetic Analysis and Its Application to Pulverized Coal Combustion under Different Oxygen Concentrations


Abstract
1. Introduction
2. Methodology
2.1. DIM Method
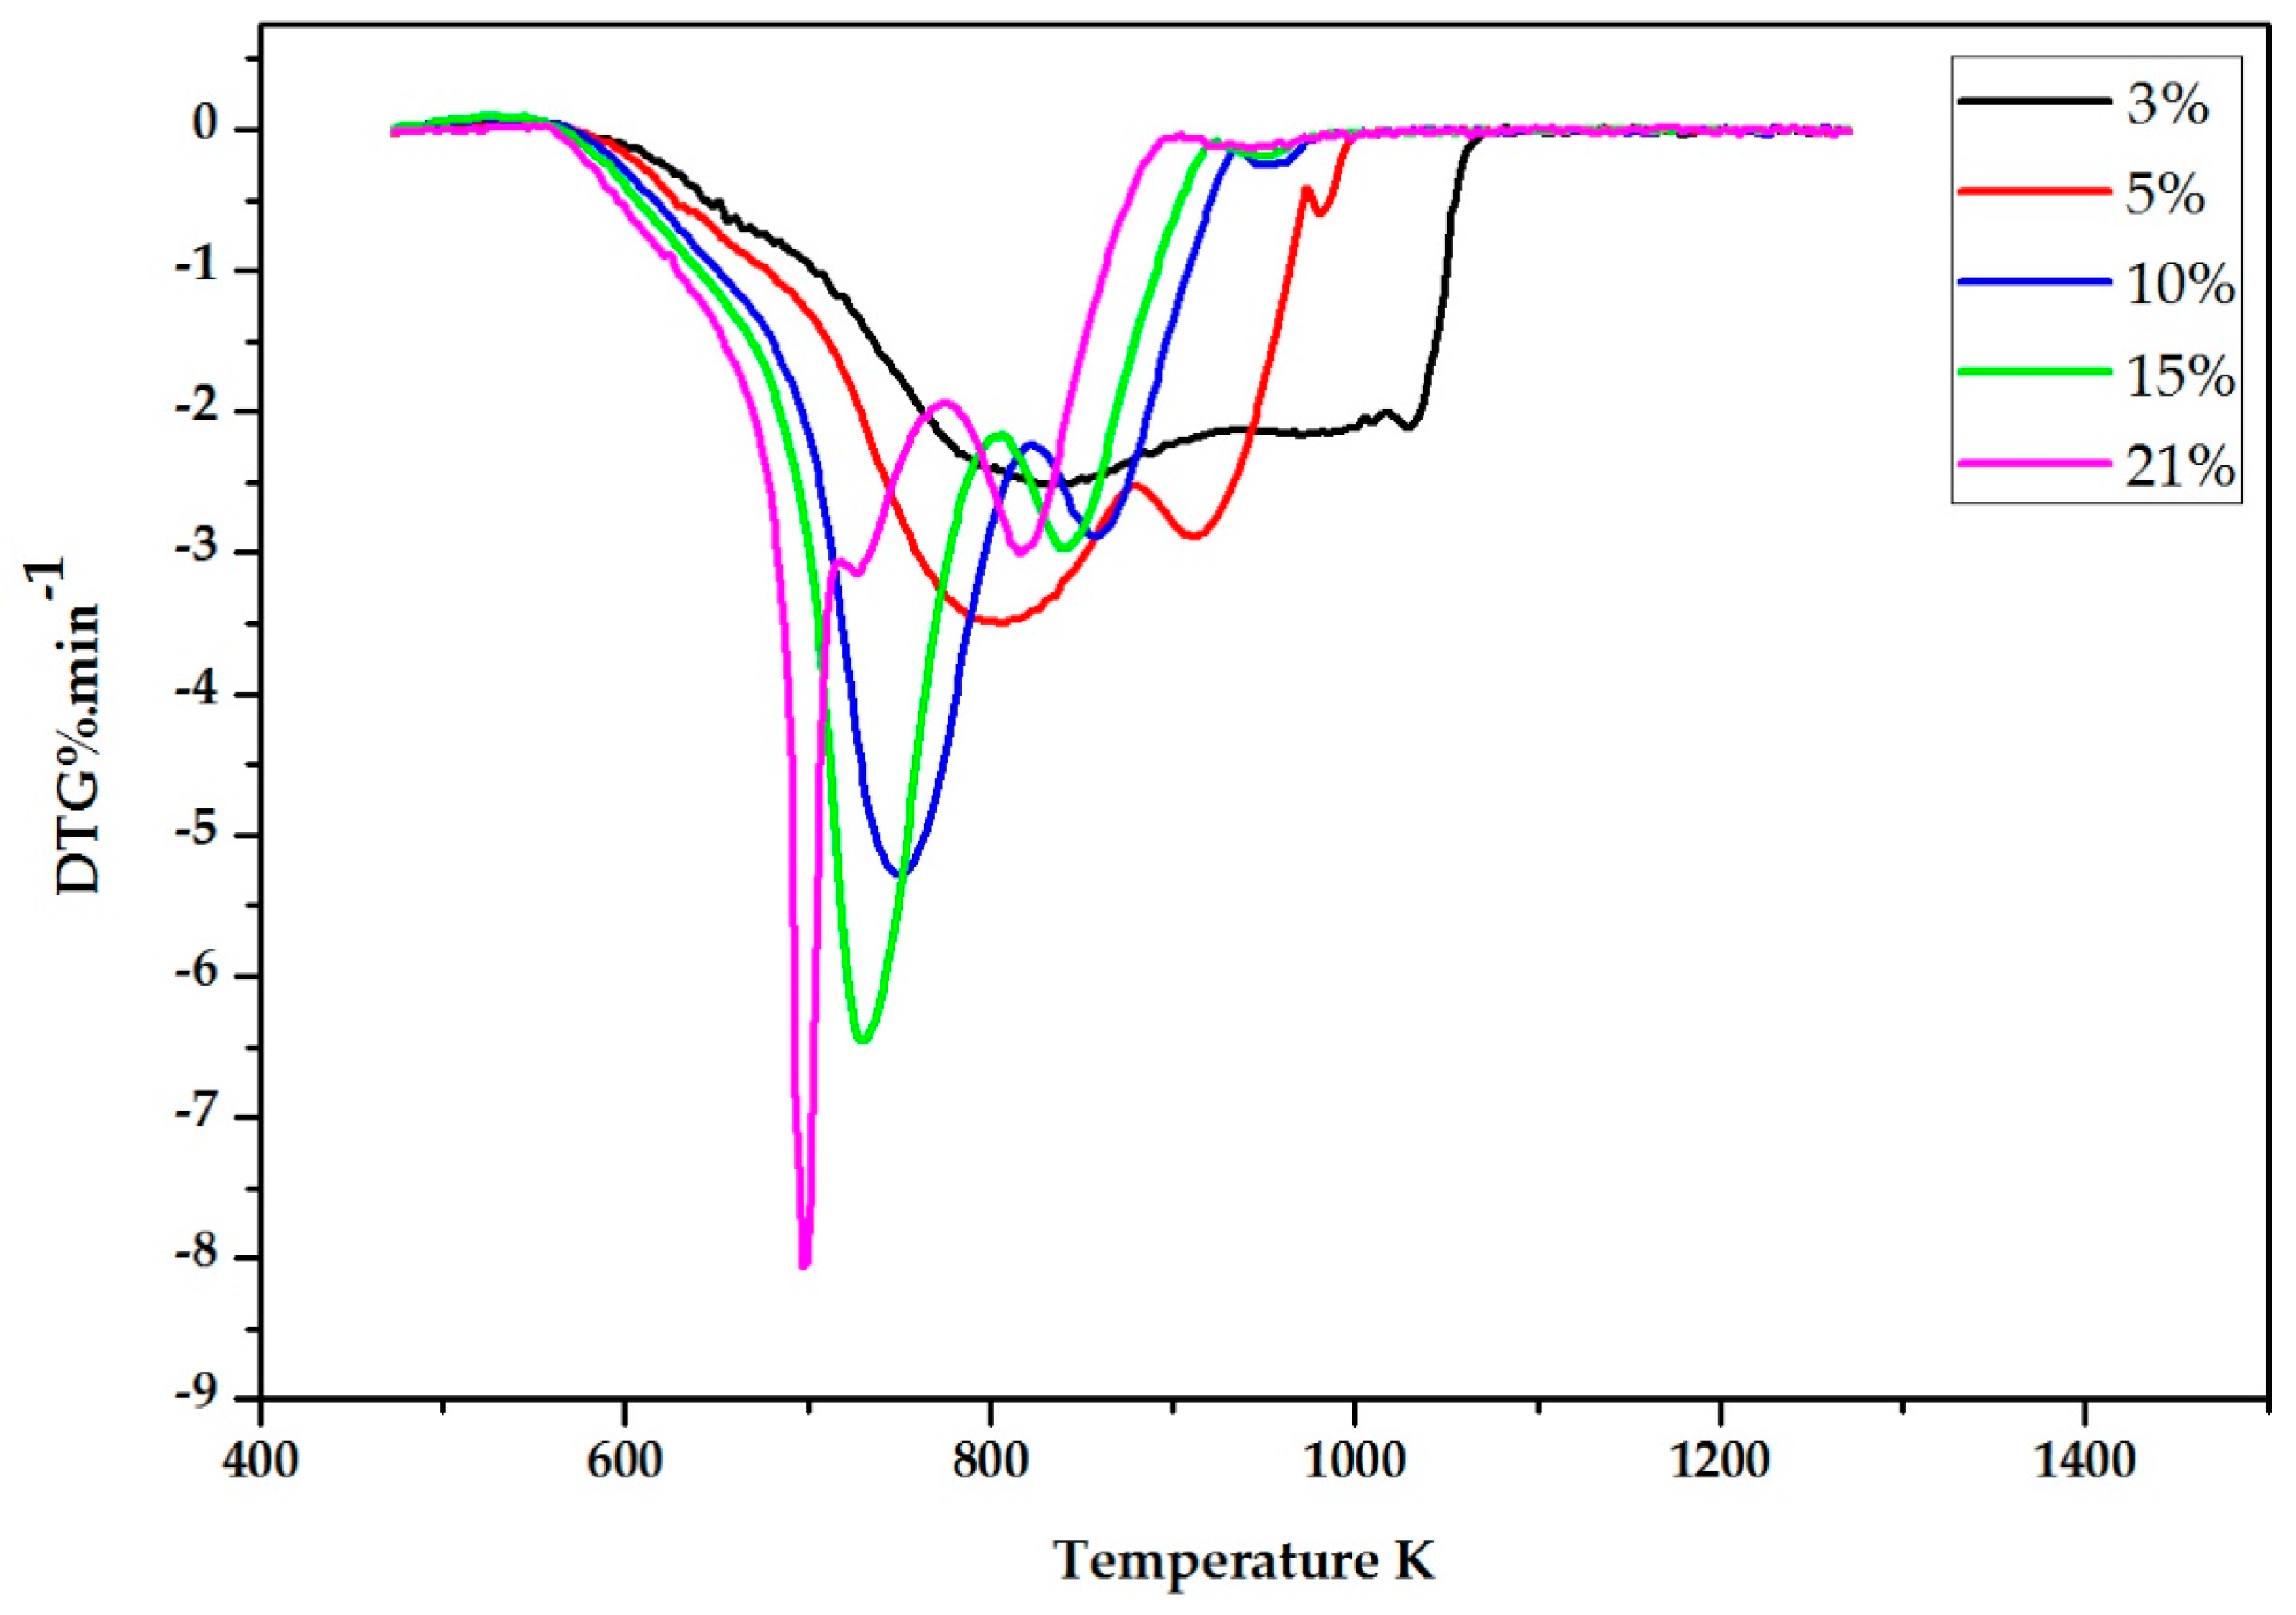
2.2. Experimental Results
3. The DIM Method Application and Discussion
4. Validation
5. Conclusions
- A formula combining differential and integral was deduced through an analytical approach, which can offset the defects of a single differential or integral method.
- In the application of the DIM method of pulverized coal combustion under different O2 concentrations (3%, 5%, 10%, 15%, and 21%), E, A, and O2 concentration exponent n were calculated as 258,164 J/mol, 6.660 × 10¹⁷ s−1, and 3.326, respectively, and the mechanism function was determined as the Avrami-Erofeev equation. Subsequently, the kinetic model was obtained.
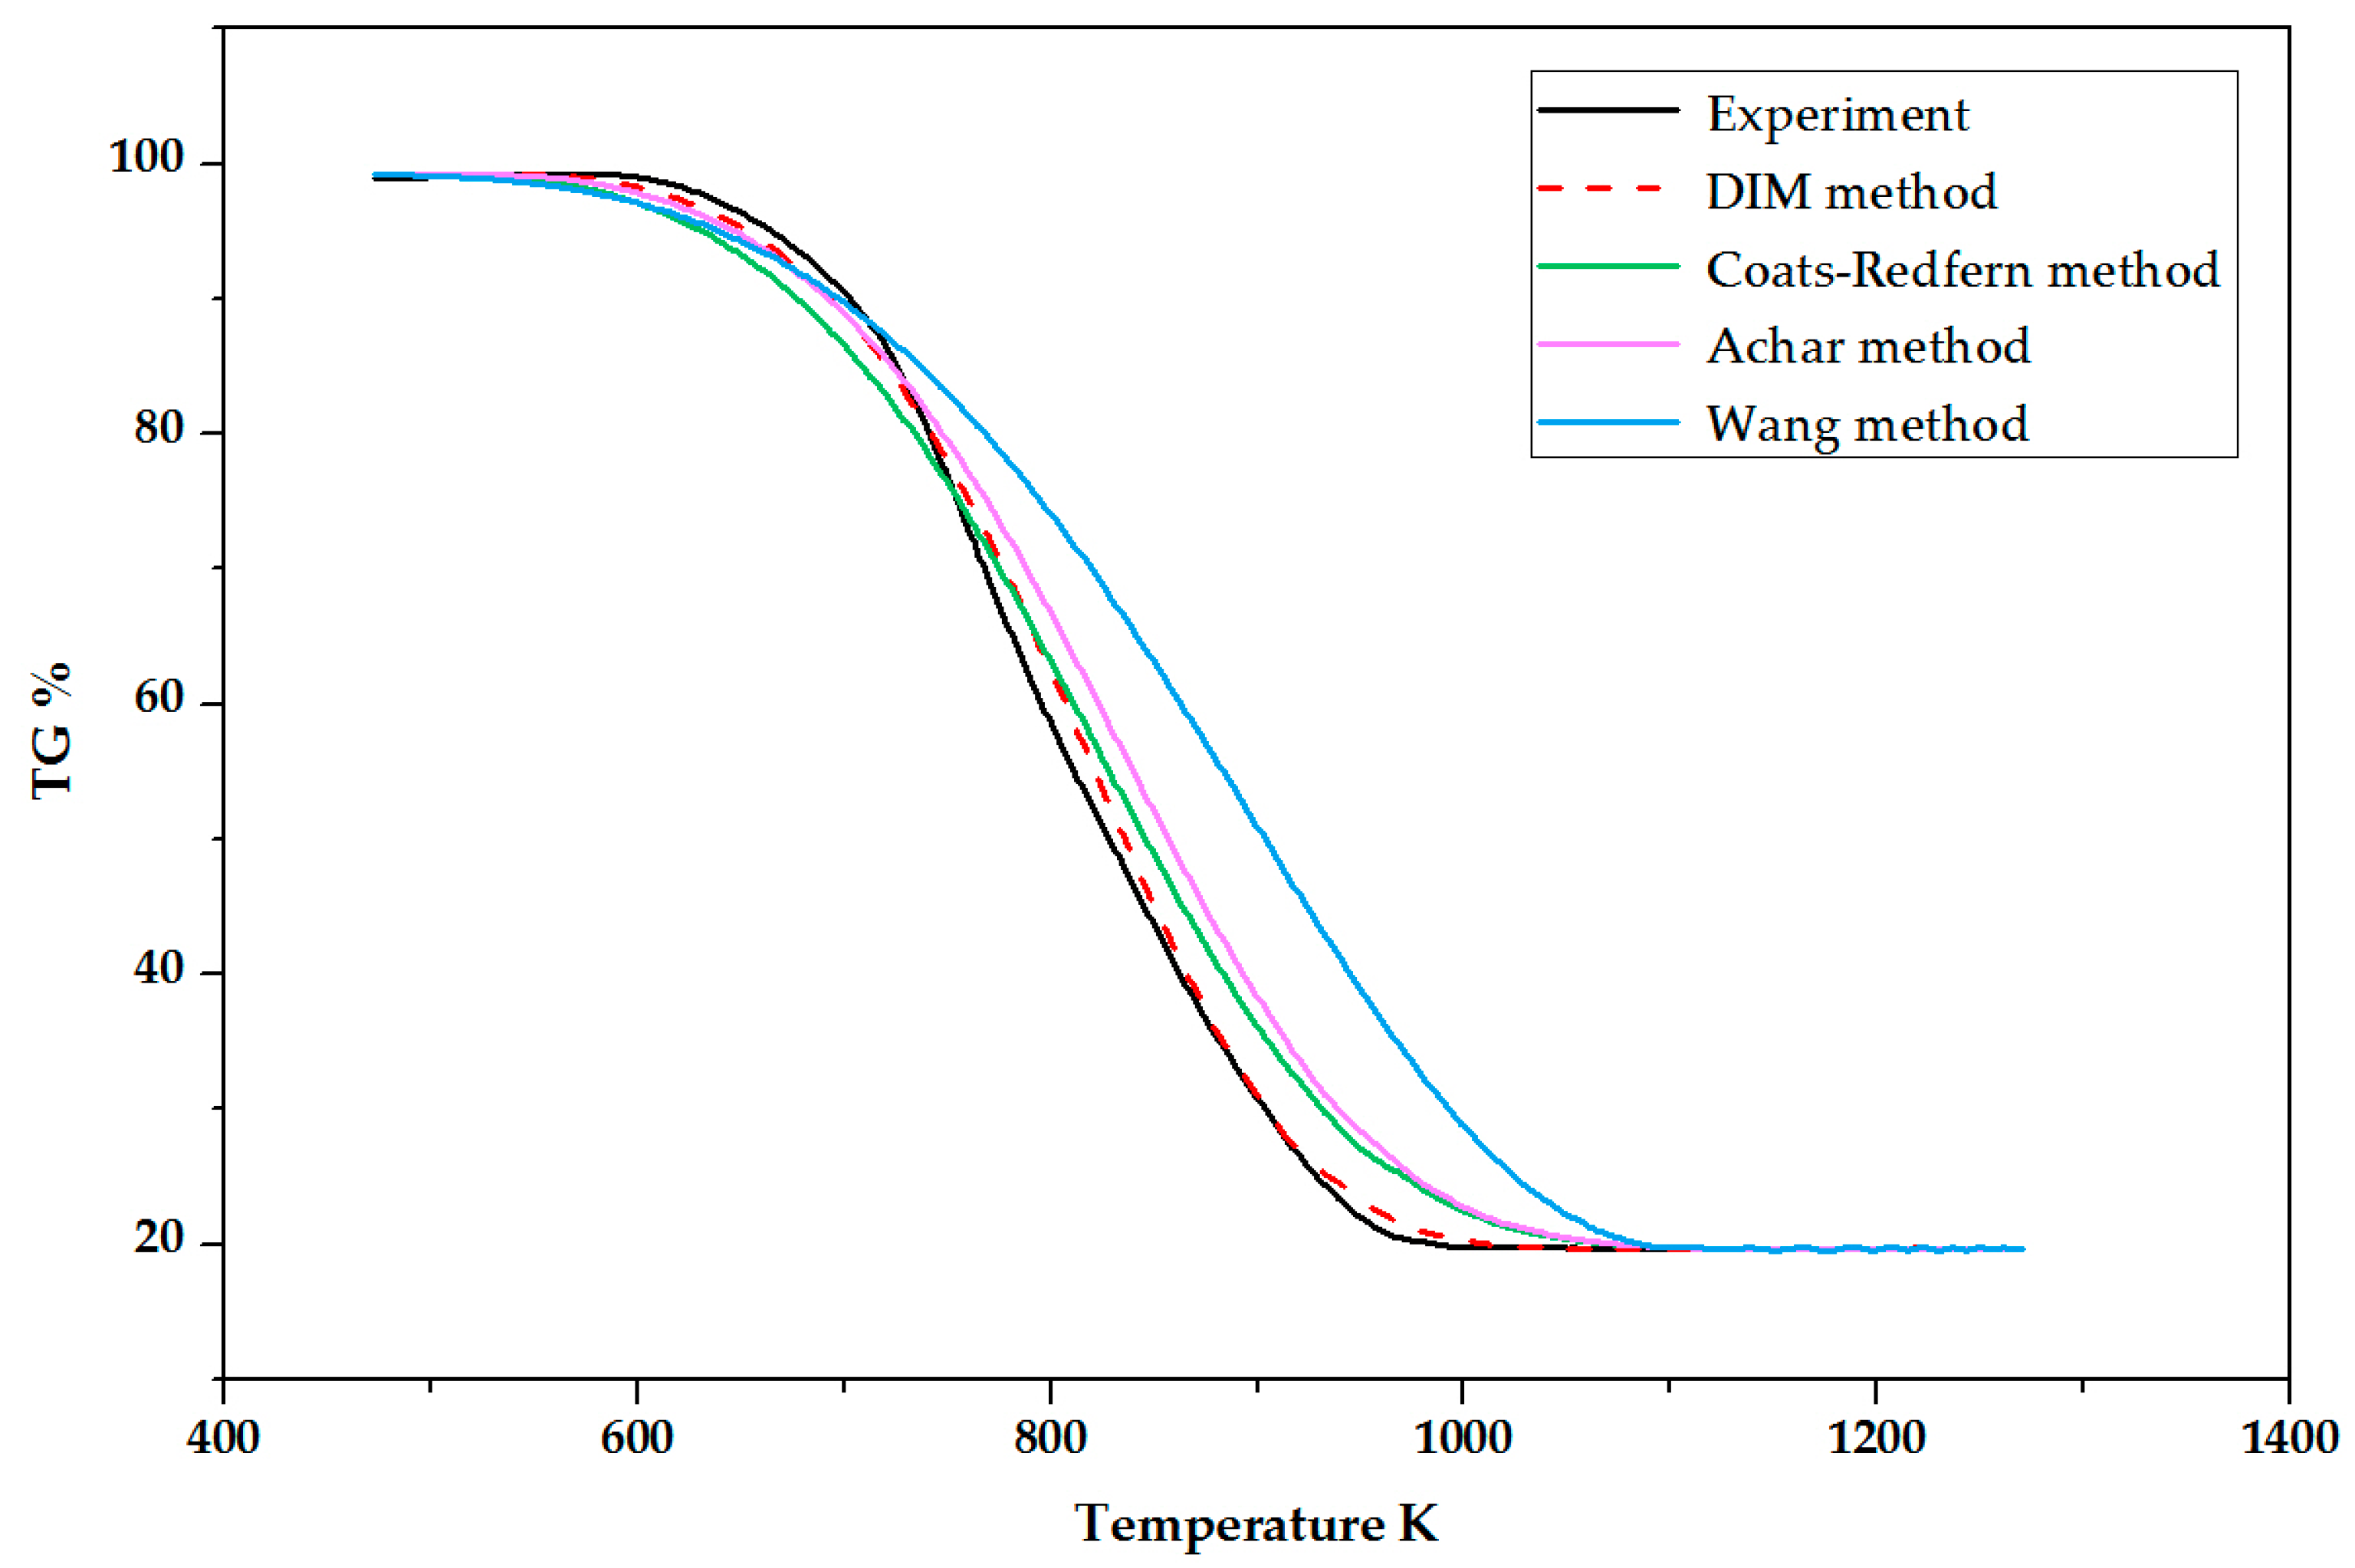
- The experimental TG curve with a 7% O2 concentration was compared with four calculated curves generated by DIM, Wang, Achar, and Coats-Redfern methods, respectively. The DIM method showed a good accuracy with 1.26% average deviation.
Author Contributions
Funding
Conflicts of Interest
References
- Saini, V.R.; Gupta, P.; Arora, M.K. Environmental impact studies in coalfields in India: A case study from Jharia coal-field. Renew. Sustain. Energy Rev. 2016, 53, 1222–1239. [Google Scholar] [CrossRef]
- Saha, M.; Dally, B.B.; Medwell, P.R.; Chinnici, A. Burning characteristics of Victorian brown coal under MILD combustion conditions. Combust. Flame 2016, 172, 252–270. [Google Scholar] [CrossRef]
- Wang, F.F.; Li, P.F.; Mi, J.C.; Wang, J.B. A refined global reaction mechanism for modeling coal combustion under moderate or intense low-oxygen dilution condition. Energy 2018, 157, 764–777. [Google Scholar] [CrossRef]
- Brodny, J.; Tutak, M.; Michalak, M. The Use of the TGSP Module as a Database to Identify Breaks in the Work of Mining Machinery. In Proceedings of the 13th International Conference, Ustron, Poland, 30 May–2 June 2017. [Google Scholar]
- Brodny, J.; Tutak, M. Analysis of methane emission into the atmosphere as a result of mining activity. In Proceedings of the 16th International Multidisciplinary Scientific GeoConference & EXPO SGEM2016, Albena, Bulgaria, 28 June–7 July 2016. [Google Scholar]
- Brodny, J.; Tutak, M. Analysis of Gases Emitted into the Atmosphere during an Endogenous Fire. Available online: https://search.proquest.com/openview/8b90da3d1e86ef415620f779597cc791/1?pq-origsite=gscholar&cbl=1536338 (accessed on 5 July 2018).
- Pach, G.; Sułkowski, J.; Różański, Z.; Wrona, P. Costs reduction of main fans operation according to safety ventilation in mines—a case study. Arch. Mining Sci. 2018, 63, 43–60. [Google Scholar]
- Adamczyk, W.P.; Bialecki, R.A.; Ditaranto, M.; Haugen, N.E.L.; Katelbach-Wozniak, A.; Klimanek, A.; Sładek, S.; Szlek, A.; Wiecel, G. A method for retrieving char oxidation kinetic data from reacting particle trajectories in a novel test facility. Fuel 2018, 212, 240–255. [Google Scholar] [CrossRef]
- Vyazovkin, S. Kinetic concepts of thermally simulated reactions in solid: A view from a historical perspective. Int. Rev. Phys. Chem. 2000, 19, 45–60. [Google Scholar] [CrossRef]
- Fletcher, T.H.; Kerstein, A.R.; Pugmire, R.J.; Solum, M.S.; Grant, D.M. Chemical percolation model for devolatilization. 3. direct use of 13C NMR data to predict effects of coal type. Energy Fuels 1992, 6, 414–431. [Google Scholar]
- Shurtz, R.C.; Fletcher, T.H. Coal Char-CO2 Gasification Measurements and Modeling in a Pressurized Flat-Flame Burner. Energy Fuels 2013, 27, 3022–3038. [Google Scholar] [CrossRef]
- Niksaa, S.; Liua, G.S.; Hurtb, R.H. Coal conversion submodels for design applications at elevated pressures. Part I. devolatilization and char oxidation. Prog. Energy Combust. Sci. 2003, 29, 425–477. [Google Scholar] [CrossRef]
- Rojas, A.; Barraza, J.; Barranco, R.; Lester, E. A new char combustion kinetic model—Part 2: Empirical validation. Fuel 2012, 96, 168–175. [Google Scholar] [CrossRef]
- Wang, Y.F.; Song, Y.M.; Zhi, K.D.; Li, Y.; Teng, Y.Y.; He, R.X.; Liu, Q.S. Combustion kinetics of Chinese Shenhua raw coal and its pyrolysis Carbocoal. J. Energy Inst. 2017, 90, 624–633. [Google Scholar] [CrossRef]
- Niu, S.L.; Han, K.H.; Lu, C.M. Characteristic of coal combustion in oxygen/carbon dioxide atmosphere and nitric oxide release during this process. Energy Convers. Manag. 2011, 52, 532–537. [Google Scholar] [CrossRef]
- Bhatia, S.K.; Perlmutter, D.D. A random pore model for fluid-solid reactions: I. Isothermal, kinetic control. AIChE J. 1980, 26, 379–386. [Google Scholar]
- Bhatia, S.K.; Perlmutter, D.D. A random pore model for fluid-solid reactions: II. Diffusion and transport effects. AIChE J. 1981, 27, 247–254. [Google Scholar]
- Shao, J.G.; Zhang, J.L.; Wang, G.; Wang, Z.; Guo, H.W. Combustion Property and Kinetic Modeling of Pulverized Coal Based on Non-isothermal Thermogravimetric Analysis. J. Iron Steel Res. Int. 2014, 21, 1002–1008. [Google Scholar]
- Liu, Q.R.; Hu, H.Q.; Zhou, Q.; Zhu, S.W.; Chen, G.H. Effect of inorganic matter on reactivity and kinetics of coal pyrolysis. Fuel 2004, 83, 713–718. [Google Scholar] [CrossRef]
- Zhou, L.; Luo, T.; Huang, Q. Co-pyrolysis characteristics and kinetics of coal and plastic blends. Energy Convers. Manag. 2009, 50, 705–710. [Google Scholar] [CrossRef]
- Irfan, M.F.; Arami-Niya, A.; Chakrabarti, M.H.; Daud, W.M.A.W.; Usman, M.R. Kinetics of gasification of coal, biomass and their blends in air (N2/O2) and different oxy-fuel (O2/CO2) atmospheres. Energy 2012, 37, 665–672. [Google Scholar] [CrossRef]
- Das, T.; Baruah, B.P.; Saikia, B.K. Thermal behaviour of low-rank Indian coal fines agglomerated with an organic binder. J. Therm. Anal. Calorim. 2016, 126, 435–446. [Google Scholar] [CrossRef]
- Islam, A.; Auta, M.; Kabir, G.; Hameed, B.H. A thermogravimetric analysis of the combustion kinetics of karanja (Pongamia pinnata) fruit hulls char. Bioresour. Technol. 2016, 200, 335–341. [Google Scholar] [CrossRef] [PubMed]
- Gai, C.; Liu, Z.G.; Han, G.H.; Peng, N.N.; Fan, A.N. Combustion behavior and kinetics of lowlipid microalgae via thermogravimetric analysis. Bioresour. Technol. 2015, 181, 148–154. [Google Scholar] [CrossRef] [PubMed]
- Morin, M.; Pécate, S.; Masi, E.; Hémati, M. Kinetic study and modelling of char combustion in TGA in isothermal conditions. Fuel 2017, 203, 522–536. [Google Scholar] [CrossRef]
- Feng, S.D.; Li, P.; Liu, Z.Y.; Zhang, Y.; Li, Z.M. Experimental study on pyrolysis characteristic of coking coal from Ningdong coalfield. J. Energy Inst. 2018, 91, 233–239. [Google Scholar] [CrossRef]
- Duan, W.J.; Yu, Q.B.; Xie, H.Q.; Qin, Q. Pyrolysis of coal by solid heat carrier-experimental study and kinetic modeling. Energy 2017, 135, 317–326. [Google Scholar] [CrossRef]
- Alvarez, A.; Pizarro, C.; Garcia, R.; Bueno, J.L.; Lavin, A.G. Determination of kinetic parameters for biomass combustion. Bioresour. Technol. 2016, 216, 36–43. [Google Scholar] [CrossRef] [PubMed]
- Hu, R.Z.; Yang, Z.Q.; Liang, Y.J. The determination of the most probable mechanism function and three kinetic parameters of exothermic decomposition reaction of energetic materials by a. Thermochim. Acta 1988, 123, 135–151. [Google Scholar]
- Coats, A.W.; Redfern, J.P. Kinetic parameters from thermogravimetric data. Nature 1964, 201, 68–69. [Google Scholar] [CrossRef]
- Norwisz, J. The kinetic equation under linear temperature increase conditions. Thermochim. Acta 1978, 25, 123–125. [Google Scholar] [CrossRef]
- Yan, L.B.; He, B.S.; Hao, T.Y.; Pei, X.H.; Li, X.S.; Wang, C.J.; Duan, Z.P. Thermogravimetric study on the pressurized hydropyrolysis kinetics of a lignite coal. Int. J. Hydrogen Energy 2014, 39, 7826–7833. [Google Scholar] [CrossRef]
- Magalhaes, D.; Kazanc, F.; Riaza, J.; Erensoy, S.; Kabakli, O.; Chalmers, H. Combustion of Turkish lignites and olive residue: Experiments and kinetic modelling. Fuel 2017, 203, 868–876. [Google Scholar] [CrossRef]
- Duan, W.; Yu, Q.; Wu, T.; Yang, F.; Qin, Q. The steam gasification of coal with molten blast furnace slag as heat carrier and catalyst Kinetic study. Int. J. Hydrogen Energy 2016, 41, 18995–19004. [Google Scholar] [CrossRef]
- Murphy, J.J.; Shaddix, C.R. Combustion kinetics of coal chars in oxygen-enriched environments. Combust. Flame 2006, 144, 710–729. [Google Scholar] [CrossRef]
- Achar, B.N.; Brindley, G.W.; Sharp, H. Kinetics and mechanism of dehydroxylation processes: III. Applications and limitation of dynamic methods. Proc. Int. Clay. Conf. Jerusalem 1966, 1, 67–73. [Google Scholar]
- Dai, C.; Ma, S.; Liu, X.; Liu, X. Study on the Pyrolysis Kinetics of Blended Coal in the Fluidized-bed Reactor. Procedia Eng. 2015, 102, 1736–1741. [Google Scholar] [CrossRef]
- Wang, G.W.; Zhang, J.L.; Shao, J.G.; Liu, Z.J.; Zhang, G.H.; Xu, T.; Guo, J.; Wang, H.Y.; Xu, R.S.; Lin, H. Thermal behavior and kinetic analysis of co-combustion of waste biomass/low rank coal blends. Energy Convers. Manag. 2016, 124, 414–426. [Google Scholar] [CrossRef]


| Proximate Analysis (w%) | Ultimate Analysis (w%) | |||||||
|---|---|---|---|---|---|---|---|---|
| Mad | Aad | Vad | FCad | Cad | Had | Nad | Sad | Oad |
| 4.81 | 16.97 | 24.51 | 53.71 | 62.56 | 2.62 | 0.9 | 0.41 | 11.73 |
| Number | Model | ||
|---|---|---|---|
| 1 | Parabolic law | ||
| 2 | Valensi equation | ||
| 3 | Jander equation | ||
| 4 | Jander equation | ||
| 5 | Jander equation | ||
| 6 | Jander equation | ||
| 7 | G-B equation | ||
| 8 | Inverse Jander equation | ||
| 9 | Z-L-T equation | ||
| 10 | Avrami-Erofeev equation | ||
| 11 | Avrami-Erofeev equation | ||
| 12 | Avrami-Erofeev equation | ||
| 13 | Avrami-Erofeev equation | ||
| 14 | Avrami-Erofeev equation | ||
| 15 | Avrami-Erofeev equation | ||
| 16 | Avrami-Erofeev equation | ||
| 17 | Avrami-Erofeev equation | ||
| 18 | Avrami-Erofeev equation | ||
| 19 | Avrami-Erofeev equation | ||
| 20 | First order | ||
| 21 | P-T equation | ||
| 22 | Mampel power law | ||
| 23 | Mampel power law | ||
| 24 | Mampel power law | ||
| 25 | Mampel power law | 1 | |
| 26 | Mampel power law | ||
| 27 | Mampel power law | ||
| 28 | Reaction order | ||
| 29 | Contracting sphere | ||
| 30 | Contracting sphere | ||
| 31 | Contracting cylinder | ||
| 32 | Contracting cylinder | ||
| 33 | Reaction order | ||
| 34 | Reaction order | ||
| 35 | Reaction order | ||
| 36 | Second order | ||
| 37 | Reaction order | ||
| 38 | Two-third order | ||
| 39 | Exponent law | ||
| 40 | Exponent law | ||
| 41 | Third order |
| No. | E1 (Equation (11)) (J/mol) | E2 (Equation (13)) (J/mol) | △E = E1 − E2 (J/mol) | |△E/E1| | |△E/E2| |
|---|---|---|---|---|---|
| 1 | 61,074.64 | 34,272.76 | 26,801.89 | 0.4388 | 0.7820 |
| 2 | 67,418.23 | 39,282.32 | 28,135.91 | 0.4173 | 0.7162 |
| 3 | 10,758.32 | 3345.33 | 7412.99 | 0.6890 | 2.2159 |
| 4 | 73,246.34 | 45,688.96 | 27,557.38 | 0.3762 | 0.6032 |
| 5 | 12,279.78 | 5360.19 | 6919.59 | 0.5635 | 1.2909 |
| 6 | 79,332.19 | 53,748.39 | 25,583.80 | 0.3225 | 0.4760 |
| 7 | 7,0951.68 | 42,817.59 | 28,134.09 | 0.3965 | 0.6571 |
| 8 | 56,576.77 | 31,257.31 | 25,319.46 | 0.4475 | 0.8100 |
| 9 | 121,550.68 | 152,645.18 | −31,094.50 | 0.2558 | 0.2037 |
| 10 | 3251.61 | 1488.91 | 1762.69 | 0.5421 | 1.1839 |
| 11 | 7692.94 | 5574.96 | 2117.99 | 0.2753 | 0.3799 |
| 12 | 11,248.84 | 8843.79 | 2405.05 | 0.2138 | 0.2719 |
| 13 | 16,578.12 | 13,747.04 | 2831.08 | 0.1708 | 0.2059 |
| 14 | 25,457.47 | 21,919.13 | 3538.34 | 0.1390 | 0.1614 |
| 15 | 29,905.46 | 54,607.46 | −2,4702.00 | 0.8260 | 0.4524 |
| 16 | 69,879.17 | 62,779.55 | 7099.62 | 0.1016 | 0.1131 |
| 17 | 96,525.54 | 87,295.80 | 9229.74 | 0.0956 | 0.1057 |
| 18 | 149,818.28 | 136,328.31 | 13,489.97 | 0.0900 | 0.0990 |
| 19 | 203,111.02 | 185,360.81 | 17,750.21 | 0.0874 | 0.0958 |
| 20 | 43,224.49 | 38,263.29 | 4961.19 | 0.1148 | 0.1297 |
| 21 | - | 99,773.33 | - | - | - |
| 22 | −1,180.59 | −5138.97 | 3958.38 | 3.3529 | 0.7703 |
| 23 | 1783.35 | −3262.22 | 5045.57 | 2.8293 | 1.5467 |
| 24 | 7712.07 | 491.28 | 7220.79 | 0.9363 | 14.6979 |
| 25 | 25,499.04 | 11,751.77 | 13,747.27 | 0.5391 | 1.1698 |
| 26 | 43,282.68 | 23,012.27 | 20,270.42 | 0.4683 | 0.8809 |
| 27 | 61,074.64 | 34,272.76 | 26,801.89 | 0.4388 | 0.7820 |
| 28 | 36,431.95 | 24,366.94 | 12,065.00 | 0.3312 | 0.4951 |
| 29 | 34,627.81 | 21,489.59 | 13,138.22 | 0.3794 | 0.6114 |
| 30 | 34,627.81 | 21,489.59 | 13,138.22 | 0.3794 | 0.6114 |
| 31 | 31,584.89 | 17,459.87 | 14,125.01 | 0.4472 | 0.8090 |
| 32 | 31,584.89 | 17,459.87 | 14,125.01 | 0.4472 | 0.8090 |
| 33 | 19,113.89 | 7222.95 | 11,890.94 | 0.6221 | 1.6463 |
| 34 | 15,430.78 | 4848.13 | 10,582.65 | 0.6858 | 2.1828 |
| 35 | 12,870.07 | 3261.72 | 9608.36 | 0.7466 | 2.9458 |
| 36 | 53,276.11 | 137,575.97 | −84,299.86 | 1.5823 | 0.6128 |
| 37 | 88,876.66 | 160,096.95 | −71,220.29 | 0.8013 | 0.4449 |
| 38 | 21,599.77 | 63,403.38 | −41,803.61 | 1.9354 | 0.6593 |
| 39 | - | −167,150.70 | - | - | - |
| 40 | - | −167,150.70 | - | - | - |
| 41 | 116,645.42 | 285,921.15 | −169,275.73 | 1.4512 | 0.5920 |
| No. | Achar | C-R | ||||
|---|---|---|---|---|---|---|
| E(J/mol) | A(s−1) | R2 | E(J/mol) | A(s−1) | R2 | |
| 1 | 27,036.20 | 6.64 × 10⁻⁴ | 0.1246 | 64,006.40 | 1.74 | 0.8560 |
| 2 | 45,189.28 | 1.29 × 10⁻² | 0.3375 | 70,286.46 | 3.52 | 0.8787 |
| 3 | 643.80 | 7.71 × 10⁻⁵ | 2.38 × 10⁻⁴ | 9439.80 | 4.70 × 10⁻⁴ | 0.6541 |
| 4 | 67,295.67 | 5.03 × 10⁻¹ | 0.6425 | 76,091.67 | 6.19 | 0.8997 |
| 5 | 10,514.86 | 4.42 × 10⁻⁴ | 0.07516 | 10,974.36 | 6.09 × 10⁻⁴ | 0.7347 |
| 6 | 81,770.40 | 3.98 | 0.7818 | 82,229.91 | 1.03 × 101 | 0.9165 |
| 7 | 58,959.17 | 4.34 × 10⁻² | 0.5337 | 73,785.82 | 1.68 | 0.8915 |
| 8 | 20,581.27 | 1.82 × 10⁻⁵ | 0.07567 | 59,482.26 | 6.77 × 10⁻² | 0.8436 |
| 9 | 150,204.08 | 3.07 × 10⁶ | 0.9567 | 127,852.36 | 1.34 × 10⁵ | 0.9415 |
| 10 | 14,669.16 | 1.91 × 10⁻³ | 0.1912 | 1358.77 | 4.30 × 10⁻⁵ | 0.1610 |
| 11 | 19,381.24 | 4.97 × 10⁻³ | 0.2962 | 6070.86 | 3.75 × 10⁻⁴ | 0.6956 |
| 12 | 23,150.91 | 1.02 × 10⁻² | 0.3785 | 9840.53 | 1.04 × 10⁻³ | 0.8091 |
| 13 | 28,805.42 | 2.85 × 10⁻² | 0.4900 | 15,495.03 | 3.67 × 10⁻³ | 0.8713 |
| 14 | 38,229.58 | 1.45 × 10⁻¹ | 0.6342 | 24,919.20 | 2.25 × 10⁻² | 0.9076 |
| 15 | 42,941.67 | 5.68 × 10⁻¹ | 0.6682 | 29,631.29 | 5.24 × 10⁻² | 0.9163 |
| 16 | 85,350.45 | 2.67 × 10² | 0.8938 | 72,040.06 | 5.33 × 101 | 0.9405 |
| 17 | 113,622.97 | 1.99 × 10⁴ | 0.9294 | 100,312.58 | 4.15 × 10³ | 0.9448 |
| 18 | 170,168.00 | 9.35 × 10⁷ | 0.9527 | 156,857.62 | 2.03 × 10⁷ | 0.9485 |
| 19 | 226,713.04 | 3.90 × 10¹¹ | 0.9590 | 213,402.65 | 8.62 × 10¹⁰ | 0.9502 |
| 20 | 57,077.93 | 3.19 | 0.7976 | 43,767.55 | 5.79 × 10⁻¹ | 0.9301 |
| 21 | 18,685.98 | 3.97 × 10⁻² | 0.3348 | - | - | - |
| 22 | −40,149.71 | 3.86 × 10⁻⁸ | 0.3194 | −3179.50 | −4.03 × 10⁻⁵ | 0.3664 |
| 23 | −36,950.38 | 7.41 × 10⁻⁸ | 0.2810 | 19.83 | 3.62 × 10⁻⁷ | 1.46 × 10⁻⁵ |
| 24 | −30,551.72 | 2.31 × 10⁻⁷ | 0.2051 | 6418.48 | 2.43 × 10⁻⁴ | 0.4396 |
| 25 | −11,355.75 | 4.14 × 10⁻⁶ | 0.0309 | 25,614.45 | 8.70 × 10⁻³ | 0.7814 |
| 26 | 7840.22 | 5.56 × 10⁻⁵ | 0.0133 | 44,810.43 | 1.36 × 10⁻¹ | 0.8354 |
| 27 | 27,036.20 | 6.64 × 10⁻⁴ | 0.1246 | 64,006.40 | 1.74 | 0.8560 |
| 28 | 39,969.51 | 2.69 × 10⁻² | 0.5600 | 36,577.09 | 2.89 × 10⁻² | 0.8970 |
| 29 | 34,266.70 | 1.16 × 10⁻² | 0.4468 | 34,726.21 | 2.52 × 10⁻² | 0.8833 |
| 30 | 34,266.70 | 3.48 × 10⁻² | 0.4468 | 34,726.21 | 7.57 × 10⁻² | 0.8833 |
| 31 | 22,861.09 | 1.81 × 10⁻³ | 0.2127 | 31,657.09 | 1.86 × 10⁻² | 0.8557 |
| 32 | 22,861.09 | 3.63 × 10⁻³ | 0.2127 | 31,657.09 | 3.71 × 10⁻² | 0.8557 |
| 33 | −79,789.43 | 1.07 × 10⁻¹¹ | 0.3612 | 19,246.64 | 3.40 × 10⁻³ | 0.6704 |
| 34 | −148,223.11 | 2.09 × 10⁻¹⁷ | 0.4943 | 15,525.15 | 1.84 × 10⁻³ | 0.5838 |
| 35 | −216,656.80 | 3.61 × 10⁻²³ | 0.5546 | 12,918.33 | 1.15 × 10⁻³ | 0.5093 |
| 36 | 125,511.61 | 2.46 × 10⁶ | 0.9071 | 55,656.19 | 1.81 × 10² | 0.6242 |
| 37 | 125,511.61 | 2.46 × 10⁶ | 0.9071 | 94,048.13 | 2.46 × 10⁴ | 0.8625 |
| 38 | 91,294.77 | 1.40 × 10³ | 0.9205 | 21,439.35 | 7.97 × 10⁻² | 0.5146 |
| 39 | −49,747.69 | 5.15 × 10⁻⁸ | 0.4305 | - | - | - |
| 40 | −49,747.69 | 1.03 × 10⁻⁷ | 0.4305 | - | - | - |
| 41 | 193,945.29 | 3.79 × 10¹² | 0.8546 | 124,089.88 | 3.12 × 10⁸ | 0.6658 |
| Method | Average Deviation () |
|---|---|
| DIM | 1.26 |
| Wang | 9.58 |
| Achar | 4.05 |
| Coats-Redfern | 3.01 |
© 2018 by the authors. Licensee MDPI, Basel, Switzerland. This article is an open access article distributed under the terms and conditions of the Creative Commons Attribution (CC BY) license (http://creativecommons.org/licenses/by/4.0/).
Share and Cite
Gou, X.; Zhang, Q.; Liu, Y.; Wang, Z.; Zou, M.; Zhao, X. A Novel Method of Kinetic Analysis and Its Application to Pulverized Coal Combustion under Different Oxygen Concentrations. Energies 2018, 11, 1799. https://doi.org/10.3390/en11071799
Gou X, Zhang Q, Liu Y, Wang Z, Zou M, Zhao X. A Novel Method of Kinetic Analysis and Its Application to Pulverized Coal Combustion under Different Oxygen Concentrations. Energies. 2018; 11(7):1799. https://doi.org/10.3390/en11071799
Chicago/Turabian StyleGou, Xiang, Qiyan Zhang, Yingfan Liu, Zifang Wang, Mulin Zou, and Xuan Zhao. 2018. "A Novel Method of Kinetic Analysis and Its Application to Pulverized Coal Combustion under Different Oxygen Concentrations" Energies 11, no. 7: 1799. https://doi.org/10.3390/en11071799
APA StyleGou, X., Zhang, Q., Liu, Y., Wang, Z., Zou, M., & Zhao, X. (2018). A Novel Method of Kinetic Analysis and Its Application to Pulverized Coal Combustion under Different Oxygen Concentrations. Energies, 11(7), 1799. https://doi.org/10.3390/en11071799