1. Introduction
The authors of Reference [
1] defined an aging building, as a building that has been in service for more than 30 years after completion when considering rebar and reinforced concrete buildings, except for apartments. In addition, Reference [
2] 40 years or longer is proposed for the durability life of building structures and 10 to 15 years for a heating, ventilation, and air conditioning (HVAC) system, and Reference [
3] for buildings that have proposed durability life of 60 to 100 years for building structures, interior and exterior materials have a durability life of 15 to 60 years, and 15 to 25 years is the durability life for HVAC systems. As described in the above, a retrofit of HVAC system is mandatorily needed, due to the differences in durability life. However, a simple replacement based on existing equipment capacities has generally taken place.
Moreover, the internal heat gain, which is a factor to consider in the calculation of HVAC equipment capacity, shows that lighting accounts for 15% of the total cooling load in a building, and office automation (OA) equipment accounts for approximately 20% [
4], but experimental values or design values that do not reflect the current power consumption accurately are applied to actual designs. This process is also applied to retrofits, which has been recognized as one of the problems. Moreover,
Table 1 [
5] presents the machine design standards in South Korea, in which a range of the design standard value is large, and the standard values of indoor loads are not classified in detail. Thus, it leads to a current excessive design of equipment capacity. Reference [
6] thus pointed out the excessive capacity of HVAC equipment, as the design loads in existing buildings have been reflected to be approximately twice of the actual load.
The duration lives of computers, monitors, and printers are around five years [
7] among the OA equipment, which is one of the indoor heat gains, and those of lighting equipment, such as fluorescent lighting fixtures and mercury lamps, are also around five years [
8], so the corresponding equipment must be replaced constantly after building completion. However, changes in power consumptions have occurred due to the steady technical advancements. As mentioned in a study by [
9], a smaller number of workers are now needed to complete business tasks, due to the advancement of OA and network devices. Thus, a variation on the required space and the number of occupants is also expected. Thus, most buildings that require a retrofit should have different internal heat gains from those of the building completion. The estimation on loads is considered as one of the basic tasks in terms of HVAC design, construction, and operation in buildings. In particular, the estimation on internal heat gains close to the current time should be meaningful, as the first step.
Accordingly, this study aims to identify the current status, regarding a variation of loads for the last 30 years due to OA equipment, lighting equipment, and the number of occupants among internal heat gains that affect the calculation of capacities for required equipment, as a preliminary study step to derive a draft of optimal retrofit plans for HVAC systems. That is, the purpose of this study is to calculate an internal heat gain by applying the summary results of the data through literature reviews, and to compare the internal heat gains quantitatively with the values used, in general, by designers.
2. Trend of Existing Studies
Table 2 [
10,
11,
12,
13,
14,
15] presents retrofit cases in Korea, and specifies the completion year and the retrofit method used. The cases of retrofit have steadily existed in the past, and most construction work has focused on interior renovation and repair and exterior building work. However, retrofitting has increased as a method to improve the energy performance efficiency in buildings since around 2010. As for specific methods used, the strengthening of insulation performance in outer walls and windows and the introduction of high-efficient cooling and heating devices, and the replacement of fluorescents to light-emitting diodes (LED) lights have been employed. For the occupancy density per effective area in office buildings, 0.2 person/m
2, which is proposed in the design guidelines and building facility-related books has been mostly applied, but the existing occupancy density has led to an excessive design of HVAC equipment capacities, so that it has been proposed to use 0.06–0.08 people/m
2 as the standard for the appropriate occupancy destiny, as presented in [
16].
In addition, the authors of Reference [
17] performed a comparative study on the design value correction and the correction results by actual measurements to reduce differences between simulation results and actual values, and as a result, improve the accuracy of the simulation predictions. Their study had difficulties in reflecting the representativeness of office building, as the number of target buildings was limited, although actual measurements on internal heat gains were performed after selecting target buildings in consideration to the probabilistic characteristics of the internal heat gain schedule, along with the HVAC schedule to improve the correction accuracy.
Reference [
18] performed actual measurements on plug loads of OA equipment in 12 buildings to investigate the amount of installed OA equipment, the occupancy density, operating times of the equipment, a ratio of operation, and a ratio of installation by equipment in offices, schools, and hotels, thereby identifying the current status of equipment operation in buildings. Although their study performed an investigation on the main operating equipment and took into account a ratio of low power-consuming operating equipment, it did not achieve the prediction of loads in detail, as it did not identify power consumption for each of the pieces of equipment.
In summary, studies on internal heat gains from all OA equipment, lighting, and occupancy destiny, which accounts for most internal heat gains, have not been actively done, and few studies have been conducted on the identification of power consumption used by equipment in the amount of detail required for load calculations, as well as to deal with internal heat gains by building completion dates.
3. Study Method and Scope
3.1. Study Method
This study employed a method of investigation using literature reviews for the identification of the current status on power consumption of OA and lighting equipment and the number of occupants. The literature here refers to academic papers and reports, as well as manufacturer’s catalogs based on actual measurements. After the literature reviews, five-year weighted means were calculated using the collected data and the heat gains from equipment, lighting, and human bodies were calculated. These values were applied to an office building of a specific size and were compared with values of loads where Korean and overseas design standards were applied (hereafter referred to as Korean standard value and overseas standard value), values where design empirical values were applied (hereafter referred to as empirical value), and loads calculated through the literature review (hereafter referred to as literature value), thereby being utilized in the calculation of capacities of HVAC equipment during retrofitting.
3.2. Study Scope
This study summarized heat gains from the power consumption of OA and lighting equipment and the occupants from 1985 until the present in consideration of the retrofit circumstances in the building. According to Reference [
19], the heat gain from computers was the largest among OA equipment, followed by monitors and devices for image processing. In their study, desktop and laptop computers were considered as computers, cathode ray tube (CRT), liquid crystal display (LCD), and light emitting diode (LED) displays were represented when considering monitors, and laser printers, ink jet printers, and multi-function devices that were used frequently in offices as were image processing devices selected. In addition, lighting equipment was limited to fluorescent lamps and LED lights. A straight lamp with a recessed fluorescent light fixture was investigated as the representative fluorescent lamp by referring [
20] in
Table 3. Finally, an occupancy density was included in the study scope to identify the number of OA equipment machines used per person and the lighting and human body load per unit area.
In the literature review, papers and reports related to the power consumption of OA equipment were as follows: 30 papers and reports for desktops [
18,
19,
21,
22,
23,
24,
25,
26,
27,
28,
29,
30,
31,
32,
33,
34,
35,
36,
37,
38,
39,
40,
41,
42,
43,
44,
45,
46,
47,
48], nine cases for laptops [
21,
22,
31,
32,
34,
35,
36,
42,
48], 15 cases for monitors [
19,
21,
22,
24,
25,
26,
27,
28,
29,
30,
31,
35,
36,
38,
39,
42,
43,
48,
49], eight cases for small printers [
18,
21,
22,
33,
35,
36,
39,
48], eight case for lighting [
50,
51,
52,
53,
54,
55,
56,
57], and nine cases for occupancy density [
16,
58,
59,
60,
61,
62,
63,
64,
65]. The catalogs were limited to those of products from the top five companies based on market share: 200 catalogs for desktops, 108 catalogs for laptops, 100 catalogs for monitors, 956 catalogs for small printers, 172 catalogs for multi-function devices, and 2001 catalogs for lighting devices were used.
Table 4 summarizes the identified details from the literature review in which the device power consumptions as well as the occupancy densities are identified. The numbers of cases that referred desktops and laptops were 216 and 126, respectively, and the numbers of cases that referred fluorescent lamps and LED lights were 1333 and 664, respectively. The number of cases that referred occupancy was 135. Thus, a total of 3837 cases were identified.
Moreover, the following numbers of papers and reports were investigated to identify the empirical values of lighting and the occupancy density applied generally at the time of design: 16 cases of OA equipment loads [
12,
17,
24,
25,
26,
27,
28,
29,
30,
48,
63,
65,
66,
67,
68,
69,
70], 12 cases in relation to the number of machines used per person [
21,
22,
23,
24,
25,
26,
27,
28,
29,
30,
57,
71], 13 cases of lighting density [
12,
17,
21,
22,
24,
25,
26,
27,
28,
29,
30,
48,
63,
64], and 18 cases of occupancy density [
12,
17,
24,
25,
26,
27,
28,
29,
30,
48,
65,
66,
69,
70,
72,
73,
74,
75,
76]. As a result, 42 cases related to OA equipment loads, 24 cases related to the number of machines used per person, 46 cases of lighting density, and 32 cases of occupancy density were applied.
4. Investigated Results of Power Consumption by Equipment
Table 5 presents weighted mean values of power consumptions used in OA and lighting equipment for five-year intervals identified through the literature review. The reason for the application of weighted means was due to the uneven number of devices identified annually.
4.1. Study Results on Power Consumption in OA Equipment
4.1.1. Study Results on Power Consumption in Computers
Figure 1 shows a distribution of the annual power consumption in desktops. The power consumption for 30 years shows a decreasing trend, which is due to technical development, and the reduction in standby power. The mean values of power consumption for a five-year interval shows an increasing trend from 1985 until the early 2000s followed by a decreasing trend.
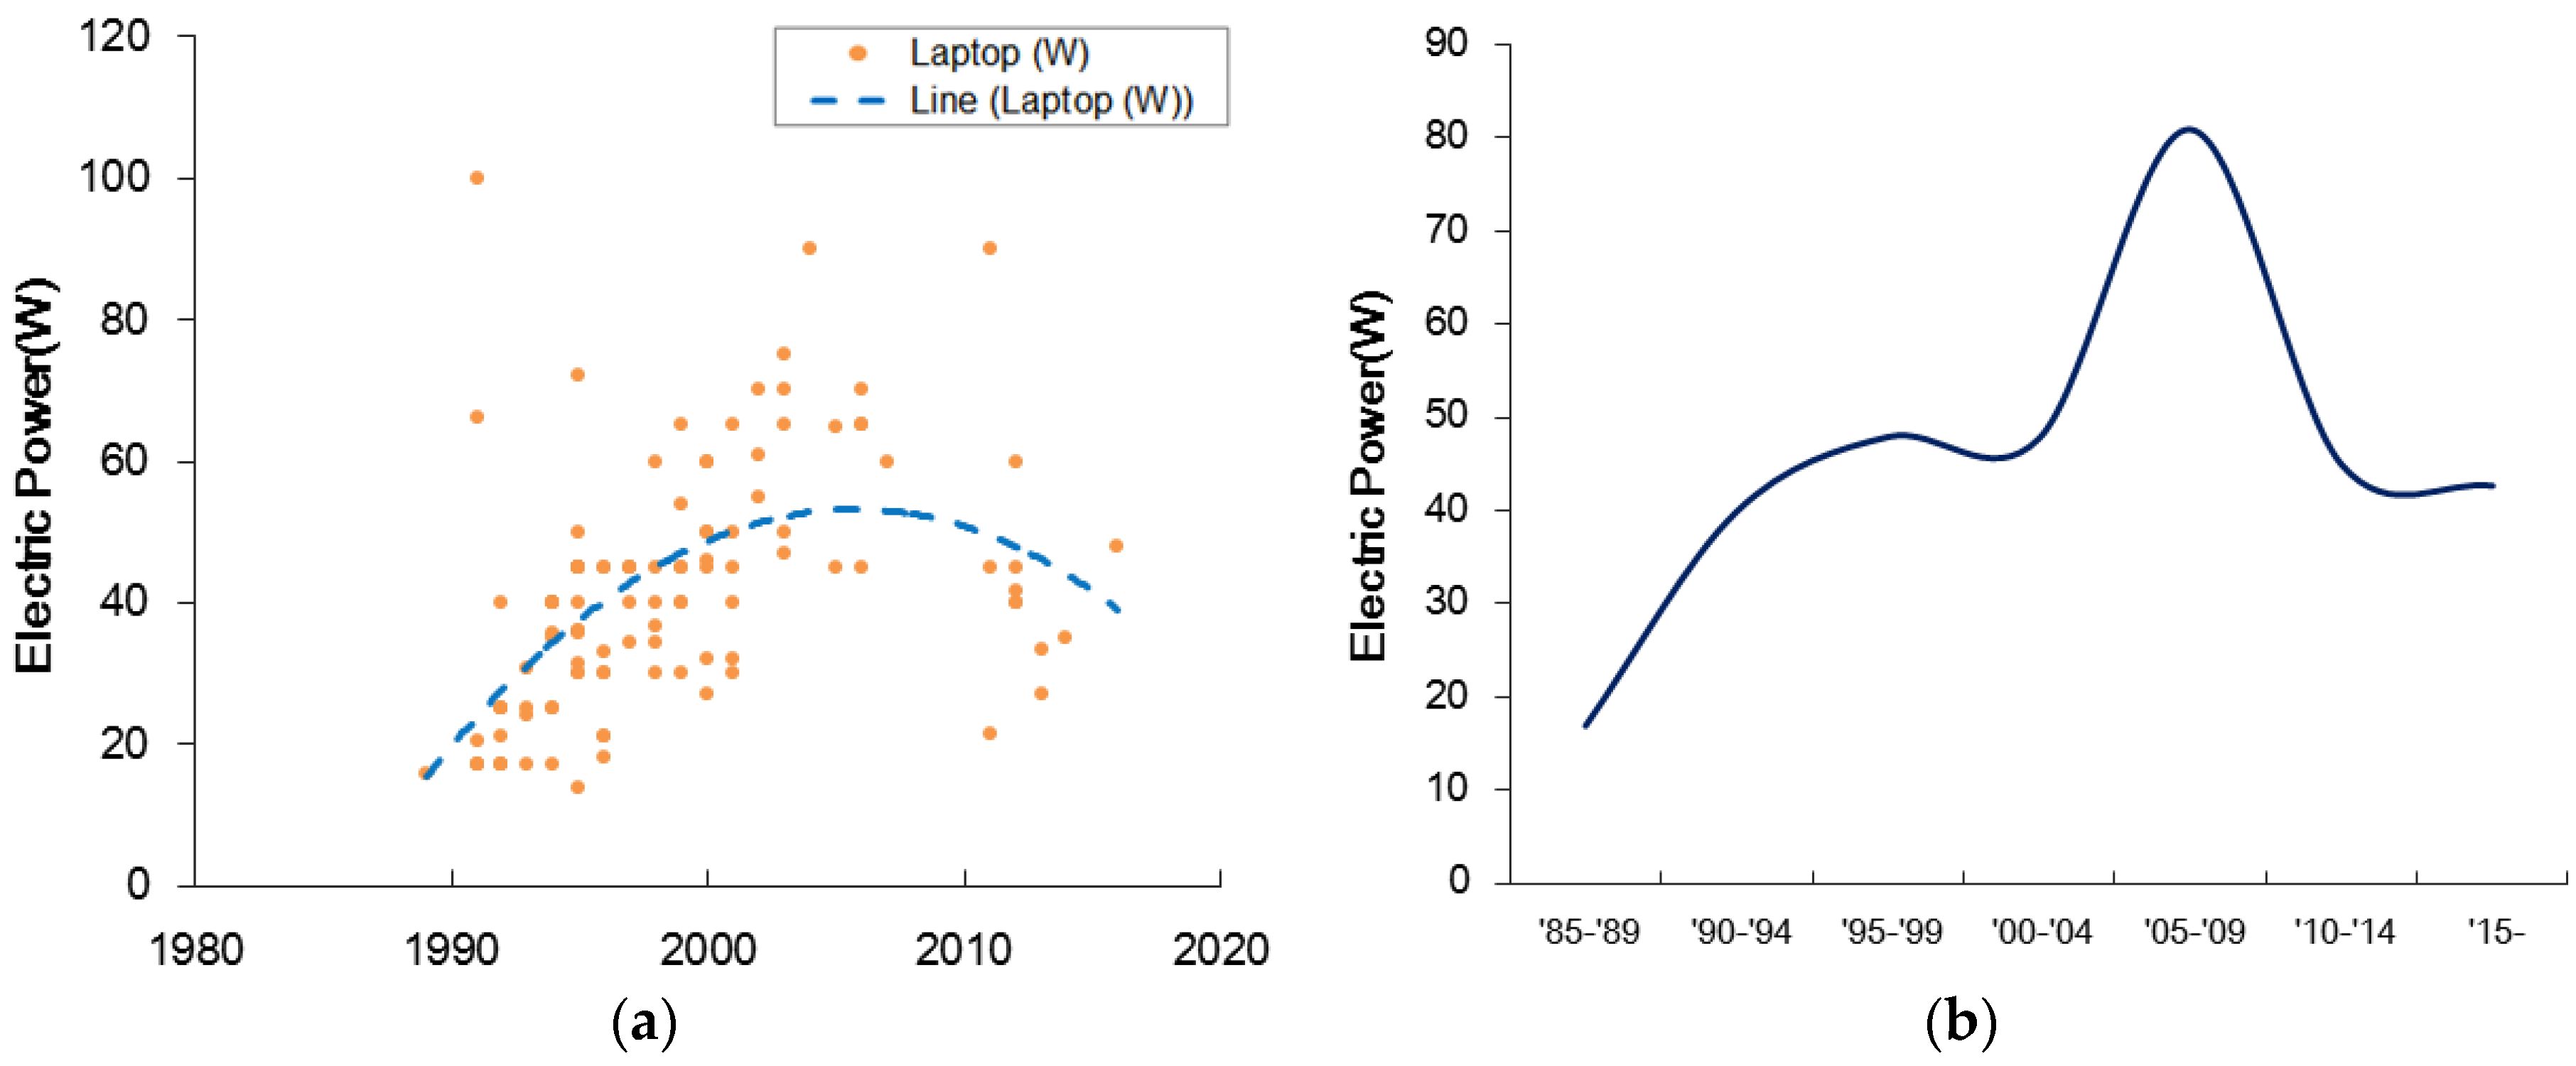
The power consumption used in laptops shows an increasing trend initially, which was followed by a decreasing trend that began in 2010. This trend was shown because laptops were used for the purpose of simple document work in 1980s and 1990s.
Since then, the performance of laptops became comparable to that of desktops to complete business tasks for the purpose of large scale of data processing, and improvements on processing speed allowed high performance and large-scale data processing to be done with laptops. Thus, the power consumption of laptop computers increased, due to high performance specifications since the 1990s. However, its power consumption has decreased as shown in
Figure 2 due to the issue of low-power consumption since 2010.
4.1.2. Study Results on Power Consumption in Monitors
The power consumption used in monitors shows an overall decreasing trend as shown in
Figure 3a, which is due to the technical advancement in displays, progressing from CRT monitors to LCD and LED monitors. Although some of the high-end monitors had a power consumption of more than 200 W, monitors whose power consumption exceeds 100 W have disappeared since 2010 according to the investigation results. The steady increase in monitor’s size does not lead to an increase in power consumption, because nearly all manufacturers develop monitors with low power consumption for eco-friendliness and standby power reduction. As a result, the weighted mean value of the power consumption in monitors has fallen to the 30 to 40 W level as shown in
Figure 3b in most recent five-year period.
4.1.3. Study Results on Power Consumption in Printers
This study investigated power consumptions from black and white inkjet printer in 1980s and more recent color laser printers. The power consumption had increased steadily as shown in
Figure 4. The power consumption in the late 1990s was distributed mostly within the 200 W range, but has increased to 1000 W since 2010. The main reason for this was due to the proliferation of laser printers, whose power consumption is relatively large.
Reference [
77] found that the laser printer market increased approximately by 6% in 2003 compared to that of 2002, and the use of inkjet printers has decreased around 2000, as the use of laser printers had become more widespread. Moreover, a printout speed has been improved from about 10 printouts per min. to 20 per min. in 2004 and now more than 40 printouts per min. in recent products, which has led to the increase in power consumption.
The fluctuation of power consumption used by large-size multi-function printers was not significant from 2005 until the present day as shown in
Figure 5. The multi-function printers were introduced to Korea in 1996 [
78], and widely used from approximately 2005. The market survey results in 2006 revealed that A4 color multi-function printers accounted for approximately 70% of the total printer market, which indicated that exiting copiers were rapidly being replaced with large-size multi-function printers in Korea [
79]. In this regard, the time that introduced large-sized multi-function printers was assumed to 2005. The weighted mean value of power consumption used after 2005 was 1300 W, and no significant changes in power consumption for the subsequent 10 years have been found, but an increase in internal heat gains was noticed compared to the heat gains prior to 2005.
4.2. Study Results on Power Consumption in Lighting
The power consumption used in lighting that that used in fluorescent lamps was nearly constant, whereas consumption that used LED lights has become smaller recently. The power consumption of fluorescent lamps has not reduced due to increase in power consumption of lamps and luminous flux, despite of high efficiency adopted, using improvements in ballasts.
In contrast, the power consumption used in LED lights has decreased significantly, as the mean power consumption of LED lights was approximately 17.1 W, which was smaller than that of fluorescent lamps by 47%, thereby decreasing heat gains by lighting as a result of the replacement of fluorescent lights with LED lights (in
Figure 6). Moreover, the LED adoption proportion in 24 buildings with private offices was approximately 79.6% in 2010, and the adoption in 2086 non-residential structures was 67% to 77% in 2015 according to the statistical data from the [
80]. Thus, those numbers were used in the calculation of lighting loads.
4.3. Study Results on Occupancy Density
The investigation results on occupancy density in office buildings are shown in
Figure 7. The literature reviews based on 135 cases in actual measurements and case-oriented studies showed no significant fluctuation in the last 30 years, which was 0.084 person/m
2 on average.
In relation to the occupancy density, the design standard of the building machinery equipment specified by the Society of Air-conditioning and Refrigerating Engineers of Korea [
5] is 0.2 person/m
2, and that of the American Society of Heating, Refrigerating and Air-Conditioning Engineers (ASHRAE) is 0.035 person/m
2 [
29], which shows a significant difference between Korean and overseas standards. The reason for this difference was due to the difference in office layout. That is, most offices in Korea are based on an open layout, whereas Americans prefer an individual room-based layout. As a result, the mean value of occupancy density used in this study was 42% smaller than that of the Korean standard value and 42% larger than that of the overseas standard value, approximately.
5. Calculation of Internal Heat Gains
5.1. Calculation of Internal Heat Gains by Item
Table 6 presents the calculated values based on the investigated power consumption and occupancy density in
Section 4. In Korea, the number of used OA equipment was 0.2 to 1 personal computers (PC) per person and 0.2 inkjet or laser printers per person [
5] and in the USA, it was 1 PC per person and 0.33 laser printers per person as of 1998 and changed to 1 PC and 1 laser printer per person by 2000 [
26,
27,
28,
29,
30]. In relation to multi-function printers, which were adopted from 2005, this study assumed that the utilization rate was one machine per 40 people, while that of the small-size printers was one machine per 10 people.
Table 7 presents the results of loads per unit area by item, using the power consumptions used by devices in
Table 5, and the numbers of devices and occupancy density in
Table 6. The printer load among the items was calculated by considering the numbers of small-size printers and multi-function printers used per person in
Table 6, and the OA equipment load refers to the sum of the loads of desktop computers, monitors, and printers.
Notably, the OA load increased by 49.6% over the last 30 years, which was due to the increase in printer loads, as a result of the increased usage use of large-size multi-function printers and an increase in the number of machines per person. The mean load of fluorescent lamps was approximately 9.7 W/m2, and that of LEDs was 4.53 W/m2, which revealed a reduction of the load by about 47% by replacing lamps with fluorescent bulbs to LEDs. No significant changes in heat gains from human bodies per unit area were found. The aforementioned calculated loads (literature values) were calculated using the power consumptions of devices and the occupancy density identified through the literature review, which considered papers, reports, and equipment catalogs based on actual measurements. They are thought to be the closest values to internal heat gains in offices annually in reality.
5.2. Investigation of Comparison on Calculated Values of Internal Heat Gains
Table 8 summarizes the weighted means of the empirical values that are generally applied to designs of loads produced from OA equipment, lighting, and human bodies through the investigations in
Section 3.2.
Table 9 presents the overseas and Korean machinery design standard values in large office buildings.
The OA load of the empirical values was smaller than that of the literature values, whereas the applied loads of the empirical values produced from fluorescent lamps, LED lighting, and human bodies were relatively larger. The design empirical value of the OA load was 20.23 W/m2 on average. Since the highest applied value was 28.65 W/m2 from 1990 to 1994, the empirical mean value remained within a range of 14.76–23.66 W/m2. The results of existing empirical values were taken by designers, considering the reduction in power consumption and in devices at the time of design, which were 75% of the values in the literature. The mean lighting load was 16.32 W/m2. The highest value, 30 W/m2 was observed from 2000 to 2004, which then reduced to 10–15 W/m2. The values were 168% and 360% levels 9.69 W/m2 and 4.53 W/m2, respectively, which were the loads from fluorescent and LED lights indicate from the literatures. The heat gain produced from human bodies was 14.43 W/m2 on average, which did not change significantly for the last 30 years. It was 145% larger than that of the literature value.
In the case of overseas design standards, similar values were applied when compared to the corresponding literature values, except for the OA load in the ASHRAE in 1993. However, the overseas design standards were utilized as a reference during the design of offices in Korea, and most design standards in Korea related to internal heat gains were enacted after 2000, which showed larger values than the corresponding literature values, except for some OA loads. These results would lead to an over-estimation of the internal heat gains and a corresponding over-sizing of HVAC systems.
5.3. Selection of Represented Office Building and Calculation of Internal Heat Gains
Reference [
16] set the total floor area of large office building at 31,769.07 m
2. Based on the above study results, this study set the total floor area of the target building at 30,000 m
2. Therefore, the ratio of HVAC out of the total floor area was 0.63 using Equation (1) as proposed in a study by [
72] and HVAC area (
A) was set to 18,900 m
2.
Table 10 specifies the values applied to each range of years to calculate internal heat gains in the entire office building, using the values in
Table 7,
Table 8 and
Table 9. If appropriate values were not available, the values in the previous period and next period were averaged. The value specified in the heat gains from human bodies refers to a median value.
The results in
Table 11 reveal that the literature value of the internal heat gain in the office building calculated in this study increased over time: from 513.5 kW in 1980–1985 period to 823.7 kW after 2015, corresponding to an increase of approximately 37.7%. This was resulted from an increase in OA equipment loads, due to the adoption of large multi-function printers with loads of over 1000 W, and the overall increase in the numbers of OA equipment.
However, despite of constant increase in literature values, the literature values were consistently lower than those of empirical and Korean standard values, and they were also smaller than the overseas standard values prior to 2000 by 35% to 60% respectively. The overseas standard values after 2000 were similar with the literature values, but the overseas design standards were utilized as only a reference at the time of the design applied to Korean offices, so that the literature values were compared with the empirical and Korean standard values. As a result, the literature values were about 17% to 50% smaller than the empirical values prior to 2000, and about 35 to 50% smaller than the Korean standard values, which indicated the loads were over-estimated as compared to actual loads used in office buildings. The over-estimated designed of HVAC systems is likely to continue, even if the retrofit time due to the over-sizing in a simple replacement of the system, will increase the energy usage caused by the increase in partial load operational time.
6. Conclusions
Although internal heat gains during retrofits are expected to be different from those at the time of the building completion, the capacities of HVAC systems are calculated based on the data, as of the building completion time in Korea. Thus, this study aimed to summarize the data through literature review to determine the fluctuation of the internal heat gains for the last 30 years that affected the calculation of the HVAC equipment capacities and compare the internal heat gains calculated in a specific size of an office building, with the empirical and design standard values quantitatively.
This study investigated literature regarding the power consumed by OA and lighting devices that accounted for the internal heat gains, the number of devices used per person, and the occupancy density starting from 1985. The study results showed that the power consumption used in desktops, laptops, and monitors were on a decreasing trend, but the power consumption of printers was n an increasing trend. The occupancy density was 0.084 person/m2 on average, and no significant change was observed. The number of devices used per person was 0.7 to 0.8 device per person in the 1980s and that number increased to one device per person after 2000, indicating that the amount of OA equipment per person increased over the last 30 years.
The OA equipment loads calculated based on the study results increased by 49.6% after 2015 as compared to that in the 1980s, due to the use of large multi-function printers and the overall increase in the numbers of devices used. The lighting loads were reduced by 47% when fluorescent lamps (9.69 W/m2) were replaced with LED lights (4.53 W/m2). The loads from human bodies showed a similar level at 10 W/m2 for the last 30 years. The calculation results of the internal heat gains in a building with a total floor area of 30,000 m2 revealed that the literature values were increased steadily for the last 30 years, whereas they were approximately 17% to 50% smaller than the empirical and Korean standard values, which indicated an over-estimation of HVAC capacities during for the Korean office design.
Thus, the internal heat gains showed a different pattern after building completion. So that over-estimated loads were designed compared to actual office building usage, leading to an unnecessary increase in energy usage. For the future study, load fluctuations for the last 30 years in consideration of the envelope performance of the building will be determined based on the current study results in order to contribute to the calculation of the appropriate HVAC capacities to ultimately derive the optimal HVAC system retrofit design draft.
In addition, the study scope was conducted in office building of Korea which is a monsoon climate. Thus, it was not identified how the internal heat gain affected the reduction or increase in energy consumption in different climates. In the follow-up study, we will determine the effects of internal heat gain on office buildings in various climates and will complement the limitations of this study.


