Abstract
This work establishes the relationship between bioclimatology and agronomy. Bioclimatic indices are obtained for several areas under olive cultivation and correlated with olive yields. Due to the effect of climate change on cultivation and the high economic losses it produces, we propose a sustainable development model for the territorial classification of crops based on bioclimatic knowledge. Bioclimatic diagrams are prepared to provide information on water stress in crops so that irrigation can be carried out at the most effective time, a measure that has been shown to lead to water and energy savings for growers. In addition to this development model, we propose the application of non-aggressive cultivation techniques such as the use of living plant cover to ensure the protection of the soil and avoid losses due to climate irregularities. Studies conducted up to the present on applied bioclimatology have yielded promising results in the fields of farming and forestry. The maps and bioclimatic indices of Professor Rivas-Martínez, Ic, Io and It/Itc, are essential for bioclimatic classification. The agricultural development model with a bioclimatic basis ensures economic savings for growers and minimizes the environmental impact of cultivation. In the case of olive cultivation we detected that in 2005 all the cultivated areas that were not in their thermoclimatic optimum were damaged by frost. The widespread cultivation of olive groves in the Mediterranean basin, and mainly in the south of Spain, is reason enough to establish a relationship between its production and its bioclimatic environment. The ombroclimatic study in certain localities under olive cultivation shows that areas with Io <2.5 are unproductive (Jodar, Tabernas), and that their low Io value needs to be supplemented with irrigation water. This means extracting water from aquifers for agricultural use, when the current climate irregularities do not allow the excessive use of subsoil water. For the time being the only way of mitigating this situation is with sustainable development, which requires a bioclimatic understanding of the territory; and the use of appropriate cultivation techniques, including herbaceous plant covers. In this last case a knowledge of the plant associations in the phytosociological class Stellarietea mediae constitutes the basis for establishing either natural or sown vegetation cover.
1. Introduction
This article describes the results of the work carried out by our team in recent years. This research focuses on biogeographic and bioclimatic aspects, climate and soil bioindicators, vegetation and vegetation dynamics, and landscape study. Based on our findings we have devised agricultural and forestry management models that have led us to a worldwide sustainability model with proposals for management to mitigate the ongoing profound and irregular global climate change. This has been achieved by conducting studies in such widely differing locations as Palestine [1,2,3,4,5], Italy, Spain, Portugal [6,7,8,9,10,11,12,13], the Caribbean, Mexico and Brazil [14,15,16,17,18,19]. To pursue sustainable development, it is necessary to conduct prior research into the methodology to ensure the intended aim is attained. These studies must be specific to each territory. The following factors must be analyzed in order to propose a management model: physical and chemical environmental factors, biogeography, bioclimatology, vegetation (biological indicators) and vegetation series [20].
Bioclimatology is an ecological science that has assumed greater importance in recent years and whose aim is to highlight the relationship between living beings (biology) and climate (physics) [21,22,23]. It is distinguished from climatology in that the information, indices and units it uses are related to and delimited by species and phytocoenoses/plant communities. The development of bioclimatology as a key discipline in the service of vegetation, agriculture and forestry sciences is one of the most important scientific innovations in recent times; the progress in this science has made it possible to identify several plant communities, and particularly to identify more accurately the main vegetation bands observed on an ascending altitudinal scale, in addition to establishing agricultural and forestry models for sustainable development [9,24,25]. Advances in geobotanical knowledge have shown promising results for the management of the natural environment [26].
Precipitation and temperature are the most important factors conditioning the existence of certain plant ecosystems [27]. Thus, each biogeographic region or group of regions has a particular altitudinal zonation of plant ecosystems as the mean annual temperature progressively decreases with altitude (thermoclimate) [28].
As climate (temperature and precipitation) is correlated with the altitudinal zonation of plant ecosystems, it can be seen that certain rhythms or changes occur everywhere on Earth based on temperature and precipitation [29]. Both the physical continent or bioclimatic belts and the biological plant content or vegetation series can be recognized as a function of these changes using the concept of universal vegetation series jurisdiction, and can therefore be applied to any place on the planet.
Bioclimatology as a science has undergone major advances in the last 30 years thanks to Professor Rivas-Martínez, who has created a bioclimatic classification of the Earth since 1996 [25,27,28,29,30].
Climatology and bioclimatology are essential for understanding and explaining the natural environment, which is currently undergoing the effects of climate change. It is therefore crucial to know what resources are available to humankind to mitigate this change, as it is leading to serious natural disasters involving economic damage and loss of human life. The third assessment report revealed that temperatures had increased by approximately 0.6 °C (between 0.4 °C and 0.8 °C), affecting physical and biological systems in different parts of the Earth [31]. The fourth assessment report contains clear evidence that climate change and global warming are now a reality that affects us all [32]. Global concentrations of carbon dioxide, methane and nitrous oxide in the atmosphere in recent years have risen substantially as a result of human activities since 1750. The linear projection for the next 100 years is estimated at 0.74 °C (between 0.56 °C and 0.92 °C), compared to 0.6 °C in the third report. According to the sixth report from the Intergovernmental Panel on Climate Change, global warming is now an unequivocal reality [33]. This increase in temperature occurs all over the planet but more markedly in more northerly latitudes [34,35,36,37].
Bioclimatology, vegetation, vegetation cover and agriculture are all terms that must be clearly understood, as their effective management can mitigate climate change. This poses the need for a worldwide economic model based on sustainable development and a rational use of natural resources.
Agriculture is conditioned by cyclones and anticyclones, which in turn shape the various macrobioclimates and bioclimates throughout the world (thermoclimates and ombroclimates). These all affect both the quantity and quality of crop yields, so a knowledge of local bioclimatic indicators is critical for improving agriculture. The use of bioclimatic indices—continentality, ombrothermic and thermicity indices—should be obligatory before establishing a certain crop, as there is a close correlation between these indices and agricultural yields.
Bioclimatology reveals the close relationship between living beings and physical factors (climate), which is evidently strongly linked to and connected with agriculture and vegetation ecosystems, as the concepts of bioclimate and bioclimatic belt (thermotype and ombrotype) are essential for planning crops. It is important to bear in mind that the aim is to achieve maximum yields in terms of quantity and quality with the lowest environmental and economic cost, which is ultimately what both growers and society demand. This cannot be done without taking into account bioclimatology as a critical science for agricultural planning. The use of bioindicators and bioclimatic indices must therefore be incorporated into agricultural management, and this requires obtaining a bioclimatic interpretation of the territory as an essential framework in which to establish the crop.
Once the bioclimate has been determined for each ecosystem and crop, a landscape analysis must be conducted in concordance with the bioclimate of the territory. This will contribute to achieving successful reforestation that will act as a CO2 sink and potentially mitigate climate change, always assuming that there is a parallel reduction in CO2 emissions and a change in energy policies. This landscape analysis leads us to propose the use of the concept of vegetation series/set of plant communities, which—as we have said—has universal jurisdiction, as a basis for establishing a sustainable development model [9,38,39,40,41,42].
The term "vegetation dynamics" is applied in vegetation series when the dynamic is natural and the process is driven by the ecosystem, but not when there is excessive human intervention that is contrary to the natural dynamic. When this dynamic is artificially accelerated (human action), the vegetation series undergoes drastic modifications leading to a situation where the series cannot recover and therefore disappears, and causing other new formations to appear which transform the landscape. Each biogeographic territory with its distinctive bioclimate and soil therefore has a specific vegetation series with its own dynamic, making it necessary to establish a specific management model [43,44].
When establishing crops in the process of territorial management, which, as we have mentioned, should be done on a bioclimatic basis considering the vegetation series, it is essential to determine the range of bioclimatic values in which the crop is at its optimum. Another factor to be taken into account is the cultivation technique, with a view to increasing quantity and quality and minimizing environmental, economic and human impact.
In essence, agriculture can be externally sustained or sustainable. Sustained agriculture is practiced with an external energy input, and can be described as agricultural production with no regard for conservation and a constant supply of products (nutrients) in order to boost yields. The aim is to achieve the highest possible yields whatever the environmental cost, and of course at a high price for the grower in monetary terms; in contrast, sustainable agriculture consists of using the resource without depleting it and without the need to incorporate nutrients into the soil [9,45,46].
Until 1970, traditional agriculture was the norm in many countries; however, the all-encompassing technological revolution that has been in force until the present day has since become widely accepted both economically and socially. The result is the uncontrolled use of pesticides, herbicides and phytosanitary products which cause a serious environmental impact that can occasionally give rise to insects and plants that are resistant to treatment without having achieved any significant improvement in living standards in the farming sector. The cost of using these chemical products is the same or in some cases greater than the economic benefit gained from the treatment, without even considering the added environmental cost [47,48,49,50,51].
Until a few years ago cultivation was predominantly traditional with models acquired over many centuries. Cultivation has always been somewhat plural, involving a variety of different crops, rather than the monoculture which has now become standard in some cases, a practice that delivers the land into the hands of speculators.
Non-standard management models evolved to create specific models in each territory, in which aspects such as pruning, tilling, type of planting and the method of obtaining the agricultural product were specific to each town/district [52]. This practice has now been lost in the unending quest for greater yields, leading to a sustained agriculture characterized by a loss of biodiversity and of the stability of the agroecosystem.
By sustainability we mean the capacity to persist over time without detriment to natural (soil, diversity, fauna, etc.) and cultural capital; this includes management models that enable production and renovation over time. Among the different definitions of sustainable agriculture, we choose the description of the American Society of Agronomy, namely, “A sustainable agriculture is one that, over the long term, enhances environmental quality and the resource base on which agriculture depends; provides for basic human food and fiber needs; is economically viable; and enhances the quality of life for farmers and society as a whole”. In reality, farmers should aim to abandon the criterion of maximum yield per hectare and improve the productivity of their operation through better management of productive factors [53,54].
Although some authors consider traditional and sustainable agriculture to be one and the same, this view is erroneous. Traditional agriculture is based on a type of knowledge that has been acquired over millennia and has been rigorously tried and tested in an empirical way, and cannot be substituted by the practices of current biological agriculture, with its highly simplistic model. It can be maintained that traditional management forms constitute a coherent ecosystem, whereas today’s sustainable agriculture does not fully follow the traditional model.
The practice of externally sustained agriculture causes profound transformations which in many cases lead to a loss of biodiversity on a massive scale. The decline in floristic diversity produces a loss of fauna, affects biological control mechanisms, and causes an explosion of insect plagues. The reasons for this decrease in diversity include inappropriate tilling techniques, loss of plant cover, lack of organic fertilizers, use of rollers (soil compaction) and indiscriminate use of herbicides, all of which ultimately results in increased erosion and soil loss [54]. It is therefore recommended to use agricultural practices that are non-aggressive with the environment such as traditional and sustainable cultivation, at least for marginal areas; for non-marginal areas with high production it is advisable to apply a cultivation that combines both techniques, i.e., planned cultivation with an ecological/botanical basis [55,56].
Non-aggressive cultivation is now possible thanks to advances in both bioclimatic and soil-related botanical research [57] which reveals the nutritional status of the soil and allows the appropriate doses of fertilizer to be used. This avoids the overuse of these substances, whose excess contaminates aquifers and implies financial losses for farmers [58].
2. Materials and Methods
The bioclimatology of southern Spain is studied here (Mediterranean Basin), focusing on areas that are predominantly dedicated to olive groves. This is done using the bioclimatic studies of several authors [25,27,30,51,59,60,61], and the study on vegetation cover by Cano-Ortiz [57]. With this research and with previous research conducted by [62], we obtain the bioclimatic indices and maps. Considering the productive and non-productive areas of olive groves in Spain, we propose a sustainable development model that ensures productivity in spite of climate change, based on the knowledge of the physical, bioclimatic and biogeographic factors and vegetation series [23].
For this, we use climatic data from 45 meteorological stations, with special attention to the Jodar, Aracena, Tabernas and Torredonjimeno stations. Bioclimatic diagrams are developed for these stations, which serve to establish the different hydric periods: excess water, regulation, dry. In the regulation period, the plants use the water accumulated in the soil, and do not enter into hydric stress until the dry period. We apply current knowledge on bioclimatology, and we elaborate the different bioclimatic indices: ombrothermic index (Io), continentality index (Ic), thermicity and compensated thermicity index (It/Itc) and Iosc2 and Iosc3 summer indices. Using the values of these indices in the different meteorological stations, and data on olive grove production in these same places, the optimal production areas for these crops are obtained [63,64], and we analyze herbaceous plant covers as CO2 sinks.
3. Results and Discussion
3.1. Bioclimatic Analysis of Specific Territories
We analyze the bioclimatic studies in specific cases in various locations with olive cultivation (Table 1) as an essential prior step for territorial classification. The analysis involves formulating various bioclimatic indices and combining them with biological indices to create the bioclimatic maps and diagrams that are needed to generate the management model. The method consists of preparing tables with bioclimatic indices and the respective bioclimatic maps of thermo- and ombrotypes, which we then apply to determine the optimum crops in each of these locations. The aim of this method is to minimize the economic and environmental costs of production, and, when applied to certain crops such as olive groves and vineyards in the Mediterranean Basin, to suggest promising approaches for sustainable development [64,65,66] (Figure 1, Figure 2 and Figure 3).

Table 1.
Values of bioclimatic indices for the southern Iberian Peninsula (Andalusia). P. Mean annual precipitation. Io. Ombrothermic index. Ic. Continentality index (mean thermal interval). It/Itc. Thermicity index/compensated thermicity index. Alt. Altitude. Iosc2, Iosc3. Summer ombrothermic indices.
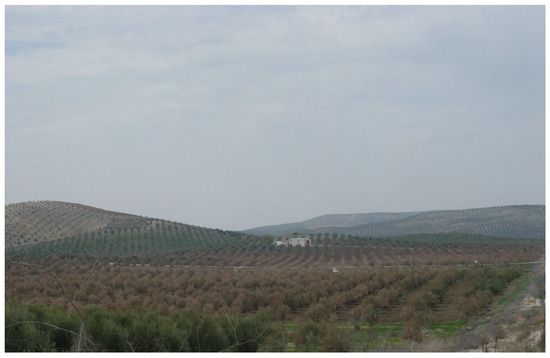
Figure 1.
Consequences of an agricultural planning that does not take into account bioclimatology. Olive grove damaged by frost in 2005 due to being located in an enclosed valley affected by temperature inversion.
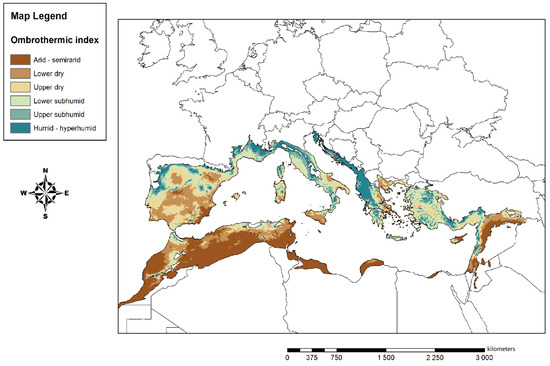
Figure 2.
Map of ombrotypes in the Mediterranean Basin. The optimum ombrotype for olive cultivation is the dry-subhumid. Geographic Coordinates Mediterranean Basin: 38° N 17° E.
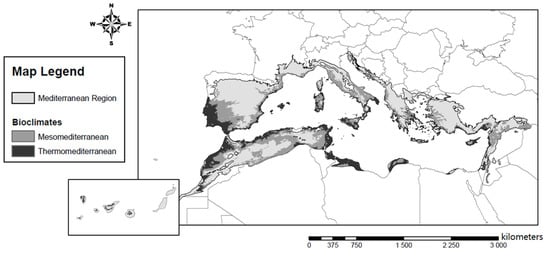
Figure 3.
Map of thermotypes in the Mediterranean Basin. The optimum thermotype for olive cultivation is the thermo- and meso-Mediterranean. Geographic Coordinates Mediterranean Basin: 38° N 17° E.
3.2. Bioclimatic Analysis of the Southern Iberian Peninsula
The bioclimatic analysis is conducted using the meteorological stations in the southern Iberian Peninsula, obtaining for each one the values of T (temperature), P (precipitation), Io (ombrothermic index), Ic (continentality index), It/Itc (thermicity index and compensated thermicity), Iosc2 (summer ombrothermic index of July and August), Iosc3 (summer ombrothermic index of June, July and August) and PVA (Period of Vegetative Activity). The analysis of the climatic and bioclimatic parameters reveals the following: (1) Most of the territory sampled has a PVA of 12 months. There is therefore no stop due to cold. (According to Montero [67], a stop due to cold is understood as a condition where the mean monthly temperature falls below 7.5 °C.) This coincides exactly with the territories more to the south and southwest of the province of Jaén (Southern Spain), an area dominated by olive cultivation with a mainly Thermo-Mediterranean thermotype and a dry ombrotype. In contrast, places with a PVA of 8–9 are dominant in the northwest of the province of Jaén and Granada, with the particularity that both territories have an upper meso-Mediterranean thermotype. However, the high value of the ombroclimatic index—over 4—is explained by the screening effects of the Segura, Las Villas and Cazorla mountain ranges (Table 1) (Figure 1) against cyclones.
Several factors have conditioned the cultivation of different varieties of olive in each area, and yet these varieties are not always at their ecological optimum from the bioclimatic point of view. Although the influence of bioclimatology on olive yields has been noted in previous studies [62], the bioclimatic characterization of the different varieties has subsequently been undertaken by our research team. Another objective of this work is to relate the distribution of the olive varieties with the different bioclimatic indices and to characterize each variety by its bioclimatic requirements in order to provide new criteria for the agricultural planning of crops [68,69]. It is therefore necessary to conduct biogeographical and soil studies of potential growing sites and use this information to propose a model for agricultural management [23].
Environmental factors→Bioclimatology and biogeography→Vegetation series→Crop type
A correct territorial classification can be achieved by applying this model to rain fed crops. In previous works we established a close correlation between kg/hectare yield for olive groves and the values of bioclimatic indices. This allowed us to establish that the locations of maximum yield for the Picual variety belong to the upper thermo-Mediterranean thermotype and the upper dry ombrotype, and to the lower meso-Mediterranean thermotype. We subsequently extended these studies to other olive varieties, namely “Hojiblanca”, “Lechín”, “Morisca”, “Manzanilla”, “Gordal” and “Verdiales” for Spain [62,69].
3.3. Bioclimate—Plant Cover: Mitigating the Damage Caused by Climate Change
In the last 50 years a new type of agriculture has become prevalent, and is now widely accepted both economically and socially. This has resulted in the uncontrolled use of pesticides, herbicides and phytosanitary products, causing substantial environmental damage, with the resulting harm for the population [54,70].
A crop is unproductive when the cost of production is equal to or higher than the income received by the grower. This expense includes the entire array of activities necessary for production plus the environmental cost, which in most cases is impossible to quantify. Crops are considered unproductive when their cost is higher than the income they generate, and crops that are apparently productive with modern technology should also be seen as unproductive if the environmental cost is excessively high. An excessive cost should be considered as any situation in which the crop leads to the irreversible loss of a certain resource (although cases of contamination can be permitted in which the system is able to self-regenerate), thereby refuting the expression “the polluter pays”, as resources may be lost for which it is impossible to set a price because they have such a high ecological and natural worth. Cultivation is therefore not valid if it leads to irreversible losses of soil and biodiversity or the contamination of water and land. It is essential to consider these last two issues when establishing a crop. All situations corresponding to any of these cases must undergo technical agrarian reform, and be subject to agricultural planning to ensure that the crop is maintained while respecting the principles outlined above, as well as being productive and even benefiting from potential increases in yields. These yields can also be of high quality, as quantity and quality are not incompatible. This implies taking into consideration the bioclimatic aspects of the territory [45,71].
Agricultural planning must be done based on respect for the environment and the optimization of the crop in question, as all crops have an ecological and bioclimatic optimum. In this situation any potential impact on the environment would be decreased. All this would involve the creation of specific agricultural and non-standard models which would lead us in some cases to maintain certain crops or to replace them with other alternative crops that are more productive and less contaminating.
The severity of the damage to a crop due to climate change depends on whether it is in its bioclimatic optimum. The soil water reserve must be optimized by determining the relationship between the water availability for the plant in the soil, potential evapotranspiration (ETP) and residual evapotranspiration (e) by means of a bioclimatic diagram.
The application of bioclimatic diagrams to such diverse localities as Aracena, Jodar, Montiel, Tabernas and Torredonjimeno reveals significant differences in terms of the date on which the crop begins to undergo water stress. This may be mitigated if the relation between the summer ombrothermic indices Iosc3/Iosc2 >1 [72], meaning that there is compensation thanks to the June rains. The crop is productive when Io >2.5 (Table 2).
Table 2.
Values of indices for the comparative analysis between meteorological stations: It/Itc = thermicity index and compensated thermicity; Io = ombrothermic index; Ic = continentality index; Iosc2, Iosc3 = summer ombrothermic index.
The use of cultivation techniques that prolong the time the water reserves remain in the soil can also mitigate the effects of drought. This can only be done if we know the date on which the crop begins to undergo stress, as the period of vegetative activity is identified when the availability D > than the potential evapotranspiration ETP. The regulation period occurs when D < ETP, and the dry period if the residual evapotranspiration is e > D (Figure 4).
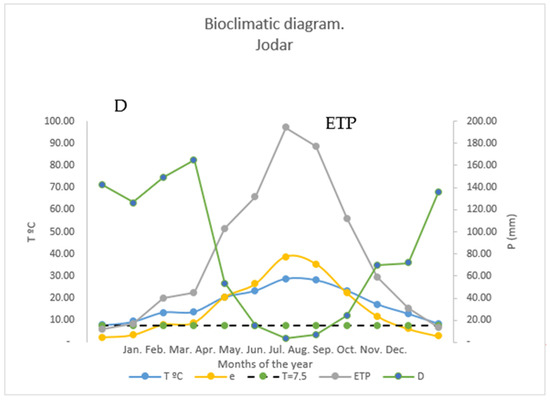
Figure 4.
Bioclimatic diagram for Jodar: P = precipitation. ETP = potential evapotranspiration. D = water availability. R = soil water reserve. e = residual evapotranspiration.
The bioclimatic diagram for the station of Jodar with a meso-Mediterranean bioclimate and a dry-semi-arid ombrotype shows how the water availability D for an agricultural plantation or a forest formation begins to undergo water stress in May, when the residual evapotranspiration becomes greater than the water availability D, and there is a long period of drought and a short regulation period. This date can be determined by applying the bioclimatic diagram of Montero Burgos and González Rebollar [67], somewhat modified by using only water-related parameters: P = precipitation, ETP = potential evapotranspiration, D = water availability, R = soil water reserve, e = residual evapotranspiration.
In the case of Aracena, with an upper meso-Mediterranean upper subhumid bioclimate, the water availability D becomes less than the evapotranspiration in the first days of August, although the availability D is less than the ETP from the end of May, implying a long regulation period and a dry period lasting barely one month; this is because there is strong compensation thanks to rains in June, Iosc3/Iosc2 = 2.79 (Figure 5).
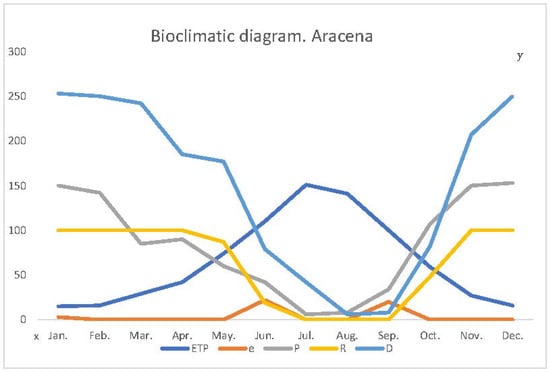
Figure 5.
Bioclimatic diagram for Aracena: P = precipitation, ETP = potential evapotranspiration, D = water availability, R = soil water reserve, e = residual evapotranspiration (mm. water); Y: mm. Water; X: Month.
In the case of Tabernas, with an upper thermo-Mediterranean lower semi-arid climate, the water availability D < ETP in February. The reserve values R and water availability D for the crop are very low—even zero—as a result of scarce precipitation, and there may be a regulation period in the case of an olive-type crop (Figure 6) (Table 3).
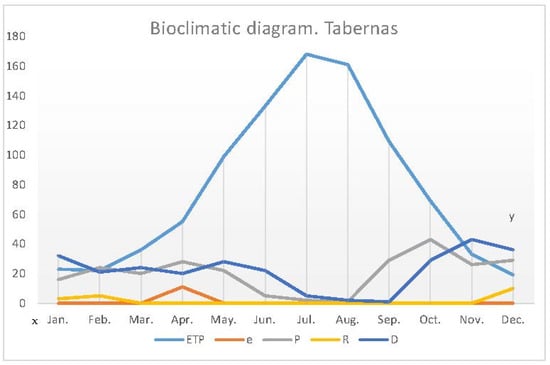
Figure 6.
Bioclimatic diagram for Tabernas: P = precipitation, ETP = potential evapotranspiration, D = water availability, R = soil water reserve, e = residual evapotranspiration (mm. water); Y: mm. Water; X: Month year.
Table 3.
Parameters for Tabernas: potential evapotranspiration (ETP), residual evapotranspiration (e), precipitation (P), soil water reserve (R), water availability for plants (D).
In the case of Torredonjimeno with a lower meso-Mediterranean upper dry bioclimate, D < ETP from mid-May and never falls below the residual evapotranspiration, meaning that there is no real dry period (Figure 7).
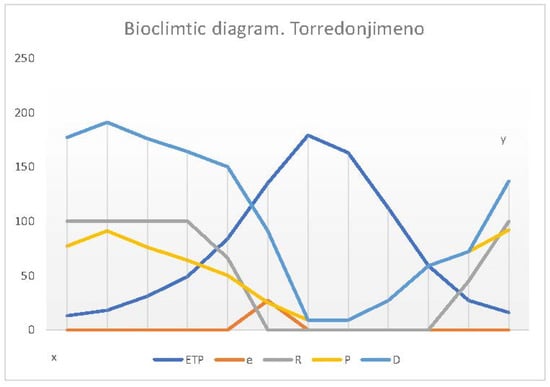
Figure 7.
Bioclimatic diagram for Torredonjimeno: P = precipitation, ETP = potential evapotranspiration, D = water availability, R = soil water reserve, e = residual evapotranspiration (mm. water).
In this analysis it can be seen that the regulation period and the dry period differ from one locality to another, with four months of drought in Aracena and eight to ten months in Tabernas, whereas Torredonjimeno has no drought period at all.
The strategy involves increasing the regulation period, the phase between D < ETP and e > D; this period can be extended with organic soil amendments and the use of vegetation cover.
This work is based on the knowledge of the climate and bioclimate and the flora and soil bioindicators, and starts with a thorough study of these bioindicators and their comparison with numerous soil analyses carried out in the same location. This allows us to implement effective treatments that offer an indispensable resource for managing vegetation cover in order to maximize its benefits and generate its use by identifying these bioindicators and understanding what they reveal.
For all these reasons we have studied the occurring plant associations from the phytosociological point of view, due to its efficacy and value [26,73,74], but also prioritizing soil factors and observing their correlations with the floristic-phytosociological component [75]. We take into account the prevailing climate factors in the study areas, which are highly influential in determining the presence of these associations.
Plant communities in cultivated areas may be of two types: first, heathland or thicket which acts as a biodiversity center and an element for controlling erosion, as it reduces soil loss when it forms part of verges or boundaries; and herbaceous grasslands, whose function is also to decrease erosion, although they may be of very different types depending on the soil and climate characteristics. However, it can be said that all the communities act as vegetation cover and intervene in the control of erosion [75]. The use of herbaceous plant cover in preference to thicket is advisable, as herbaceous plants do not compete with crops for water and nutrients, or only minimally so (Figure 8).
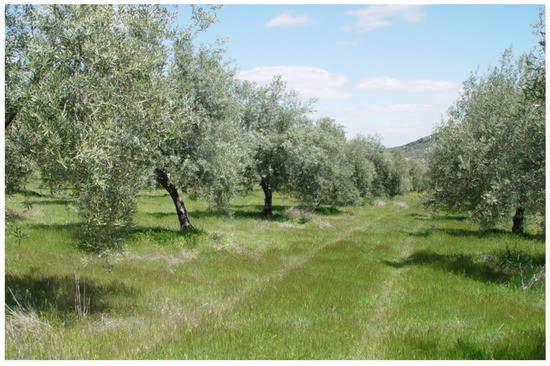
Figure 8.
Sustainable agriculture, olive cultivation with leguminous and Poaceae species.
Living vegetation cover can therefore be described as beneficial, although the use of plant cover is not new as it was used by the Romans in their vineyards and has been studied and applied since the early 20th century.
Herbaceous and woody plant cover has been shown to act as a CO2 sink; consequently, in addition to preventing erosion, it mitigates climate change [41,42,76]. According to the Spanish Federation of Municipalities and Provinces [77] and NEIKER-Tecnalia [78], agricultural croplands and forests incorporate CO2 into the soil and act as carbon sinks. This points to the importance of land use in mitigating climate change; it is estimated that agricultural croplands incorporate up to 1.98 T/ha per year [79]. The presence of herbaceous species among the rows of fruit trees, grapevines and olive trees (vegetation cover) is a generalized practice in integrated production and would produce an additional increase in carbon uptake that would be equal to or greater than that induced by permanent pasture (around 0.4 t/ha per year), according to the report issued by the National Institute for Agrarian Reform (INRA). This is recommended provided the water resource is not very deficient, as it minimizes the use of herbicides, protects the soil against erosion and compaction and has positive effects on biodiversity. It is estimated that the establishment of certain herbaceous crops such as the cardoon (Cynara cardunculus L.) accounts for a net carbon sequestration of 3.2–3.7 t/ha per year, assuming that this biomass offsets up to 65–75% of the CO2 emissions produced by the use of fossil fuel [39]. Mota et al. studied the absorption of CO2 by barley, oats and wheat in the region of Murcia using a density of 100 plants per m2 for the specific case of Hordeum, and obtained values of incorporation of carbon of 325 g C/m2 per year [80], a density equal to low cover. Our sampling plots covered that range between 25% and 100%, with a mean height of the dominant species of 0.35 m for the Hordeum plots. We obtained 1000 individuals per m2 in the sampled plots, which represents the incorporation of 3250 gr/m2 of carbon per year, with a cover of 100% and a mean height of 0.35 m. The calculation of the biovolume (Bv) [81] (Figure 9) for the different percentages of cover is as follows:
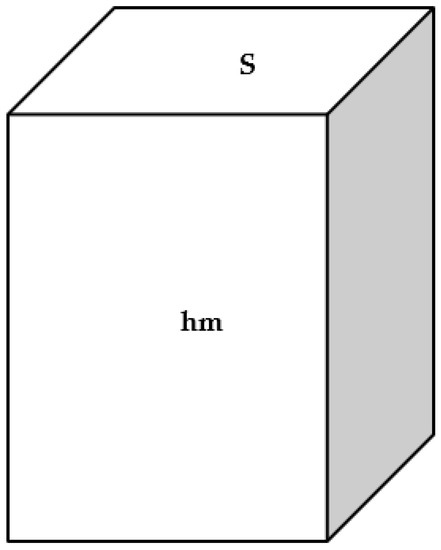
Figure 9.
Bv = S × hm × Cm: Bv = biovolume, S = surface, Cm = medium herbaceous cover, hm = average height of the dominant species.
To calculate the Biovolume, a pyramid or cube is used, whose base must be the sampling surface in m2 (S); Cm is the soil covered by vegetation, and hm is the average height of the dominant species.
Bv100 = 0.35; Bv75 = 0.26; Bv50 = 017; Bv25 = 0.08
The correspondence of each biovolume with the amount of carbon incorporated is the following:
Bv100 = 0.35 = 3250 gr C/m2; Bv75 = 0.26 = 2414.2 gr C/m2; Bv50 = 017 = 1578.5 gr C/m2; Bv25 = 0.08 = 812.5 gr C/m2
This represents 32.5 tons/hectare per year for 100% cover.
Cultivation and erosion are two very closely related terms, as the erosion of the plot is determined to a greater or lesser degree by the cultivation technique applied. Tilling is a traditional but aggressive technique that can lead to losses of 20–40 tons per hectare per year, compared to 2.5 tons per hectare per year in plots with interspersed strips of vegetation. This erosion is aggravated by the current climate irregularities. Tilling has customarily been practiced in order to increase the availability of water for cultivation and control weeds, and requires ploughing the plot several times. This strategy is now totally counterproductive as it does not increase water availability but quite the reverse; in a tilled olive grove the capacity of water to infiltrate in the soil is reduced, leading to the occurrence of a “tillage pan” caused by repeated transit (compacting) by heavy machinery. Tilling produces disaggregation, loss of structure, and loss of gasses and organic matter. It has been demonstrated that a crop tilled for ten years has a 30% loss of organic matter, which requires having to add high doses of fertilizers to achieve acceptable yields (Figure 10). However, proper use of organic manure can help improve soil physico-chemical properties and microbial biomass in an arid climate [82,83].
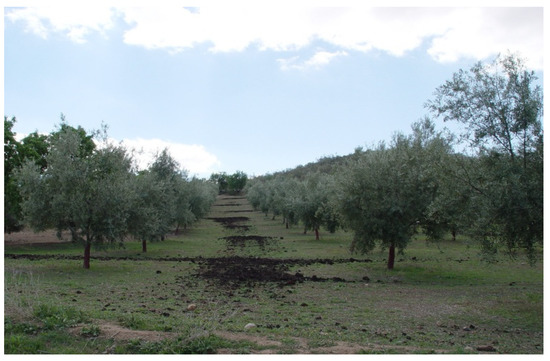
Figure 10.
Ecological fertilisation with fertilisers in the form of crop residues and manure.
The chemical control of weeds has resulted in a situation where the floristic composition in the phytocoenoses of herbaceous plants has been modified and where the elimination of certain species has led to the spread of other much more invasive species [80,84,85]. This is often due to a lack of knowledge about the use of herbicides [86,87,88], as chemical compounds are applied that are not appropriate for a particular species. We should be careful not to assume that all the flora present in olive groves is harmful and our enemy. Evidently this cannot be framed as a battle between what we call "weeds" and humans; it is therefore advisable to ensure a greater understanding of these weeds and their botanical-ecological behavior in order to establish control mechanisms.
4. Conclusions
The main aim of this work is to highlight the importance of bioclimatology in the management of territory. Both the bioclimatic and agronomic studies of cultivation techniques have proven to be indispensable for a sustainable development that mitigates climate change. The study shows that there is an incorporation of carbon into the soil that may approximate 32.5 tons/hectare per year for 100% cover.
Now is the time for all countries to act in a coordinated way to generate economic models that maintain the quantity and quality of yields without continuing to degrade the natural environment. Our studies in a variety of territories demonstrate that it is possible to obtain models of agrarian and forestry production that reverse climate change. These models allow production to be optimized with the minimum environmental cost. Moreover, the model allows for crop changes in the face of new climate scenarios.
In certain areas on Earth such as Andalusia, the effects of climate change on agriculture are becoming catastrophic, as temperatures and rainfall irregularities impact crops and produce lower yields; this situation is exacerbated in the case of intensive cultivation with inappropriate agricultural techniques. The placement of crops based on bioclimatic criteria and the use of autochthonous vegetation covers are two important techniques for mitigating climate change. It is therefore essential to organize agriculture according to the bioclimatic profile of the territory. It is also important to use vegetation covers that allay acute rises in temperature and reduce evapotranspiration, both of which can be achieved through sustainable development approaches.
Our results show that there are positive and negative temperature trends in Andalusia, and it is precisely the upward trends that dominate in the Guadalquivir valley, a predominantly agricultural area with a prevalence of olive groves. This implies rising temperatures, a situation which, coupled with high losses in vegetation cover, exacerbates water loss and ultimately leads to lower yields.
Author Contributions
Conceptualization, A.C.-O., C.J.P.G., F.L.G. and E.C.; Data curation, A.C.-O., C.M.M., R.J.Q.C., J.C.P.F., S.d.R.G., J.M.H.I., G.S., C.J.P.G. and E.C.; Formal analysis, E.C.; Investigation, A.C.-O. and E.C.; Methodology, A.C.-O., C.M.M. and E.C.; Project administration, E.C.; Resources, E.C.; Supervision, A.C.-O., C.M.M. and E.C.; Validation, A.C.-O., C.M.M., J.C.P.F., S.d.R.G., C.J.P.G., M.R. and E.C.; Software, J.C.P.F. and S.d.R.G.; Visualization, A.C.-O., C.M.M., R.J.Q.C., C.I.R.M. and E.C.; Writing—original draft, A.C.-O. and E.C.; Writing—review and editing, A.C.-O., C.M.M., R.J.Q.C., J.C.P.F., S.d.R.G., C.J.P.G. and E.C. All authors have read and agreed to the published version of the manuscript.
Funding
This research received no external funding.
Institutional Review Board Statement
Not applicable.
Informed Consent Statement
Not applicable.
Conflicts of Interest
The authors declare no conflict of interest.
References
- Piñar Fuentes, J.C.; Leiva, F.; Cano-Ortiz, A.; Musarella, C.M.; Quinto Canas, R.; Pinto Gomes, C.; Cano, E. Impact of the Management of Grass Cover During with Herbicides in the Biodiversity, Cover and Humidity of the Soil in the Olive Groves of the South of the Iberian Peninsula During the Period 2006–2016. Agronomy 2021, 11, 412. [Google Scholar] [CrossRef]
- Ighbareyeh, J.M.H.; Cano-Ortiz, A.; Cano, E. Biological and bioclimatic basis to optimize plant production: Increased economic areas of Palestine. Agric. Sci. Res. J. 2014, 4, 10–20. [Google Scholar]
- Ighbareyeh, J.M.H.; Cano Ortiz, A.; Cano, E. Analysis of the physical factors of Palestinian bioclimate. Am. J. Chim. Change 2014, 3, 223–231. [Google Scholar] [CrossRef][Green Version]
- Ighbareyeh, J.M.H.; Cano Ortiz, A.; Cano, E.; Ighbareyeh, M.M.H.; Suliemieh, A.A.A. Assessing Crop Yield sustainability under the Climatic and Bioclimatic Change in the Area of Palestine. Am. J. Clim. Change 2015, 4, 48–56. [Google Scholar] [CrossRef][Green Version]
- Ighbareyeh, J.M.H.; Ighbareyeh, M.M.H.; Suliemieh, A.A.A.; Abdel-Qader, D.; Cano, E.; Cano Ortiz, A. Peach (Prunus persica L. Batsch) production and environmental conditions in Jenin, Palestine. Net J. Agric. Sci. 2019, 7, 78–84. [Google Scholar] [CrossRef]
- Ighbareyeh, J.M.H.; Suliemieh, A.A.-R.A.; Sheqwarah, M.; Cano-Ortiz, A.; Carmona, E.C. Flora and Phytosociological of Plant in Al-Dawaimah of Palestine. Res. J. Ecol. Environ. Sci. 2022, 2, 58–91. [Google Scholar] [CrossRef]
- Quinto Canas, R.; Cano-Ortiz, A.; Musarella, C.M.; del Río, S.; Raposo, M.; Fuentes, J.C.P.; Gomes, C.P. Quercus rotundifolia Lam. Woodlands of the Southwestern Iberian Peninsula. Land 2021, 10, 268. [Google Scholar] [CrossRef]
- Canas, R.Q.; Cano-Ortiz, A.; Spampinato, G.; del Río, S.; Raposo, M.; Fuentes, J.C.P.; Gomes, C.P. Contribution to the Knowledge of Rocky Plant Communities of the Southwest Iberian Peninsula. Plants 2021, 10, 1590. [Google Scholar] [CrossRef]
- Cano-Ortiz, A.; Musarella, C.M.; Piñar Fuentes, J.C.; Quinto Canas, R.; Pinto Gomes, C.J.; Spampinato, G.; Ighbareyeh, J.M.H.; del Río, S.; Cano, E. Forest and Arborescent Scrub Habitats of Special Interest for SCIs in Central Spain. Land 2021, 10, 183. [Google Scholar] [CrossRef]
- Cano, E.; Piñar, F.J.C.; Cano-Ortiz, A.; Leiva, G.F.; Ighbareyeh, J.M.H.; Quinto Canas, R.J.; Pinto Gomes, C.J.; Spampinato, G.; Del Río González, S.; Musarella, C.M. Chapter 17-Bioclimatology and botanical resources for sustainable development. In Natural Resources Conservation and Advances for Sustainability; Jhariya, M.K., Meena, R.S., Banerjee, A., Meena, S.N., Eds.; Elsevier: Amsterdam, The Netherlands, 2022; pp. 377–388. ISBN 978-0-12-822976-7. [Google Scholar] [CrossRef]
- Piñar Fuentes, J.C.; Cano-Ortiz, A.; Musarella, C.M.; Quinto Canas, R.; Pinto Gomes, C.J.; Spampinato, G.; del Río, S.; Cano, E. Bioclimatology, Structure, and Conservation Perspectives of Quercus pyrenaica, Acer opalus subsp. Granatensis, and Corylus avellana Deciduous Forests on Mediterranean Bioclimate in the South-Central Part of the Iberian Peninsula. Sustainability 2019, 11, 6500. [Google Scholar] [CrossRef]
- Quinto Canas, R.; Mendes, P.; Cano-Ortiz, A.; Musarella, C.; Pinto-Gomes, C. Forest fringe communities of the southwestern Iberian Peninsula. Rev. Chapingo Serte Cienc. For. Ambiente 2018, 24, 415–434. [Google Scholar] [CrossRef]
- Quinto-Canas, R.; Mendes, P.; Meireles, C.; Musarella, C.; Pinto-Gomes, C. The Agrostion castellanae Rivas Goday 1957 Corr. Rivas Goday & Rivas-Martínez 1963 Alliance in the Southwestern Iberian Peninsula. Plant Sociol. 2018, 55, 21–29. [Google Scholar] [CrossRef]
- Piñar Fuentes, J.C.; Raposo, M.; Pinto Gomes, C.J.; del Río González, S.; Spampinato, G.; Cano, E. New Contributions to the Ericion umbellatae Alliance in the Central Iberian Peninsula. Sustainability 2021, 13, 5639. [Google Scholar] [CrossRef]
- Cano-Ortiz, A.; Musarella, C.; Fuentes, C.; Pinto-Gomes, C.; Río, S.; Cano, E. Diversity and conservation status of mangrove communities in two areas of Mesocaribea biogeographic region. Curr. Sci. 2018, 115, 534–540. [Google Scholar] [CrossRef]
- Cano-Ortiz, A.; Musarella, C.M.; Piñar, J.C.; Spampinato, G.; Veloz, A.; Cano, E. Vegetation of the dry bioclimatic areas in the Dominican Republic. Plant Biosyst. 2015, 149, 451–472. [Google Scholar] [CrossRef]
- Cano Ortiz, A.; Musarella, C.M.; Piñar Fuentes, J.C.; Pinto Gomes, C.J.; Cano, E. Distribution patterns of endemic flora to define hotspots on Hispaniola. Syst. Biodivers. 2016, 14, 261–275. [Google Scholar] [CrossRef]
- Cano Ortiz, A.; Quinto, C.R.; Pinar, F.J.C.; del Rio, S.; Pinto, G.C.J.; Cano, E. Endemic Hemicryptophyte Grasslands of the High Mountains of the Caribbean. Res. J. Ecol. Environ. Sci. 2022, 2, 1–20. [Google Scholar] [CrossRef]
- Kegler, A.; Diesel, S.; Wasum, R.A.; Herrero, L.; Del Río, S.; Penas, Á. Contribution to the phytosociological survey of the primary forests in the NE of Rio Grande do Sul (Brazil). Plant Biosyst. 2010, 144, 53–84. [Google Scholar] [CrossRef]
- Cano Ortiz, A.; Musarella, C.M.; Pinto Gomes, C.J.; Quinto Canas, R.; Piñar Fuentes, J.C.; Cano, E. Phytosociological Study, Diversity and Conservation Status of the Cloud Forest in the Dominican Republic. Plants 2020, 9, 741. [Google Scholar] [CrossRef]
- Cano Ortiz, A.; Musarella, C.M.; Piñar Fuentes, J.C.; Pinto Gomes, C.J.; Quinto Canas, R.; Del Río, S.; Cano, E. Indicative value of the dominant plant species for a rapid evaluation of the nutritional of soils. Agronomy 2020, 11, 1. [Google Scholar] [CrossRef]
- Lv, J.; Xie, Y.; Luo, H. Erosion Process and Temporal Variations in the Soil Surface Roughness of Spoil Heaps under Mul-ti-Day Rainfall Simulation. Remote Sens. 2020, 12, 2192. [Google Scholar] [CrossRef]
- Burrascano, S.; Sabatini, F.M.; Blasi, C. Testing indicators of sustainable forest management on understorey composition and diversity in southern Italy through variation partitioning. Plant Ecol. 2011, 212, 829–841. [Google Scholar] [CrossRef]
- Cano, E.; Ruiz, L.; Cano-Ortiz, A.; Nieto, J. Bases Para el Establecimiento de Modelos de Gestión Agrícola y Forestal in Memorian Al prof; Isidoro, R.M., Ed.; Servicio Publicaciones Universidad de Jaén: Jaén, Spain, 2002; pp. 131–142. [Google Scholar]
- Cano, E.; Cano-Ortiz, A.; Musarella, C.M.; Piñar Fuentes, J.C.; Ighbareyeh, J.M.H.; Leiva, G.F.; Del Río, S. Mitigating climate change through bioclimatic applications and cultivation techniques in agriculture (Andalusia, Spain). In Sustainable Agriculture, Forest and Environmental Management; Jhariya, M.K., Banerjee, A., Meena, R.S., Yadav, D.K., Eds.; Springer Nature Singapore Pte Ltd: Singapore, 2019; pp. 31–69. [Google Scholar] [CrossRef]
- Rivas-Martínez, S. Clasificación Bioclimática de la Tierra. Folia Botánica Matritensis 1996, 16, 1–32. [Google Scholar]
- Blasi, C.; Biondi, E.; Izco, J. 100 years of plant sociology: A celebration. Plant Biosyst. 2011, 145 (Suppl. 1), 1–3. [Google Scholar] [CrossRef]
- Rivas-Martínez, S.; Loidi Arregui, J. Bioclimatoloy of the Iberian Peninsula. Itinera Geobot. 1999, 13, 41–47. [Google Scholar]
- Pesaresi, S.; Biondi, E.; Casavecchia, S. Bioclimates of Italy. J. Maps 2017, 13, 955–960. [Google Scholar] [CrossRef]
- Pesaresi, S.; Galdenzi, D.; Biondi, E.; Casavecchia, S. Bioclimate of Italy: Application of the worldwide bioclimatic classification system. J. Maps 2014, 10, 538–553. [Google Scholar] [CrossRef]
- Rivas-Martínez, S.; Penas, Á.; Díaz González, T.E.; Ladero Álvarez, M.; Asensi Marfil, A.; Díez Garretas, B.; Molero Mesa, J.; Valle Tendero, F.; Cano, E.; Costa Talens, M.; et al. Mapa de series, geoseries y geopermaseries de vegetación de España. Parte II. Itinera Geobot. 2011, 18, 425–800. [Google Scholar]
- IPCC. Climate Change. Synthesis Report. In A Contribution of Working Groups I, II, and III to the Third Assessment Report of the Intergovernmental Panel on Climate Change; Watson, R.T., the Core Writing Team, Eds.; Cambridge University Press: Cambridge, UK; New York, NY, USA, 2001; p. 398. [Google Scholar]
- IPCC. Climate change. The physical science basis. In Contribution of Working Group I to the Fourth Assessment Report of the Intergovernmental Panel on Climate Change; Solomon, S., Qin, D., Manning, M., Chen, Z., Marquis, M., Averyt, K.B., Tignor, M., Miller, H.L., Eds.; Cambridge University Press: Cambridge, UK; New York, NY, USA, 2007; pp. 1–135. [Google Scholar]
- IPCC. Climate Change 2021: The Physical Science Basis. Contribution of Working Group I to the Sixth Assessment Report of the Intergovernmental Panel on Climate Change; Masson-Delmotte, V., Zhai, P., Pirani, A., Connors, S.L., Péan, C., Berger, S., Caud, N., Chen, Y., Goldfarb, L., Gomis, M.I., et al., Eds.; Cambridge University Press: Cambridge, UK; New York, NY, USA, 2021; In press. [Google Scholar] [CrossRef]
- Del Río, S.; Cano-Ortiz, A.; Herrero, L.; Penas, A. Recent trends in mean maximum and minimum air temperaturas over Spain (1961–2006). Theor. Appl. Climatol. 2012, 149, 605–626. [Google Scholar] [CrossRef]
- Del Río, S.; Anjum, L.M.; Cano-Ortiz, A.; Herrero, L.; Hassan, A.; Penas, A. Recent mean temperature trends in Pakistan and links with teleconnection patternes. Int. J. Climatol. 2013, 33, 277–290. [Google Scholar] [CrossRef]
- Del Río, S.; Canas, R.; Cano, E.; Cano-Ortiz, A.; Musarella, C.M.; Pinto Gomes, C.; Penas, A. Modelling the impacts of climte change on hábitat suitabilityy and vulnerability in deciduous forest in Spain. Ecol. Indic. 2021, 131, 108202. [Google Scholar] [CrossRef]
- Lovelli, S.; Perniola, M.; Scalcione, E.; Troccoli, A.; Ziska, L.H. Future climate change in the Mediterranean area: Implications for water use and weed management. Ital. J. Agron. 2012, 7, 44–49. [Google Scholar] [CrossRef]
- Macías, F. Sumideros de carbono para el forzamiento climático Antropoceno. Una visión de alternativas de actuación desde la ciencia del suelo. Edafología 2004, 11, 7–25. [Google Scholar]
- Mota, C.; Alcaraz-López, C.; Iglesias, M.; Martínez-Ballesta, M.C.; Carvajal, M. Investigación Sobre la Absorción de CO2 por los Cultivos Más Representativos de la Región de Murcia, Ed; CSIC: Madrid, Spain, 2011; pp. 1–41. [Google Scholar]
- Rosas, C.A. Sumideros de carbono. ¿Solución a la mitigación de los efectos del cambio climático? Ecosistemas 2018, 11, 1–6. [Google Scholar]
- Spampinato, G.; Massimo, D.E.; Musarella, C.M.; De Paola, P.; Malerba, A.; Musolino, M. Carbon Sequestration by Cork Oak Forests and Raw Material to Built up Post Carbon City. In New Metropolitan Perspectives. ISHT 2018. Smart Innovation, Systems and Technologies; Calabrò, F., Della, S.L., Bevilacqua, C., Eds.; Springer: Cham, Switzerland, 2019; Volume 101. [Google Scholar] [CrossRef]
- Spampinato, G.; Malerba, A.; Calabrò, F.; Bernardo, C.; Musarella, C.M. Cork Oak Forest Spatial Valuation Toward Post Carbon City by CO2 Sequestration. In New Metropolitan Perspectives. NMP 2020. Smart Innovation, Systems and Technologies; Bevilacqua, C., Calabrò, F., Della, S.L., Eds.; Springer: Cham, Switzerland, 2021; Volume 178. [Google Scholar] [CrossRef]
- Marshall, J.; Brown, V.; Boatman, N.; Lutman, P.; Squire, G. The impact of herbicides on weed abundance and biodiversity PN0940. A Report for the UK Pesticides Safety Directorate. IACR Long Ashton. Res. Stn. 2001, 1, 1–147. [Google Scholar]
- Marshall, E.J.P. Biodiversity, herbicides and non-target plants. Brighton. Crop. Prot. Conf. Weeds. 2001, 2, 855–862. [Google Scholar]
- Cano, E. Una Agricultura Respetuosa con el Medio Ambiente y Productiva es Posible: La Bioclimatología como Herramienta Viabilizadora. Foro 2021, 5, 17–23. Available online: https://www.revistaforo.com/2021/0502-03 (accessed on 15 May 2021).
- Kumar, A.; Sharma, P.; Joshe, S. Assessing the Impacts of Climate Change on Land Productivity in Indian Crop Agriculture: An Evidence from Panel Data Analysis. J. Agric. Sci. Technol. 2016, 18, 1–13. [Google Scholar]
- Tang, Y.C.; Mao, S.F.; Ma, X.Q.; Qiu, M.M.; Ma, K.; Zhu, M.X.; Wang, Z.J. The Influence of Three Different Types of Herbicides on Biodiversity. Adv. Mater. Res. 2013, 838, 2417–2426. [Google Scholar]
- Vyas, M.D.; Jain, A.K. Effect of pre-and post-emergence herbicides on weed control and productivity of soybean (Glycine max). Indian J. Agron. 2003, 48, 309–311. [Google Scholar]
- Wang, S.; Fu, B.J.; Gao, G.Y.; Yao, X.L.; Zhou, J. Soil moisture and evapotranspiration of different land cover types in the Loess Plateau, China. Hydrol. Earth Syst. Sci. 2012, 16, 2883–2892. [Google Scholar] [CrossRef]
- Zhang, Y.K.; Schilling, K.E. Effects of land cover on water table, soil moisture, evapotranspiration, and groundwater re-charge: A field observation and analysis. J. Hydrol. 2006, 319, 328–338. [Google Scholar] [CrossRef]
- Chamizo, S.; Meijide, A.; Serrano-Ortiz, P.; Sánchez-Cañete, E.P.; López-Ballesteros, A.; Kowalski, A.S. The influence of weeds on evapotranspiration and water use efficiency in an irrigated Mediterranean olive orchard. EGU Gen. Assem. Conf. Abstr. Geophys. Res. Abstr. 2018, 20, EGU2018–EGU14431. [Google Scholar]
- Rivas-Martínez, S. Mapa de series, geoseries y geopermaseries de vegetación de España. Parte I. Itinera Geobot. 2007, 17, 5–436. [Google Scholar]
- Cano, E.; Cano Ortiz, A. Bioclimatología Aplicada a la Agronomía in Nuevas Tendencias en Olivicultura; Servicio Publublicaciones Universidad Jaén: Jaén, Spain, 2016; pp. 7–69. ISBN 978-84-8439-000-0. [Google Scholar]
- Cano Ortiz, A. Bioindicadores y Cubiertas Vegetales en el Olivar in Nuevas Tendencias en Olivicultura; Servicio Publicaciones Universidad Jaén: Jaén, Spain, 2016; pp. 70–117. ISBN 978-84-8439-000-0. [Google Scholar]
- Perrino, E.V.; Musarella, C.M.; Magazzini, P. Management of grazing Italian river buffalo to preserve habitats defined by Directive 92/43/EEC in a protected wetland area on the Mediterranean coast: Palude Frattarolo, Apulia, Italy. Euro-Mediterr. J. Environ. Integr. 2021, 6, 32. [Google Scholar] [CrossRef]
- Perrino, E.V.; Calabrese, G. Vascular flora of vineyards in the DOC area “Gioia del Colle” (Apulia, Southern Italy): Preliminary data. Nat. Croat. 2018, 27, 41–55. [Google Scholar] [CrossRef]
- Cano-Ortiz, A. Bioindicadores ecológicos y manejo de cubiertas vegetales como herramienta para la implantación de una agricultura sostenible. Ph.D. Thesis, Universidad de Jaén, Jaén, Spain, 2007. [Google Scholar]
- El-Hajj, A.; Halwani, B.; Halwani, J. Hydro-Geochemical Study of the Coastal Aquifer in Tripoli (Lebanon). Res. J. Ecol. Environ. Sci. 2022, 2, 103–117. [Google Scholar] [CrossRef]
- Rivas-Martínez, S.; Díaz, T.E.; Fernández-González, F.; Izco, J.; Loidi, J.; Lousa, M.; Penas, A. Vascular Plant Communities of Spain and Portugal (addenda to the syntaxonomical checklist of 2001, part I). Itinera Geobot. 2002, 15, 5–432. [Google Scholar]
- Rivas-Martínez, S.; Díaz, T.E.; Fernández-González, F.; Izco, J.; Loidi, J.; Lousa, M.; Penas, A. Vascular Plant Communities of Spain and Portugal (addenda to the syntaxonomical checklist of 2001, part II). Itinera Geobot. 2002, 15, 433–922. [Google Scholar]
- Rivas-Martínez, S.; Rivas-Saenz, S. Orldwide Bioclimatic Classification System. Phytosociological Research Center, Spain. (1996–2020). Available online: http://www.globalbioclimatics.org (accessed on 15 May 2022).
- Cano, E.; García Fuentes, A.; Torres, J.A.; Salazar, C.; Melendo, M.; Pinto Gomes, C.; Valle, F. Phytosociologie appliquée a la planification agricole. Colloq. Phytosociol. 1997, 27, 1007–1022. [Google Scholar]
- Cano Ortiz, A.; Ighbareyeh, J.; Cano, E. Bioclimatic Applications and Soil Indicators for Olive Cultivation (South of the Iberian Peninsula). Glob. Adv. Res. J. Agric. Sci. 2014, 3, 433–438. [Google Scholar]
- Cano, E.; Velóz Ramirez, A.; Cano-Ortiz, A.; Esteban, F.J. Distribution of Central American Malastomataceae: Biogeographical Analysis of the Caribbean Islands. Acta Bot. Gallica. 2009, 156, 527–557. [Google Scholar] [CrossRef][Green Version]
- Cano, E.; Cano-Ortiz, A.; Del Río, S.; Alatorre, J.; Velóz, A. Bioclimatic map of the. Dominican Republica. Plant Sociol. 2012, 49, 81–90. [Google Scholar] [CrossRef]
- Cano-Ortiz, A.; Piñar Fuentes, J.C.; Quinto Canas, R.; Pinto Gomes, C.J.; Cano, E. Analysis of the Relationship Between Bioclimatology and Sustainable Developement. In New Metropolitan Persperctives; Calabrò, B., Spina, D., Eds.; Springer Nature: Berlin/Heidelberg, Germany, 2020; Volume 178, pp. 1291–1301, NMP 2020, SIST. [Google Scholar]
- Burgos, J.L.; González, R.J.L. Diagramas Bioclimáticos; Ministerio de Agricultura Pesca y Alimentación: Madrid, Spain, 1983; pp. 1–382. [Google Scholar]
- Cano, E.; Ruiz, L.; Melendo, M.; Nieto, J.; Cano Ortiz, A. Bases bioclimáticas para la planificación del olivar en el centro-sur de la Península Ibérica (España, Portugal). In Actas IFOAN; Sociedad Española de Agricultura Ecológica. SEAE: Valencia, Spain, 2004; pp. 305–311. ISBN 84-609-7732-3. [Google Scholar]
- Cano, E.; Cano Ortiz, A. Bioclimatología y Bioindicadores del olivar: Bases fundamentales para un desarrollo sostenible. In Asociación Grupo de Estudios Avanzados-Grupo Textura; Andalucía, E.O., Ed.; Universidad de Sevilla: Sevila, Spain, 2011; pp. 83–97. ISBN 978-84-695-7405-8. Available online: https://investigacion.us.es/sisius/sis_showpub.php?idpers=4244 (accessed on 28 October 2022).
- Reyes Palomino, S.E.; Cano CCoa, D.M. Efectos de la agricultura intensiva y el cambio climático sobre la biodiversidad. Rev. De Investig. Altoandinas 2022, 24, 53–64. [Google Scholar] [CrossRef]
- Cisneros, O.; Modrego, P.; Rueda, J.; Ágreda, T.; Águeda, B.; Alonso, R.; Gordo, J.; Sombrero, A.; De Benito, A.; Tenorio, J.L.; et al. Evaluación de diferentes alternativas de forestación y agricultura como sumideros de carbono en Castilla y León. In 5º Congreso Forestal; S.E.C.F.-Junta de Castilla y León, Ed.; Sociedad Española de Ciencias Forestales: Avila, Spain, 2009; pp. 2–10. [Google Scholar]
- Cano, E.; García Fuentes, A.; Torres, J.A.; Pinto Gomes, C.J.; Cano Ortiz, A.; Montilla, R.J.; Muñoz, J.J.; Ruiz, L.; Rodríguez, A. Estudio de los quejigares de Sierra Morena oriental (Jaén). Lagascalia 2004, 24, 51–61. [Google Scholar]
- Blasi, C.; Di Pietro, R.; Fortini, P. A phytosociological analysis of abandoned terraced olive grove shrublands in the Tyrrhenian district of Central Italy. Plant Biosyst. 2000, 134, 305–331. [Google Scholar] [CrossRef]
- Rühl, J.; Pasta, S.; Schnittler, M. A chronosequence study of vegetation dynamics on abandoned vine and caper terraces of Pantelleria Island (Sicily). Arch. Nat. Conserv. Landsc. Res. 2006, 45, 71–94. [Google Scholar]
- Calabrese, G.; Perrino, E.V.; Ladisa, G.; Aly, A.; Tesfmichael Solomon, M.; Mazdaric, S.; Benedetti, A.; Ceglie, F.G. Short-term effects of different soil management practices on biodiversity and soil quality of Mediterranean ancient olive orchards. Org. Agric. 2015, 5, 209–223. [Google Scholar] [CrossRef]
- Patti, M.; Musarella, C.M.; Laface, V.L.A.; Cano-Ortiz, A.; Quinto-Canas, R.; Spampinato, G. The Use of Plants for Building Purposes in the Popular Tradition. In New Metropolitan Perspectives. NMP 2022. Lecture Notes in Networks and Systems; Calabrò, F., Della Spina, L., Piñeira Mantiñán, M.J., Eds.; Springer: Cham, Switzerland, 2022; Volume 482. [Google Scholar] [CrossRef]
- Federación Española de Municipios y Provincias. Los Sumideros de Carbono a Nivel Local. Edita; Federación Española de Municipios y provincias: Vigo, Spain, 2010; p. 162. [Google Scholar]
- NEIKER-Tecnalia. Sumideros de Carbono de la Comunidad Autónoma del País Vasco: Capacidad de Secuestro y Medidas Para su Promoción; Servicio Central de Publicaciones del Gobierno Vasco: Vitoria-Gasteiz, Spain, 2014; p. 212. [Google Scholar]
- Nagy, D.U.; Rauschert, E.S.; Henn, T.; Cianfaglione, K.; Stranczinger, S.; Pal, R.W. The more we do, the less we gain? Balancing effort and efficacy in managing the Solidago gigantea invasion. Weed Res. 2020, 60, 232–240. [Google Scholar] [CrossRef]
- Agencia Europea del Medio Ambiente. El Suelo y el Cambio Climático. 2015. Recuperado de. Available online: http://www.eea.europa.eu/es/senales/senales-2015/articu-los/el-suelo-y-el-cambio-climatico (accessed on 15 August 2022).
- García Fuentes, A.; Cano, E. Fitosociología aplicada al conocimiento de los herbazales: Nuevo método para el cálculo del valor forrajero. Ecol. Mediterránea 1993, 19, 19–28. [Google Scholar] [CrossRef]
- Bhanwaria, R.; Singh, B.; Musarella, C.M. Effect of Organic Manure and Moisture Regimes on Soil Physiochemical Properties, Microbial Biomass Cmic:Nmic:Pmic Turnover and Yield of Mustard Grains in Arid Climate. Plants 2022, 11, 722. [Google Scholar] [CrossRef]
- Panuccio, M.R.; Mallamaci, C.; Attinà, E.; Muscolo, A. Using Digestate as Fertilizer for a Sustainable Tomato Cultivation. Sustainability 2021, 13, 1574. [Google Scholar] [CrossRef]
- Švehláková, H.; Turčová, B.; Rajdus, T.; Plohák, P.; Nováková, J. Effective combination of management methods suppresses invasive Jerusalem artichoke. IOP Conf. Ser. Earth Environ. Sci. 2021, 900, 012045. [Google Scholar] [CrossRef]
- Zhang, Y.; Yang, X.; Zhu, Y.; Li, L.; Zhang, Y.; Li, J.; Qiang, S. Biological control of Solidago canadensis using a bioherbicide isolate of Sclerotium rolfsii SC64 increased the biodiversity in invaded habitats. Biol. Control. 2019, 139, 104093. [Google Scholar] [CrossRef]
- Powles, S.B.; Yu, Q. Evolution in Action: Plants Resistant to Herbicides. Annu. Rev. Plant Biol. 2010, 61, 317–347. [Google Scholar] [CrossRef]
- Hermosín, M.C.; Rodríguez-Linaza, L.C.; Cornejo, J.; Ordóñez-Fernández, R. Efecto de uso de agroquímicos en el olivar sobre la calidad de las aguas. Sostenibilidad Prod. Oliv. Andal. 2009, 127–160. [Google Scholar]
Publisher’s Note: MDPI stays neutral with regard to jurisdictional claims in published maps and institutional affiliations. |
© 2022 by the authors. Licensee MDPI, Basel, Switzerland. This article is an open access article distributed under the terms and conditions of the Creative Commons Attribution (CC BY) license (https://creativecommons.org/licenses/by/4.0/).